Abstract
The aryl hydrocarbon receptor (AHR) is a ligand-activated transcription factor. Triple negative breast cancer (TNBC) is the most aggressive breast cancer subtype. TNBC expresses AHR and AHR ligands have anti-cancer activity in TNBC. The aggressiveness of TNBC is due in part to JAG1-NOTCH1 signaling. ITE is a putative endogenous AHR ligand. We show that ITE reduces the expression of JAG1 the amount of Notch 1 intracellular domain (NICD1) and the phosphorylation of STAT3 (at tyrosine 705) in TNBC MDA-MB-231 cells. The STAT3 inhibitor STATTIC also reduced JAG1. STAT3, thus, mediates regulation of JAG1 in MDA-MB-231 cells. Reducing the expression of JAG1 with short interfering RNA decreases the growth, migration and invasiveness of MDA-MB-231 cells. JAG1, therefore, has cellular effects in MDA-MB-231 cells under basal conditions. We consequently evaluated if exposing cells to greater amounts of JAG1 would counteract ITE cellular effects in MDA-MB-231 cells. The results show that JAG1 does not counteract the cellular effects of ITE. JAG1, thus, has no effect on growth or invasiveness in MDA-MB-231 cells treated with ITE. JAG1, therefore, has context dependent roles in MDA-MB-231 cells (basal versus ITE treatment). The results also show that other pathways, not inhibition of the JAG1-NOTCH1 pathway, are important for mediating the growth and invasive inhibitory effect of ITE on MDA-MB-231 cells.
Keywords: Aryl hydrocarbon receptor (AHR), Jagged1 (JAG1), TCDD, ITE, Breast cancer
1. Introduction
Breast cancer is comprised of different subtypes that have distinct disease prognoses and treatment responses. Triple negative breast cancer (TNBC) is an aggressive breast cancer subtype that does not express estrogen, progesterone or HER-2 receptors [1–3]. Consequently, drugs that target estrogen and HER2 receptors have no effect on TNBC [1–3]. The lack of targeted therapy for TNBC in part explains why this cancer subtype has high rates of cancer relapse and poor clinical outcomes [1–3]. The JAG1-NOTCH1 pathway is an embryonic pathway that controls cell fate [4]. NOTCH signaling is activated via cell-to-cell interactions through binding of one of the four NOTCH receptors (NOTCH1, 2, 3, and 4) with one of five NOTCH ligands (JAG1 and JAG2 and Delta-like 1, 2 and 4) [4]. The JAG1-NOTCH pathway is over-expressed in TNBC [5–9]. Among breast cancer subtypes, JAG1-NOTCH signaling is significantly higher in TNBC than luminal hormone receptor positive breast cancer [5,8,9].
JAG1-NOTCH signaling supports several aspects of TNBC. JAG1 induces cyclin D1 transcription in TNBC cells via NOTCH signaling [5]. Cyclin D1 is a cell cycle regulator that stimulates TNBC cell proliferation [5]. JAG1 via NOTCH also induces TNBC cell invasiveness by stimulating the transcription of Urokinase-Type Plasminogen Activator (uPA) [10]. NOTCH signaling also plays an important role for the selfrenewal of normal and cancer stem cells in breast [9,11–17]. In clinical studies, high expression of JAG1 and NOTCH in breast tumors is associated with poor breast cancer outcomes [6,18,19]. Thus, JAG1 binding to NOTCH is a tumor promoter of TNBC [5,6,10,15,17].
The AHR is a ligand-activated transcription factor [20–22]. TCDD, a polychlorinated dibenzo-p-dioxin has high affinity and selectivity for AHR and is highly stable and toxic [20–22]. TCDD inhibits breast cancer progression [21,23]. Perhaps most importantly TCDD inhibits TNBC progression [21,24,25]. TCDD also inhibits the progression of hormone receptor positive breast cancer [26–29]. The obvious limitation of TCDD for cancer therapy is its toxicity [21,30–32]. Fortunately, AHR binds to many different types of ligands and less toxic AHR ligands suitable for cancer therapy have been identified [21,33–35]. 2-(1’H-indole-3’-carbonyl)-thiazole-4-carboxylic acid methyl ester (ITE) is an indole compound that is derived from tryptophan [36–38]. Prior reports have provided data showing that ITE functions as a putative endogenous AHR ligand [36–38]. ITE suppresses the growth and invasiveness of ovarian cancer cells and inhibits the growth of glioblastoma tumorspheres [38,39]. The cellular effects of ITE on TNBC have not been reported.
In this study, we asked if ITE regulates JAG1 signaling in breast cancer cells. The impetus for this line of investigation stems from our prior RNA-Seq analysis that showed the expression of JAG1 is lower in MCF7 breast cancer cells treated with TCDD compared with vehicle [40]. We have deposited the full list of TCDD-regulated genes in MCF7 cells in Gene Expression Omnibus (GSE98515). Herein, we report the effect of ITE on JAG1, NOTCH1 and the phosphorylation of STAT3 in the TNBC MDA-MB-231 cell line. We also show that ITE decreases cell growth, migration and invasiveness of MDA-MB-231 cells.
2. Materials and methods
2.1. Reagents and cell culture
2,3,7,8 tetrachlorodibenzo-p-dioxin (TCDD) in dimethyl sulfoxide (DMSO) was purchased from Cambridge Isotopes Laboratory (Andover, MA). 2-(1H-Indol-3-ylcarbonyl)-4-thiazolecarboxylic acid methyl ester (ITE) was purchased from Tocris Bioscience (Bristol, United Kingdom). STATTIC and recombinant human JAGGED1 were purchased from R&D Systems (Minneapolis, MN). Non-targeting short interfering RNA (siRNA) (D-001810-01-20), ON-TARGETplus siRNA against AHR (J-004990-08-0010) and JAG1 (J-011060-11-0005) were purchased from GE Dharmacon (Lafayette, CO). The following supplies were purchased from ThermoFisher Scientific (Pittsburgh, PA): Dulbecco’s Modified Eagle Medium/Nutrient Mixture F-12 (DMEM/F12), fetal bovine serum (FBS), phosphate buffered saline (PBS), penicillin/streptomycin (P/S), dimethyl sulfoxide (DMSO), TrypLE Express and Lipofectamine RNAiMAX. Sodium dodecyl sulfate (SDS), 30% acrylamide/bis solution, ammonium persulfate, Tween-20, 2-mercaptoethanol and polyvinylidene difluoride (PVDF) membranes were obtained from BIO-RAD (Hercules, CA). Cell lines were purchased from the American Type Culture Collection (Manassas, VA) and cultured in DMEM:F-12 supplemented with 10% FBS and P/S at 37 °C with 5% CO2.
2.2. Reverse transcription and real-time polymerase chain reaction (RT-qPCR)
For JAG1 mRNA measurement experiments, cells were plated at a density of 250,000 cells/well in a 6-well plate with DMEM:F12 supplemented with 10% FBS 24 h before treatment. Cells were replenished with vehicle or ITE (10 μM) in DMEM/F12 supplemented with 10% FBS every 12 h. The rational for replenishing cells with ITE every 12 h was based on prior report showing that ITE is rapidly metabolized by cells [38]. The justification for 10 μM ITE in our study was based on a prior report showing that ITE has cellular effects at this concentration in human cancer cell lines [38]. Cells were treated with 10 μM STATTIC [41]. Total RNA extracted with RNA purification columns (Qiagen) was reverse transcribed using cDNA synthesis kits (Applied Biosystems (Foster City, CA)). Real-time PCR was conducted with the StepOnePlus (Applied Biosystems) and SYBR Green master mix (Applied Biosystems) in accordance with the suppliers’ protocols. Samples were run in triplicate and the average was normalized to β-actin loading control. Relative changes in gene expression were quantitated using the 2ΔΔCT formula. B-actin primers used were: forward 5′ -CTCGCCTTTGCCGATCC-3′, reverse 5′- TCTCCATGTCGTCCCAGTTG-3′ and JAG1 primers used were: forward 5′-GAGCCCGGCCTCCTTTTATT-3′, reverse 5′-GCGTCATTGTGTTACCTGCG-3′.
2.3. Western blotting
Cells were plated at a density of 250,000 cells/well in a 6-well plate with DMEM:F12 supplemented with 10% FBS 24 h before treatment. Cells were replenished with vehicle (DMSO) or ITE (10 μM) in DMEM:F12 supplemented with 10% FBS every 12 h. Since TCDD (10 nM) is relatively stable, cells were replenished with vehicle (DMSO) or TCDD in DMEM:F12 with 10% FBS every 2 days. The justification for using 10 nM TCDD is based on prior reports showing that TCDD at this concentration suppressed the proliferation and invasiveness of MCF7 and MDA-MB-231 cells [42,43]. Cells were treated with 10 μM STATTIC [41]. Treatments were ended by aspirating medium and rinsing cells with cold PBS. Total cellular extract was isolated by scraping cells in radioimmunoprecipitation assay (RIPA) supplemented with halt protease and phosphatase inhibitor cocktail (ThermoFisher Scientific). Protein concentration were determined by protein assay (BIO-RAD protein assay kit). Extracts were heat denatured in Laemmli sample buffer (BIO-RAD). Proteins were separated by SDS/PAGE and transferred to polyvinylidene difluoride membranes. For TNBC cell lines (MDA-MB-231, MDA-MB-157 and MDA-MB436), blots were probed with anti-JAG1 antibody (1:1000 dilution) for 16 h. For MCF7 cells, which express low levels of JAG1 compared with TNBC cells (Figs. 1 and 2), blots were probed with anti-JAG1 antibody (1:500) for 72 h. Blots were then probed with secondary antibody (diluted 1:5000) for 1 h at room temperature. Western signals were detected using chemiluminescence (Millipore, Billerica, MA). Loading controls (GAPDH or β-actin) were used to confirm equal loading of protein. Antibodies were purchased from Cell Signaling Technology (Danvers, MA). The Che-miDoc MP Imaging System (image lab 4.0) was used to quantify band density and acquire western blot images (Bio-Rad). Automatically detected bands were analyzed for volume intensity, which is the sum of all intensities with in the lane boundaries, without background subtraction (image lab 4.0).
Fig. 1.
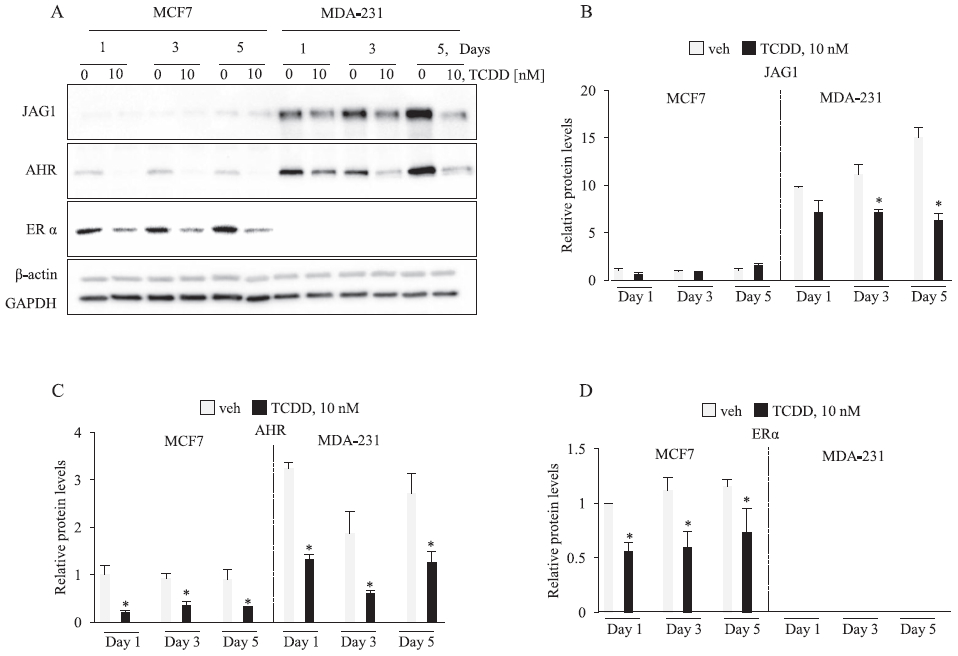
TCDD reduces JAG1 in MDA-MB-231 cells. Cells were treated with vehicle or 10 nM TCDD for the indicated time points. Total cellular extracts were collected and analyzed by western blot. Densitometric quantifications of target proteins over β-actin loading control are indicated as the mean signal ± SEM (error bars). Statistically significant changes induced by TCDD compared with vehicle controls treated for the same period of time, based on analysis of one-way ANOVA and Student Newman Keuls multiple comparisons test are indicated by *P < 0.05 (n = 3).
Fig. 2.
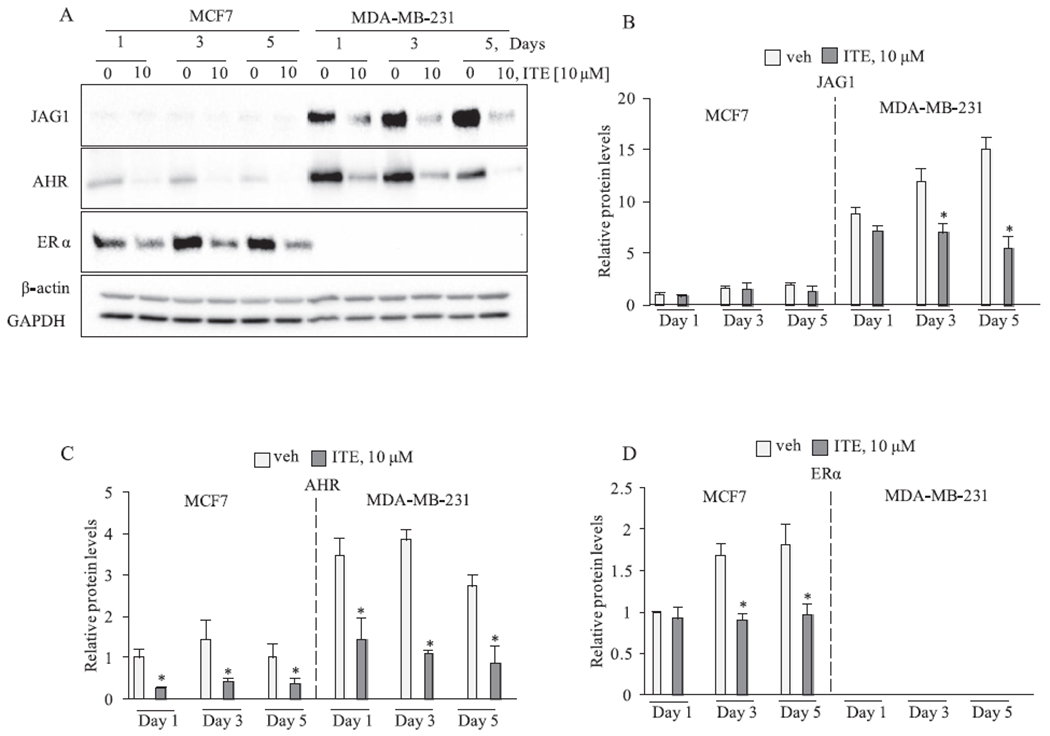
ITE reduced JAG1 in MDA-MB-231 cells. Cells were replenished with vehicle or 10 μM ITE every 12 h for the indicated time points. Total cellular extracts were collected and analyzed by western blot. Densitometric quantifications of target proteins over β-actin loading control are indicated as the mean signal ± SEM (error bars). Statistically significant changes induced by ITE compared with vehicle controls treated for the same period of time, based on analysis of one-way ANOVA and Student Newman Keuls multiple comparisons test are indicated by *P < 0.05 (n = 3).
2.4. Cleaved NOTCH1 ELISA
JAG1-induced NOTCH1 receptor is cleaved to release NOTCH1 Intracellular Domain 1 (NICD1) [4]. Cleaved NICD1 is transcriptional activator and downstream effector of activated NOTCH1 signaling [4]. The levels of cleaved NICD1 in cells were measured by a Cleaved Notch1 (Vall744) Sandwich ELISA Kit (Cell Signaling Technology) in accordance with the suppliers’ protocols.
2.5. Scratch migration assay
Cells were plated on 12 well tissue culture plates in DMEM:F-12 with 10% FBS at a concentration of 50,000 cells per well 24 h prior to treatment. Cells were replenished with DMSO or ITE (10 μM) every 12 h for 5 days. A pipette tip was used to make a scratch through the cell monolayer. Cells were then replenished with DMSO or ITE (10 μM). Cells at the edge of the scratch were photographed at time 0 and then at 24 h post scratch using the Leica Microscope. The width of the scratch was measured by ImageJ analysis software. The JAG1 siRNA knockdown experiments were conducted using methods that we have published. Cell migration was measured 48 h after cells were transfected with non-targeting or JAG1 targeting siRNA.
2.6. Effective concentration causing a 50% inhibition (IC50)
Cells (100,000 cells/well) were plated on 6-well plates 24 h prior to treatment. Cells were replenished every 12 h with vehicle or ITE (10 μM) in DMEM:F12 supplemented with 10% FBS. After 5 days of treatment, cells were trypsinized and live cell number was determined by trypan blue staining and automated cell counting by Countess II (ThermoFisher). For EC50 determination, data were fit with non-linear regression, and analyzed as log [ITE] versus response (three parameter equation) without subtraction of any basal (or background) response using GraphPad Prism (8.3.1) (GraphPad Software, Inc). Mean values from N = 3 were plotted to get a single EC50. Statistical differences between ITE groups and the vehicle group and sample variability were determined by ANOVA followed by Dunnett’s multiple comparison tests (GraphPad Software, Inc). Day 1, 3, 5 time course growth inhibition experiments were conducted using the same approach as the EC50 experiments, and the Student’s test was used to determine statistical differences between vehicle and ITE groups treated for the same time duration.
2.7. Invasion assay
Cells (200,000/per well) were plated on a 6-well tissue culture plate for 24 h before treatment. Cells were replenished with vehicle or 10 μM ITE every 12 h in DMEM/F-12 with 10% FBS. Treated cells were detached from the 6-well tissue culture plate and transferred (100,000 cells/500 μL) to the upper chamber of a Matrigel-coated transwell (Fisher Scientific). Cells were transferred to the upper chamber in DMEM:F12 with 0.1% FBS and DMSO or ITE (10 μM). The chemoattractant (20% FBS) was added to the lower chamber in DMEM:F12. Cells were incubated in the Boyden chamber for 36 h. Cells that invaded through the Matrigel-based membrane (8 μm pore size) were stained with crystal violet. Cells stained with crystal violet were rinsed several times with tap water. Crystal violet stained cells were lysed in DMSO for 10 min with rotation. The relative amount of crystal violet was determined by measuring the absorbance of the cell lysate at 560 nm using a BioTek Synergy HTX multi-mode plate reader.
2.8. Exposing cells to greater amounts of JAG1
We exposed cells to greater amounts of JAG1 by attaching JAG1 to protein G-coated tissue culture plates prior to plating cells. This method for expressing JAG1 on tissue culture plates has been published [44,45]. Briefly, cell culture plates were coated with 50 μg/ml Protein G (R&D Systems) for 16 h. Plates were then rinsed three times with PBS and blocked with bovine serum albumin (10 mg/mL in PBS) for 2 h. Recombinant Jagged1-FC chimera (R&D Systems) was applied to protein G coated plates at a concentration of 3 μg/ml in 0.1% BSA/PBS for 3 h at room temperature [44,45]. Cells were plated on JAG1-coated plates 24 h before treatment. Cells were replenished with vehicle or ITE every 12 h in DMEM:F12 supplemented with 10% FBS. Cell number and cell invasiveness were assayed using methods detailed above.
2.9. Short interfering RNA transfection
Cells were transfected with non-targeting or targeting short interfering RNAs using Lipofectamine (ThermoFisher Scientific) using methods that we have published [40,46].
2.10. Statistics
The Student–Newman–Keuls test was used to determine statistically significant differences among groups following one-way analysis of variance (ANOVA). Two-tailed, paired t tests with confidence intervals of 95% were used to determine statistically significant differences between two groups.
3. Results
3.1. TCDD and ITE reduce JAG1 and NOTCH signaling in TNBC cells
We first verified that TCDD reduces JAG1 protein in a 5-day time course experiment where we extracted protein from MCF7 and MDA-MB-231 cells on Days 1, 3 and 5 and performed immunoblot analysis. The levels of JAG1 protein were significantly higher (~10- to 15-fold) in MDA-MB-231 than MCF7, which is in agreement with the findings of a prior report [5] (Fig. 1). Analysis of the TCDD receptor, AHR, showed that its levels were also higher (~2–3-fold) in MDA-MB-231 than MCF7 (Fig. 1). In MDA-MB-231, JAG1 protein levels increased through the 5-day time course and this was significantly reduced by TCDD (Fig. 1). Reductions in JAG1 in TCDD-treated MDA-MB-231 cells was apparent after 1 day, reached statistical significance by day 3, and was most apparent by day 5 of treatment (Fig. 1). TCDD is known to reduce AHR and ER protein via the ubiquitin-proteasome pathway in MCF7 and TNBC cells [24,29,40,47]. Accordingly, TCDD reduced AHR and ER protein levels in our experiment (Fig. 1). As expected, the luminal ER positive MCF7 cells expressed ER and the TNBC cell line (MDA-MB-231) did not (Fig. 1). We confirmed equal protein loading (30 ug per sample) through the 5-day time course by probing blots with two loading controls, GAPDH and beta-actin (Fig. 1).
As noted, AHR binds to structurally diverse ligands [21]. ITE is a tryptophan-derived indole compound and hypothesized endogenous ligand of AHR [36,37] that suppresses the growth of ovarian cancers and glioblastoma tumorspheres [38,39]. Since the effect of ITE on breast cancer cells has not been reported, we investigated if ITE could reduce JAG1 expression. We repeated the 5-day time course with ITE. Prior reports indicate that ITE is rapidly metabolized by cells [38]. We therefore replenished cells with vehicle or ITE (10 μM) every 12 h [38]. ITE effects were similar to the observed TCDD effects, because ITE reduced AHR, ER and most importantly, JAG1 (Fig. 2).
We verified ITE-stimulated reductions in JAG1 protein in MCF7 and MDA-MB-231 cells and tested two additional cell lines. The three TNBC cell lines (MDA-MB-231, MDA-MB-436, MDA-MB-157) showed reduced JAG1 and AHR in response to ITE (3-day treatment) (Fig. 3A). We also verified that ITE reduced JAG1 protein in the luminal MCF7 cell line (Fig. 3A). Because the results in Fig. 1 and Fig. 2 showing very little expression of JAG1 protein in MCF7, we enhanced JAG1 protein detection by doubling the amount of MCF7 protein extract per western blot (~60 μg) and incubating blots with anti-JAG1 antibody (dilution of 1:500) for a longer period (three days instead of 16 h). As shown in Fig. 3A, ITE reduced JAG1 protein in MCF7 cells. The downstream effector of JAG1 in TNBC cells is Cleaved NOTCH Intracellular Domain 1 (NICD1) [8]. Upon JAG1 binding to NOTCH1, NICD1 is cleaved by a disintegrin-metalloprotease (ADAM) and gamma-secretase [4]. This proteolytic cleavage releases NICD1 from the Notch1 receptor, and NICD1 translocates to the nucleus where it acts as a transcriptional regulator [4]. We therefore measured NICD1 levels as a readout of JAG1 signaling. We used a very sensitive NICD1 ELISA to detect NICD1 in cells. While NICD1 was barely detectable in MCF7 and MDA-MB-436, ITE significantly reduced NICD1 protein levels in MDA-MB-231 and MDA-MB-157 cells (Fig. 3B). Thus, these data indicate for the first time that in TNBC cells, ITE reduces JAG1 expression and NICD1 signaling.
Fig. 3.
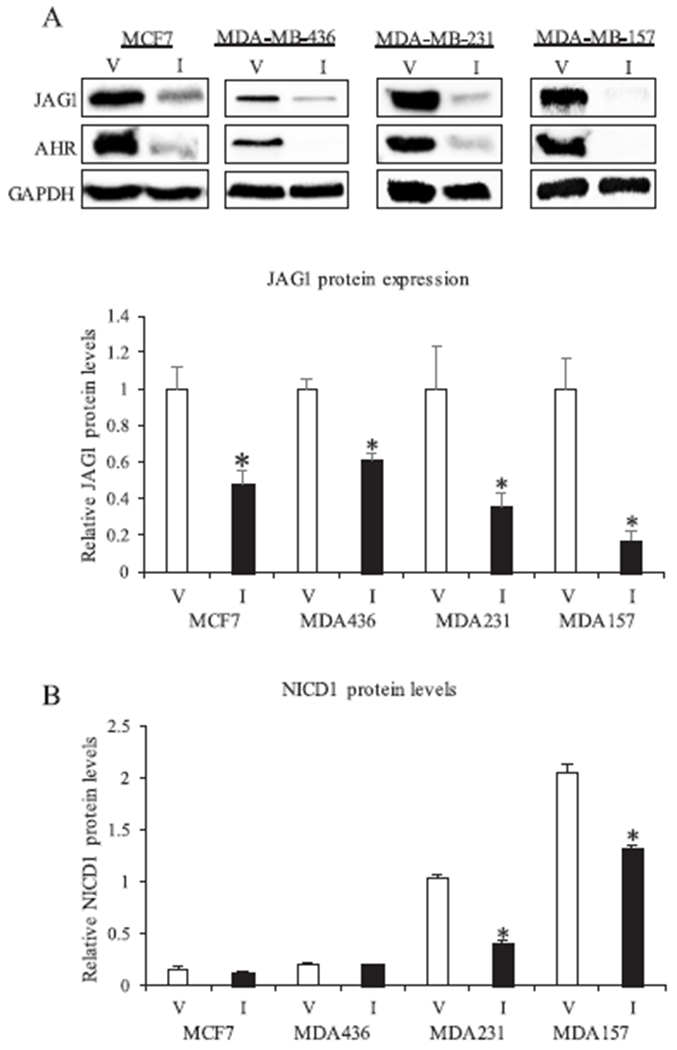
ITE regulation of JAG1 and NICD1 in breast cancer cells. A, One luminal ER positive (MCF7) and three TNBC cell lines (MDA-MB-231, MDA-MB-436, MDA-MB-157) were replenished with vehicle (V) or 10 μM ITE (I) every 12 h for 3 days. Total cellular extracts were collected and analyzed by western blot. Densitometric quantifications of JAG1 over GAPDH loading control are indicated as the mean signal ± SEM (error bars). Statistically significant changes induced by ITE compared with vehicle controls treated for the same period of time, based on Student’s t-test analysis, are indicated by *P < 0.05 (n = 3). B, Cells were replenished with vehicle or 10 μM ITE every 12 h from three days. Total cellular extracts were collected and analyzed by NICD1 ELISA. Spectrophotometry readings are indicated as the mean signal ± SEM (error bars). Statistically significant changes induced by ITE compared with vehicle controls treated for the same time period, based on Student’s t-test analysis, are indicated by *P < 0.05 (n = 3).
3.2. ITE-stimulated reductions in JAG1 are mediated by reductions in phospho-STAT3
Prior reports have identified that HES-1 [48,49], phosphorylated ERK (P-ERK) [8] and phosphorylated STAT3 (P-STAT3) [50] are upstream regulators of JAG1. We therefore asked if these three regulators of JAG1 are regulated by ITE. Mechanistic studies were conducted in MDA-MB-231, because this TNBC cell expresses high levels of JAG1, P-ERK and P-STAT3 under basal conditions (Fig. 4). Although ITE had no effect on HES1 and P-ERK, it significantly reduced (by ~50%) P-STAT3 (at Tyr705) on Day 1 and Day 3 post treatment (Fig. 4). ITE-stimulated reductions in P-STAT3 were correlated with significant reductions (by ~50%) in JAG1 (Fig. 4). The levels of total STAT3 were not reduced by ITE (Fig. 4). Therefore, ITE reduces the process of phosphorylating STAT3 without reducing STAT3. Next, we sought to verify that specifically inhibiting the phosphorylation of STAT3 (at Tyr705) with a specific STAT3 inhibitor would be sufficient to reduce JAG1. To this end, we treated cells with the STAT3 inhibitor, STATTIC [41]. This inhibitor inhibits activation, phosphorylation (at Tyr705) and DNA binding activity of STAT3 [41]. Selective reductions in the phosphorylation of STAT3 (at Tyr705) by STATTIC has been reported in MDA-MB-231 cells [41]. Further, STATTIC is selective for STAT3, because it does not affect the levels of P-ERK, phosphorylated-SRC or phosphorylated-JNK in MDA-MB-231 [41]. Based on this prior report [41], we asked if STATTIC (10 μM) reduces JAG1 in MDA-MB-231 cells. The results showed that STATTIC extinguished P-STAT3 to levels that were undetectable, and it significantly reduced (by ~60%) JAG1 protein expression (Fig. 5A). We conducted real-time PCR to establish that ITE and STATTIC decrease JAG1 mRNA. The findings showed significant reductions in JAG1 mRNA in response to ITE and STATTIC (by ~30% and 60%, respectively) (Fig. 5C). These data show that AHR and STAT3 are regulators of JAG1 mRNA in MDA-MB-231 cells treated with ITE. It is possible that observed effects on JAG1 mRNA in response to ITE are due to reductions in JAG1 transcription and/or destabilization of JAG1 mRNA.
Fig. 4.
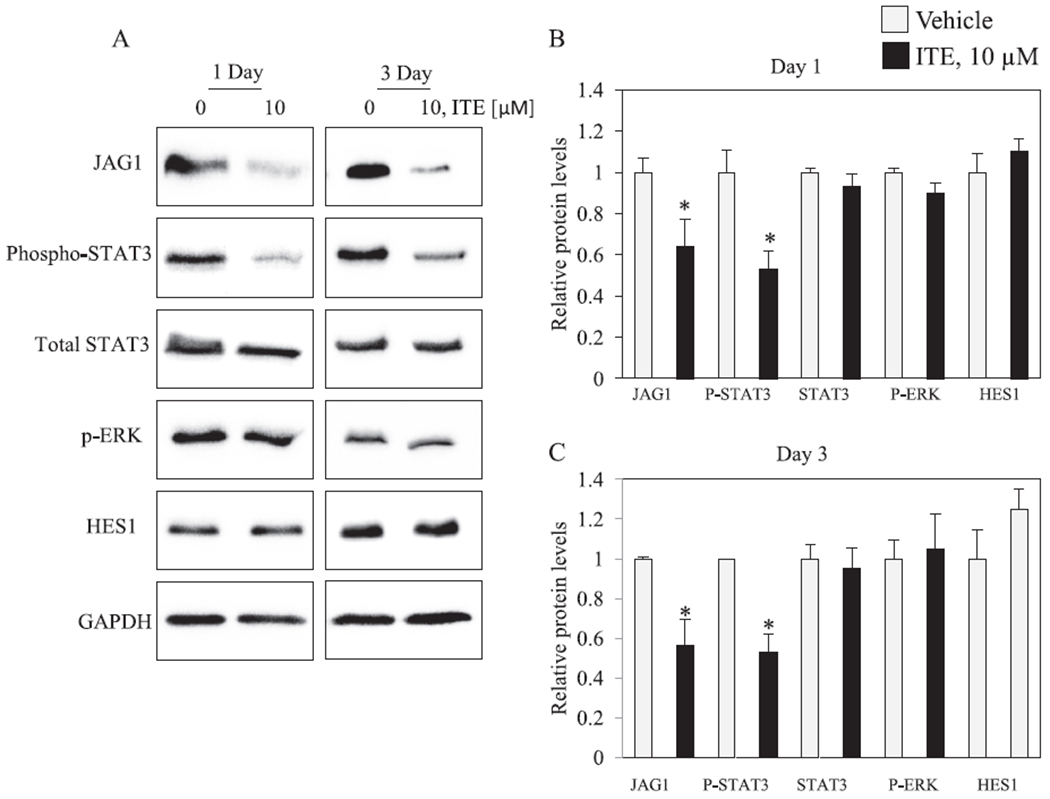
ITE reduced P-STAT3 and JAG1 in MDA-MB-231 cells. Cells were replenished with vehicle or 10 μM ITE every 12 h for the indicated number of days. Total cellular extracts were collected and analyzed by western blot. Densitometric quantifications of JAG1, P-STAT3, STAT3 and HES1 over GAPDH loading control are indicated as the mean signal ± SEM (error bars). Statistically significant changes induced by ITE compared with vehicle controls treated for the same period of time, based on Student’s t-test analysis, are indicated by *P < 0.05 (n = 3).
Fig. 5.
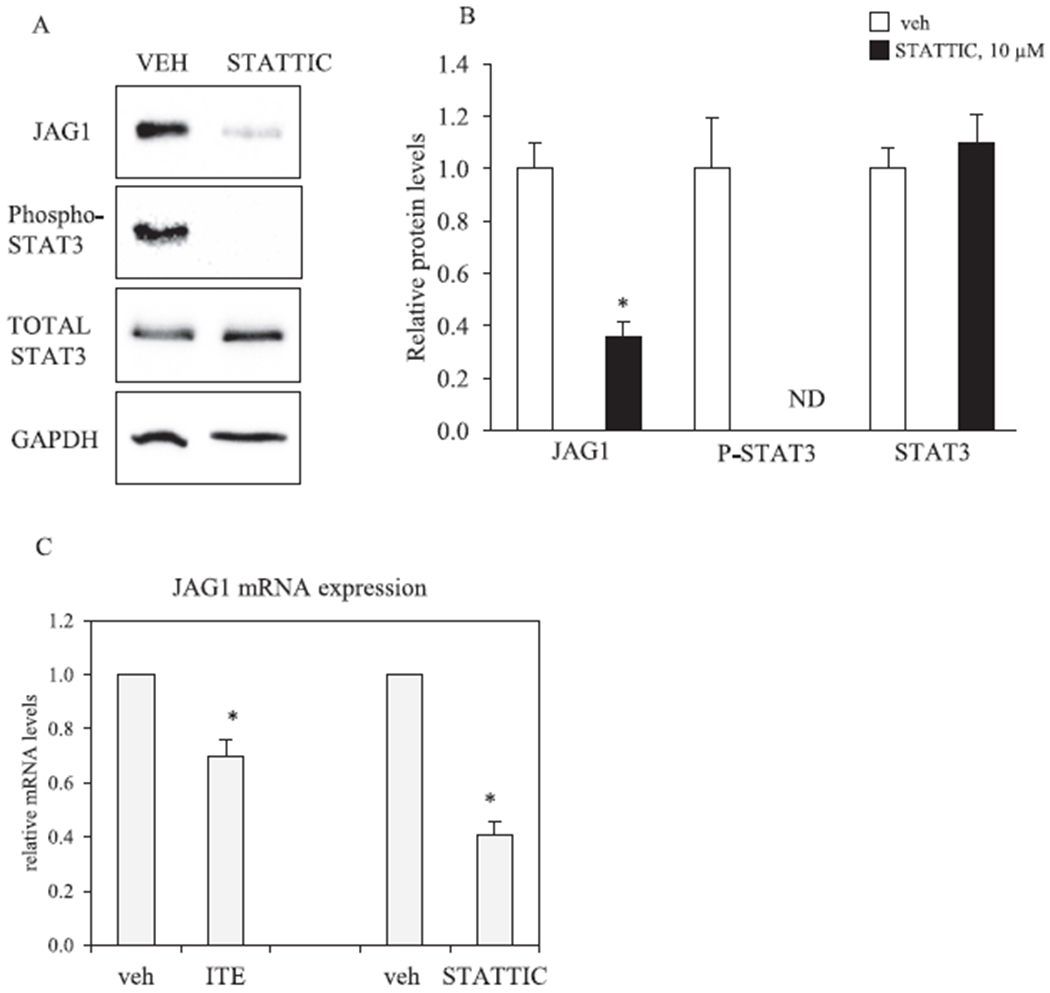
STATTIC reduces JAG1 expression in MDA-MB-231 cells. A, MDA-MB-231 cells were treated with vehicle (V) or 10 μM STATTIC for 3 days. Total cellular extracts were collected and analyzed by western blot. Densitometric quantifications of JAG1, P-STAT3 and STAT3 over GAPDH loading control are indicated as the mean signal ± SEM (error bars). Statistically significant changes induced by STATTIC compared with vehicle controls treated for the same period of time, based on Student’s t-test analysis, are indicated by *P < 0.05 (n = 3). Non-detectable (ND). B, MDA-MB-231 cells were treated with vehicle, 10 μM ITE (replenished every 12 h) or 10 μM STATTIC for 3 days. Total RNA was extracted and gene expression was analyzed by qRT-PCR. Relative changes in gene expression (JAG1/Beta-actin) are indicated as the mean ± SEM (error bars). Statistically significant changes induced by ITE and STATTIC compared with time matched vehicle controls based on one-tailed paired T test analysis are indicated by *P < 0.05 (n = 3).
3.3. ITE reduces JAG1 via AHR in MDA-MB-231 cells
We postulated that ITE reduces JAG1 by functioning as an AHR ligand. To address this question, we reduced AHR expression with short interfering RNA (siRNA) prior to treating cells with vehicle or ITE. Control cells were transfected with non-targeting siRNA before treatment. Experiments were conducted in MDA-MB-231 cells, because this cell line expresses high levels of AHR and JAG1 (Figs. 1 and 2). Transfecting MDA-MB-231 cells with AHR-siRNA (AHRi) reduced AHR to levels that were not detectable by western blot (Fig. 6). As expected, ITE treatment reduced JAG1 and AHR protein levels in control cells (cells transfected with non-targeting siRNA (cRNAi) but not in AHR knockdown cells (Fig. 6A). Thus, in MDA-MB-231 cells, ITE relies on AHR to reduce JAG1 protein (Fig. 6).
Fig. 6.
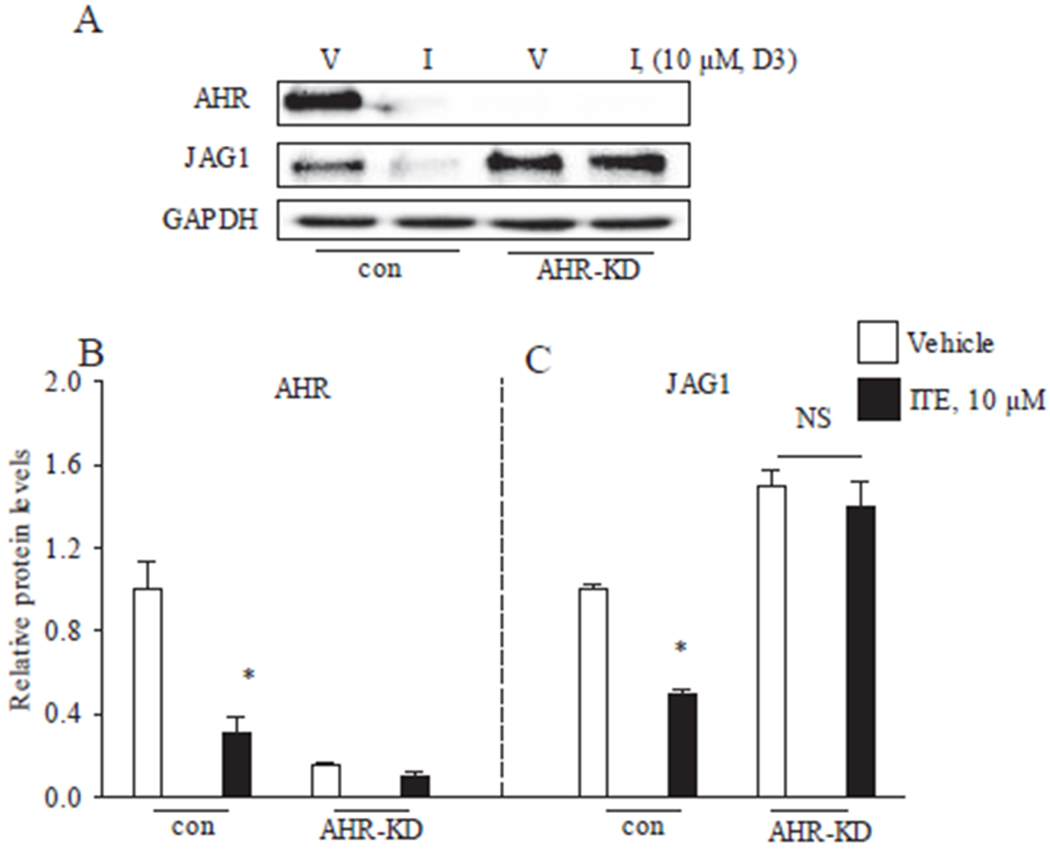
ITE regulation of JAG1 via AHR in MDA-MB-231 cells. A, MDA-MB-231 cells transfected with short interfering RNAs that were either non-targeting (con)) or AHR targeting (AHR-knockdown (AHR-KD)) were replenished with vehicle (V) or 10 μM ITE (I) for 3 days. Total cellular protein was then isolated and analyzed by western blot. Densitometric quantifications of JAG1, AHR over GAPDH loading control are indicated as the mean signal ± SEM (error bars). Statistically significant changes induced by ITE compared with time-matched vehicle controls, based on Student’s t-test analysis, are indicated by *P < 0.05 (n = 3).
3.4. Effect of ITE on cell growth, migration and invasion
We conducted a 1-, 3-, 5-day time course experiment with MDA-MB-231 cells to investigate if ITE reduces the growth of this TNBC cell line. ITE treatment significantly reduced the number of MDA-MB-231 cells on day 3 and day 5 (Fig. 7A). The effect of a range of ITE concentrations (0.0001–10 μM) on MDA-MB-231 and MDA-MB-157 cells on day 5 post treatment was evaluated to determine the inherent sensitivities of TNBC cell lines. ITE (10 μM) reduced MDA-MB-231 and MDA-MB-157 cell growth by approximately 50% (Fig. 7B & C). ITE-stimulated reductions in cell number were concentration dependent (Fig. 7B & C). Based on IC50 values, MDA-MB-231 cells were more sensitive to ITE-stimulated growth inhibition than MDA-MB-157 (Fig. 7B & C). Given that ITE reduces JAG1 expression, we examined whether siRNA-mediated reduction in JAG1 would decrease cell growth. Transfecting cells with JAG1-siRNA effectively reduced JAG1 protein by ~90% in MDA-MB-231 (Fig. 7D). Silencing JAG1 expression significantly reduced (by ~40%) MDA-MB-231 cell number 3 days post transfection (Fig. 7E).
Fig. 7.
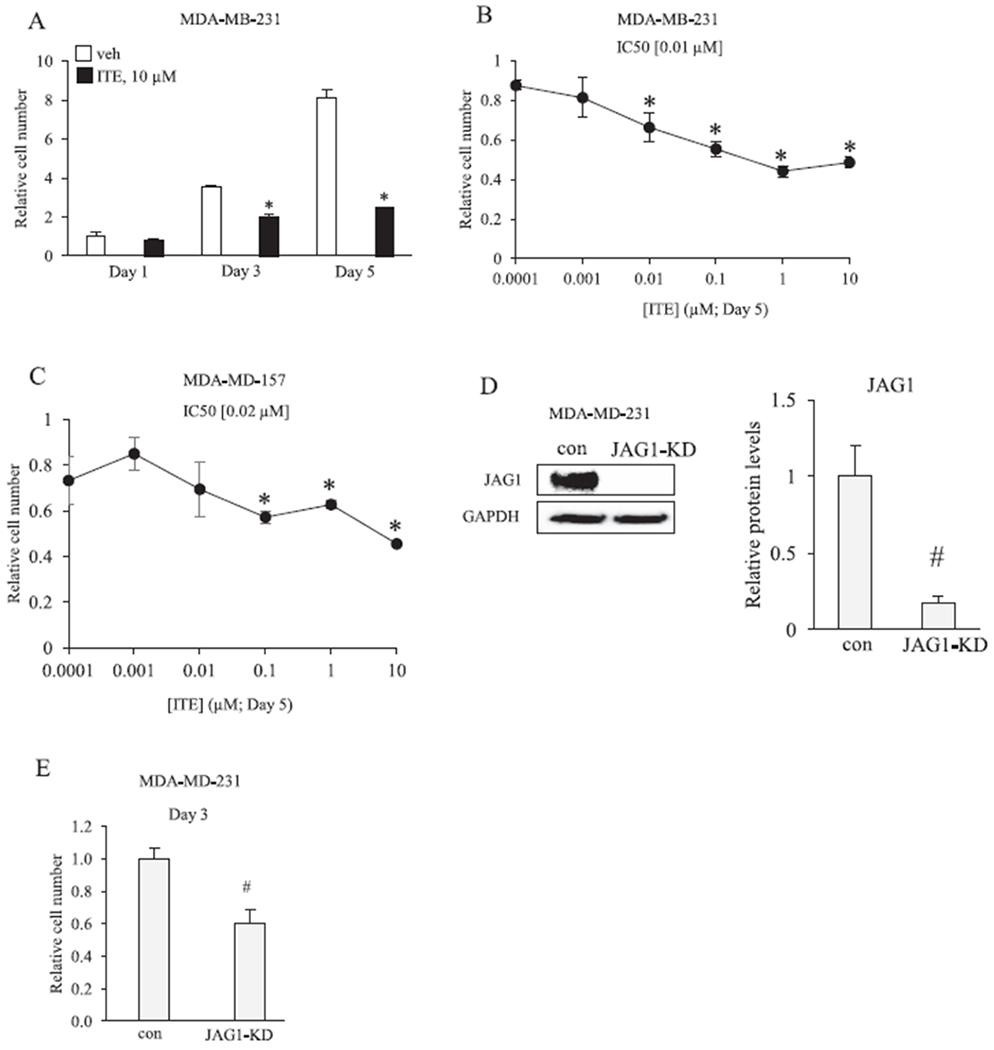
ITE reduces the growth of breast cancer cells. A, MDA-MB-231 cells were replenished with vehicle or 10 μM ITE every 12 h and the number of viable cells was determined by cell counting after 1, 3 and 5 days. B &C, Cells were replenished with increasing concentrations of ITE every 12 h and the number of viable cells was determined by cell counting on day 5. D, MDA-MB-231 cells were transfected with short interfering RNAs that were either non-targeting (con) or JAG1 targeting (JAG1-knockdown (JAG1-KD)). Total cellular extracts were collected and analyzed by western blot with JAG1 and GAPDH antibodies. E, The number of live MDA-MB-231 cells (con versus JAG1-KD) was determined on day 3 post transfection. Statistically significant changes induced by ITE, compared with vehicle controls treated for the same period of time, based on analysis of one-way ANOVA and Dunnett’s multiple comparison tests are indicated by *P < 0.05 (n = 3). Statistically significant changes induced by JAG1-KD compared with controls, based on Student’s t-test analysis, are indicated by #P < 0.05 (n = 3).
Next, we tested the effect of ITE on cell migration and invasiveness in the MDA-MB-231, which is an invasive cell line. Cells were pretreated with vehicle or 10 μM ITE and plated in transwell chambers coated with matrigel to determine the effect on invasive activity. ITE effects were variable after one day of treatment, but ITE significantly reduced invasive activity by day 3 (by ~40%) and day 5 (by ~40%) (Fig. 8A). We sought to determine if reductions in cell invasiveness were correlated with reductions in cell migratory activity. The scratch assay was used to evaluate cell migration, and the results showed that 10 μM ITE significantly inhibited (by ~50%) the migration of MDA-MB-231 cells (Fig. 8B). We investigated if targeted silencing of JAG1 would resemble the ITE effects of MDA-MD-231 migration and invasiveness. The results showed that JAG1-siRNA significantly decreased the invasiveness (by ~50%) and migratory (by ~70%) activity of MDA-MB-231 cells (Fig. 8C & D).
Fig. 8.
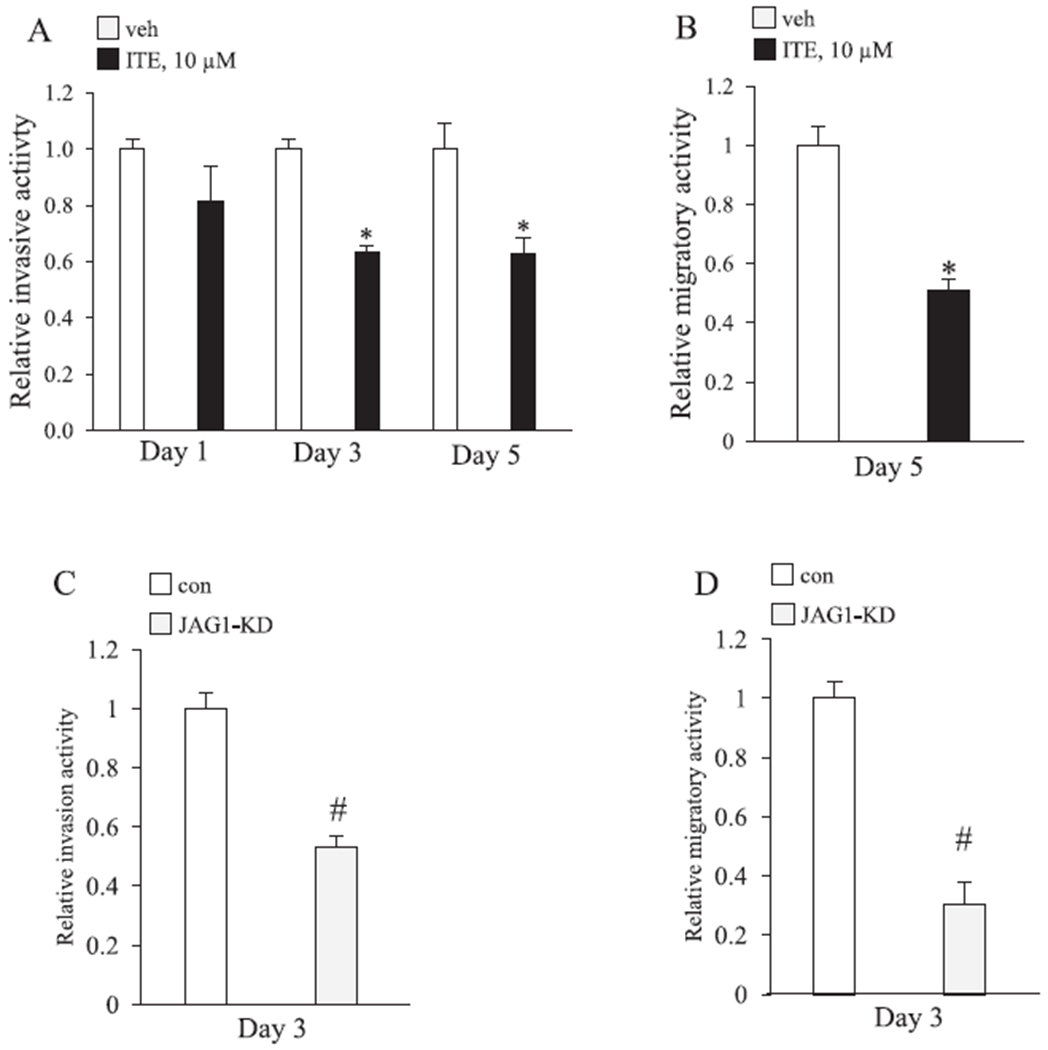
ITE reduces the migratory and invasive activity of MDA-MB-231 cells. A, Relative fold change in MDA-MB-231 invasiveness. MDA-MB-231 cells were replenished with vehicle or 10 μM ITE every 12 h for the indicated number of days and then analyzed for invasiveness by transwell chambers coated with matrigel. Statistically significant changes induced by ITE compared with vehicle controls treated for the same period of time, based on Student’s t-test analysis, are indicated by *P < 0.05 (n = 3). B, Relative fold change in MDA-MB-231 migration. MDA-MB-231 cells were replenished with vehicle or 10 μM ITE every 12 h for 5 days and then analyzed for migratory activity by the scratch assay. Significant changes induced by ITE compared with vehicle controls treated for the same period of time, based on Student’s t-test analysis, are indicated by *P < 0.05 (n = 3). C & D, MDA-MB-231 cells were transfected with short interfering RNA that was non-targeting (con) or JAG1 targeting (JAG1-knockdown (JAG1-KD)) and relative changes in migratory and invasive activity was determined on day 3 post transfection. Significant changes in induced by JAG1-KD compared with control (con) for the same period, based on Student’s t-test analysis, are indicated by #P < 0.05 (n = 3).
Since JAG1 expression appears to be required for invasiveness and cell migration, we asked if exposing MDA-MB-231 cells to a greater amount of JAG1 protein would counteract the cellular effects of ITE. We relied on a published method [44,45], which involves plating cells on tissue culture plates that are coated with recombinant JAG1. Cells were then replenished with vehicle or ITE (10 μM) for three days and we measured changes in cell growth and invasiveness. To insure that JAG1-coated plates stimulated NOTCH signaling in cells, we measured the induction of HES1 by western blot. HES1 is a direct transcriptional target of JAG1-NOTCH signaling [51] and its expression was significantly induced (by ~4-fold) by extracellularly expressed JAG1 (Fig. 9A). Induction of HES1 expression by recombinant JAG1 occurred in vehicle and ITE treated cells (Fig. 9A). Exposing MDA-MB-231 cells to greater amounts of JAG1 did not reverse ITE effects on MDA-MB-231 cells (Fig. 9C & D). Indeed, the growth inhibition and reductions in cell invasiveness in response to ITE occurred equally well in control and JAG1-stimulated MDA-MB-231 cells (Fig. 9B & C).
Fig. 9.
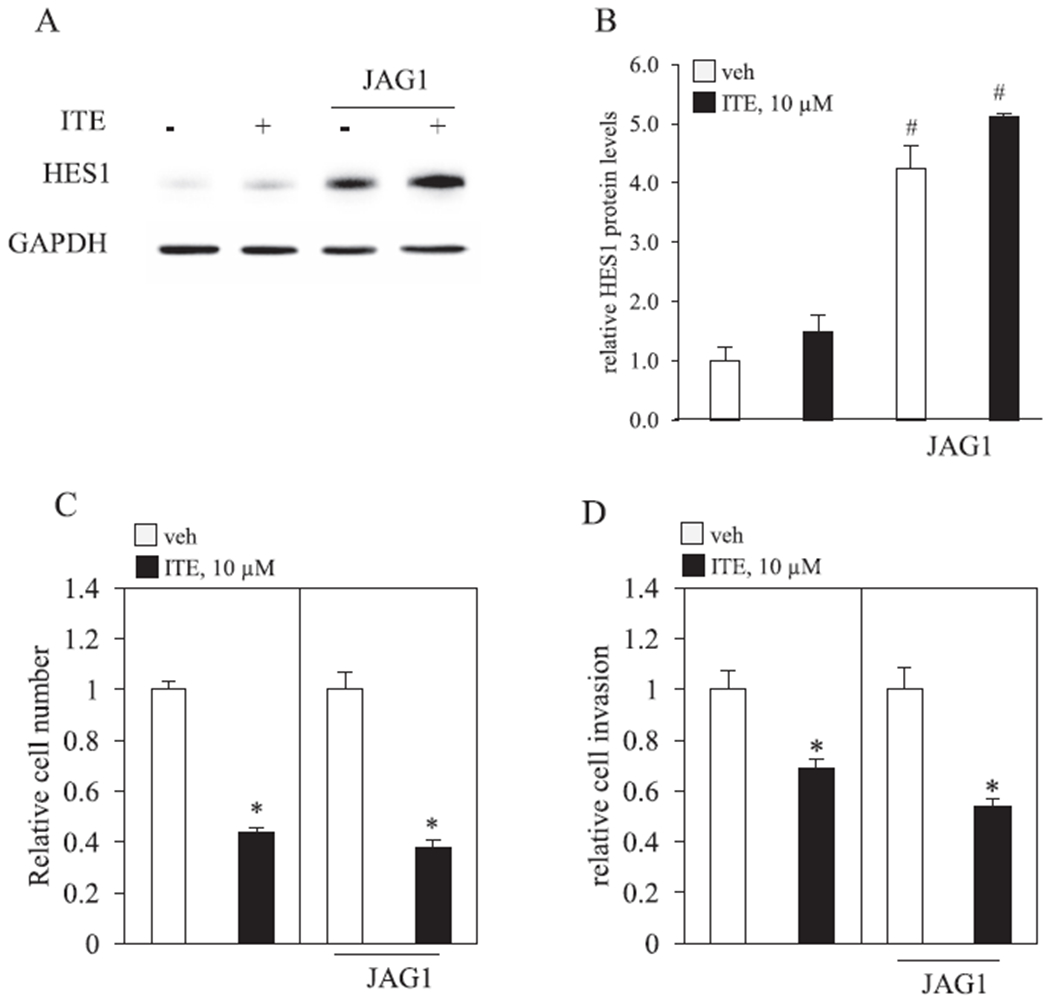
Recombinant JAG1 fails to reverse ITE effects. A-D. MDA-MB-231 cells were plated on tissue culture plates coated with protein G or protein G bound to recombinant JAG1 (JAG1). Cells were then replenished with vehicle (V) or 10 μM ITE (I) for 3 days. A & B, Total cellular protein was isolated and analyzed by western blot. Densitometric quantifications of HES1 over GAPDH loading control are indicated as the mean signal ± SEM (error bars). C, Relative MDA-MB-231 growth was determined by counting the total number of live cells. D, Relative MDA-MB-231 invasive activity was determined by matrigel-coated transwell chamber assays. A. Statistically significant changes induced by exposing cells to higher levels of JAG1 (JAG1), compared with control plates, based on Student’s t-test analysis, are indicated by #P < 0.05 (n = 3). Statistical significant reductions by ITE, compared with vehicle, based on Student’s t-test analysis, are indicated by *P < 0.05 (n = 3).
4. Discussion
We show in this report the putative endogenous AHR ligand ITE reduces the expression of JAG1, the amount of NICD1 and the phosphorylation of STAT3 (at tyrosine 705) in MDA-MB-231 cells (Figs. 1–6). The STAT3 inhibitor STATTIC reduced the phosphorylation of STAT3 and also decreased JAG1 expression in MDA-MB-231 cells (Fig. 4). Based on these findings, we conclude that (1) ITE decreases JAG1 expression in an AHR dependent fashion and (2) STAT3 mediates the regulation of JAG1 expression in MDA-MB-231 cells. We demonstrate that reducing the expression of JAG1 with short interfering RNA decreases the growth, migration and invasiveness of MDA-MB-231 cells (Figs. 7 and 8). JAG1 must therefore be required for these cellular processes under basal conditions in MDA-MB-231 cells. However, when we exposed ITE-treated MDA-MB-231 cells to greater amounts of JAG1, inhibition of cell growth and invasiveness by ITE was not reversed (Fig. 9). We therefore conclude that ITE may have cell context-specific effects (basal versus ITE treatment) in MDA-MB-231 cells and that the inhibitory effect of ITE on cell growth and cell invasiveness is mediated by disruption of other signaling pathways and not by reductions in the JAG1-NOTCH pathway.
Prior reports have shown that HES1, P-ERK and P-STAT3 are upstream regulators of JAG1 expression [8,48–50]. HES1 is unique, because of its negative feedback relationship with JAG1 [48,49]. Specifically, JAG1 via NOTCH increases HES1 transcription [51]. In turn, HES1 directly suppresses JAG1 transcription (in mouse embryonic cells) [48,49]. It was possible that ITE has its effect by inducing HES1 which could downregulate JAG1. However, we found that ITE does not induce HES1 in MDA-MB-231 cells (Figs. 4 and 9). Based on this result, we sought alternative mechanisms by which ITE could reduce JAG1 in MDA-MB-231 cells. The compound U0126 is a selective inhibitor of MEK1 and MEK2 and therefore inhibits ERK activation [52]. A prior report has shown that treating MDA-MB-231 cells with U0126 significantly reduced (to levels that were barely detectable by western blot) JAG1 protein expression [8]. However, when we tested ERK phosphorylation in the presence of ITR, we found that ITE (day 1 and 3) did not reduce the levels of P-ERK in MDA-MB-231 cells (Fig. 4). A prior report showed that trastuzumab resistance in human gastric cancer cells (NCI-N87) was marked by a robust increase in the levels of P-STAT3 caused by increases in IL-6 production [50]. In turn, IL-6 via P-STAT3 induced JAG1 in the NCI-N87 cells [50]. The P-STAT3 inhibitor, WP1066, reduced P-STAT3 and JAG1 (by 100%) in NCI-N87 cells stimulated with IL-6 [50]. We therefore evaluated P-STAT3 levels and found its levels were significantly reduced (by ~50%) by ITE (day 1 and 3) in MDA-MB-231 cells (Fig. 4). To verify that ITE-stimulated reductions in P-STAT3 lead to reductions in JAG1, we treated MDA-MB-231 cells with the P-STAT3 inhibitor STATTIC [41]. As anticipated, STATTIC reduced P-STAT3 (by 100%) and JAG1 (by 60%) (Fig. 5A & B). Further, ITE and STATTIC reduced JAG1 mRNA (Fig. 5C). Considering that P-STAT3 is a transcription factor [53], the observed reduction in JAG1 mRNA (Fig. 5C) in response to STATTIC (and ITE) is likely due to decreases in JAG1 transcription.
We investigated the mechanism by which ITE reduces JAG1 in MCF7 cells (data not shown). We found that ITE regulation of JAG1 in MCF7 is very different from ITE regulation of JAG1 in MDA-MB-231. MCF7 cells fail to express P-STAT3 and thus the phosphorylation of this transcription factor is not likely to control the expression of JAG1 in MCF7 cells (data not shown). In contrast to MDA-MB-231, ITE increased (by ~2-fold) HES1 protein in MCF7 cells. When we completely suppressed ITE-stimulated increases in HES1 with HES1-siRNA, we found that ITE reduced JAG1 equally well in control and HES1 siRNA knockdown MCF7 cells (by ~50%) (data not shown). ITE-induced HES1 therefore does not mediate reductions in JAG1 in MCF7 cells. We also asked if ITE reduced JAG1 via AHR in MCF7 cells. Interestingly, the results identified a requirement of endogenous AHR for stabilizing basal JAG1 protein in MCF7 cells. Indeed, the levels of JAG1 were significantly (P < 0.05) reduced (by —50%) in AHR knockdown cells compared with control cells (under vehicle conditions) (data not shown; N = 3). Collectively, our findings indicate that ITE (and AHR) regulation of JAG1 differs greatly in MCF7 compared with MDA-MB-231 and we have not identified the mechanism by which ITE (or AHR) regulates JAG1 in MCF7.
Prior reports have shown that TCDD has signaling effects in MDA-MB-231 cells. For instance, the phosphorylation of retinoblastoma (RBI) protein is necessary for MCF7 and MDA-MB-231 proliferation [42]. TCDD induces hypophosphorylation of RBI in these two cell lines, causing a slowing of MCF7 and MDA-MB-231 proliferation [42]. TCDD has also been reported to inhibit MDA-MB-231 invasiveness by increasing the expression of microRNA-335 [24]. Considering that TCDD and ITE are AHR ligands, perhaps these reported TCDD signaling effects play roles in mediating the cellular effects of ITE in MDA-MB-231 cells.
ITE anti-cancer effects extend to additional human cancers. ITE reduced the proliferation and migration of human ovarian cancer cell lines (OVCAR-3 and SKOV-3) [39]. In addition to reducing cancer cell growth in cell culture, the authors showed that dosing mice with ITE suppressed OVCAR-3 tumor growth in vivo, without inducing long-term (36 days) reductions in mouse body weight [39]. In vivo injections of ITE suppresses U87 (glioblastoma), HEPG2 (liver cancer), and LNCAP (prostate) tumor grafts in mice [38]. ITE also stimulated the differentiation of U87 stem-like cells, which in turn inhibited the formation of U87 tumor spheres [38]. Mechanistically, ITE induced U87 differentiation by inhibiting the expression of the pluripotency transcription factor, OCT4 [38]. Given our observations of the effects of ITE on TNBC cell lines, the potential utility of ITE could be extended to the treatment of breast cancer.
Acknowledgments
This publication was supported by the National Institute of General Medical Sciences of the National Institutes of Health under Award Number P20GM121299-01A1, and the WV-INBRE network which is supported by NIH grant (P20GM103434). The content is solely the responsibility of the authors and does not necessarily represent the official views of the National Institutes of Health.
Footnotes
Declaration of Competing Interest
The authors declare that they have no known competing financial interests or personal relationships that could have appeared to influence the work reported in this paper.
References
- [1].Arslan C, Dizdar O, Altundag K, Pharmacotherapy of triple-negative breast cancer, Expert Opin. Pharmacother. 10 (2009) 2081–2093. [DOI] [PubMed] [Google Scholar]
- [2].Mod. Pathol. 24 (2) (2011) 157–167, 10.1038/modpathol.2010.200. [DOI] [PubMed] [Google Scholar]
- [3].Foulkes WD, Smith IE, Reis-Filho JS, Triple-negative breast cancer N. Engl. J. Med. 363 (2010) 1938–1948. [DOI] [PubMed] [Google Scholar]
- [4].Kopan R, Ilagan MX, The canonical Notch signaling pathway: unfolding the activation mechanism, Cell 137 (2009) 216–233. [DOI] [PMC free article] [PubMed] [Google Scholar]
- [5].Cohen B, Shimizu M, Izrailit J, Ng NF, Ruchman Y, Pan JG, et al. , Cyclin D1 is a direct target of JAG1-mediated Notch signaling in breast cancer, Breast Cancer Res. Treat. 123 (2010) 113–124. [DOI] [PubMed] [Google Scholar]
- [6].Reedijk M, Pinnaduwage D, Dickson RC, Mulligan AM, Zhang H, Bull SR, et al. , JAG1 expression is associated with a basal phenotype and recurrence in lymph node-negative breast cancer, Breast Cancer Res. Treat. 111 (2008) 439–448. [DOI] [PubMed] [Google Scholar]
- [7].Giuli MV, Giuliani E, Screpanti I, Bellavia D, Checquolo S, Notch signaling activation as a hallmark for triple-negative breast cancer subtype, J. Oncol. 2019 (2019) 8707053. [DOI] [PMC free article] [PubMed] [Google Scholar]
- [8].Izrailit J, Berman HK, Datti A, Wrana JL, Reedijk M, High throughput kinase inhibitor screens reveal TRB3 and MAPK-ERK/TGFbeta pathways as fundamental Notch regulators in breast cancer, PNAS 110 (2013) 1714–1719. [DOI] [PMC free article] [PubMed] [Google Scholar]
- [9].Yamamoto M, Taguchi Y, Ito-Kureha T, Semba K, Yamaguchi N, Inoue J, NF-kappaB non-cell-autonomously regulates cancer stem cell populations in the basal-like breast cancer subtype, Nat. Commun. 4 (2013) 2299. [DOI] [PubMed] [Google Scholar]
- [10].Shimizu M, Cohen R, Goldvasser P, Berman H, Virtanen C, Reedijk M, Plasminogen activator uPA is a direct transcriptional target of the JAG1-Notch receptor signaling pathway in breast cancer, Cancer Res. 71 (2011) 277–286. [DOI] [PubMed] [Google Scholar]
- [11].Sansone P, Storci G, Giovannini C, Pandolfi S, Pianetti S, Taffurelli M, et al. , p66Shc/Notch-3 interplay controls self-renewal and hypoxia survival in human stem/progenitor cells of the mammary gland expanded in vitro as mammospheres, Stem Cells (Dayton, Ohio) 25 (2007) 807–815. [DOI] [PubMed] [Google Scholar]
- [12].Sansone P, Storci G, Tavolari S, Guarnieri T, Giovannini C, Taffurelli M, et al. , IL-6 triggers malignant features in mammospheres from human ductal breast carcinoma and normal mammary gland, J. Clin. Investig. 117 (2007) 3988–4002. [DOI] [PMC free article] [PubMed] [Google Scholar]
- [13].Dontu G, Jackson KW, McNicholas E, Kawamura MJ, Abdallah WM, Wicha MS, Role of Notch signaling in cell-fate determination of human mammary stem/progenitor cells, Breast Cancer Res.: BCR 6 (2004) R605–R615. [DOI] [PMC free article] [PubMed] [Google Scholar]
- [14].Rouras T, Pal R, Vaillant F, Harburg G, Asselin-Labat ML, Oakes SR, et al. , Notch signaling regulates mammary stem cell function and luminal cell-fate commitment, Cell Stem Cell 3 (2008) 429–441. [DOI] [PubMed] [Google Scholar]
- [15].Harrison H, Farnie G, Howell SJ, Rock RE, Stylianou S, Brennan KR, et al. , Regulation of breast cancer stem cell activity by signaling through the Notch4 receptor, Cancer Res. 70 (2010) 709–718. [DOI] [PMC free article] [PubMed] [Google Scholar]
- [16].Simoes RM, O’Brien CS, Eyre R, Silva A, Yu L, Sarmiento-Castro A, et al. , Antiestrogen resistance in human breast tumors is driven by JAG1-NOTCH4-dependent cancer stem cell activity, Cell Rep. 12 (2015) 1968–1977. [DOI] [PMC free article] [PubMed] [Google Scholar]
- [17].Farnie G, Clarke RR, Mammary stem cells and breast cancer-role of Notch signalling, Stem Cell Rev. 3 (2007) 169–175. [DOI] [PubMed] [Google Scholar]
- [18].Reedijk M, Odorcic S, Chang L, Zhang H, Miller N, McCready DR, et al. , High-level coexpression of JAG1 and NOTCH1 is observed in human breast cancer and is associated with poor overall survival, Cancer Res. 65 (2005) 8530–8537. [DOI] [PubMed] [Google Scholar]
- [19].Mod. Pathol. 20 (6) (2007) 685–693, 10.1038/modpathol.3800785. [DOI] [PubMed] [Google Scholar]
- [20].Reischlag TV, Luis Morales J, Hollingshead RD, Perdew GH, The aryl hydrocarbon receptor complex and the control of gene expression, Crit. Rev. Eukaryot. Gene Expr. 18 (2008) 207–250. [DOI] [PMC free article] [PubMed] [Google Scholar]
- [21].Safe S, Lee SO, Jin UH, Role of the aryl hydrocarbon receptor in carcinogenesis and potential as a drug target, Toxicol. Sci.: Off. J. Soc. Toxicol. 135 (2013) 1–16. [DOI] [PMC free article] [PubMed] [Google Scholar]
- [22].Denison MS, Soshilov AA, He G, DeGroot DE, Zhao R, Exactly the same but different: promiscuity and diversity in the molecular mechanisms of action of the aryl hydrocarbon (dioxin) receptor, Toxicol. Sci.: Off. J. Soc. Toxicol. 124 (2011) 1–22. [DOI] [PMC free article] [PubMed] [Google Scholar]
- [23].Safe S, Qin C, McDougal A, Development of selective aryl hydrocarbon receptor modulators for treatment of breast cancer, Expert Opin. Invest. Drugs 8 (1999) 1385–1396. [DOI] [PubMed] [Google Scholar]
- [24].Zhang S, Kim K, Jin UH, Pfent C, Cao H, Amendt R, et al. , Aryl hydrocarbon receptor agonists induce microRNA-335 expression and inhibit lung metastasis of estrogen receptor negative breast cancer cells, Mol. Cancer Ther. 11 (2012) 108–118. [DOI] [PMC free article] [PubMed] [Google Scholar]
- [25].Zhang S, Lei P, Liu X, Li X, Walker K, Kotha L, et al. , The aryl hydrocarbon receptor as a target for estrogen receptor-negative breast cancer chemotherapy, Endocr. Relat. Cancer 16 (2009) 835–844. [DOI] [PMC free article] [PubMed] [Google Scholar]
- [26].Safe S, Astroff R, Harris M, Zacharewski T, Dickerson R, Romkes M, et al. , 2,3,7,8-Tetrachlorodibenzo-p-dioxin (TCDD) and related compounds as anti-oestrogens: characterization and mechanism of action, Pharmacol. Toxicol. 69 (1991) 400–409. [DOI] [PubMed] [Google Scholar]
- [27].Chen I, McDougal A, Wang F, Safe S, Aryl hydrocarbon receptor-mediated antiestrogenic and antitumorigenic activity of diindolylmethane, Carcinogenesis 19 (1998) 1631–1639. [DOI] [PubMed] [Google Scholar]
- [28].Safe S, Wormke M, Inhibitory aryl hydrocarbon receptor-estrogen receptor alpha cross-talk and mechanisms of action, Chem. Res. Toxicol. 16 (2003) 807–816. [DOI] [PubMed] [Google Scholar]
- [29].Wormke M, Stoner M, Saville R, Walker K, Abdelrahim M, Rurghardt R, et al. , The aryl hydrocarbon receptor mediates degradation of estrogen receptor alpha through activation of proteasomes, Mol. Cell. Riol. 23 (2003) 1843–1855. [DOI] [PMC free article] [PubMed] [Google Scholar]
- [30].Sorg O, AhR signalling and dioxin toxicity, Toxicol. Lett. 230 (2014) 225–233. [DOI] [PubMed] [Google Scholar]
- [31].Van den Rerg M, Rirnbaum LS, Denison M, De Vito M, Far land W, Feeley M, et al. , The 2005 World Health Organization reevaluation of human and Mammalian toxic equivalency factors for dioxins and dioxin-like compounds, Toxicol. Sci.: Off. J. Soc. Toxicol. 93 (2006) 223–241. [DOI] [PMC free article] [PubMed] [Google Scholar]
- [32].Warner M, Mocarelli P, Samuels S, Needham L, Rrambilla P, Eskenazi R, Dioxin exposure and cancer risk in the Seveso Women’s Health Study, Environ. Health Perspect. 119 (2011) 1700–1705. [DOI] [PMC free article] [PubMed] [Google Scholar]
- [33].Jin UH, Lee SO, Safe S, Aryl hydrocarbon receptor (AHR)-active pharmaceuticals are selective AHR modulators in MDA-MR-468 and RT474 breast cancer cells, J. Pharmacol. Exp. Ther. 343 (2012) 333–341. [DOI] [PMC free article] [PubMed] [Google Scholar]
- [34].Safe S, Han H, Goldsby J, Mohankumar K, Chapkin RS, Aryl hydrocarbon receptor (AhR) ligands as selective AhR modulators: genomic studies, Curr. Opin. Toxicol. 11–12 (2018) 10–20. [DOI] [PMC free article] [PubMed] [Google Scholar]
- [35].Ogura J, Miyauchi S, Shimono K, Yang S, Gonchigar S, Ganapathy V, et al. , Carbidopa is an activator of aryl hydrocarbon receptor with potential for cancer therapy. Biochem. J. 474 (2017) 3391–3402. [DOI] [PubMed] [Google Scholar]
- [36].Henry EC, Bemis JC, Henry O, Kende AS, Gasiewicz TA, A potential endogenous ligand for the aryl hydrocarbon receptor has potent agonist activity in vitro and in vivo, Arch. Biochem. Biophys. 450 (2006) 67–77. [DOI] [PubMed] [Google Scholar]
- [37].Song J, Clagett-Dame M, Peterson RE, Hahn ME, Westler WM, Sicinski RR, et al. , A ligand for the aryl hydrocarbon receptor isolated from lung, PNAS 99 (2002) 14694–14699. [DOI] [PMC free article] [PubMed] [Google Scholar]
- [38].Cheng J, Li W, Kang B, Zhou Y, Song J, Dan S, et al. , Tryptophan derivatives regulate the transcription of Oct4 in stem-like cancer cells, Nat. Commun. 6 (2015) 7209. [DOI] [PMC free article] [PubMed] [Google Scholar]
- [39].Wang K, Li Y, Jiang YZ, Dai CF, Patankar MS, Song JS, et al. , An endogenous aryl hydrocarbon receptor ligand inhibits proliferation and migration of human ovarian cancer cells, Cancer Lett. 340 (2013) 63–71. [DOI] [PMC free article] [PubMed] [Google Scholar]
- [40].Tomblin JK, Arthur S, Primerano DA, Chaudhry AR, Fan J, Denvir J, et al. , Aryl hydrocarbon receptor (AHR) regulation of L-type amino acid transporter 1 (LAT-1) expression in MCF-7 and MDA-MB-231 breast cancer cells, Biochem. Pharmacol. 106 (2016) 94–103. [DOI] [PMC free article] [PubMed] [Google Scholar]
- [41].Schust J, Sperl R, Hollis A, Mayer TU, Rerg T, Stattic: a small-molecule inhibitor of STAT3 activation and dimerization, Chem. Biol. 13 (2006) 1235–1242. [DOI] [PubMed] [Google Scholar]
- [42].Rarhoover MA, Hall JM, Greenlee WF, Thomas RS, Aryl hydrocarbon receptor regulates cell cycle progression in human breast cancer cells via a functional interaction with cyclin-dependent kinase 4, Mol. Pharmacol. 77 (2010) 195–201. [DOI] [PubMed] [Google Scholar]
- [43].Hall JM, Rarhoover MA, Kazmin D, McDonnell DP, Greenlee WF, Thomas RS, Activation of the aryl-hydrocarbon receptor inhibits invasive and metastatic features of human breast cancer cells and promotes breast cancer cell differentiation, Mol. Endocrinol. (Baltimore, Md). 24 (2010) 359–369. [DOI] [PMC free article] [PubMed] [Google Scholar]
- [44].Shao S, Zhao X, Zhang X, Luo M, Zuo X, Huang S, et al. , Notch1 signaling regulates the epithelial-mesenchymal transition and invasion of breast cancer in a Slug-dependent manner, Mol. Cancer 14 (2015) 28. [DOI] [PMC free article] [PubMed] [Google Scholar]
- [45].Sahlgren C, Gustafsson MV, Jin S, Poellinger L, Lendahl U, Notch signaling mediates hypoxia-induced tumor cell migration and invasion, PNAS 105 (2008) 6392–6397. [DOI] [PMC free article] [PubMed] [Google Scholar]
- [46].Tomblin JK, Salisbury TB, Insulin like growth factor 2 regulation of aryl hydrocarbon receptor in MCF-7 breast cancer cells, Biochem. Biophys. Res. Commun. 443 (2014) 1092–1096. [DOI] [PMC free article] [PubMed] [Google Scholar]
- [47].Wormke M, Stoner M, Saville R, Safe S, Crosstalk between estrogen receptor alpha and the aryl hydrocarbon receptor in breast cancer cells involves unidirectional activation of proteasomes, FEBS Lett. 478 (2000) 109–112. [DOI] [PubMed] [Google Scholar]
- [48].Kobayashi T, Mizuno H, Imayoshi I, Furusawa C, Shirahige K, Kageyama R, The cyclic gene Hes1 contributes to diverse differentiation responses of embryonic stem cells, Genes Dev. 23 (2009) 1870–1875. [DOI] [PMC free article] [PubMed] [Google Scholar]
- [49].Kobayashi T, Kageyama R, Hes1 regulates embryonic stem cell differentiation by suppressing Notch signaling, Genes Cells: Devoted Mol. Cell. Mech. 15 (2010) 689–698. [DOI] [PMC free article] [PubMed] [Google Scholar]
- [50].Yang Z, Guo L, Liu D, Sun L, Chen H, Deng Q, et al. , Acquisition of resistance to trastuzumab in gastric cancer cells is associated with activation of IL-6/STAT3/ Jagged-l/Notch positive feedback loop, Oncotarget. 6 (2015) 5072–5087. [DOI] [PMC free article] [PubMed] [Google Scholar]
- [51].Palomero T, Lim WK, Odom DT, Sulis ML, Real PJ, Margolin A, et al. , NOTCH1 directly regulates c-MYC and activates a feed-forward-loop transcriptional network promoting leukemic cell growth, PNAS 103 (2006) 18261–18266. [DOI] [PMC free article] [PubMed] [Google Scholar]
- [52].Favata MF, Horiuchi KY, Manos EJ, Daulerio AJ, Stradley DA, Feeser WS, et al. , Identification of a novel inhibitor of mitogen-activated protein kinase kinase, J. Biol. Chem. 273 (1998) 18623–18632. [DOI] [PubMed] [Google Scholar]
- [53].Ranerjee K, Resat H, Constitutive activation of STAT3 in breast cancer cells: a review, Int. J. Cancer J. Int. du Cancer 138 (2016) 2570–2578. [DOI] [PMC free article] [PubMed] [Google Scholar]


