Abstract
An image mapping spectrometer (IMS) is a snapshot hyperspectral imager that simultaneously captures both the spatial (x, y) and spectral (λ) information of incoming light. The IMS maps a three-dimensional (3D) datacube (x, y, λ) to a two-dimensional (2D) detector array (x, y) for parallel measurement. To reconstruct the original 3D datacube, one must construct a lookup table that connects voxels in the datacube and pixels in the raw image. Previous calibration methods suffer from either low speed or poor image quality. We herein present a slit-scan calibration method that can significantly reduce the calibration time while maintaining high accuracy. Moreover, we quantitatively analyzed the major artifact in the IMS, the striped image, and developed three numerical methods to correct for it.
1. INTRODUCTION
Hyperspectral imaging (HSI) has been extensively employed in myriad applications such as biomedical imaging [1–4], remote sensing [5–8], and machine vision [9–11]. HSI is a functional combination of a two-dimensional (2D) camera and a spectrometer, acquiring both the spatial (x, y) and spectral (λ) information of a scene. While capable of acquiring a hyperspectral datacube (x, y, λ), most existing HSI techniques require scanning either in the spatial [12–14] or spectral domain [15–18]. Because only a small portion of the hyperspectral datacube can be seen at a time by these imagers [19], the scanning mechanism significantly jeopardizes the light throughput and hinders the imaging of dynamics.
In contrast, snapshot HSI techniques overcome the above limitations by acquiring all hyperspectral datacube voxels in parallel [20,21]. Representative techniques encompass coded aperture snapshot spectral imaging (CASSI) [22–24], computed tomography imaging spectrometry (CTIS) [25,26], and image mapping spectrometry (IMS) [27–34]. While all these techniques operate in a snapshot format, only IMS features 100% light throughput while maintaining a compact form factor and high computational efficiency, making it suitable for real-time field imaging applications.
The IMS operates by mapping a three-dimensional (3D) hyperspectral datacube to a 2D camera through an angled mirror array, referred to as an image mapper. The underlying principle is detailed in Ref. [35]. In brief, the image mapper splits an image into strips and redirects them to different locations on the 2D camera. Because the mirror facets on the array have varied tilts, a blank region is created between adjacent sliced images. A dispersion element, such as a prism, then disperses the sliced image and fills this blank region with spectrum. In this way, each pixel on the 2D camera is encoded with the unique spatial and spectral information of the original hyperspectral datacube, and remapping generates the image.
The image remapping during reconstruction requires a lookup table, which connects each voxel in the hyperspectral datacube to a pixel in the raw image. The calibration of this lookup table is nontrivial. Previous calibration methods, such as edge alignment [27] and point scan [35], suffer from either low image quality or slow calibration speed. For example, the edge alignment method images a target with a sharp edge and constructs the lookup table by aligning the image slices with respect to this feature. Because image slices experience different levels of distortion, the lookup table built upon local feature alignment cannot be faithfully applied to the global image, leading to a reduced image quality and spectrum accuracy [36]. In contrast, the point scan method builds the table by illuminating one datacube voxel at a time, followed by pinpointing the centroid of the impulse response image on the 2D camera. Because the calibration is performed on each datacube voxel, the reconstructed image quality and spectral accuracy are superior to those achieved by edge alignment. However, due to the reliance on scanning, the calibration process is time consuming, typically taking hundreds of hours to complete.
To overcome the above limitations, we herein present a fast and accurate calibration method, which we refer to as slit scan. Slit scan can correct for the same image slice distortion as with point scan; however, it does not have the need for prolonged 2D scanning, thereby significantly reducing the calibration time to tens of minutes. Moreover, we quantitatively analyzed the primary artifact in the IMS, the striped image, and we provide several solutions to correct for it. The radiometric calibration was detailed in Ref. [35].
2. OPTICAL SETUP OF THE IMS
A schematic of the IMS is shown in Fig. 1. The mapping mirror is placed at a plane that is conjugate with both the object and the 2D camera. The object is imaged by an objective lens and a collecting lens, and an intermediate image is formed at the image mapper. As a result, each mirror facet on the image mapper reflects a slice of the intermediate image. Because the angles of the mirror facets are grouped into periodic blocks [29], the reflected image slices are directed to the correspondent subfields. In our experiment, a total of 480 image slices are grouped into 5 × 8 subfields, each containing 12 image slices. Within a subfield, there is a blank region between adjacent image slices. After passing through a dispersion prism, the spectrum of each image slice occupies this blank region. The dispersion prism array in our system works in a visible light range (400–700 nm) as detailed in Ref. [31]. A bandpass filter is used to limit the input spectral range, thereby avoiding spectral overlap between adjacent sliced images. A microlens array with 5 × 8 microlenses is used to focus the final image on the camera. Under monochromatic illumination, the width of each image slice is one pixel on the camera, and the width of a blank region between two adjacent image slices is 40 pixels. Under white-light illumination, these 40 pixels represent 40 different color channels in the visible spectral range. The parameters of the IMS are detailed in Refs. [31,32].
Fig. 1.
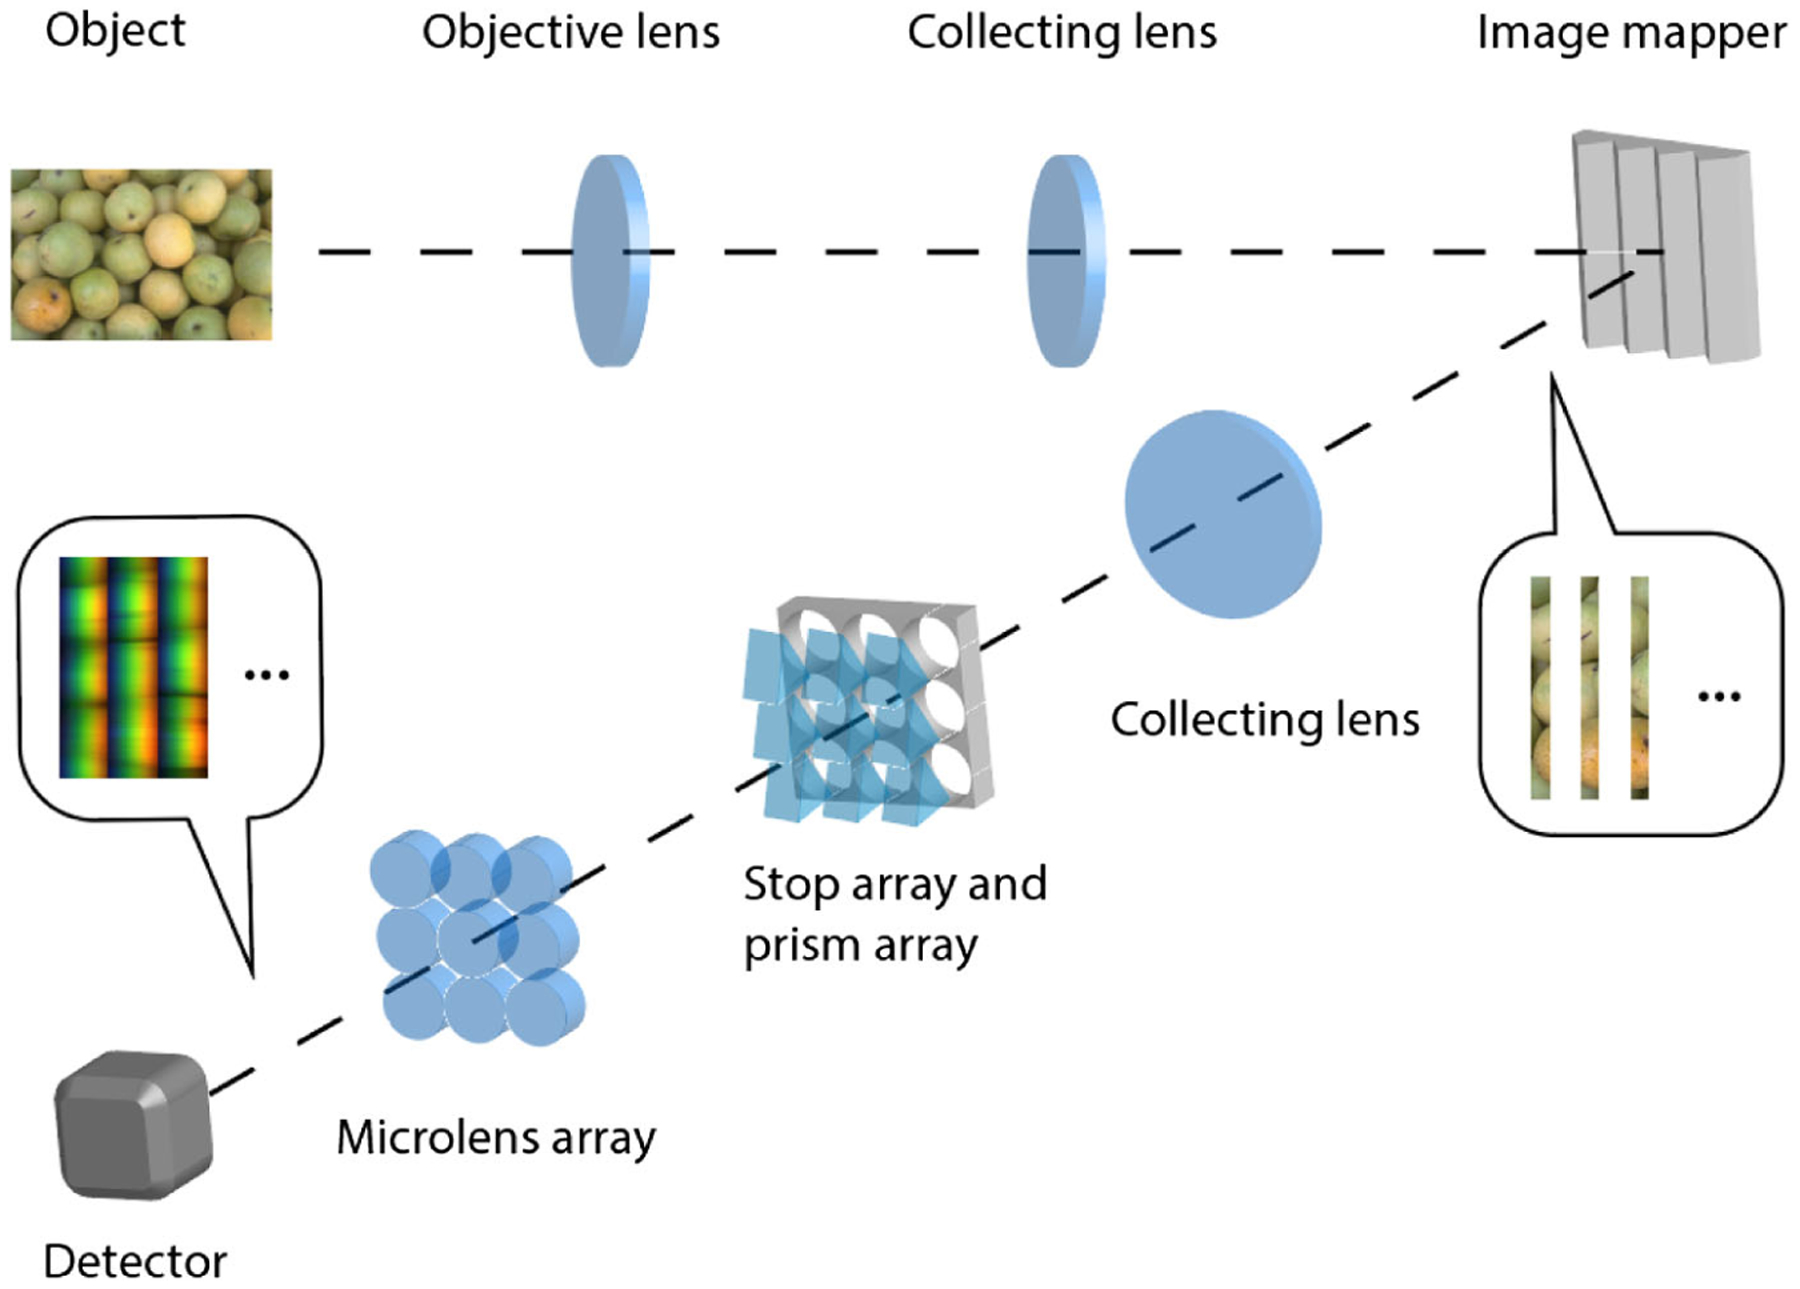
Schematic of the IMS.
3. IMS CALIBRATION METHODS
The IMS maps a 3D hyperspectral datacube (x, y, λ) to a 2D image (x, y) on the camera. If the point spread function (PSF) of the IMS is a delta function, the mapping between a voxel in the datacube and a pixel in the image would be one to one. The imaging process can be described by the following equation:
| (1) |
where I is the captured 2D raw image, O is the 3D hyperspectral datacube, and T is the mapping matrix of the IMS. The goal of calibration is to determine the inverse of T. With that being known, the original datacube can be easily reconstructed based on
| (2) |
In practice, rather than calculating the mapping matrix, we experimentally build a lookup table, which contains the index of each voxel in the datacube and locations of the corresponding pixel in the image.
As mentioned, two methods have been developed for constructing the lookup table: edge alignment [27] and point scan [35]. Edge alignment simultaneously extracts all image slices in the raw image and rearranges them to form a spectral channel. In this case, the lookup table contains the locations of image slices both in the datacube and in the raw image. The sequence of image slices in the raw image is determined by the design of the image mapper, and such knowledge is known as priors. Due to distortion, the image slices in the raw image are tilted and exhibit different magnification ratios. A common approach to extracting these image slices is to capture an empty field under uniform illumination, followed by image binarization. After this procedure, each image slice is isolated, and a simple curve fitting reveals the shape contour. Next, a target with a sharp edge that is perpendicular to the mirror facet direction is imaged, and all the resultant images slices are aligned with respect to this edge. The image processing pipeline is illustrated in Fig. 2(a). Finally, the starting coordinates of the aligned image slices in the raw image are recorded to fill in the lookup table.
Fig. 2.
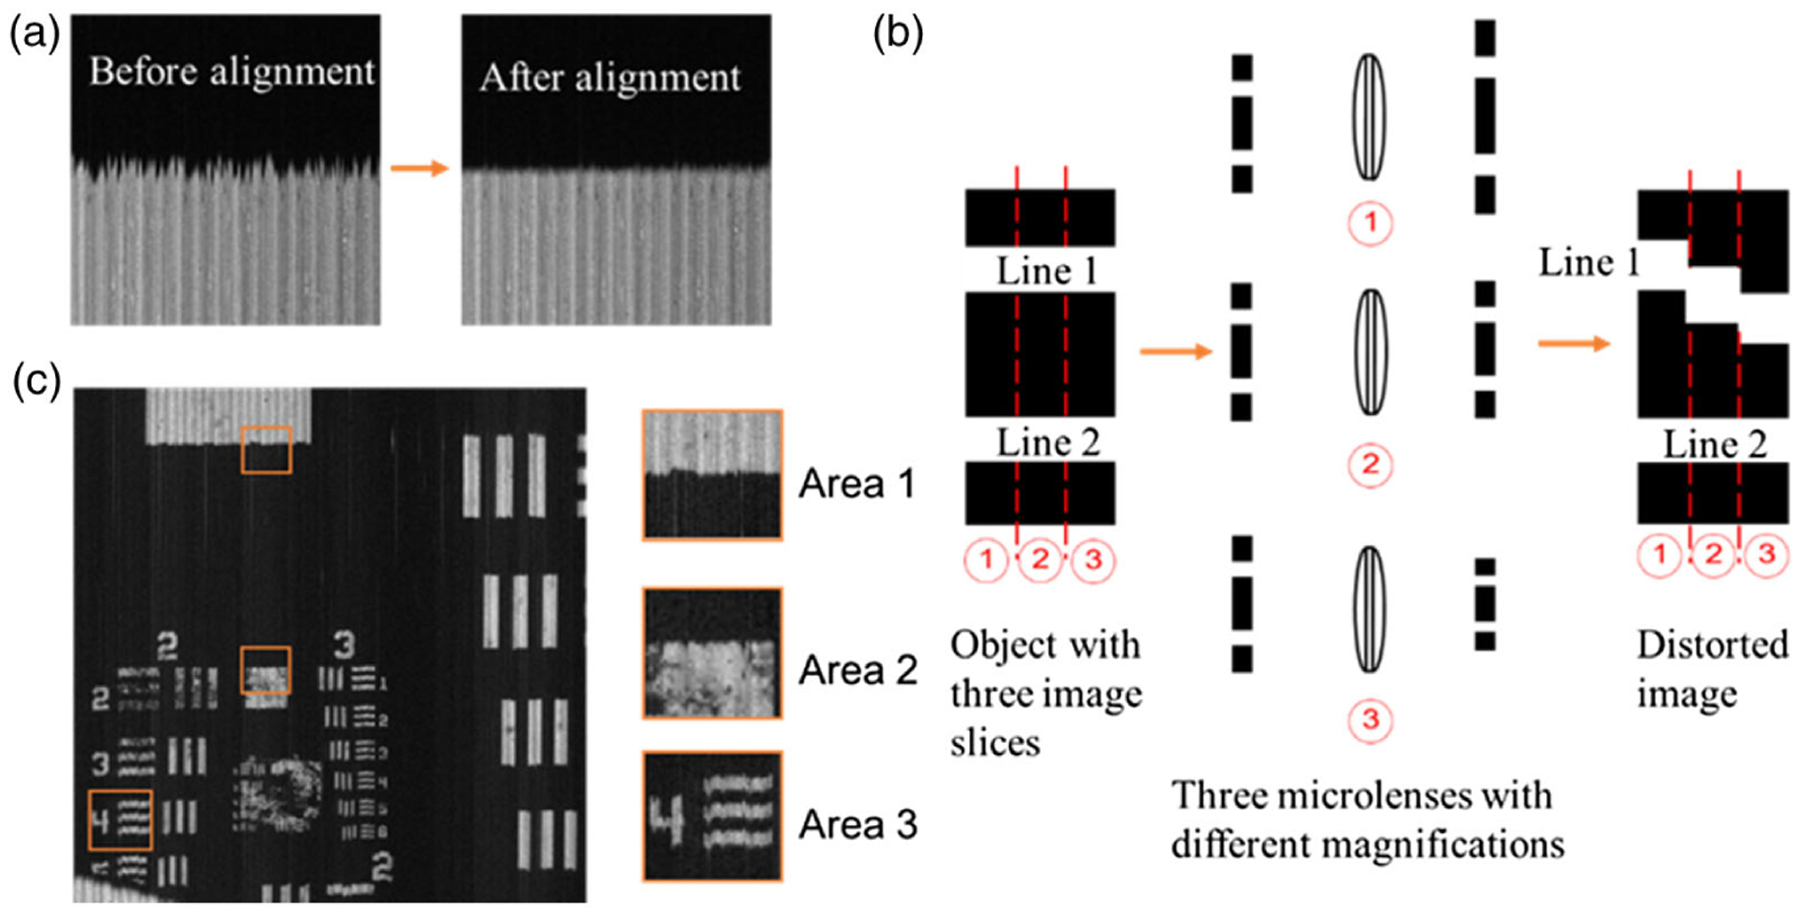
Edge alignment method. (a) Image slices alignment. (b) Distorted edge due to the variation in the magnification ratio of adjacent image slices. (c) Reconstructed image at 532 nm. The three insets show the zoomed view of the boxed areas. Area 3 shows the bars of group 2 element 4, indicating 5.66 lp/mm.
Despite being fast in implementation, the major drawback of edge alignment is that the reconstructed image suffers from distorted edges. This is because the image slices experience varied magnification ratios when they pass through different lenslets in the array. As illustrated in Fig. 2(b), an object consisting of two straight lines is divided into three image slices. These three adjacent image slices are imaged by different lenslets with varied magnification ratios. If we extract these imaged slices from the raw image and align them with respect to line 2, the edge of line 1 would appear distorted. We further show a real-world example when imaging a US air force (USAF) resolution target. The reconstructed image through edge alignment is shown in Fig. 2(c). Area 3 shows the bars of group 2 element 4, indicating 5.66 lp/mm. All image slices were aligned with respect to a horizontal line that crosses the central field of view (FOV).As shown in the zoomed inset, Area 2 is close to the reference edge and thus has a high reconstruction quality. In contrast, Area 1 and Area 3 located at the upper and bottom FOV exhibit distorted edges.
In comparison, the point scan method constructs the lookup table by illuminating hypercube voxels one at a time and recording the location of the impulse response on the 2D camera. To calibrate the entire hypercube, one must raster scan a monochromatic point light source—such as a pinhole illuminated by narrow band light—across the 2D FOV. Because this method experimentally identifies the mapping relation for each voxel in the hypercube, the errors induced by the image distortion and ununiform magnification are corrected. However, the implementation of the point scan method is time consuming. For example, to calibrate an image of 500 × 500 pixels at a given wavelength, a total of 139 his needed, using a dwell time of 2 sat each scanning step.
4. SLIT-SCAN CALIBRATION
To overcome previous limitations and enable fast and accurate IMS calibration, we herein present slit scan, a method that maintains the accuracy of point scan but at a speed orders of magnitude faster. Simply put, rather than scanning a point source across the 2D FOV, we use a uniformly illuminated slit and scan only the axis parallel to the mirror facet to construct the lookup table.
Our method has been made possible due to the unique optical architecture of the IMS, where the image mapper slices the incident field into strips and projects them to different locations of the detector array. Upon illumination by a thin slit source that is perpendicular to the slice direction, the image of the slit is divided into a series of points, which create impulse responses separable in space in the raw image. Pinpointing the centroids of these impulse responses then generates the lookup table for all the voxels illuminated in parallel. In essence, this method uses the image mapper to perform point scans on all the points of the slit simultaneously.
The experimental setup is shown in Fig. 3(a). A 10 μm optical slit (Lenox Laser, G-SLIT-1-DISC-10) was placed at the object plane of the IMS, where the intermediate image of the slit at the image mapper is perpendicular to the mirror facet. The slit is mounted on a motorized translation stage (Thorlabs, MTS50-Z8) for scanning. We chose the width of the slit to match with the size of a resolution cell at the object plane. The image of the slit is then sliced by the mirror facets. Because the length of the slit is longer than the width of the FOV, each mirror facet creates a unique response on the detector array. A representative raw image is shown in Fig. 3(b). By scanning the slit along the direction of mirror facets and recording the locations of all responses, we obtained a complete lookup table.
Fig. 3.
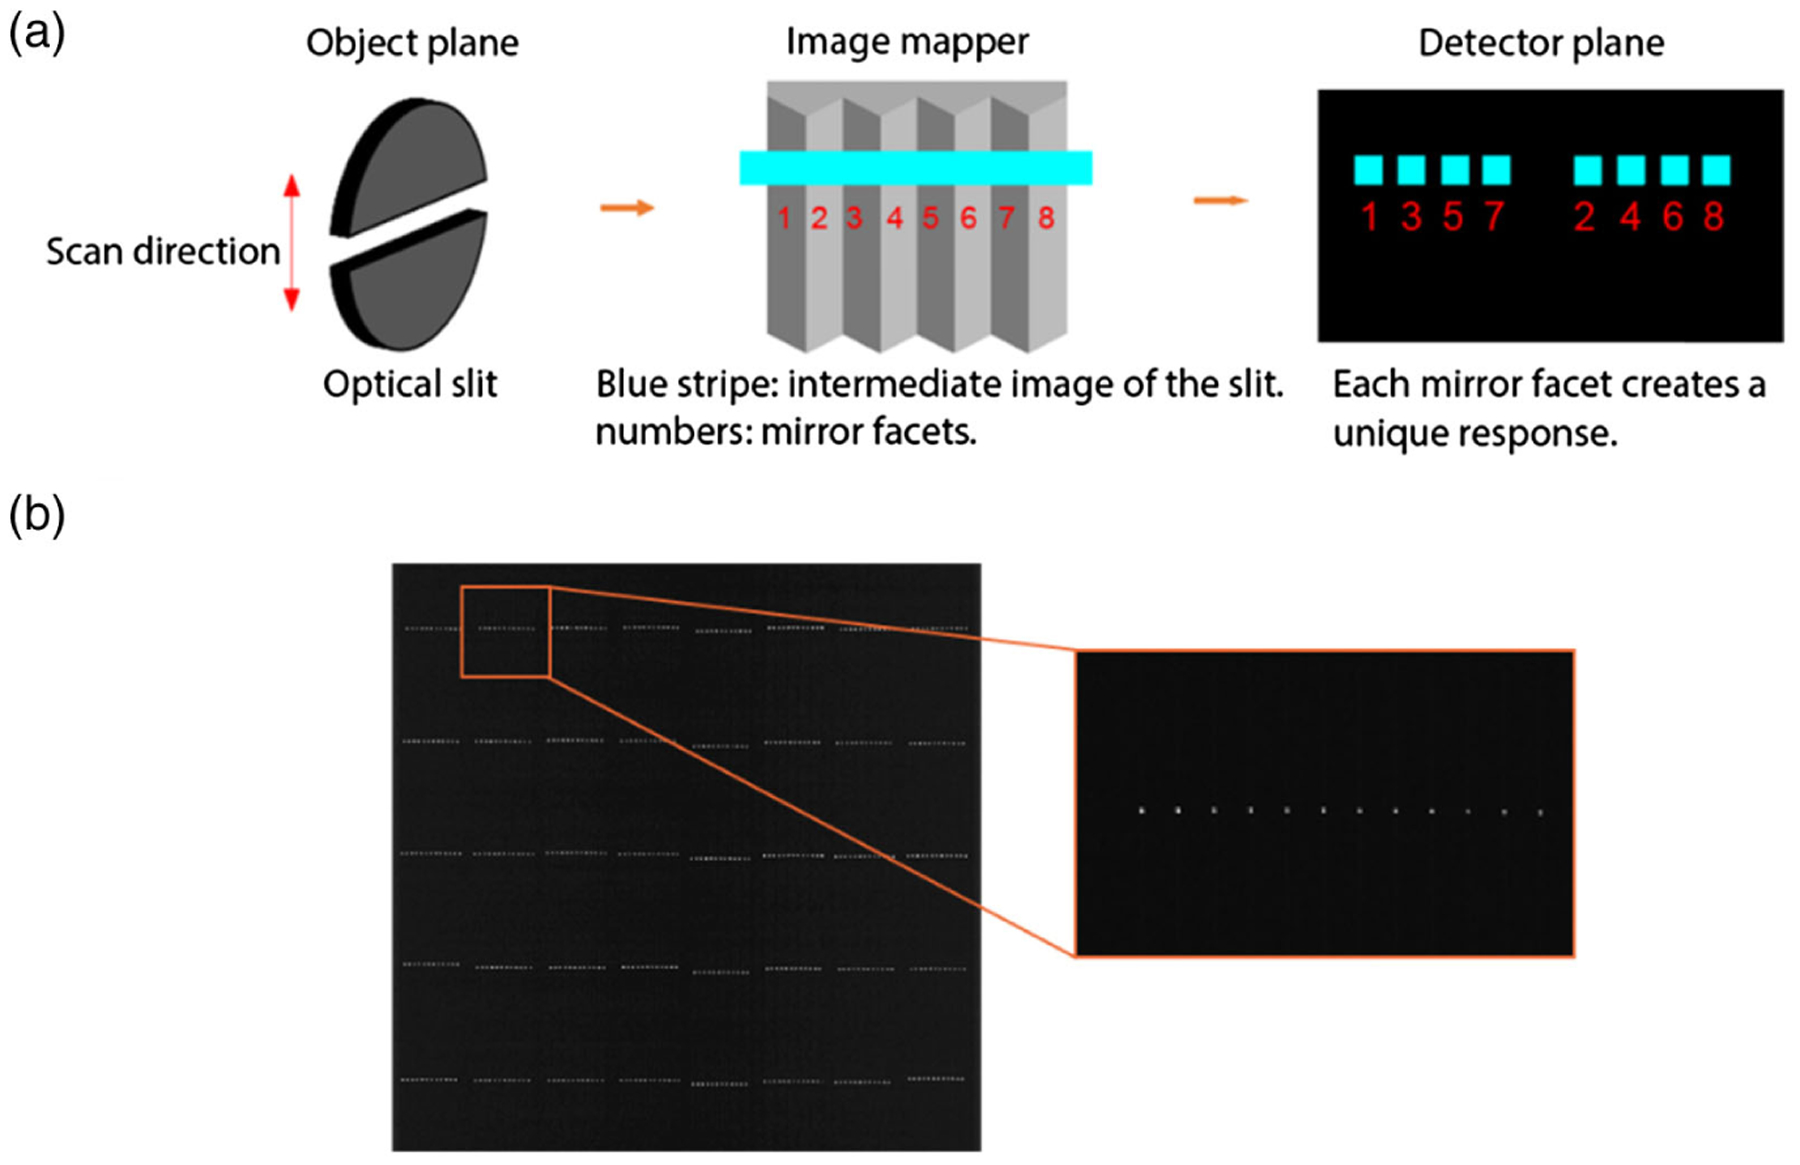
Slit-scan method. (a) Image formation. (b) Mapped image of the sliced slit.
Compared with the edge alignment and point scan methods, slit scan offers two prominent advantages. First, slit scan calibrates the mapping for each voxel in the hypercube, and therefore it automatically corrects for the image distortion and varied magnification in the IMS. A reconstructed image of a USAF resolution target at 532 nm is shown in Fig. 4. Compared with the result obtained through edge alignment in Fig. 3(d), the reconstructed image shows no distorted edges. To quantitatively compare the reconstruction quality, we calculated the standard deviation of the edge in Area 1 from both results. Here we define the standard deviation of a horizontal edge as the variation in its pixel index along the vertical axis. The standard deviation (STD) of the edge reconstructed through edge alignment is 1.47 pixels, compared with 0.55 pixels obtained through slit scan, the reconstruction accuracy has been imporved by 60%. The STD of the edge in Area 2 is 0.31 pixel, and the STD of the edge of one bar in Area 3 is 0.56 pixel in Fig. 4. Second, slit scan can be implemented and performed rapidly. In our experiment, a wavelength layer of the hypercube (i.e., a spectral channel image) has 445 × 480 voxels, where 480 is the total number of mirror facets on the image mapper. Because the scanning pitch is one voxel, only 445 steps are required. Again with a 2 s dwell time for each step, calibration takes ~30 min to build the entire lookup table. In contrast, the point scan method needs to scan a total of 445 × 480 steps. Therefore, our method increases the calibration speed by a factor of 480, which is equal to the total number of mirror facets on the image mapper. This dramatic speed improvement, which we refer to as the parallelization advantage, becomes more critical for high-resolution IMSs with a large number of mirror facets.
Fig. 4.
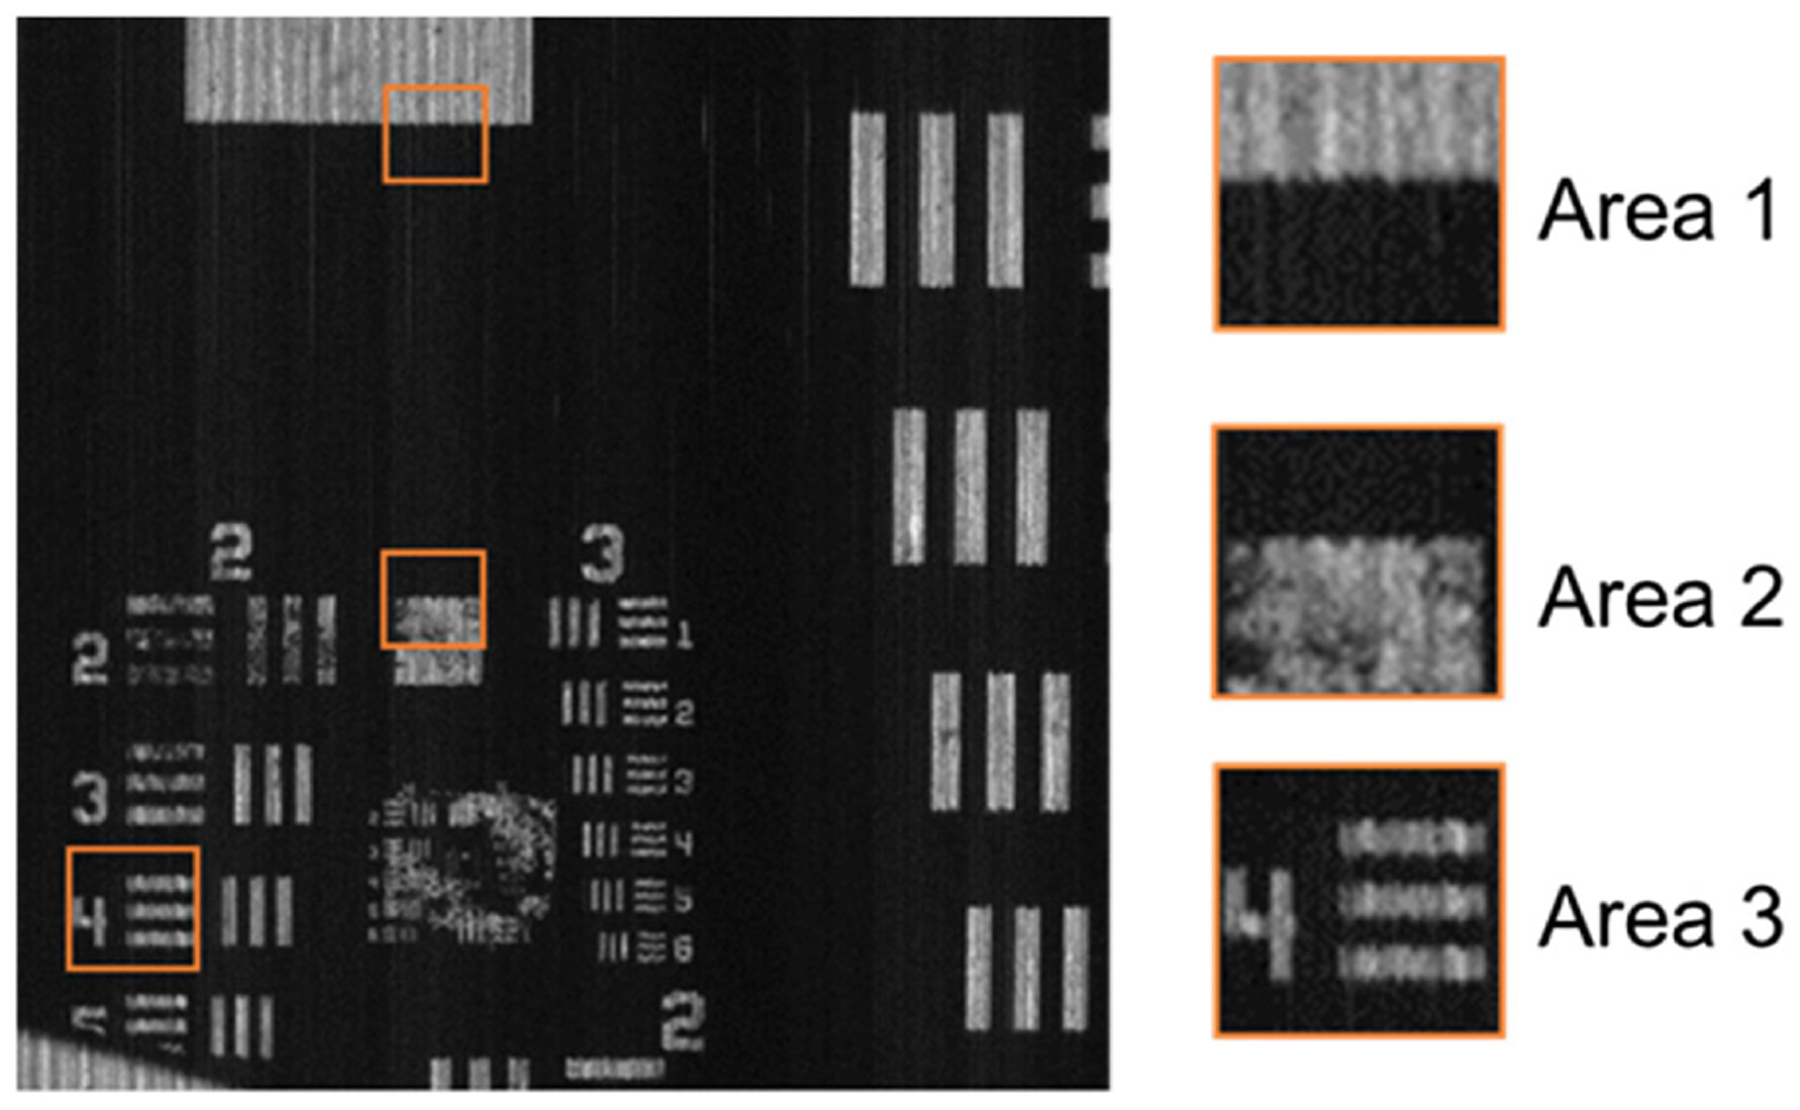
Reconstructed image of a USAF resolution target through slit-scan calibration. Compared to the result in Fig. 2(c), the standard deviation of the edge in Area 1 decreases from 1.47 pixels to 0.55 pixels.
Note that it is sufficient to calibrate the lookup table at only one wavelength. As shown in Fig. 5(a), the white stripe represents an image slice on the camera, and it disperses horizontally, as denoted by the rainbow area. The lookup table at other wavelengths can be obtained by shifting the recorded locations of responses horizontally, and the shifted distance in pixels can be deduced from the chromatic dispersion curve of the prism as shown in Fig. 5(b). In order to measure the dispersion curve, an optical pinhole was placed at the object plane, and six color filters (Thorlabs, FB470–10, FB510–10, FB550–10, FB590–10, FB630–10, and FB670–10) were used sequentially to find the relationship between the wavelength and pixel locations. Considering the spectral resolution of the current system (~5 nm), a spectral bandwidth of 10 nm occupies only two pixels, leading to a negligible localization error. To further minimize the localization error of the wavelength responses, we performed multiple measurements and averaging. The final curve was fitted with a second-order polynomial based on following approxiamtion:
| (3) |
where λ is wavelength of light, δ(λ) is the wavelength-dependent dispersion, n(λ) is the refractive index of the prism glass, and α is the angle of the prism. The relation between reflective index and wavelength follows the equation
| (4) |
where A and B are constant coefficients.
Fig. 5.
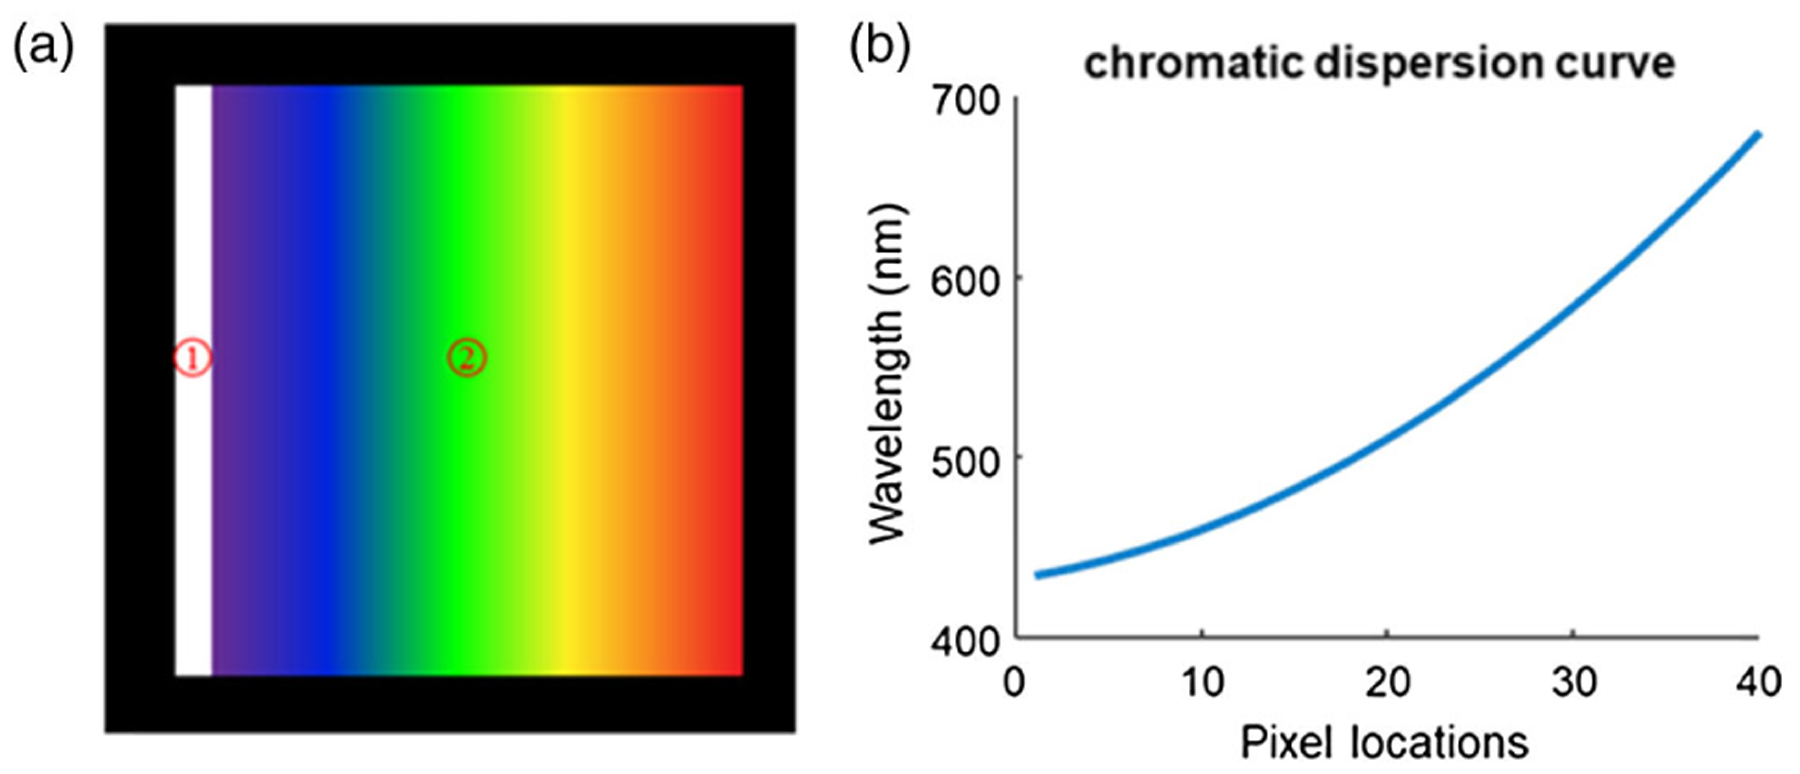
Wavelength calibration. (a) Illustration of a dispersed image slice on the detector. Area 1 is the image slice, and Area 2 is the spectrum. (b) Dispersion curve of the prism.
5. STRIPE ARTIFACT
Although the slit-scan method can generate an accurate lookup table, the process itself does not correct for the image slices’ intensity variations due to the reflectivity difference of the mirror facets and the defocus of the microlens array. The subsequently induced artifact, referred to as the striped image, degrades the image quality in the IMS. Here we develop a mathematical model to quantitatively analyze this artifact.
We describe the effect of mirror reflectivity and microlens defocus on the image quality using the line spread function (LSF). Although other optical aberrations may also exist in the system, we found that the defocus is the dominant factor that accounts for the stripped image artifacts in the IMS [27]. The image of a mirror facet can be written as
| (5) |
where Lm(x) is the LSF of the mth mirror facet, denotes convolution, and depicts the geometric image of the mth mirror facet. Two representative LSFs are shown in Fig. 6(a). The intensity profile along the dashed line is plotted in Fig. 6(b). The full width at half-maxima (FWHM) of these two LSFs are different. To reconstruct a spectral channel image, our calibration method extracts the peak light intensity from only one pixel and maps it back to the hypercube. The peak intensity is sensitive to both the microlens defocus and mirror reflectivity on the image mapper: the low mirror reflectivity reduces the total intensity of the LSF; on the other hand, the defocus broadens the LSF and, therefore, decreases the peak intensity. The nonuniform peak intensity introduces the stripe artifact. As an example, we show an image of a sharp edge under uniform illumination in Fig. 6(c).
Fig. 6.
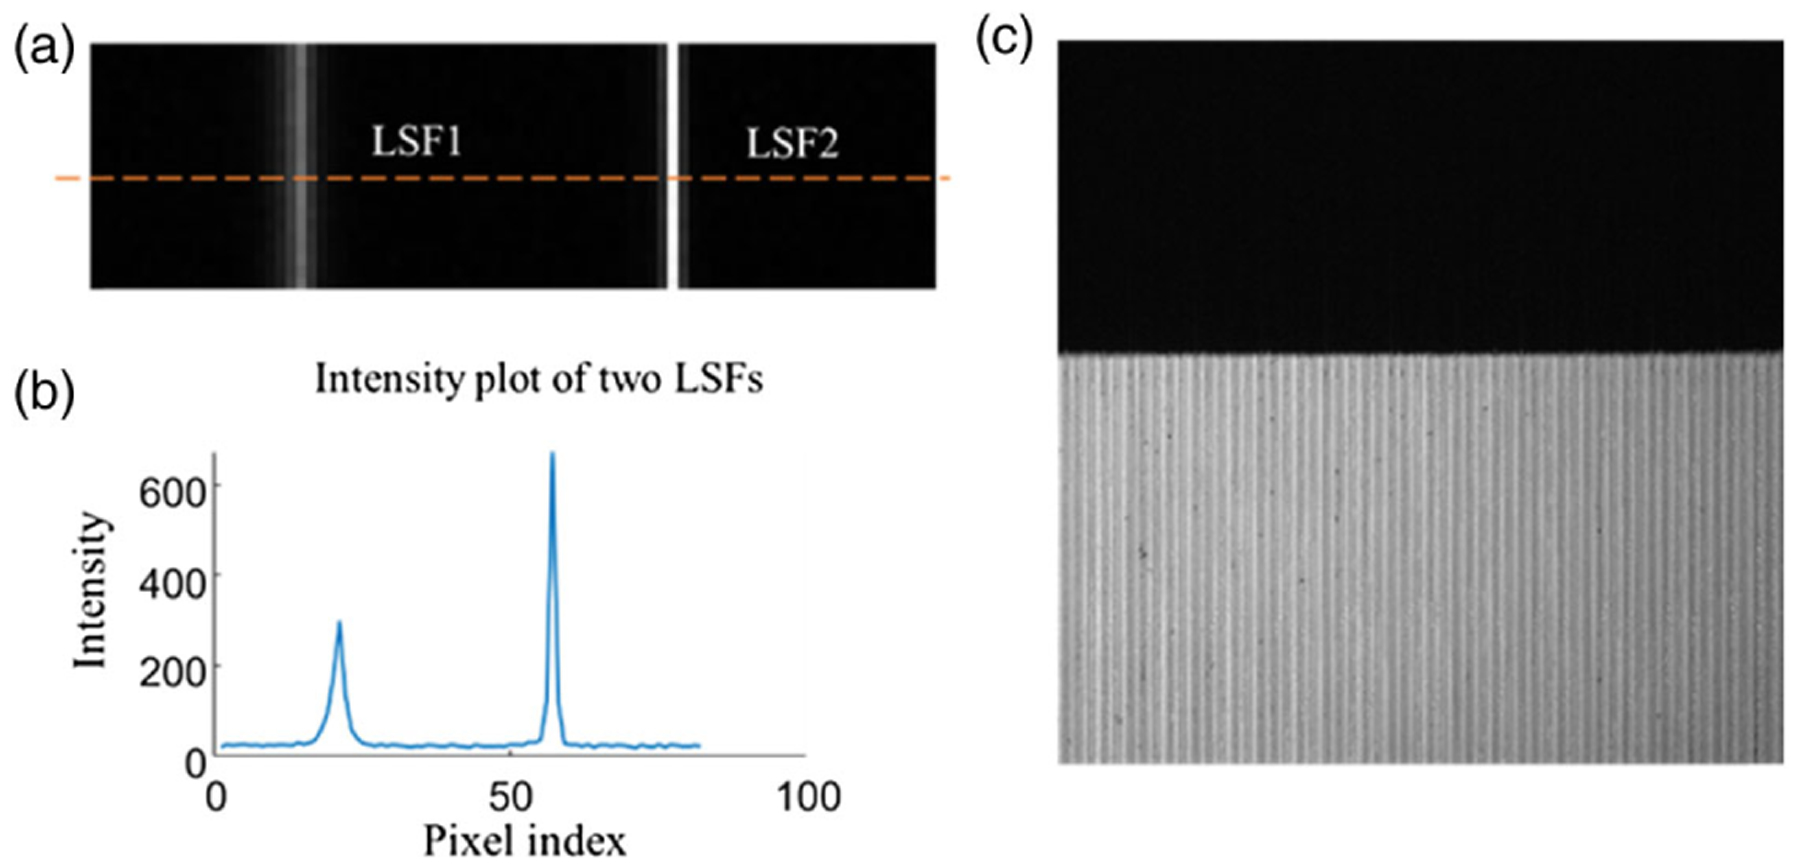
Line spread functions and stripe artifact. (a) Two example line spread functions (LSFs). (b) Intensity plot along the orange dashed line in (a). (c) Image of a sharp edge with stripe artifacts.
To remove the stripe artifact, we developed three methods: Fourier domain filtering, deconvolution, and datacube normalization. Fourier domain filtering is a fast method to remove the stripes of specific frequencies. The image processing pipeline is shown in Fig. 7(a). The dominant striping frequency is associated with the periodic mirror facet blocks on the image mapper as illustrated in Fig. 7(b). For simplicity, we assume the image mapper consists of three mirror facet blocks, each containing two mirror facets. The incident field is then divided into six image slices. Slices 1, 3, and 5 are imaged by microlens 1, while slices 2, 4, and 6 are imaged by microlens 2. If the two microlenses have different levels of defocus, the intensities of these two groups of image slices would be different. Therefore, the dominant frequency of stripes in the reconstructed image is determined by the total number of mirror facets within one block. By applying notch filters in the Fourier domain, we can readily remove the correspondent stripes. However, this method cannot eliminate stripes at other frequencies, which are induced by the nonuniform reflectivity of the mirror facets and the nonuniform defocus of the microlenses. Additionally, the spatial frequency information at the same frequency range as that of the stripes is lost. As an example, we applied the Fourier domain filtering method to the image in Fig. 6(c), and the result is shown in Fig. 7(c). The stripes within the white area are effectively removed.
Fig. 7.
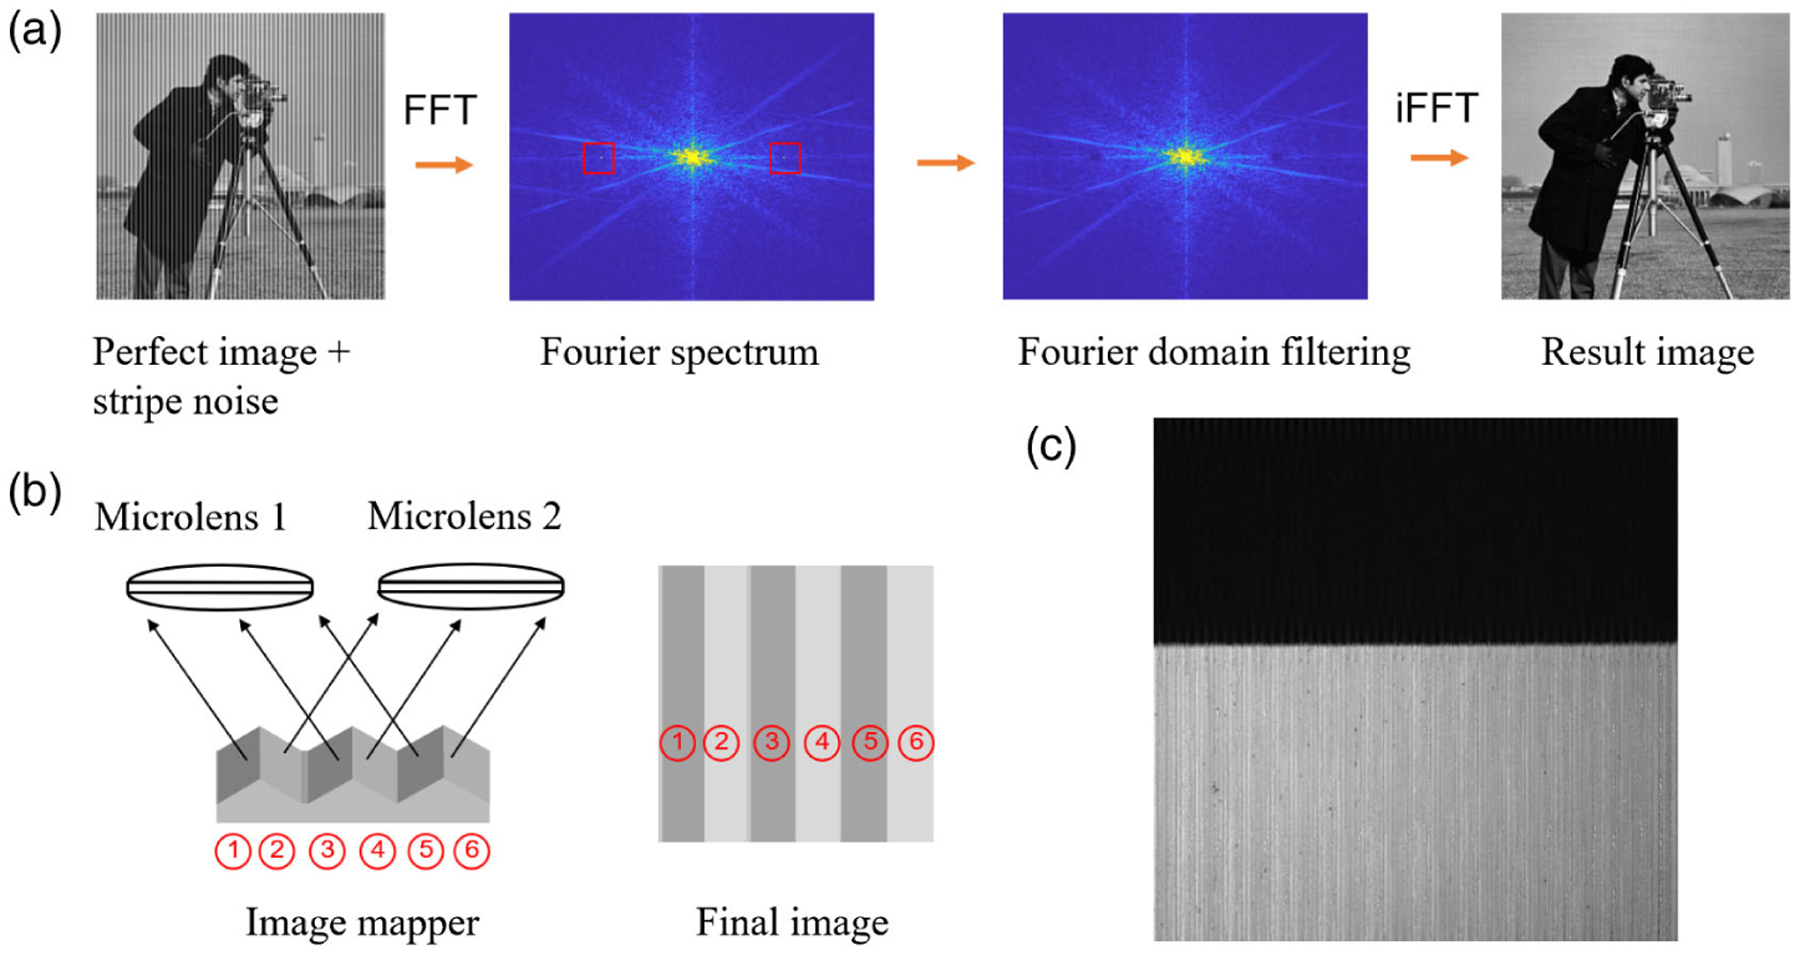
Image processing pipeline of Fourier domain filtering. (a) Schematic pipeline. FFT, Fourier transform; iFFT, inverse Fourier transform; red square, notch filter. The frequencies within the notch filter are blocked. (b) The dominant frequency of stripes is determined by the total number of mirror facets within one block. (c) Fourier domain filtering result of the image shown in Fig. 6(c). The stripes within the white area are effectively removed.
In contrast, deconvolution can suppress the stripe artifacts at all frequencies. By imaging an empty field illuminated by a monochromatic light source, we can simultaneously measure all combined LSFs in the raw image. This knowledge can then be used for deconvolution, compensating for the intensity variation of image slices. Additionally, deconvolution increases the spectral resolution by reducing the width of LSFs, which is also the impulse response of monochromatic light. However, because deconvolution is sensitive to noise, the performance of this method is highly dependent on the signal-to-noise ratio (SNR) of the image.
Lastly, datacube normalization captures an empty field under uniform illumination and constructs a reference hypercube. Dividing the real measurement by this reference cube yields the corrected results. The image processing pipeline is shown in Fig. 8. This method is essentially a simplified version of deconvolution, provided that the LSF of an image slice is a delta function. Therefore, the results are accurate only when the defocus is negligible.
Fig. 8.
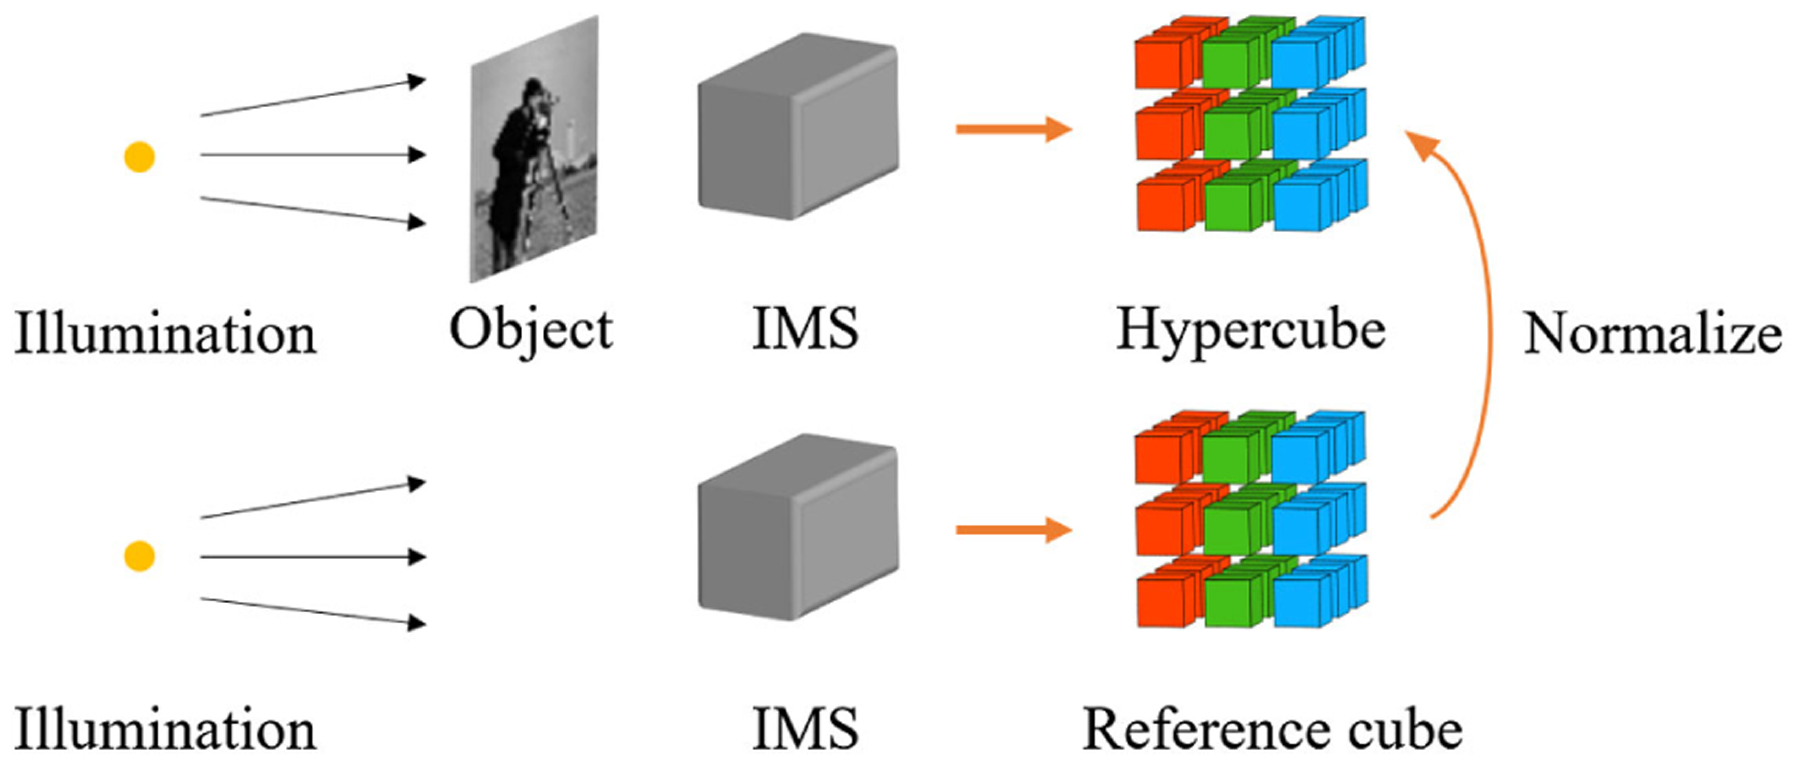
Image processing pipeline of datacube normalization.
To quantitively evaluate the stripe artifacts in the IMS, we define the striping factor as:
| (6) |
for an image corresponding to an empty field under uniform illumination. Here mean is the mean intensity of the image and std is the standard deviation. The quotient c is zero if the image has no stripe artifact. In order to compare the performance of the proposed methods, we simulated an IMS with different levels of Gaussian noise and defocus. The Gaussian noise has a zero mean, and its standard deviation is normalized by the peak intensity in the image slice without any defocus or noise. Other simulation parameters and representative results are summarized in Table 1. We simulated a transparent object that alters the spectrum of the original illumination, and we generated three raw images: a reference image corresponding to an empty field uniformly illuminated by a light source with a rectangular spectrum centered at 532 nm and with a 50 nm bandwidth, an image that contains the LSFs under monochromatic illumination, and an image with the transparent object with a Gaussian transmission spectrum centered at 532 nm and with a 12 nm FWHM. Next we reconstructed a spectral channel image at 532 nm and corrected for the stripe artifact using the three methods (Fourier domain filter, deconvolution, and datacube normalization). We calculated the metric c before and after we applied the correction. As shown in Table 1, Fourier domain filtering becomes more effective along with an increase in defocus, as it removes the dominant stripes introduced by the microlens array. Deconvolution outperforms other methods when the noise level is low, and datacube normalization fails when defocus is large.
Table 1.
Parameters and Stripe Artifact Correction Results of a Simulated IMS
| Wavelength | 532 nm |
| Number of microlenses | 40 |
| Image slice per microlens | 12 |
| NA of microlens | 0.125 |
| Pixel pitch of the camera | 7.4 μm |
| Reflectivity of mirror facets | Uniform distribution from 95% to 100% |
| Defocus ofmicrolenses | Gaussian distribution, mean = 0, standard deviation = σ |
| Method Name | Gaussian Noise Standard Deviation | Defocus σ (in mm) | Striping Factor c (before) | Striping Factor c (after) | Striping Factor Change (in Percent) |
|---|---|---|---|---|---|
| Fourier domain filtering | 0 | 0.05 | 0.0158 | 0.0148 | −6.33% |
| 0 | 0.1 | 0.022 | 0.0188 | −14.55% | |
| 0 | 0.2 | 0.0615 | 0.0433 | −29.59% | |
| 0.01 | 0.1 | 0.0244 | 0.0215 | −11.89% | |
| 0.1 | 0.1 | 0.1062 | 0.1056 | −0.57% | |
| Deconvolution | 0 | 0.05 | 0.0158 | 0 | −100% |
| 0 | 0.1 | 0.0221 | 0 | −100% | |
| 0 | 0.2 | 0.0615 | 0.0012 | −98.05% | |
| 0.01 | 0.1 | 0.0244 | 0.0105 | −56.97% | |
| 0.1 | 0.1 | 0.1062 | 0.1081 | +1.79% | |
| Datacube normalization | 0 | 0.05 | 0.0158 | 0.004 | −74.68% |
| 0 | 0.1 | 0.0221 | 0.0155 | −29.86% | |
| 0 | 0.2 | 0.0615 | 0.0562 | −8.62% | |
| 0.01 | 0.1 | 0.0244 | 0.0213 | −12.7% | |
| 0.1 | 0.1 | 0.1062 | 0.1503 | +41.53% |
Finally, we performed a tolerance analysis for the microlens array defocus based on the criterion defined. We use c < 0.05 as a criterion for acceptable image quality. Here we consider only the defocus and neglect other lens aberrations. To establish the relationship between the defocus of the microlens and the corresponding peak intensity in the image slice, we simulated our system using a wave propagation method, and the result is shown in Fig. 9. The wavelength used for simulation is 532 nm. All intensities were normalized by the peak intensity in the image slice without defocus. Note that the resultant curve is dependent on both the detector pixel size and the numerical aperture (NA) of the microlenses. If defocus exists, the Strehl ratio of the system decreases; however, because the signals measured by a pixel is ensquared energy, the peak intensity of the LSFs may not change as much as the Strehl ratio. On the other hand, for a fixed defocus, a smaller NA microlens has a larger depth of focus. Therefore, the image slice has a higher peak intensity compared to using a large-NA microlens. For our system, the detector pixel size is 7.4 μm, and the NA of the microlens array is 0.125.
Fig. 9.
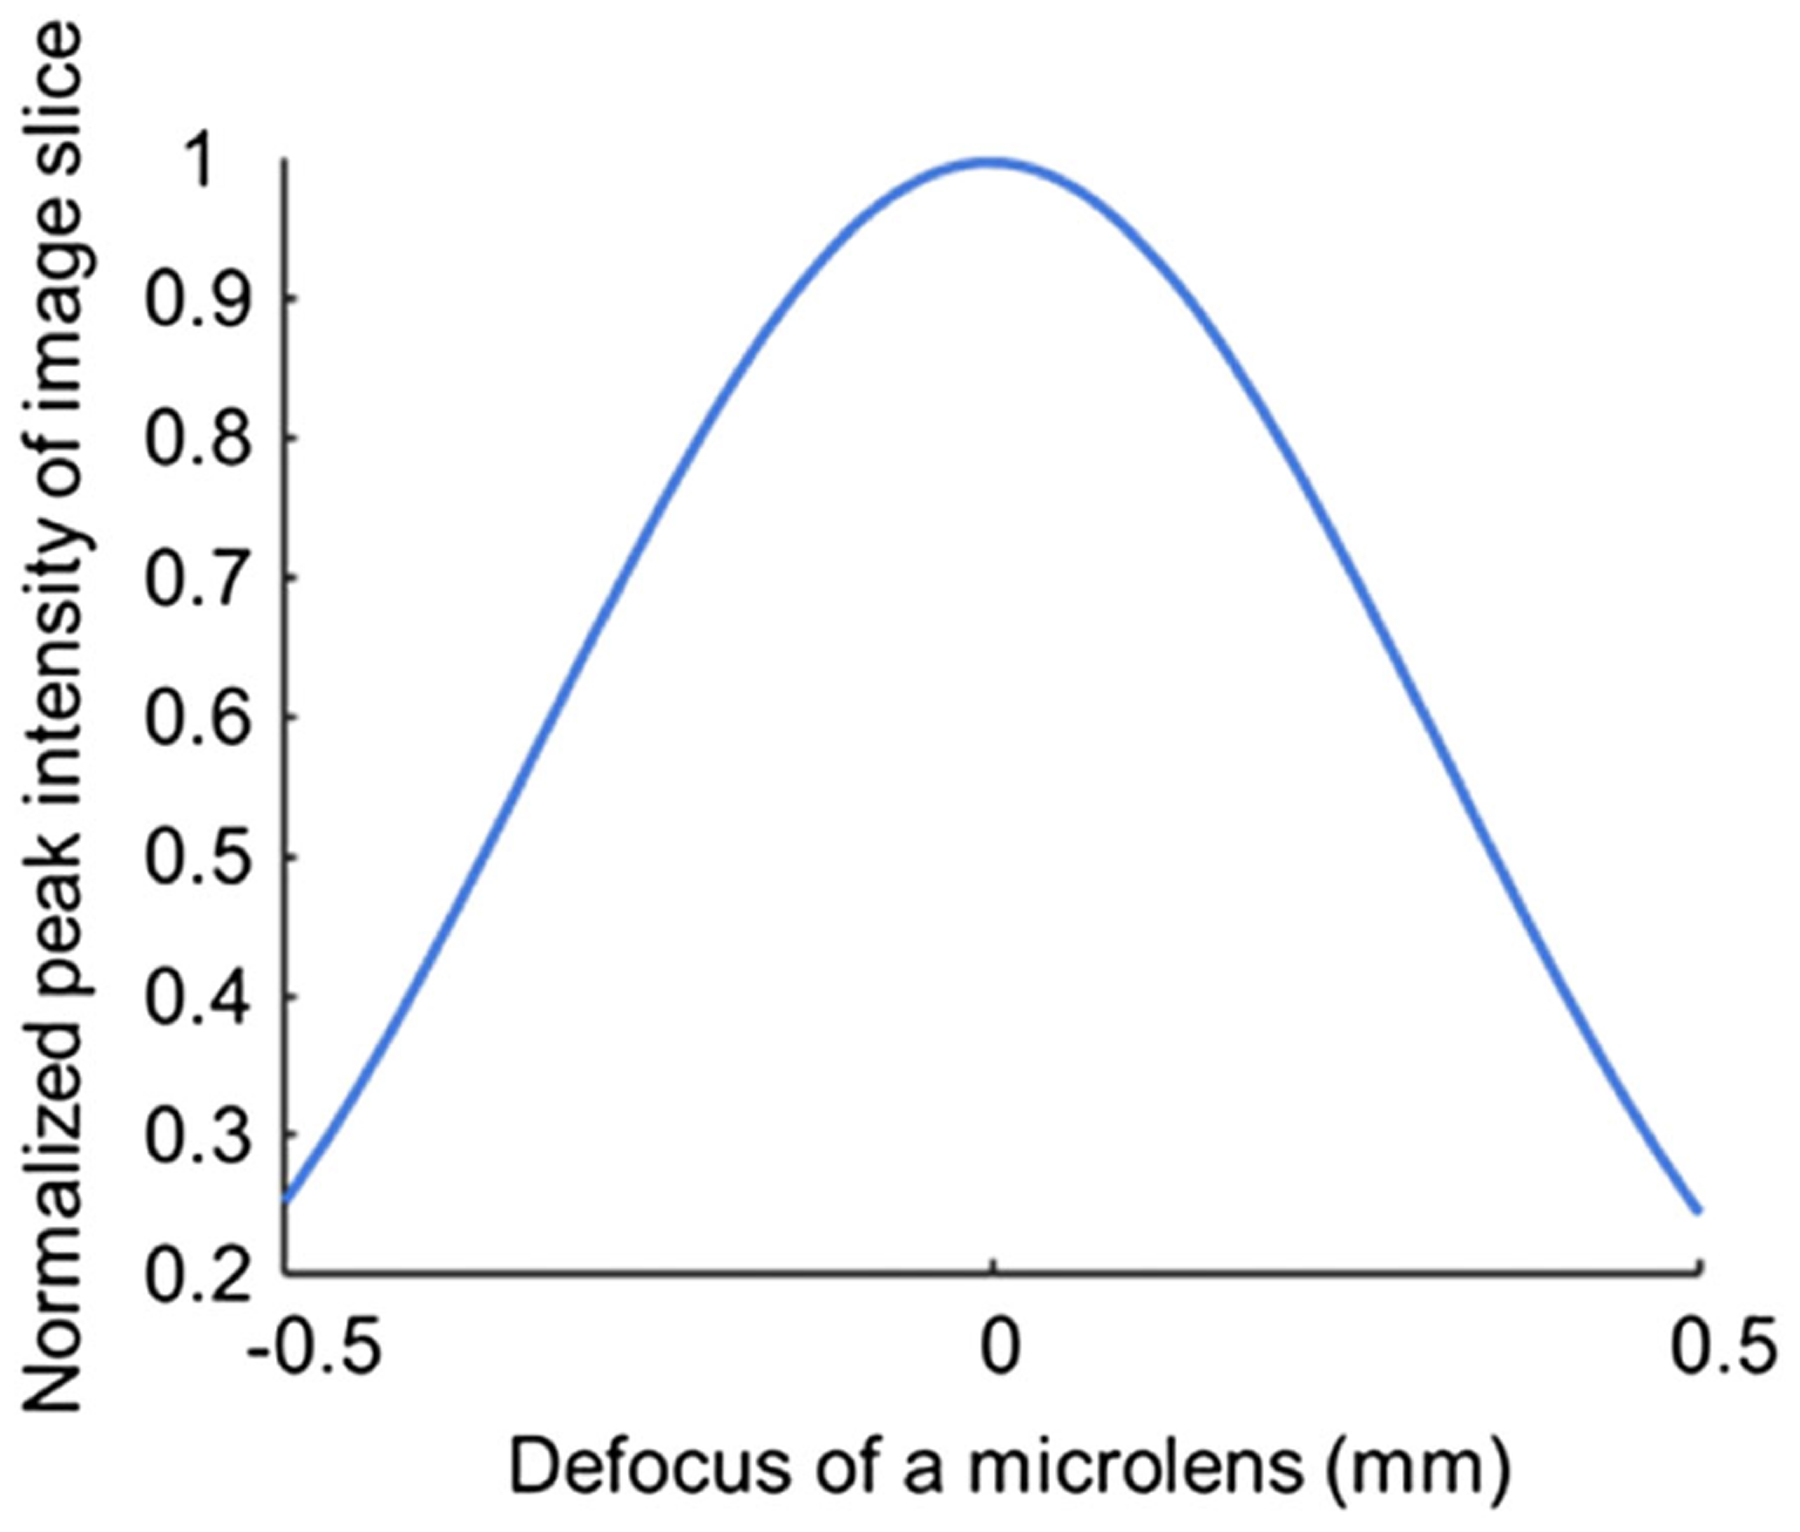
Normalized peak intensity in image slice versus defocus of the microlens.
Next we ran a Monte Carlo simulation. The parameters used for simulation are listed in Table 2. A group of microlenses with different levels of defocus was generated, and the probability density function (PDF) of the defocus of each microlens was assumed as a Gaussian distribution with a zero mean and a σ standard deviation. The number of simulated microlenses in a group is the same as the number of microlenses used in our system. The striping factor c was then calculated for this group of microlenses based on the peak intensities, which can be deduced from the result in Fig. 9. For each σ, we generated 1000 groups of microlenses and calculated corresponding striping factor c. The goal of the simulation is to find a threshold σ, so that 90% of microlens groups meet the acceptable image quality criterion (i.e., c < 0.05). The results are shown in Fig. 10. In our case, the threshold σ is 0.073 mm, indicating that 95% of microlenses should have a defocus of less than 2σ or 0.146 mm if operating the IMS at 532 nm.
Table 2.
Parameters for Monte Carlo Simulation
| Microlens Number | 40 |
|---|---|
| Defocus of microlenses | Gaussian distribution, mean = 0, standard deviation = σ |
| σ range | From 0 to 0.1 mm, step is 0.0005 mm |
| Simulated microlens groups | For each σ, 1000 groups (40 microlenses per group) |
Fig. 10.
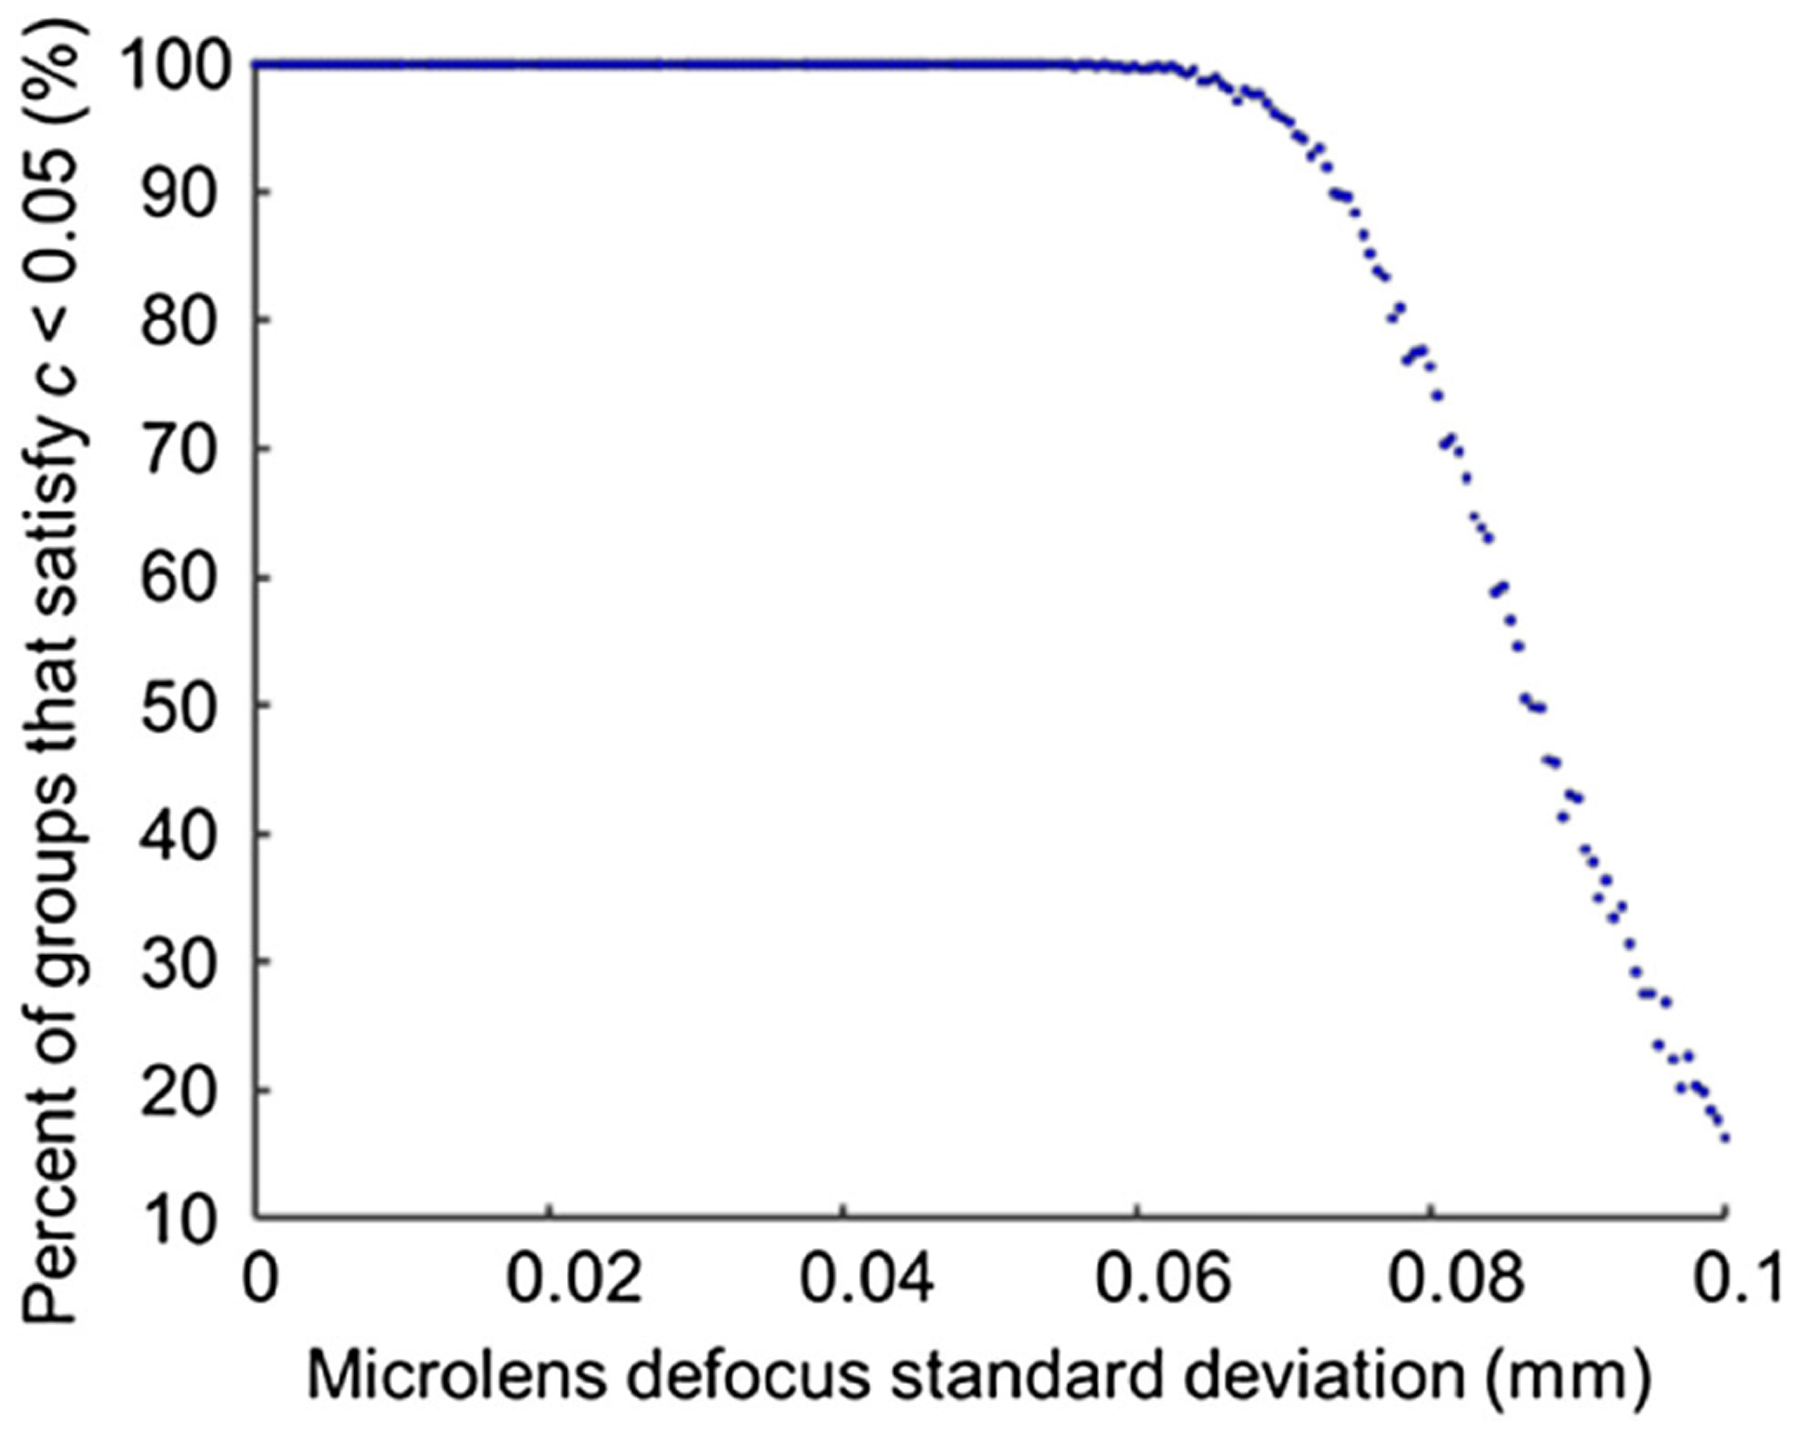
Percent of microlens groups that satisfy c < 0.05 versus standard deviation of the defocus of a microlens.
6. CONCLUSION
In this paper, we developed a slit-scan method for constructing a lookup table for the IMS. By using an optical slit that is perpendicular to the mirror facets and scanning the FOV along one axis, we increased the calibration speed by 2 orders of magnitude. Also, we improved image reconstruction accuracy by 60% when imaging a resolution target as demonstrated in Section 4. Moreover, we proposed three methods to reduce the stripe artifacts, and we compared their pros and cons. We expect this work to lay the foundation for future IMS development.
Funding.
National Science Foundation (1652150); National Institutes of Health (R01EY029397, R35GM128761).
Footnotes
Disclosures. The authors declare no conflicts of interest.
Data Availability
The data that support the plots within this paper and other findings of this study are available from the corresponding author upon reasonable request.
Code Availability
Codes used for this work are available from the corresponding author upon reasonable request.
REFERENCES
- 1.Wang T, Li Q, Li X, Zhao S, Lu Y, and Huang G, “Use of hyperspectral imaging for label-free decoding and detection of biomarkers,” Opt. Lett 38, 1524–1526 (2013). [DOI] [PubMed] [Google Scholar]
- 2.Khoobehi B, Beach JM, and Kawano H, “Hyperspectral imaging for measurement of oxygen saturation in the optic nerve head,” Invest. Ophthalmol. Visual Sci 45, 1464–1472 (2004). [DOI] [PubMed] [Google Scholar]
- 3.Hiraoka Y, Shimi T, and Haraguchi T, “Multispectral imaging fluorescence microscopy for living cells,” Cell Struct. Funct 27, 367–374 (2002). [DOI] [PubMed] [Google Scholar]
- 4.Zimmermann T, Rietdorf J, and Pepperkok R, “Spectral imaging and its applications in live cell microscopy,” FEBS Lett. 546, 87–92 (2003). [DOI] [PubMed] [Google Scholar]
- 5.Goetz AFH, Vane G, Solomon JE, and Rock BN, “Imaging spectrometry for Earth remote sensing,” Science 228, 1147 (1985). [DOI] [PubMed] [Google Scholar]
- 6.Craig SE, Lohrenz SE, Lee Z, Mahoney KL, Kirkpatrick GJ, Schofield OM, and Steward RG, “Use of hyperspectral remote sensing reflectance for detection and assessment of the harmful alga, Karenia brevis,” Appl. Opt 45, 5414–5425 (2006). [DOI] [PubMed] [Google Scholar]
- 7.Garaba SP and Zielinski O, “Comparison of remote sensing reflectance from above-water and in-water measurements west of Greenland, Labrador Sea, Denmark Strait, and West of Iceland,” Opt. Express 21, 15938–15950 (2013). [DOI] [PubMed] [Google Scholar]
- 8.Zhang J, Geng W, Liang X, Li J, Zhuo L, and Zhou Q, “Hyperspectral remote sensing image retrieval system using spectral and texture features,” Appl. Opt 56, 4785–4796 (2017). [DOI] [PubMed] [Google Scholar]
- 9.Ma C, Cao X, Wu R, and Dai Q, “Content-adaptive high-resolution hyperspectral video acquisition with a hybrid camera system,” Opt. Lett 39, 937–940 (2014). [DOI] [PubMed] [Google Scholar]
- 10.Delwiche S and Kim M, “Hyperspectral imaging for detection of scab in wheat, environmental and industrial sensing,” Proc. SPIE 4203, 13–20 (2000). [Google Scholar]
- 11.Safren O, Alchanatis V, Ostrovsky V, and Levi O, “Detection of green apples in hyperspectral images of apple-tree foliage using machine vision,” Trans. ASABE 50, 2303–2313 (2007). [Google Scholar]
- 12.Lawrence KC, Windham WR, Park B, and Buhr RJ, “A hyperspectral imaging system for identification of faecal and ingesta contamination on poultry carcasses,” J. Near Infrared Spectrosc 11, 269–281 (2003). [Google Scholar]
- 13.Abdo M, Badilita V, and Korvink J, “Spatial scanning hyperspectral imaging combining a rotating slit with a Dove prism,” Opt. Express 27, 20290–20304 (2019). [DOI] [PubMed] [Google Scholar]
- 14.Hsu YJ, Chen C-C, Huang C-H, Yeh C-H, Liu L-Y, and Chen S-Y, “Line-scanning hyperspectral imaging based on structured illumination optical sectioning,” Biomed. Opt. Express 8, 3005–3016 (2017). [DOI] [PMC free article] [PubMed] [Google Scholar]
- 15.Cu-Nguyen P-H, Grewe A, Hillenbrand M, Sinzinger S, Seifert A, and Zappe H, “Tunable hyperchromatic lens system for confocal hyperspectral sensing,” Opt. Express 21, 27611–27621 (2013). [DOI] [PubMed] [Google Scholar]
- 16.Gat N, “Imaging spectroscopy using tunable filters: a review,” Proc. SPIE 4056, 50–64 (2000). [Google Scholar]
- 17.Phillips MC and Hô N, “Infrared hyperspectral imaging using a broadly tunable external cavity quantum cascade laser and microbolometer focal plane array,” Opt. Express 16, 1836–1845 (2008). [DOI] [PubMed] [Google Scholar]
- 18.Di Caprio G, Schaak D, and Schonbrun E, “Hyperspectral fluorescence microfluidic (HFM) microscopy,” Biomed. Opt. Express 4, 1486–1493 (2013). [DOI] [PMC free article] [PubMed] [Google Scholar]
- 19.Hagen N, Gao L, Tkaczyk T, and Kester R, “Snapshot advantage: a review of the light collection improvement for parallel high-dimensional measurement systems,” Opt. Eng 51, 111702 (2012). [DOI] [PMC free article] [PubMed] [Google Scholar]
- 20.Gao L and Wang LV, “A review of snapshot multidimensional optical imaging: measuring photon tags in parallel,” Phys. Rep 616, 1–37 (2016). [DOI] [PMC free article] [PubMed] [Google Scholar]
- 21.Hagen N and Kudenov M, “Review of snapshot spectral imaging technologies,” Opt. Eng 52, 090901 (2013). [Google Scholar]
- 22.Wagadarikar A, John R, Willett R, and Brady D, “Single disperser design for coded aperture snapshot spectral imaging,” Appl. Opt 47, B44–B51 (2008). [DOI] [PubMed] [Google Scholar]
- 23.Wagadarikar AA, Pitsianis NP, Sun X, and Brady DJ, “Video rate spectral imaging using a coded aperture snapshot spectral imager,” Opt. Express 17, 6368–6388 (2009). [DOI] [PubMed] [Google Scholar]
- 24.Wang L, Xiong Z, Gao D, Shi G, and Wu F, “Dual-camera design for coded aperture snapshot spectral imaging,” Appl. Opt 54, 848–858 (2015). [DOI] [PubMed] [Google Scholar]
- 25.Descour M and Dereniak E, “Computed-tomography imaging spectrometer: experimental calibration and reconstruction results,” Appl. Opt 34, 4817–4826 (1995). [DOI] [PubMed] [Google Scholar]
- 26.Ford BK, Descour MR, and Lynch RM, “Large-image-format computed tomography imaging spectrometer for fluorescence microscopy,” Opt. Express 9, 444–453 (2001). [DOI] [PubMed] [Google Scholar]
- 27.Gao L, Kester RT, and Tkaczyk TS, “Compact image slicing spectrometer (ISS) for hyperspectral fluorescence microscopy,” Opt. Express 17, 12293–12308 (2009). [DOI] [PMC free article] [PubMed] [Google Scholar]
- 28.Kester RT, Gao L, and Tkaczyk TS, “Development of image mappers for hyperspectral biomedical imaging applications,” Appl. Opt 49, 1886–1899 (2010). [DOI] [PMC free article] [PubMed] [Google Scholar]
- 29.Gao L, Kester RT, Hagen N, and Tkaczyk TS, “Snapshot image mapping spectrometer (IMS) with high sampling density for hyperspectral microscopy,” Opt. Express 18, 14330–14344 (2010). [DOI] [PMC free article] [PubMed] [Google Scholar]
- 30.Gao L, Smith RT, and Tkaczyk TS, “Snapshot hyperspectral retinal camera with the image mapping spectrometer (IMS),” Biomed. Opt. Express 3, 48–54 (2012). [DOI] [PMC free article] [PubMed] [Google Scholar]
- 31.Kester RT, Bedard N, Gao LS, and Tkaczyk TS, “Real-time snapshot hyperspectral imaging endoscope,” J. Biomed. Opt 16, 056005 (2011). [DOI] [PMC free article] [PubMed] [Google Scholar]
- 32.Elliott AD, Gao L, Ustione A, Bedard N, Kester R, Piston DW, and Tkaczyk TS, “Real-time hyperspectral fluorescence imaging of pancreatic -cell dynamics with the image mapping spectrometer,” J. Cell Sci 125, 4833–4840 (2012). [DOI] [PMC free article] [PubMed] [Google Scholar]
- 33.Pawlowski ME, Dwight JG, Nguyen T-U, and Tkaczyk TS, “High performance image mapping spectrometer (IMS) for snapshot hyperspectral imaging applications,” Opt. Express 27, 1597–1612 (2019). [DOI] [PMC free article] [PubMed] [Google Scholar]
- 34.Nguyen T-U, Pierce MC, Higgins L, and Tkaczyk TS, “Snapshot 3D optical coherence tomography system using image mapping spectrometry,” Opt. Express 21, 13758–13772 (2013). [DOI] [PMC free article] [PubMed] [Google Scholar]
- 35.Bedard N, Hagen NA, Gao L, and Tkaczyk TS, “Image mapping spectrometry: calibration and characterization,” Opt. Eng 51, 111711 (2012). [DOI] [PMC free article] [PubMed] [Google Scholar]
- 36.Gao L and Tkaczyk TS, “Correction of vignetting and distortion errors induced by two-axis light beam steering,” Opt. Eng 51, 043203 (2012). [DOI] [PMC free article] [PubMed] [Google Scholar]


