

Abstract
Background
This study aimed to investigate whether an immunohistochemical prognostic model (IHC4 score) can predict the prognosis and the chemotherapy benefit in patients with estrogen receptor‐positive (ER+)/human epidermal growth receptor 2–negative (HER2−) metastatic breast cancer (MBC).
Materials and Methods
We developed a method to calculate the modified IHC4 (mIHC4) scores based on routine pathological reports and compared them with the original IHC4 scores that were much more difficult to calculate. Univariate and multivariate analyses were used to study the prognostic factors of progression‐free survival (PFS) and overall survival (OS). The predictive value of mIHC4 score was also investigated.
Results
The Sun Yat‐sen Memorial Hospital data set included 315 patients with newly diagnosed ER+ MBC with a median follow‐up of 25.6 months. Univariate and multivariate analysis showed that higher mIHC4 scores in metastatic lesions, but not the ones in primary tumors, were significantly associated with worse PFS and OS. The prognostic value of mIHC4 scores for PFS was validated using an independent Chinese Society of Clinical Oncology‐ Breast Cancer (CSCO‐BC) data set. More importantly, subpopulation treatment effect pattern plot analysis showed that first‐line endocrine therapy achieved better PFS and OS than chemotherapy in low‐risk patients with ER+/HER2− MBC, whereas first‐line chemotherapy was associated with improved PFS and OS compared with endocrine therapy in high‐risk ones. The predictive value of mIHC4 score for PFS in selecting first‐line endocrine therapy versus chemotherapy was also confirmed in the CSCO‐BC data set.
Conclusion
mIHC4 scores in metastatic lesions are prognostic for the PFS and OS in patients with ER+ MBC. Low or high mIHC4 score may indicate the survival benefit in choosing first‐line endocrine therapy or chemotherapy in patients with ER+/HER2− MBC, respectively.
Implications for Practice
The modified IHC4 (mIHC4) score is easy to implement and able to predict patients with advanced and/or metastatic breast cancer. In addition, with the help of the mIHC4 score, physicians might be able to recommend chemotherapy or endocrine therapy as the first‐line treatment for patients with high and low risk as predicted by the mIHC4 score.
Keywords: Metastatic breast cancer, IHC4, Chemotherapy, Endocrine therapy
Short abstract
A method to reliably predict prognosis for patients with metastatic breast cancer is needed. This article reports an immunohistochemical prognostic model (IHC4 score) that can predict the prognosis and chemotherapy benefit in patients with ER+/HER2– metastatic breast cancer.
Introduction
Breast cancer is the most common malignancy and the most common cause of cancer‐related deaths in women worldwide [1]. Metastatic breast cancer (MBC), which occurs in 5%–10% of newly diagnosed cases [2] and 20%–40% of patients with early breast cancer (EBC) who relapse [3], is the main cause of death in patients with breast cancer. MBC is incurable, and its treatment is mainly to prolong survival and maintain or improve the quality of life [4, 5, 6]. Although the median overall survival of patients with MBC is only 2–3 years [7], it varied tremendously among the patients. A method that can reliably predict the prognosis of patients with MBC is urgently needed.
About 70%–80% of breast cancers are estrogen receptor (ER) positive [8], for which both endocrine therapy (ET) and chemotherapy (CT) are effective treatments. Results from Cochrane's meta‐analysis showed that ET and CT had no difference regarding the overall survival in patients with MBC [9]. Because ET has significantly less toxicity than CT, most guidelines for MBC recommend ET as the preferred first‐line treatment choice in patients with ER‐positive (ER+)/human epidermal growth receptor 2–negative (HER2−) MBC, even with visceral metastasis [10, 11], and suggested up to three lines of ET before changing to CT [10] in the absence of visceral crisis. However, treatments in real‐world scenarios are quite different from the guideline recommendation. Swallow et al. reported that only 60% of patients with ER+/HER2− MBC received ET as first‐line therapy in the U.S., and 74% of these patients did not receive a second‐line ET [12]. Gao et al. also reported that more than 50% of patients with ER+ MBC underwent first‐line CT in western Europe [13]. This may be caused by the opinion held by some oncologists that many patients with ER+/HER2− MBC are more suitable for first‐line CT if the tumors have lower ER positivity, higher Ki67, and poorer response to previous adjuvant endocrine therapy, even though this belief does not have solid proof.
Recently, intrinsic subtyping by Prediction Analysis of Microarray 50 (PAM50) identified that a substantial portion (20%–30%) of patients with ER+ MBC in the EGF3008 [14] and Bolero‐2 [15] trials were actually nonluminal subtype and had poor response to endocrine treatment, even with the addition of everolimus. Furthermore, a nonluminal disease score (NOLUS), calculated from the percentage of ER+, progesterone receptor‐positive (PR+), and Ki67‐positive tumor cells, was shown to independently identify the nonluminal disease within hormone receptor‐positive (HR+)/HER2− breast cancer [16].
The IHC4 score is a free tool that combines the information from four classical immunohistochemistry (IHC) markers (ER, PR, HER2, and Ki67) to predict the prognosis in patients with ER+ EBC, and it was reported to be as good as the 21‐gene recurrence score [17]. The IHC4 score, unlike these expensive genomic tests, can be used more easily and widely [17, 18, 19, 20]. Recently, the 21‐gene recurrence score has been shown to be prognostic in patients with stage IV breast cancer [21]. It has not been studied whether the IHC4 and NOLUS scores can be used to predict prognosis in patients with ER+ MBC, especially if they can predict the benefit from first‐line ET or CT in patients with ER+/HER2− MBC. Here we develop a much easier method to calculate modified IHC4 (mIHC4) score and evaluate the prognostic value of these mIHC4 and NOLUS scores in patients with ER+/HER2− MBC who received first‐line ET or CT.
Materials and Methods
Patient Characteristics and Study Design
This study retrospectively analyzed a series of 315 patients with ER‐positive metastatic breast cancer diagnosed and treated at the Breast Tumor Center of Sun Yat‐sen Memorial Hospital (SYSMH) between January 2009 and February 2017 (SYSMH data set).
According to current guidelines [22, 23], patients with ER ≥1% at either primary tumor or metastatic biopsy were considered ER positive and included in this study. Patients with both de novo and recurrent metastatic breast cancer were included. Patients with second primary tumors, those with mesenchymal tumors, those who did not receive any treatment, or those without any assessable lesions after surgery were excluded. The demographic and clinicopathological data were collected from electronic medical records and treated with strict privacy standards. Overall survival (OS) was defined as the time between first‐line treatment initiation and death from any cause. Progression free survival (PFS) was defined as the time between treatment initiation and tumor progression or death from any cause. The metastatic‐free interval was defined as the time from diagnoses of primary breast cancer to the development of first metastasis.
The Chinese Society of Clinical Oncology‐ Breast Cancer (CSCO‐BC) data set is a collection of more than 50,000 patients with early and metastatic breast cancer from 14 hospitals in China, with the majority being patients with EBC. A total of 406 patients with newly diagnosed MBC with detailed immunohistochemical information and treatment outcomes were selected from the CSCO‐BC data set according to the same inclusion and exclusion criteria as the SYSMH data set.
IHC4 Score and NOLUS Score
The formula for calculating IHC4 score was reported by Cuzick et al. [18]:
IHC4 score = 94.7*{−0.100*ER10−0.079*PgR10 + 0.586*HER2 + 0.240*ln(1 + 10*Ki67)}.
ER10 was calculated using both the original and modified method:
Original ER10, H‐score divided by 30 to arrive at a variable between 0 and 10 [18, 24, 25]. The ER H‐score = (% of percentage of cells staining weakly) + (% of percentage of cells staining moderately*2) + (% of percentage of cells staining strongly*3).
Modified ER10, the percentage of ER‐positive cancer cells divided by 10 to arrive at a variable between 0 and 10.
PgR10 was scored by dividing the percentage of PR‐positive cancer cells by 10. HER2 was scored as 1 if IHC 3+ or 2+ with fluorescence in situ hybridization+, and as 0 if otherwise. For the few cases with unknown HER2 status, the average score of both HER2‐positive and ‐negative scores was calculated as the final IHC4 score. Ki67 was scored as the percentage of Ki67‐positive cancer cells.
The NOLUS score was calculated using the previously defined formula: −0.45*ER −0.28*PR +0.27*Ki67 + 73.02, where the ER, PR, and Ki67 are measured as continuous variables based on the percentage of positive tumor cells by immunohistochemistry. A score of 51.38 was used as the cutoff value to define NOLUS‐negative and ‐positive patients as previously described [16].
Statistical Analysis
All the statistical analysis of the study data was carried out using STATA 13.0 (StataCorp, College Station, TX). Descriptive statistics were reported as the median and interquartile range or frequency with percentage. Nominal variables were compared using chi‐squared tests or Fisher's exact test. The agreement between the IHC4 and mIHC4 score was assessed using scattering plots and linear regression. Survival analyses were done by the Kaplan‐Meier method and were compared using the log‐rank test. Multivariable Cox regression analysis was used for multivariate analysis. To investigate the patterns of treatment effect across the continuum of the metastatic mIHC4 score, we used the subpopulation treatment effect pattern plot (STEPP) methodology [26, 27]. We used the tail‐oriented strategy to show the changes of log hazard ratio across the continuum of the metastatic mIHC4 score. All statistical tests were two‐sided and p < .05 was considered statistically significant.
Results
Clinicopathological Characteristics of Patients
The SYSMH data set included a total of 315 patients with newly diagnosed MBC with a median age of 51.7 (range 26–91) years. Among them, there were 69 (21.9%) patients with de novo stage IV diseases when diagnosed. For the other 246 metastatic patients with prior history of breast cancer treatment, the median disease‐free interval was 33.8 (1–257) months. With the median follow‐up of 25.6 months, the cumulative 1‐year and 2‐year PFS was 51.0% and 26.2%, respectively. The cumulative 1‐year and 2‐year OS was 87.9% and 62.9%,respectively. The median PFS and OS was 12.2 months and 33.4 months, respectively.
Two hundred twenty‐seven (72.1%) and 88 (27.9%) patients received chemotherapy or endocrine therapy as their first‐line MBC treatment, respectively. Patients who received chemotherapy as the first‐line treatment had more ER‐negative and/or HER2‐positive metastatic diseases, de novo stage IV diseases, and visceral metastasis (liver and/or lungs). Patients with bone metastasis and longer disease‐free interval (>24 months) were more likely to receive first‐line endocrine therapy (Table 1).
Table 1.
Baseline clinicopathological features
| Features | First‐line treatment | p value a | |||
|---|---|---|---|---|---|
| Chemotherapy | Endocrine therapy | ||||
| Age, years | |||||
| ≤50 | 130 | 57.27 | 48 | 54.55 | NS |
| >50 | 97 | 42.73 | 40 | 45.45 | |
| T stage (primary tumor) | |||||
| T0–2 | 134 | 59.03 | 57 | 64.77 | NS |
| T3–4 | 49 | 21.59 | 14 | 15.91 | |
| Tx | 44 | 19.38 | 17 | 19.32 | |
| N stage (primary tumor) | |||||
| Node‐negative | 43 | 18.94 | 19 | 21.59 | NS |
| Node‐positive | 155 | 68.28 | 60 | 68.18 | |
| Nx | 29 | 12.78 | 9 | 10.23 | |
| Nuclear grade (primary tumor) | |||||
| I–II | 61 | 26.87 | 40 | 45.45 | <.01 |
| III | 59 | 25.99 | 19 | 21.59 | |
| Unknown | 107 | 47.14 | 29 | 32.95 | |
| ER status (primary tumor) | |||||
| Negative | 19 | 8.37 | 1 | 1.14 | .02 |
| Positive | 202 | 88.99 | 83 | 94.32 | |
| Unknown | 6 | 2.64 | 4 | 4.55 | |
| PR status (primary tumor) | |||||
| Negative | 50 | 22.03 | 6 | 6.82 | <.01 |
| Positive | 171 | 75.33 | 78 | 88.64 | |
| Unknown | 6 | 2.64 | 4 | 4.55 | |
| HER2 status (primary tumor) | |||||
| Negative | 149 | 65.64 | 72 | 81.82 | <.01 |
| Positive | 73 | 32.16 | 13 | 14.77 | |
| Unknown | 5 | 2.20 | 3 | 3.41 | |
| Ki67 status (14% cutoff) | |||||
| Negative | 48 | 21.15 | 18 | 20.45 | NS |
| Positive | 155 | 68.28 | 58 | 65.91 | |
| Unknown | 24 | 10.57 | 12 | 13.64 | |
| Age at metastasis, years | |||||
| ≤50 | 106 | 46.70 | 36 | 40.91 | NS |
| >50 | 121 | 53.30 | 52 | 59.09 | |
| ER status in metastatic lesions (10% cutoff) | |||||
| Negative | 54 | 23.79 | 5 | 5.68 | <.01 |
| Positive | 94 | 41.41 | 44 | 50.00 | |
| Unknown | 79 | 34.80 | 39 | 44.32 | |
| PR status in metastatic lesions (10% cutoff) | |||||
| Negative | 108 | 47.58 | 29 | 32.95 | NS |
| Positive | 41 | 18.06 | 20 | 22.73 | |
| Unknown | 78 | 34.36 | 39 | 44.32 | |
| HER2 status in metastatic lesions | |||||
| Negative | 93 | 40.97 | 43 | 48.86 | .01 |
| Positive | 42 | 18.50 | 5 | 5.68 | |
| Unknown | 92 | 40.53 | 40 | 45.45 | |
| Ki67 status in metastatic lesions (14% cutoff) | |||||
| Negative | 20 | 8.81 | 10 | 11.36 | NS |
| Positive | 114 | 50.22 | 38 | 43.18 | |
| Unknown | 93 | 40.97 | 40 | 45.45 | |
| De novo stage IV | |||||
| No | 166 | 73.13 | 80 | 90.91 | <.01 |
| Yes | 61 | 26.87 | 8 | 9.09 | |
| Disease‐free interval | |||||
| De novo | 61 | 26.87 | 8 | 9.09 | <.01 |
| ≤24 months | 74 | 32.60 | 17 | 19.32 | |
| >24 months | 92 | 40.53 | 63 | 71.59 | |
| Bone metastasis | |||||
| No | 99 | 43.61 | 15 | 17.05 | <.01 |
| Yes | 128 | 56.39 | 73 | 82.95 | |
| Liver metastasis | |||||
| No | 140 | 61.67 | 66 | 75.00 | .048 |
| Yes | 87 | 38.33 | 22 | 25.00 | |
| Brain metastasis | |||||
| No | 222 | 97.80 | 86 | 97.73 | NS |
| Yes | 5 | 2.20 | 2 | 2.27 | |
| Lung metastasis | |||||
| No | 136 | 59.91 | 67 | 76.14 | <.01 |
| Yes | 91 | 40.09 | 21 | 23.86 | |
| Presence of visceral metastasis | |||||
| No | 102 | 44.93 | 55 | 62.50 | <.01 |
| Yes | 125 | 55.07 | 33 | 37.50 | |
| Adjuvant use of trastuzumab | |||||
| 0 | 213 | 93.83 | 88 | 100.00 | .014 |
| 1 | 14 | 6.17 | 0 | 0.00 | |
| Salvage use of trastuzumab | |||||
| 0 | 190 | 83.70 | 82 | 93.18 | .029 |
| 1 | 37 | 16.30 | 6 | 6.82 | |
Chi‐square test (or Fisher Exact test when appropriate) was used.
Abbreviations: ER, estrogen receptor; HER2, human epidermal growth receptor 2; NS, nonsignificant; PR, progesterone receptor.
Correlation Between the Original and Modified IHC4 Score
Because the H‐score is not routinely reported by pathologists, it is inconvenient to calculate the IHC4 score, significantly limiting its use in the clinic. A previous study explored a simplified method and found it to be similar to the original one [28]. Here we proposed a modified IHC4 score in which ER10 was calculated as the percentage of ER‐positive cancer cells (routinely reported in pathology report) divided by 10, similar to the way in which PR10 is calculated. Then we compared the IHC4 score between the original score using H‐score and the modified score to see if there is any significant difference between the original IHC4 and mIHC4 score.
The ER staining in 107 primary tumors and 117 metastatic tumors was re‐evaluated by the pathologists to obtain the H‐scores and the percentage of ER‐positive cells to calculate the original and mIHC4 score, respectively. The correlation coefficients (r 2) between the original and the modified mIHC4 scores were very high, 0.857 (p < .001) in primary tumor and 0.965 (p < .001) in metastatic tumor (Fig. 1A, 1B), indicating the feasibility to use mIHC4 to represent original IHC4. Because H‐score is not available in many other cases, mIHC4 scores were used in the following analysis.
Figure 1.
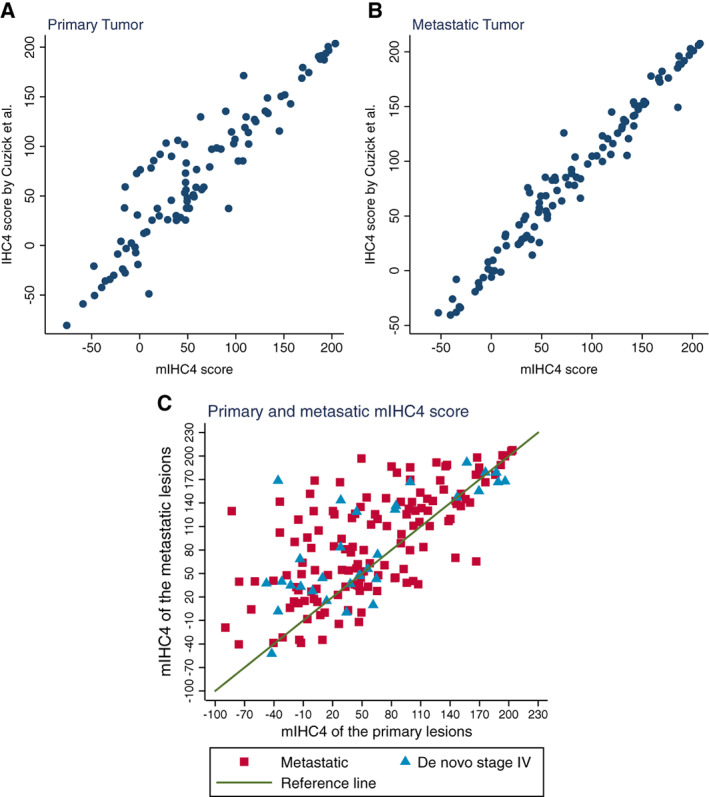
Assessment of the agreement between original IHC4 score and mIHC4 score, and the agreement of mIHC4 score between primary and metastatic lesions. Scattering plots show the agreement between the original IHC4 value and the mIHC4 value in the primary tumors (A) and metastatic tumors (B). (C): Scattering plot shows the change of mIHC4 scores between the primary tumors and metastatic lesions.
Abbreviation: mIHC4, modified IHC4.
Change of the mIHC4 Scores from the Primary to Metastatic Tumors
The mIHC4 scores were available in both the primary and metastatic lesions in 165 patients (Fig. 1C). The median mIHC4 score (25%–75% range) was 48.5 (−89.6 to 203.7) in primary tumors and 74.0 (−59.6 to 207.5) in metastatic tumors, with a median increase of 23.5 (25%–75% range: −8.7 to 63.4) in metastatic tumors, indicating the more malignant features in metastatic cancer cells.
Correlation Between mIHC4 Score and Clinicopathological Features
mIHC4 scores were available in most primary tumors (n = 279) and two thirds of metastatic tumors (n = 197). Higher mIHC4 scores of primary tumors were associated with higher T stage and nuclear grade of primary tumors, shorter disease‐free interval (≤24 months vs. >24 months), and the presence of liver/visceral metastasis and the absence of bone metastasis (supplemental online Table 1), demonstrating the prognostic value of mIHC4 score in primary tumor to predict disease‐free interval and visceral metastasis. Higher mIHC4 scores of metastatic tumors were also correlated with higher T stage and nuclear grade of the primary tumor, shorter disease‐free interval (≤24 months vs. >24 months, ≤60 months vs. >60 months), and the presence of liver/visceral metastasis, which is more likely caused by the higher mIHC4 score in their corresponding primary tumors.
Prognostic Factors of PFS
Two cutoff values of IHC4 score, −29.9 and 29.9, were suggested to separate patients with early breast cancer into low‐, moderate‐, and high‐risk subgroups [18]. However, all patients in our study had MBC. Thus, −29.9 and 29.9 of mIHC4 score did not predict their prognosis well (data not shown). Therefore, we assigned the patients into low‐, moderate‐, and high‐risk subgroups, based on their mIHC4 scores using 33rd and 66th percentile values as the new cutoff values (primary mIHC4 score: ≤21.3, 21.4−92.5, ≥92.6; metastatic mIHC4 score: ≤39.6, 39.7−125.6, ≥125.7).
Univariate analysis demonstrated that negative ER and PR status of primary tumor or metastatic tumor, presence of visceral metastasis (liver/lung), and high risk by mIHC4 scores in both primary and metastatic tumors were associated with significantly worse PFS by first‐line treatment (Fig. 2; supplemental online Table 2). After adjustment with the presence of liver or lung metastasis, multivariate analysis showed that the primary mIHC4 was not associated with PFS, whereas the metastatic mIHC4 was still significantly associated with worse PFS (Table 2), indicating that mIHC4 score of metastatic tumor has stronger prognostic value.
Figure 2.
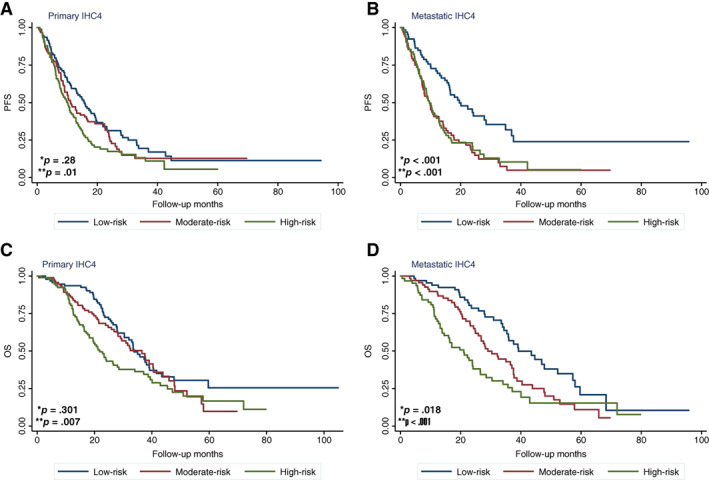
Kaplan‐Meier analysis of survival in patients with different modified IHC4 (mIHC4) scores. (A, B): PFS of patients in different risk subgroups defined by primary (A) or metastatic (B) mIHC4 scores. (C, D): OS of patients in different risk subgroups defined by primary (C) or metastatic (D) mIHC4 scores. *p value for moderate‐risk versus low‐risk subgroups; **p value for high‐risk versus low‐risk subgroups.
Abbreviations: OS, overall survival; PFS, progression‐free survival.
Table 2.
Multivariate Cox regression analysis of risk factors for PFS and OS
| Variable | HR (95% CI) | p value |
|---|---|---|
| PFS | ||
| Presence of liver metastasis | ||
| No | 1 | |
| Yes | 1.43 (0.98–2.08) | .064 |
| Presence of lung metastasis | ||
| No | 1 | |
| Yes | 1.33 (0.91–1.93) | .137 |
| Risk group by primary mIHC4 (3 quantiles) | ||
| Low risk | 1 | |
| Moderate risk | 0.86 (0.55–1.36) | .522 |
| High risk | 0.91 (0.53–1.58) | .75 |
| Risk group by metastatic mIHC4 (3 quantiles) | ||
| Low risk | 1 | |
| Moderate risk | 2.09 (1.29–3.42) | .003 |
| High risk | 1.81 (1.01–3.26) | .047 |
| OS | ||
| Nuclear grade | ||
| I–II | 1 | |
| III | 1.22 (0.71–2.10) | .471 |
| Unknown | 0.88 (0.51–1.52) | .65 |
| Disease‐free interval | ||
| ≤24 months | 1 | |
| De novo | 0.55 (0.31–0.99) | .048 |
| >24 months | 0.85 (0.55–1.33) | .485 |
| First‐line therapy | ||
| Chemotherapy | 1 | |
| Endocrine therapy | 1.44 (0.87–2.36) | .152 |
| Liver metastasis | ||
| No | 1 | |
| Yes | 2.10 (1.39–3.17) | <.001 |
| Risk group by primary mIHC4 (3 quantiles) | ||
| Low risk | 1 | |
| Moderate risk | 0.95 (0.54–1.70) | .871 |
| High risk | 0.94 (0.50–1.78) | .855 |
| Risk group by metastatic mIHC4 (3 quantiles) | ||
| Low risk | 1 | |
| Moderate risk | 1.39 (0.79–2.43) | .253 |
| High risk | 2.04 (1.07–3.86) | .028 |
Abbreviations: CI, confidence interval; HR, hazard ratio; mIHC4, modified IHC4; OS, overall survival; PFS, progression‐free survival.
To validate the prognostic value of mIHC4 score of metastatic tumors, we obtained the clinicopathological information and immunohistochemistry data from an independent CSCO‐BC data set (supplemental online Table 3). The CSCO‐BC data set included a total of 406 patients with newly diagnosed MBC with a median age of 47 (range 25–79) years. Among them, there were 19 (4.68%) patients with de novo stage IV diseases when diagnosed. The cumulative 1‐year and 2‐year PFS was 36.5% and 14.2%, respectively. The median PFS was 11 months, but the OS data are unfortunately not available. The patients from the CSCO‐BC data set were assigned into low‐, moderate‐, and high‐risk subgroups according to their mIHC4 value of metastatic tumors, using the abovementioned cutoff values (39.8, 126.6). Interestingly, the distribution of the metastatic mIHC4 scores was similar between the SYSMH data set and the CSCO‐BC data set (supplemental online Fig. 1). In the CSCO‐BC data set, the metastatic mIHC4 score, but not the primary mIHC4 score, was able to identify moderate‐risk (hazard ratio = 1.67, 95% confidence interval [CI] 1.24–2.26, p = .001) and high‐risk (hazard ratio = 2.13, 95% CI 1.35–3.36, p = .001) subgroup patients that had significantly shorter PFS than low‐risk subgroup patients (Fig. 3). After the adjustment with liver and lung metastasis, multivariate analysis showed that metastatic mIHC4 score was still prognostic of PFS in the CSCO‐BC data set, confirming the prognostic value of metastatic mIHC4 score in PFS (supplemental online Table 4).
Figure 3.
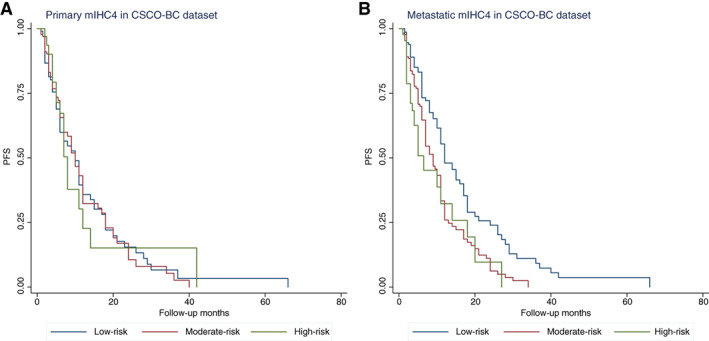
Survival analysis of patients in different risk groups defined by mIHC4 scores. Kaplan‐Meier analysis of survival in patients with different primary (A) and metastatic (B) mIHC4 scores in the CSCO‐BC data set.
Abbreviations: CSCO‐BC, Chinese Society of Clinical Oncology‐Breast Cancer (CSCO‐BC); mIHC4, modified IHC4; PFS, progression‐free survival.
Prognostic Factors of OS
Univariate analysis suggested that higher nuclear grade and negative ER status in primary tumors, negative ER or PR status in metastatic tumors, shorter disease‐free interval, first‐line chemotherapy, visceral (liver) metastasis, and high risk by mIHC4 score in both primary and metastatic tumors were associated with significantly worse OS (supplemental online Table 2). After the adjustment with nuclear grade of the primary tumor, disease‐free interval, first‐line therapy, and presence of liver metastasis, the primary mIHC4 score was not associated with OS. Nevertheless, the metastatic mIHC4 score (high‐risk vs. low‐risk, hazard ratio = 2.04, 95% CI 1.07–3.86, p = .028) was still significantly associated with OS (Table 2).
Predictive Value of mIHC4 Score in Selecting First‐Line Endocrine Therapy or Chemotherapy in Patients with ER+/HER2− MBC
To study whether the mIHC4 score may be useful in predicting the treatment response and prognosis in patients with HR+/HER2− metastatic diseases, we first investigated the prognostic impact of mIHC4 score in patients who received first‐line chemotherapy or endocrine therapy separately. In the patients who received endocrine therapy as the first‐line treatment (no high‐risk patients), the moderate‐risk subgroup had significantly shorter PFS and OS than the low‐risk subgroup. Similarly, in the cohort of patients who received chemotherapy as the first‐line treatment, the high‐risk subgroup had significantly shorter PFS and OS than the low‐risk subgroup (Table 3).
Table 3.
Exploratory analysis of median PFS and OS among HR+/HER2− patients with different mIHC4 scores by first‐line therapy
| NOLUS score a | Metastatic mIHC4 score b | ||||||
|---|---|---|---|---|---|---|---|
| Treatments | NOLUS‐negative | NOLUS‐positive | p value c | Low (n = 59) | Moderate (n = 44) | High (n = 11) | p value c |
| PFS | |||||||
| Endocrine therapy | 19.0 (4.1–37.5) | 4.2 (0.8–17.7) | .02 | 37.5 (11.8–NR) | 7.1 (2.6–12.7) | N/A | <.01 |
| Chemotherapy | 16.3 (13.1–22.4) | 7.1 (5.8–10.0) | <.01 | 16.6 (13.1–22.3) | 10.0 (6.7–15.8) | 6.4 (1.8–11.4) | <.01 |
| p value d | .27 | .94 | .019 | .25 | N/A | ||
| OS | |||||||
| Endocrine therapy | 44.7 (29.1–52.2) | 20.1 (15.8–37.0) | <.01 | 44.7 (33.9–NR) | 26.8 (18.2–37.0) | N/A | <.01 |
| Chemotherapy | 35.8 (27.9–47.8) | 35.0 (14.2–40.1) | .16 | 37.6 (28.1–57.3) | 35.0 (24.3–43.8) | 13.8 (5.7–NR) | <.01 |
| p value d | .58 | .28 | .32 | .08 | N/A | ||
51.38 was used for the cutoff value.
n = 5 patients with unclear mIHC4 scores were excluded.
Log‐rank test to compare the PFS among patients in different risk groups (NOLUS negative vs. positive, mIHC4 low vs. moderate vs. high risk groups).
Log‐rank test to compare the PFS between endocrine therapy and chemotherapy in different subgroups.
Abbreviations: HER2, human epidermal growth receptor 2; HR, hormone receptor; mIHC4, modified IHC4; N/A, not applicable; NOLUS, nonluminal disease score; NR, not reached; OS, overall survival; PFS, progression‐free survival.
Interestingly, endocrine therapy led to significantly longer PFS and OS in low‐risk patients (37.53 and 44.67 months) than moderate‐risk patients (7.13 and 26.83 months), whereas chemotherapy resulted in similar PFS and OS (16.57–10.0 and 35.03–37.6 months) between the two groups, suggesting that endocrine treatment might be superior to chemotherapy in extending PFS and OS in low‐risk patients. The OS in moderate‐risk patients who received endocrine treatment (26.83 months) was obviously shorter than that in those who received chemotherapy (35.03 months), although it was not statistically significant (p = .08), indicating that patients with higher metastatic mIHC4 score might have a survival benefit from first‐line chemotherapy (Table 3).
To further explore the treatment impact of first‐line chemotherapy versus endocrine therapy on PFS/OS in patients with different mIHC4 scores, we used the STEPP analysis and observed that endocrine therapy was associated with better PFS and OS in the patients with lower mIHC4 scores, whereas chemotherapy was correlated with better PFS and OS in the patients with higher mIHC4 scores (Fig. 4A, 4B). More importantly, the PFS benefit of endocrine therapy in the patients with lower mIHC4 scores and chemotherapy in the patients with higher mIHC4 scores were also validated in the CSCO‐BC data set (Fig. 4C).
Figure 4.
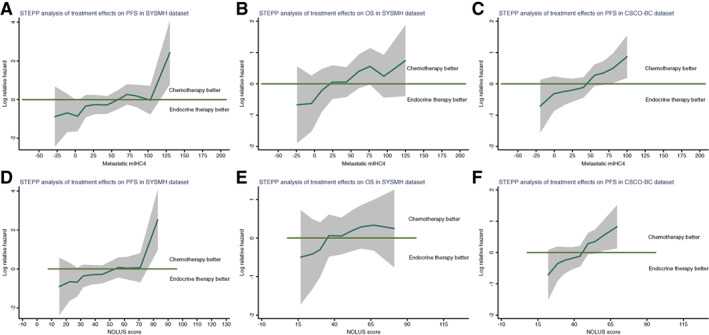
Assessment of the therapeutic benefit of chemotherapy in patients with varied mIHC4 scores or NOLUS scores. STEPP analysis of the treatment effects (endocrine therapy vs. chemotherapy) on PFS (A, C, D, F) and OS (B, E), across a continuous values of metastatic mIHC4 scores (A–C), and NOLUS score (D–F). The log hazard ratio and its 95% confidence interval are shown in the plots. There is a significant trend that in patients with lower metastatic mIHC4 score, endocrine therapy is better, whereas in patients with higher metastatic mIHC4 score, chemotherapy is better.
Abbreviations: mIHC4, modified IHC4; NOLUS, nonluminal disease score; OS, overall survival; PFS, progression‐free survival; STEPP, subpopulation treatment effect pattern plot; SYSMH, Sun Yat‐sen Memorial Hospital.
Prognostic and Predictive Value of NOLUS Score in Patients with ER+/HER2− MBC
The NOLUS score was reported to identify the nonluminal subtypes of patients with ER+/HER2− breast cancer in the absence of gene expression data. In the patients with ER+/HER2− breast cancer from the SYSMH and CSCO‐BC data sets, there were 128 NOLUS‐positive and 310 NOLUS‐negative patients. The NOLUS scores were well correlated with the mIHC4 scores (correlation r 2 = 0.93; supplemental online Fig. 2). Moreover, the nonluminal NOLUS‐positive subtypes were mostly in the moderate (34%) or high (65%) mIHC4 groups, whereas the luminal NOLUS‐negative subtypes were mostly in the low (59%) or moderate (41%) mIHC4 groups (supplemental online Table 5).
In the patients who received endocrine therapy as the first‐line treatment, the PFS and OS in NOLUS‐negative patients were significantly longer than the ones in NOLUS‐positive patients. For patients who received first‐line chemotherapy, NOLUS positivity is only prognostic for PFS and not OS. Additionally, neither PFS nor OS was impacted by the choice of endocrine therapy or chemotherapy in both NOLUS‐positive and NOLUS‐negative patients (Table 3). STEPP analysis showed that NOLUS score had a similar pattern as the mIHC4 score in predicting the PFS and OS benefit from endocrine therapy or chemotherapy (Fig. 4).
Discussion
The overall survival of patients with metastatic breast cancer varied significantly. The median survival of patients with bone‐only metastasis and HR‐positive diseases can be up to 65 months [29], whereas patients with triple‐negative disease and visceral metastasis have a median overall survival of approximately 1 year [30]. Therefore, it is critical to accurately predict the prognosis of patients with metastatic breast cancer. First‐line treatments, either endocrine therapy or chemotherapy, were usually determined based on the predicted survival of these patients. Recently, the TBCRC 013 study showed that the 21‐gene recurrence score was independently prognostic in ER+/HER2− de novo stage IV breast cancer [21]. However, it remains unknown whether the 21‐gene recurrence score can be used in metastatic breast cancer for prognostic predictions. As shown in our study, patients with metastatic breast cancer had inferior survival when compared with those with de novo stage IV breast cancer. Although recommended by the National Comprehensive Cancer Network guideline in patients with EBC, the 21‐gene recurrence score is expensive as well as inaccessible in many other countries including China. Therefore, an economical and effective method for prognostic prediction is eagerly needed.
IHC4 has been shown to have similar prognostic values as the 21‐gene recurrence score in early‐stage breast cancer. The H‐score of the ER status, which was defined as the percentage of weakly staining plus two times the percentage of moderately staining plus three times the percentage of strongly staining [18], was required to calculate the IHC4 score. However, H‐score was not routinely used in many institutions, limiting the use of IHC4 score in clinical practices. In this study, we developed a modified method to calculate IHC4 score (modified IHC4), using the ER percentage divided by 10 to replace the H‐score. We found that the modified IHC4 scores were actually very close to the original one. Because most pathologists report the percentages of ER+ cells in routine work, the modified IHC4 score is very easy to use and more suitable for clinical practice.
In our study, the median primary and metastatic mIHC4 scores of the ER+/HER2− patients were 37.7 and 48.6, which were higher than those in Cuzick's study. This was expected because all the patients included in their study were patients with EBC. In our study, we found that mIHC4 score from metastatic lesions, but not mIHC4 score from primary tumors, was significantly associated with PFS and OS. This finding supports the importance of obtaining metastatic lesions for accurate prognostic assessment.
Current guidelines (Advanced Breast Cancer, European Society for Medical Oncology, American Society of Clinical Oncology) recommended endocrine therapy as the preferred option for ER+/HER2− MBC, even in the presence of visceral disease, unless there are concerns of rapid disease progression. Because the case history of these patients varies significantly, it is important to stratify these patients into different risk subgroups. In our study, we showed that the primary and metastatic mIHC4 scores were associated with the tumor burden as defined by traditional clincopathological features. Furthermore, the metastatic mIHC4 score was associated with PFS and OS, with the lower or higher score representing good or worse prognosis, respectively. More importantly, both continuous (STEPP analysis) and categorical methods showed that metastatic mIHC4 score can help to predict the better first‐line treatment choice of endocrine therapy versus chemotherapy in patients with ER+/HER2− MBC. The prognostic and predictive value of metastatic mIHC4 scores in PFS was validated using an independent CSCO‐BC data set. The NOLUS score [16], another scoring system based on the positivity of ER, PR, and Ki67, also showed prognostic value in patients with ER+/HER2− MBC, but its predictive value seems to be less than mIHC4.
Intrinsic molecular subtyping has been shown to be a prognostic biomarker for patients with ER+ MBC [14, 15]. However, this study was limited by insufficient tissue samples to compare the value of mIHC4 score with intrinsic subtyping. Moreover, these analyses were done in a retrospective patient population with heterogeneous cohorts and treatments; therefore, inherent bias could not be eliminated. A prospective randomized trial is needed to confirm the prognostic and predictive value of the mIHC4 and NOLUS scores and compare them with intrinsic subtyping in the future.
Conclusion
We developed a modified IHC4 score that can be easily used in the clinic and found that mIHC4 scores in metastatic lesions have strong prognostic value in the PFS and OS of patients with ER+ MBC. Furthermore, lower or higher metastatic mIHC4 score may predict longer survival in patients with ER+/HER2− MBC receiving first‐line endocrine therapy or chemotherapy, respectively. This may be useful in clinical decision making when choosing first‐line systemic therapy for patients with ER+/HER2− MBC.
Author Contributions
Conception/design: Liang Jin, Kai Chen, Cui Tan, Zefei Jiang, Qiang Liu
Provision of study material or patients: Liang Jin, Jianbin Li, Min Peng
Collection and/or assembly of data: Jianbin Li, Jiayue Luo, Yaping Yang, Yudong Li, Shunying Li, Liling Zhu, Yue Hu, Fengtao Liu, Qiuting You
Data analysis and interpretation: Jianbin Li, Jiayue Luo, Yaping Yang, Yudong Li, Shunying Li, Liling Zhu, Yue Hu, Fengtao Liu, Qiuting You, Min Peng
Manuscript writing: Liang Jin, Kai Chen, Cui Tan, Fengtao Liu, Qiuting You, Min Peng
Final approval of manuscript: Liang Jin, Kai Chen, Cui Tan, Jianbin Li, Jiayue Luo, Yaping Yang, Yudong Li, Shunying Li, Liling Zhu, Yue Hu, Fengtao Liu, Qiuting You, Min Peng, Zefei Jiang, Qiang Liu
Disclosures
The authors indicated no financial relationships.
Supporting information
See http://www.TheOncologist.com for supplemental material available online.
Supplemental Figure 1. Distribution of primary mIHC4 scores (a) and metastatic mIHC4 scores (b) in the SYSMH and CSCO‐BC datasets.
Supplemental Figure 2. Correlation of the NOLUS score and the mIHC4 score in metastatic ER+/HER2‐ breast cancer patients.
Supplemental Table 1. Correlation between mIHC4 scores and clinicopathological features
Supplemental Table 2. Univariate analysis of predictors of PFS and OS
Supplemental Table 3. Clincopathological features of CSCO‐BC datasets
Supplemental Table 4. Multivariate Cox regression analysis of risk factors for PFS Variable
Supplemental Table 5. Consistency of the risk group classification using the NOLUS score and the mIHC4 score.
Acknowledgments
This work was funded by National Key Basic Research Program of China (973 Project, 2015CB553702), National Natural Science Foundation of China grants (81872141, 81630074, 81472467, 81672622, and 81702630), and Guangzhou Science and Technology key projects (201804020076).
Disclosures of potential conflicts of interest may be found at the end of this article.
No part of this article may be reproduced, stored, or transmitted in any form or for any means without the prior permission in writing from the copyright holder. For information on purchasing reprints contact Commercialreprints@wiley.com. For permission information contact permissions@wiley.com.
Contributor Information
Zefei Jiang, Email: jiangzefei@csco.org.cn.
Qiang Liu, Email: liuq77@mail.sysu.edu.cn.
References
- 1. World Health Organization . Globocan 2018: Estimated cancer incidence, mortality and prevalence worldwide in 2018. Available at http://globocan.iarc.fr/Pages/fact_sheets_cancer.aspx. Accessed August 2019.
- 2. Cardoso F, Harbeck N, Fallowfield L et al. Locally recurrent or metastatic breast cancer: ESMO clinical practice guidelines for diagnosis, treatment and follow‐up. Ann Oncol 2012;23(suppl 7):vii11–vii19. [DOI] [PubMed] [Google Scholar]
- 3. Vera‐Llonch M, Weycker D, Glass A et al. Healthcare costs in women with metastatic breast cancer receiving chemotherapy as their principal treatment modality. BMC Cancer 2011;11:250. [DOI] [PMC free article] [PubMed] [Google Scholar]
- 4. Dawood S, Broglio K, Gonzalez‐Angulo AM et al. Trends in survival over the past two decades among white and black patients with newly diagnosed stage IV breast cancer. J Clin Oncol 2008;26:4891–4898. [DOI] [PMC free article] [PubMed] [Google Scholar]
- 5. Chia SK, Speers CH, D'Yachkova Y et al. The impact of new chemotherapeutic and hormone agents on survival in a population‐based cohort of women with metastatic breast cancer. Cancer 2007;110:973–979. [DOI] [PubMed] [Google Scholar]
- 6. Partridge AH, Rumble RB, Carey LA et al. Chemotherapy and targeted therapy for women with human epidermal growth factor receptor 2‐negative (or unknown) advanced breast cancer: American Society of Clinical Oncology clinical practice guideline. J Clin Oncol 2014;32:3307–3329. [DOI] [PMC free article] [PubMed] [Google Scholar]
- 7. Burstein HJ, Temin S, Anderson H et al. Adjuvant endocrine therapy for women with hormone receptor‐positive breast cancer: American Society of Clinical Oncology clinical practice guideline focused update. J Clin Oncol 2014;32:2255–2269. [DOI] [PMC free article] [PubMed] [Google Scholar]
- 8. Howlader N, Altekruse SF, Li CI et al. US incidence of breast cancer subtypes defined by joint hormone receptor and HER2 status. J Natl Cancer Inst 2014;106:dju055. [DOI] [PMC free article] [PubMed] [Google Scholar]
- 9. Wilcken N, Hornbuckle J, Ghersi D. Chemotherapy alone versus endocrine therapy alone for metastatic breast cancer. Cochrane Database Syst Rev 2003:CD002747. [DOI] [PMC free article] [PubMed] [Google Scholar]
- 10. NCCN . Breast cancer version 4.2018. 2018 Available at https://www.nccn.org. Accessed May 6, 2019. [Google Scholar]
- 11. Cardoso F, Senkus E, Costa A et al. 4th ESO‐ESMO international consensus guidelines for advanced breast cancer (ABC 4). Ann Oncol 2018;29:1634–1657. [DOI] [PMC free article] [PubMed] [Google Scholar]
- 12. Swallow E, Zhang J, Thomason D et al. Real‐world patterns of endocrine therapy for metastatic hormone‐receptor‐positive (HR+)/human epidermal growth factor receptor‐2‐negative (HER2‐) breast cancer patients in the United States: 2002‐2012. Curr Med Res Opin 2014;30:1537–1545. [DOI] [PubMed] [Google Scholar]
- 13. Gao S, Barber B, Schabert V et al. Tumor hormone/HER2 receptor status and pharmacologic treatment of metastatic breast cancer in western Europe. Curr Med Res Opin 2012;28:1111–1118. [DOI] [PubMed] [Google Scholar]
- 14. Prat A, Cheang MC, Galvan P et al. Prognostic value of intrinsic subtypes in hormone receptor‐positive metastatic breast cancer treated with letrozole with or without lapatinib. JAMA Oncol 2016;2:1287–1294. [DOI] [PubMed] [Google Scholar]
- 15. Prat A, Brase JC, Cheng Y et al. Everolimus plus exemestane for hormone receptor‐positive advanced breast cancer: A PAM50 intrinsic subtype analysis of BOLERO‐2. The Oncologist 2019;24:893–900. [DOI] [PMC free article] [PubMed] [Google Scholar]
- 16. Pascual T, Martin M, Fernandez‐Martinez A et al. A pathology‐based combined model to identify PAM50 non‐luminal intrinsic disease in hormone receptor‐positive HER2‐negative breast cancer. Front Oncol 2019;9:303. [DOI] [PMC free article] [PubMed] [Google Scholar]
- 17. Sestak I, Dowsett M, Ferree S et al. Retrospective analysis of molecular scores for the prediction of distant recurrence according to baseline risk factors. Breast Cancer Res Treat 2016;159:71–78. [DOI] [PMC free article] [PubMed] [Google Scholar]
- 18. Cuzick J, Dowsett M, Pineda S et al. Prognostic value of a combined estrogen receptor, progesterone receptor, Ki‐67, and human epidermal growth factor receptor 2 immunohistochemical score and comparison with the genomic health recurrence score in early breast cancer. J Clin Oncol 2011;29:4273–4278. [DOI] [PubMed] [Google Scholar]
- 19. Bartlett JM, Christiansen J, Gustavson M et al. Validation of the IHC4 breast cancer prognostic algorithm using multiple approaches on the multinational team clinical trial. Arch Pathol Lab Med 2016;140:66–74. [DOI] [PubMed] [Google Scholar]
- 20. Abubakar M, Figueroa J, Ali HR et al. Combined quantitative measures of ER, PR, HER2, and Ki67 provide more prognostic information than categorical combinations in luminal breast cancer. Mod Pathol 2019;32:1244–1256. [DOI] [PMC free article] [PubMed] [Google Scholar]
- 21. King TA, Lyman JP, Gonen M et al. Prognostic impact of 21‐gene recurrence score in patients with stage IV breast cancer: TBCRC 013. J Clin Oncol 2016;34:2359–2365. [DOI] [PMC free article] [PubMed] [Google Scholar]
- 22. Goldhirsch A, Wood WC, Coates AS et al. Strategies for subtypes–Dealing with the diversity of breast cancer: Highlights of the St. Gallen international expert consensus on the primary therapy of early breast cancer 2011. Ann Oncol 2011;22:1736–1747. [DOI] [PMC free article] [PubMed] [Google Scholar]
- 23. Hammond ME, Hayes DF, Dowsett M et al. American Society of Clinical Oncology/College of American Pathologists guideline recommendations for immunohistochemical testing of estrogen and progesterone receptors in breast cancer. J Clin Oncol 2010;28:2784–2795. [DOI] [PMC free article] [PubMed] [Google Scholar]
- 24. Elsamany S, Elmorsy S, Alzahrani A et al. Predictive value of IHC4 score for pathological response to neoadjuvant chemotherapy in hormone receptor‐positive breast cancer. Asian Pac J Cancer Prev 2015;16:7975–7979. [DOI] [PubMed] [Google Scholar]
- 25. Ma H, Lu Y, Marchbanks PA et al. Quantitative measures of estrogen receptor expression in relation to breast cancer‐specific mortality risk among white women and black women. Breast Cancer Res 2013;15:R90. [DOI] [PMC free article] [PubMed] [Google Scholar]
- 26. Bonetti M, Gelber RD. Patterns of treatment effects in subsets of patients in clinical trials. Biostatistics 2004;5:465–481. [DOI] [PubMed] [Google Scholar]
- 27. Lazar AA, Cole BF, Bonetti M et al. Evaluation of treatment‐effect heterogeneity using biomarkers measured on a continuous scale: Subpopulation treatment effect pattern plot. J Clin Oncol 2010;28:4539–4544. [DOI] [PMC free article] [PubMed] [Google Scholar]
- 28. Dodson A, Zabaglo L, Yeo B et al. Risk of recurrence estimates with IHC4+C are tolerant of variations in staining and scoring: An analytical validity study. J Clin Pathol 2016;69:128–135. [DOI] [PubMed] [Google Scholar]
- 29. Lee SJ, Park S, Ahn HK et al. Implications of bone‐only metastases in breast cancer: Favorable preference with excellent outcomes of hormone receptor positive breast cancer. Cancer Res Treat 2011;43:89–95. [DOI] [PMC free article] [PubMed] [Google Scholar]
- 30. Tseng LM, Hsu NC, Chen SC et al. Distant metastasis in triple‐negative breast cancer. Neoplasma 2013;60:290–294. [DOI] [PubMed] [Google Scholar]
Associated Data
This section collects any data citations, data availability statements, or supplementary materials included in this article.
Supplementary Materials
See http://www.TheOncologist.com for supplemental material available online.
Supplemental Figure 1. Distribution of primary mIHC4 scores (a) and metastatic mIHC4 scores (b) in the SYSMH and CSCO‐BC datasets.
Supplemental Figure 2. Correlation of the NOLUS score and the mIHC4 score in metastatic ER+/HER2‐ breast cancer patients.
Supplemental Table 1. Correlation between mIHC4 scores and clinicopathological features
Supplemental Table 2. Univariate analysis of predictors of PFS and OS
Supplemental Table 3. Clincopathological features of CSCO‐BC datasets
Supplemental Table 4. Multivariate Cox regression analysis of risk factors for PFS Variable
Supplemental Table 5. Consistency of the risk group classification using the NOLUS score and the mIHC4 score.