Abstract
The development of decision support systems for pathology and their deployment in clinical practice have been hindered by the need for large manually annotated datasets. To overcome this problem, we present a multiple instance learning-based deep learning system that uses only the reported diagnoses as labels for training, thereby avoiding expensive and time-consuming pixel-wise manual annotations. We evaluated this framework at scale on a dataset of 44,732 whole slide images from 15,187 patients without any form of data curation. Tests on prostate cancer, basal cell carcinoma and breast cancer metastases to axillary lymph nodes resulted in areas under the curve above 0.98 for all cancer types. Its clinical application would allow pathologists to exclude 65–75% of slides while retaining 100% sensitivity. Our results show that this system has the ability to train accurate classification models at unprecedented scale, laying the foundation for the deployment of computational decision support systems in clinical practice.
Pathology is the cornerstone of modern medicine and, in particular, cancer care. The pathologist’s diagnosis on glass slides is the basis for clinical and pharmaceutical research and, more importantly, for the decision on how to treat the patient. Nevertheless, the standard practice of microscopy for diagnosis, grading and staging of cancer has remained nearly unchanged for a century1,2. While other medical disciplines, such as radiology, have a long history of research and clinical application of computational approaches, pathology has remained in the background of the digital revolution. Only in recent years has digital pathology emerged as a potential new standard of care where glass slides are digitized into whole slide images (WSIs) using digital slide scanners. As scanner technologies have become more reliable, and WSIs increasingly available in larger numbers, the field of computational pathology has emerged to facilitate computer-assisted diagnostics and to enable a digital workflow for pathologists3–5. These diagnostic decision support tools can be developed to empower pathologists’ efficiency and accuracy to ultimately provide better patient care.
Traditionally, predictive models used in decision support systems for medical image analysis relied on manually engineered feature extraction based on expert knowledge. These approaches were intrinsically domain specific and their performance was, in general, not sufficient for clinical applications. This approach was changed in recent years based on the enormous success and advancement of deep learning6 in solving image classification tasks, such as classification and categorization on ImageNet7–10, where high-capacity deep neural network models have been reported to surpass human performance10.
The medical image analysis field has seen widespread application of deep learning, showing in some cases that clinical impact can be achieved for diagnostic tasks. Notably, ref. 11 reported dermatologist-level diagnosis of dermoscopy images, while ref. 12 showed ophthalmologist-level performance on optical coherence tomography images.
Computational pathology, compared with other fields, has to face additional challenges related to the nature of pathology data generation. The lack of large annotated datasets is even more severe than in other domains. This is due in part to the novelty of digital pathology and the high cost associated with the digitization of glass slides. Furthermore, pathology images are tremendously large: glass slides scanned at 20× magnification (0.5 μm pixel−1) produce image files of several gigapixels; about 470 WSIs contain roughly the same number of pixels as the entire ImageNet dataset. Leveraging the peculiarity of pathology datasets has led most efforts in computational pathology to apply supervised learning for classifying small tiles within a WSI13–22. This usually requires extensive annotations at the pixel level by expert pathologists. For these reasons, state-of-the-art pathology datasets are small and heavily curated. The CAMELYON16 challenge for breast cancer metastasis detection23 contains one of the largest labeled datasets in the field, with a total of 400 non-exhaustively annotated WSIs.
Applying deep learning for supervised classification on these small datasets has achieved encouraging results. Of note, the CAMELYON16 challenge reported performance on par with that of pathologists in discerning between benign tissue and metastatic breast cancer23. Yet, the applicability of these models in clinical practice remains in question because of the wide variance of clinical samples that is not captured in small datasets. Experiments presented in this article will substantiate this claim.
To properly address the shortcomings of current computational approaches and enable clinical deployment of decision support tools requires training and validation of models on large-scale datasets representative of the wide variability of cases encountered every day in the clinic. At that scale, reliance on expensive and time-consuming, manual annotations is impossible. We address all of these issues by collecting a large computational pathology dataset and by proposing a new framework for training classification models at a very large scale without the need for pixel-level annotations. Furthermore, in light of the results we present in this work, we will formalize the concept of clinical-grade decision support systems, proposing—in contrast with the existing literature—a new measure for clinical applicability.
One of the main contributions of this work is the scale at which we learn classification models. We collected three datasets in the field of computational pathology: (1) a prostate core biopsy dataset consisting of 24,859 slides; (2) a skin dataset of 9,962 slides; and (3) a breast metastasis to lymph nodes dataset of 9,894 slides. Each of these datasets is at least one order of magnitude larger than all other datasets in the field. To put this in the context of other computer vision problems, we analyzed an equivalent number of pixels to 88 ImageNet datasets (Fig. 1a). It is important to stress that the data were not curated. The slides collected for each tissue type represent the equivalent of at least 1 year of clinical cases and are thus representative of slides generated in a true pathology laboratory, including common artifacts, such as air bubbles, microtomy knife slicing irregularities, fixation problems, cautery, folds and cracks, as well as digitization artifacts, such as striping and blurred regions. Across the three tissue types, we included 17,661 external slides, which were produced in the pathology laboratories of their respective institutions within the United States and another 44 countries (Extended Data Fig. 1), illustrating the unprecedented technical variability included in a computational pathology study.
Fig. 1 |. Overview of the data and proposed deep learning framework presented in this study.
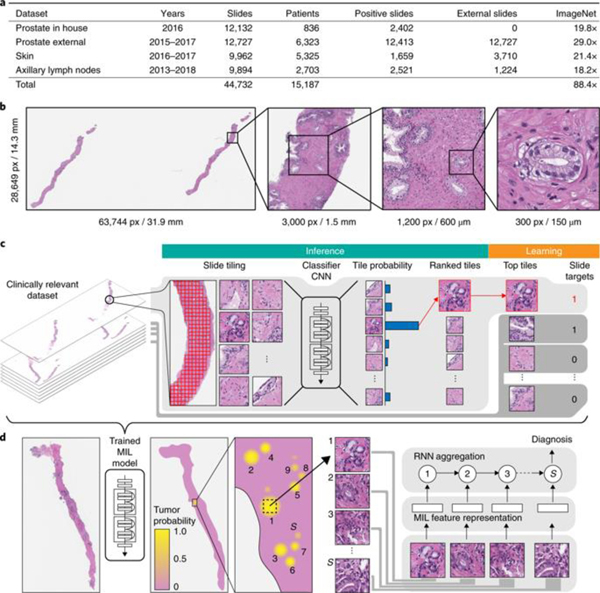
a, Description of the datasets. This study is based on a total of 44,732 slides from 15,187 patients across three different tissue types: prostate, skin and axillary lymph nodes. The prostate dataset was divided into in-house slides and consultation slides to test for staining bias. The class imbalance varied from 1:4 for prostate to 1:3 for breast. A total of 17,661 slides were submitted to MSK from more than 800 outside institutions in 45 countries for a second opinion. To put the size of our dataset into context, the last column shows a comparison, in terms of the pixel count, with ImageNet—the state of the art in computer vision, containing over 14 million images. b, Left, hematoxylin and eosin slide of a biopsy showing prostatic adenocarcinoma. The diagnosis can be based on very small foci of cancer that account for <1% of the tissue surface. In the slide to the left, only about six small tumor glands are present. The right-most image shows an example of a malignant gland. Its relation to the entire slide is put in perspective to reiterate the difficulty of the task. c, The MIL training procedure includes a full inference pass through the dataset, to rank the tiles according to their probability of being positive, and learning on the top-ranking tiles per slide. CNN, convolutional neural network. d, Slide-level aggregation with a recurrent neural network (RNN). The S most suspicious tiles in each slide are sequentially passed to the RNN to predict the final slide-level classification.
The datasets chosen represent different but complementary views of clinical practice, and offer insight into the types of challenges a flexible and robust decision support system should be able to solve. Prostate cancer is the leading source of new cancer cases and the second most frequent cause of death among men after lung cancers24. Multiple studies have shown that prostate cancer diagnosis has a high inter- and intraobserver variability25–27 and is frequently based on the presence of very small lesions that comprise <1% of the entire tissue surface area (Fig. 1b). Making diagnosis more reproducible and aiding in the diagnosis of cases with low tumor volume are examples of how decision support systems can improve patient care. The skin cancer basal cell carcinoma (BCC) rarely causes metastases or death28. In its most common form (nodular), pathologists can readily identify and diagnose the lesion. With approximately 4.3 million individuals diagnosed annually in the United States29, it is the most common form of cancer. In this scenario, a decision support system should increase clinical efficiency by streamlining the work of the pathologist.
To fully leverage the scale of our datasets, it is unfeasible to rely on supervised learning, which requires manual annotations. Instead, we propose to use the slide-level diagnosis, which is readily available from anatomic pathology laboratory information systems (LISs) or electronic health records, to train a classification model in a weakly supervised manner. Crucially, diagnostic data retrieved from pathology reports are easily scalable, as opposed to expert annotation for supervised learning, which is time prohibitive at scale. To be more specific, the slide-level diagnosis casts a weak label on all tiles within a particular WSI. In addition, we know that if the slide is negative, all of its tiles must also be negative and not contain tumor. In contrast, if the slide is positive, it must be true that at least one of all of the possible tiles contains tumor. This formalization of the WSI classification problem is an example of the general standard multiple instance assumption, for which a solution was first described in ref. 30. Multiple instance learning (MIL) has since been widely applied in many machine learning domains, including computer vision31–34.
Current methods for weakly supervised WSI classification rely on deep learning models trained under variants of the MIL assumption. Typically, a two-step approach is used, where first a classifier is trained with MIL at the tile level and then the predicted scores for each tile within a WSI are aggregated, usually by combining (pooling) their results with various strategies35, or by learning a fusion model36. Inspired by these works, we developed a novel framework that leverages MIL to train deep neural networks, resulting in a semantically rich tile-level feature representation. These representations are then used in a recurrent neural network (RNN) to integrate the information across the whole slide and report the final classification result (Fig. 1c,d).
Results
Test performance of ResNet34 models trained with MIL for each tissue type.
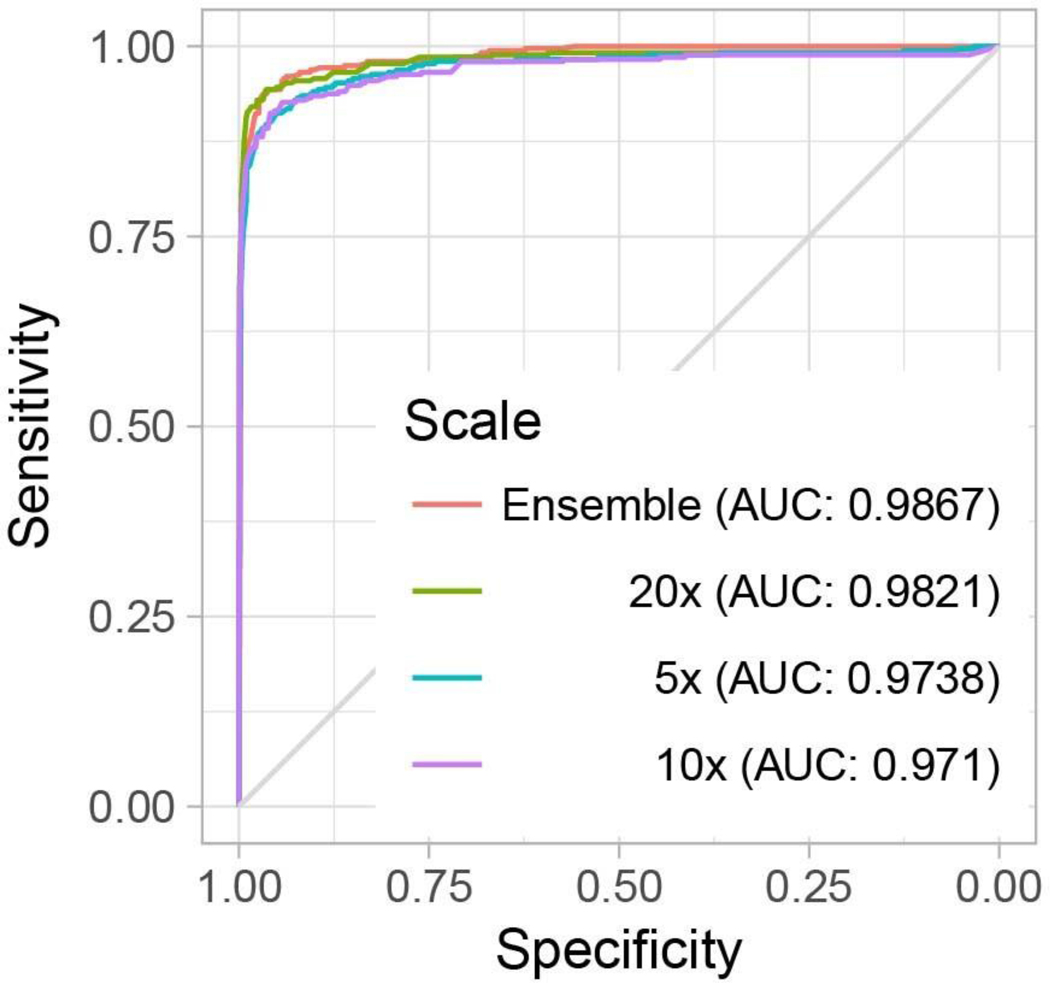
We trained ResNet34 models to classify tiles using MIL. At test time, a slide is predicted positive if at least one tile is predicted positive within that particular slide. This slide-level aggregation derives directly from the standard multiple instance assumption and is generally referred to as max-pooling. Performance on the test set was measured for models trained at different magnifications for each dataset (Extended Data Fig. 2). Histology contains information at different scales, and pathologists review patient tissue on glass slides at varying zoom levels. For example, in prostate histopathology, architectural and cytological features are both important for diagnosis and are more easily appreciated at different magnifications. For prostate, the highest magnification consistently gave better results (Extended Data Fig. 2a), while for BCC detection, 5× magnification showed higher accuracy (Extended Data Fig. 2b). Interestingly, the error modes on the test set across magnification conditions were complementary: in prostate, the 20× model performed better in terms of false negatives, while the 5× model performed better on false positives. Simple ensemble models were generated by max-pooling the response across the different magnifications. We note that these naive multiscale models outperformed the single-scale models for the prostate dataset in terms of accuracy and area under the curve (AUC), but not for the other datasets. Models trained at 20× achieved AUCs of 0.986, 0.986 and 0.965 on the test sets of the prostate, BCC and axillary lymph node datasets, respectively, highlighting the efficacy of the proposed method in discerning tumor regions from benign regions in a wide variety of tissue types.
Dataset size dependence of classification accuracy.
We conducted experiments to determine whether the dataset was large enough to saturate the error rate on the validation set. For these experiments, the prostate dataset (excluding the test portion) was split in a common validation set with 2,000 slides and training sets of different sizes (100, 200, 500, 1,000, 2,000, 4,000, 6,000 and 8,000), with each training dataset being a superset of all of the previous datasets. The results indicate that while the validation error is starting to saturate, further improvement can be expected from even larger datasets than the one collected for this study (Fig. 2a). Although the number of slides needed to achieve satisfactory results may vary by tissue type, we observed that, in general, at least 10,000 slides are necessary for good performance.
Fig. 2 |. Dataset size impact and model introspection.
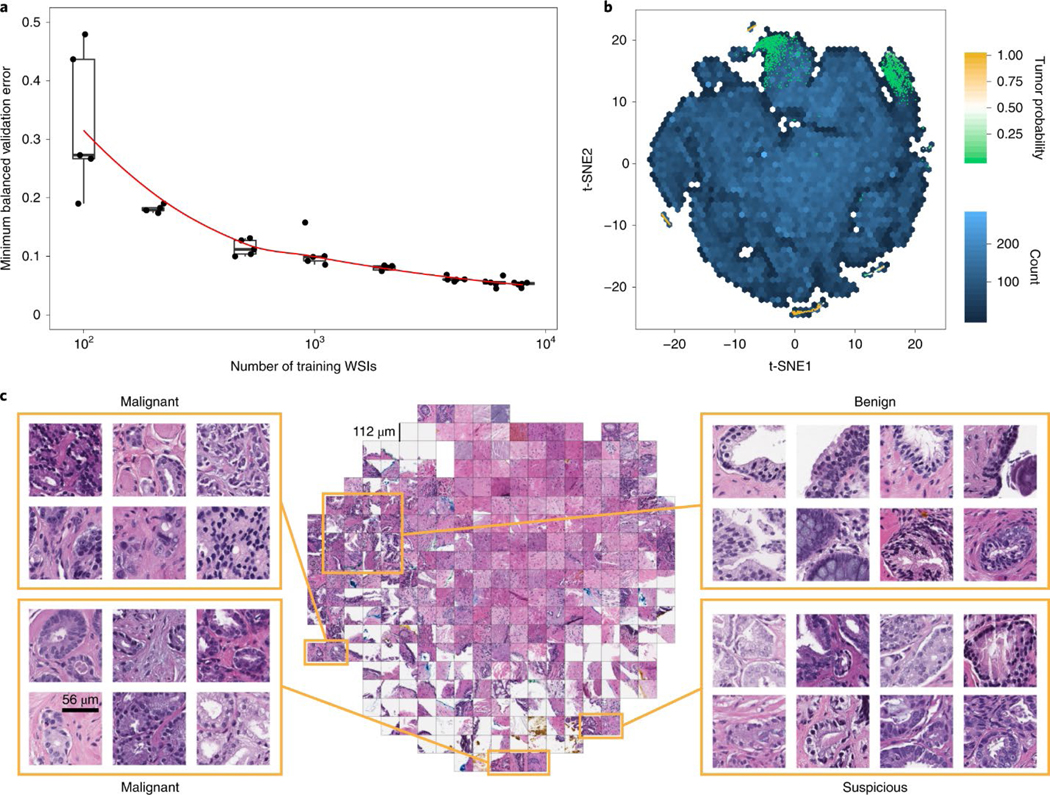
a, Dataset size plays an important role in achieving clinical-grade MIL classification performance. Training of ResNet34 was performed with datasets of increasing size; for every reported training set size, five models were trained, and the validation errors are reported as box plots (n = 5). This experiment underlies the fact that a large number of slides are necessary for generalization of learning under the MIL assumption. b,c, The prostate model has learned a rich feature representation of histopathology tiles. b, A ResNet34 model trained at 20× was used to obtain the feature embedding before the final classification layer for a random set of tiles in the test set (n = 182,912). The embedding was reduced to two dimensions with t-SNE and plotted using a hexagonal heat map. Top-ranked tiles coming from negative and positive slides are represented by points colored by their tumor probability. c, Tiles corresponding to points in the two-dimensional t-SNE space were randomly sampled from different regions. Abnormal glands are clustered together on the bottom and left sides of the plot. A region of tiles with a tumor probability of ~0.5 contains glands with features suspicious for prostatic adenocarcinoma. Normal glands are clustered on the top left region of the plot.a, Dataset size plays an important role in achieving clinical-grade MIL classification performance. Training of ResNet34 was performed with datasets of increasing size; for every reported training set size, five models were trained, and the validation errors are reported as box plots (n = 5). This experiment underlies the fact that a large number of slides are necessary for generalization of learning under the MIL assumption. b,c, The prostate model has learned a rich feature representation of histopathology tiles. b, A ResNet34 model trained at 20× was used to obtain the feature embedding before the final classification layer for a random set of tiles in the test set (n = 182,912). The embedding was reduced to two dimensions with t-SNE and plotted using a hexagonal heat map. Top-ranked tiles coming from negative and positive slides are represented by points colored by their tumor probability. c, Tiles corresponding to points in the two-dimensional t-SNE space were randomly sampled from different regions. Abnormal glands are clustered together on the bottom and left sides of the plot. A region of tiles with a tumor probability of ~0.5 contains glands with features suspicious for prostatic adenocarcinoma. Normal glands are clustered on the top left region of the plot.
Model introspection by visualization of the feature space in two dimensions.
To gain insight into the model’s representation of histopathology images, we visualized the learned feature space in two dimensions so that tiles that have similar features according to the model are shown close to each other (see Fig. 2b,c for the prostate model and Extended Data Fig. 3 for the BCC and axillary lymph nodes models). The prostate model shows a large region of different stroma tiles at the center of the plot in Fig. 2c, extending towards the top right corner. The top left corner is where benign-looking glands are represented. The bottom portion contains background and edge tiles. The discriminative tiles with high tumor probability are clustered in two regions at the bottom and left of the plot. A closer look reveals the presence of malignant glands. Interestingly, a subset of the top-ranked tiles with a tumor probability close to 0.5, indicating uncertainty, are tiles that contain glands suspicious of being malignant.
Comparison of different slide aggregation approaches.
The max-pooling operation that leads to the slide prediction under the MIL assumption is not robust. A single spurious misclassification can change the slide prediction, possibly resulting in a large number of false positives. One way to mitigate this type of mistake is to learn a slide aggregation model on top of the MIL classification results. For example, Hou et al.36. learned a logistic regression based on the number of tiles per class as predicted by an ensemble of tile classifiers. Similarly, Wang et al.18. extracted geometrical features from the tumor probability heat map generated by a tile-level classifier and trained a random forest model, winning the CAMELYON16 challenge. Following the latter approach, we trained a random forest model on manually engineered features extracted from the heat map generated by our MIL-based tile classifier. For prostate cancer classification, the random forest trained on the validation split at 20× magnification produced an AUC of 0.98 on the test set, which was not statistically significantly different from MIL alone (Extended Data Fig. 4). Although this procedure drastically decreased the false positive rate, and at 20× achieved a better balanced error than the basic max-pooling aggregation, this came with an unacceptable decrease in sensitivity.
The previous aggregation methods do not take advantage of the information contained in the feature representation learned during training. Given a vector representation of tiles, even if singularly they were not classified as positive by the tile classifier, taken together they could be suspicious enough to trigger a positive response by a representation-based slide-level classifier. Based on these ideas and empirical support from ref. 37, we introduce an RNN-based model that can integrate information at the representation level to emit a final slide classification (Fig. 1d). Interestingly, information can also be integrated across the various magnifications to produce a multi-scale classification. At 20×, the MIL-RNN models resulted in 0.991, 0.989 and 0.965 AUCs for the prostate, BCC and breast metastases datasets, respectively (Fig. 3). For the prostate experiment, the MIL-RNN method was statistically significantly better than max-pooling aggregation. The multiscale approach was tested on the prostate data, but its performance was not better than that achieved by the single-scale model trained at 20×.
Fig. 3 |. Weakly supervised models achieve high performance across all tissue types.
The performances of the models trained at 20× magnification on the respective test datasets were measured in terms of AUC for each tumor type. a, For prostate cancer (n = 1,784) the MIL-RNN model significantly (P < 0.001) outperformed the model trained with MIL alone, resulting in an AUC of 0.991. b,c, The BCC model (n = 1,575) performed at 0.988 (b), while breast metastases detection (n = 1,473) achieved an AUC of 0.966 (c). For these latter datasets, adding an RNN did not significantly improve performance. Statistical significance was assessed using DeLong’s test for two correlated ROC curves.
Pathology expert analysis of the MIL-RNN error modes.
Pathologists specialized in each discipline analyzed the test set errors made by MIL-RNN models trained at 20× magnification (a selection of cases is presented in Fig. 4a–c). Several discrepancies (six in prostate, eight in BCC and 23 in axillary lymph nodes; see Fig. 4d) were found between the reported case diagnosis and the true slide class (that is, presence/absence of tumor). Because the ground truth is reliant on the diagnosis reported in the LIS, the observed discrepancies can be due to several factors: (1) under the current WSI scanning protocol, as only select slides are scanned in each case, there exists the possibility of a mismatch between the slide scanned and the reported LIS diagnosis linked to each case; (2) a deeper slide level with no carcinoma present could be selected for scanning; and (3) tissue was removed to create tissue microarrays before slide scanning. Encouragingly, the training procedure proved robust to the ground truth noise in our datasets.
Fig. 4 |. Pathology analysis of the misclassification errors on the test sets.
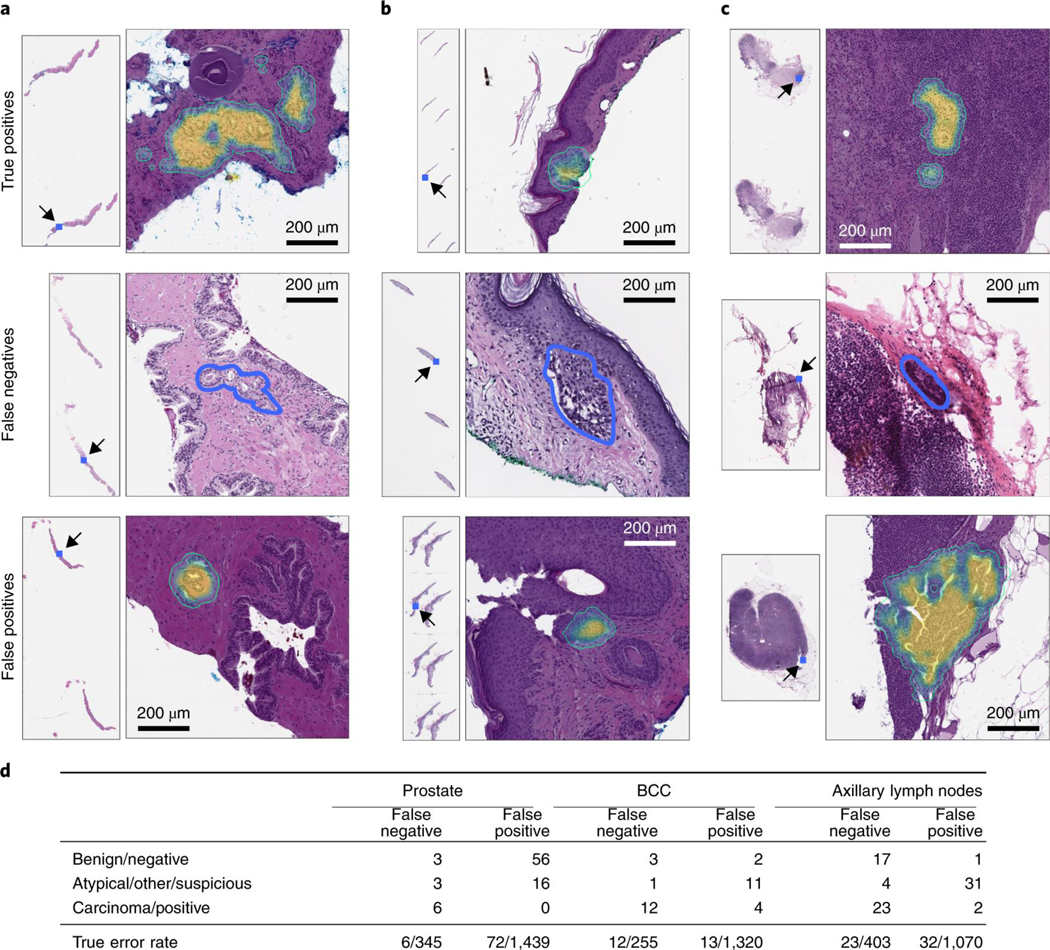
a–c, Randomly selected examples of classification results on the test set. Examples of true positive, false negative and false positive classifications are shown for each tumor type. The MIL-RNN model trained at 20× magnification was run with a step size of 20 pixels across a region of interest, generating a tumor probability heat map. On every slide, the blue square represents the enlarged area. For the prostate dataset (a), the true positive represents a difficult diagnosis due to tumor found next to atrophy and inflammation; the false negative shows a very low tumor volume; and for the false positive the model identified atypical small acinar proliferation, showing a small focus of glands with atypical epithelial cells. For the BCC dataset (b), the true positive has a low tumor volume; the false negative has a low tumor volume; and for the false positive the tongue of the epithelium abutting from the base of the epidermis shows an architecture similar to BCC. For the axillary lymph nodes dataset (c), the true positive shows ITCs with a neoadjuvant chemotherapy treatment effect; the false negative shows a slightly out of focus cluster of ITCs missed due to the very low tumor volume and blurring; and the false positive shows displaced epithelium/benign papillary inclusion in a lymph node. d, Subspecialty pathologists analyzed the slides that were misclassified by the MIL-RNN models. While slides can either be positive or negative for a specific tumor, sometimes it is not possible to diagnose a single slide with certainty based on morphology alone. These cases were grouped into the categories ‘atypical’ and ‘suspicious’ for prostate and breast lesions, respectively. The ‘other’ category consisted of skin biopsies that contained tumors other than BCC. We observed that some of the misclassifications stem from incorrect ground truth labels.
For the prostate model, three of the 12 false negatives were correctly predicted as negative by the algorithm. Three other slides showed atypical morphological features, but they were not sufficient to diagnose carcinoma. The confirmed six false negatives were characterized by having very low tumor volume. Taking into account the corrections to the ground truth, the AUC for the prostate test set improved from 0.991 to 0.994. The 72 false positives were reviewed as well. The algorithm falsely identified small foci of glands as cancer, focusing on small glands with hyperchromatic nuclei that contained at least a few cells with prominent nucleoli. Many of the flagged glands also showed intraluminal secretions. Overall, the algorithm was justified in reporting the majority of these cases as suspicious, thus fulfilling the requisites of a screening tool.
For the BCC model, four false negatives were corrected to true negatives, and four false positives were corrected to true positives. Given these corrections, the AUC improved from 0.988 to 0.994. The 12 cases determined to be false negatives were characterized by low tumor volume. The 15 false positives included squamous cell carcinomas and miscellaneous benign neoplastic and non-neoplastic skin lesions.
For the breast metastasis model, 17 of the initially classified false negatives were correctly classified as negatives, while four slides contained suspicious morphology that would likely require follow-up tests. A total of 21 false negatives were corrected to true negatives. In addition, two false positives were corrected to true positives. False negative to true negative corrections were due to the tissue of interest not being present on a deeper hematoxylin and eosin slide, or sampling error at the time the frozen section was prepared. False positive to true positive corrections were due to soft tissue metastatic deposits or tumor emboli. The AUC improved from 0.965 to 0.989 given these corrections. Of the 23 false negatives, eight were macro-metastasis, 13 were micro-metastasis and two were isolated tumor cells (ITCs). Notably, 12 cases (four false negatives and eight false positives) showed signs of treatment effect from neoadjuvant chemotherapy.
Investigation of technical variability introduced by slide preparation at multiple institutions and different scanners.
Several sources of variability come into play in computational pathology. In addition to all of the morphological variability, technical variability is introduced during glass slide preparation and scanning. How this variability can affect the prediction of an assistive model is a question that must be investigated thoroughly.
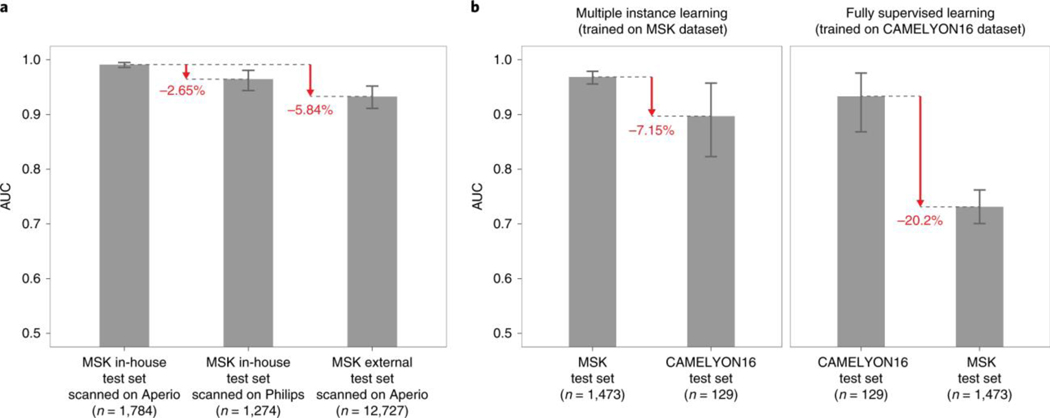
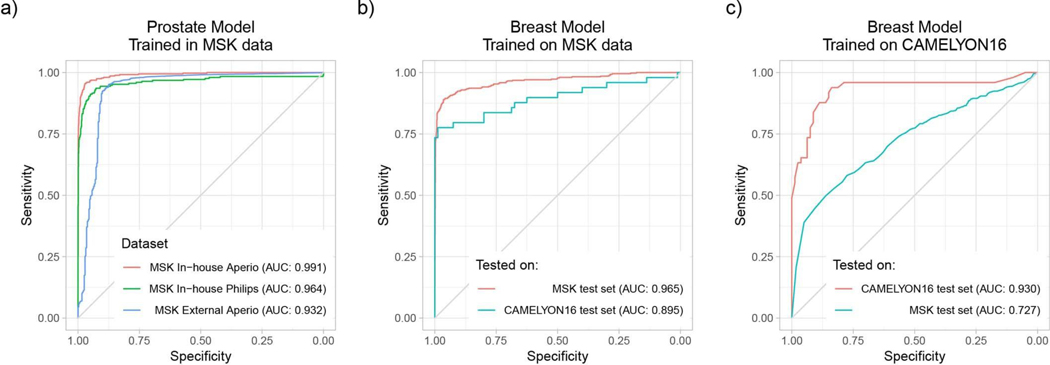
Assessing the performance of models on slides digitized on different scanners is crucial for enabling the application of the same model in departments with varied scanner vendor workflows or smaller clinics that operate scanners from different vendors and do not have the infrastructure to train a model tailored to their needs. To test the effect of the whole slide scanner type on model performance, we scanned a substantial subset of the in-house prostate test set (1,274 out of 1,784) on a Philips IntelliSite Ultra Fast Scanner that was recently approved by the Food and Drug Administration for primary diagnostic use. We observed a decrease in performance in terms of AUC of 3% points (Fig. 5a and Extended Data Fig. 5a). Analyzing the mismatches between the predictions on Leica Aperio WSIs and their matching Philips digital slides revealed a perceived difference in brightness, contrast and sharpness that could affect the prediction performance. In practice, an effective solution to reducing the generalization error even further could be training on a mixed dataset or fine-tuning the model on data from the new scanner.
Fig. 5 |. Weak supervision on large datasets leads to higher generalization performance than fully supervised learning on small curated datasets.
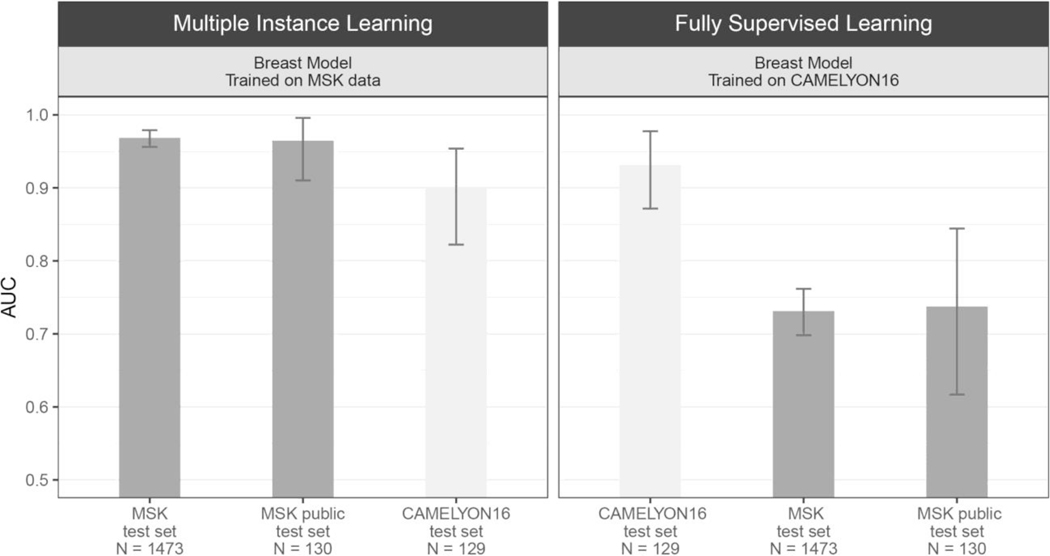
The generalization performance of the proposed prostate and breast models were evaluated on different external test sets. a, Results of the prostate model trained with MIL on MSK in-house slides and tested on: (1) the in-house test set (n = 1,784) digitized on Leica Aperio AT2 scanners; (2) the in-house test set digitized on a Philips Ultra Fast Scanner (n = 1,274); and (3) external slides submitted to MSK for consultation (n = 12,727). Performance in terms of AUC decreased by 3 and 6% for the Philips scanner and external slides, respectively. b, Comparison of the proposed MIL approach with state-of-the-art fully supervised learning for breast metastasis detection in lymph nodes. Left, the model was trained on MSK data with our proposed method (MIL-RNN) and tested on the MSK breast data test set (n = 1,473) and on the test set of the CAMELYON16 challenge (n = 129), showing a decrease in AUC of 7%. Right, a fully supervised model was trained following ref. 18 on CAMELYON16 training data. While the resulting model would have won the CAMELYON16 challenge (n = 129), its performance drops by over 20% when tested on a larger test set representing real-world clinical cases (n = 1,473). Error bars represent 95% confidence intervals for the true AUC calculated by bootstrapping each test set.
To measure the effects of slide preparation on model performance, we gathered a very large set consisting of over 12,000 prostate consultation slides submitted to the Memorial Sloan Kettering Cancer Center (MSK) from other institutions in the United States and abroad. It should be noted that these slides are typically diagnostically challenging and are the basis for the requested expert pathologist review. We applied the MIL-RNN model trained at 20× to the large submitted slides dataset and observed a drop of about 6% points in terms of AUC (Fig. 5a and Extended Data Fig. 5a). Importantly, the decrease in performance was mostly seen in the specificity to the new test set, while sensitivity remained high.
Comparison of fully supervised learning with weakly supervised learning.
To substantiate the claim that models trained under full supervision on small, curated datasets do not translate well to clinical practice, several experiments were performed with the CAMELYON16 dataset23, which includes pixel-wise annotations for 270 training slides and is one of the largest annotated, public digital pathology datasets available. We implemented a model for automatic detection of metastatic breast cancer on the CAMELYON16 dataset, modeled after Wang et al.18—the winning team of the CAMELYON16 challenge. The approach can be considered state of the art for this task and relies on fully supervised learning and pixel-level expert annotations. The main differences in our implementation of ref. 18 are the architecture used (ResNet34 instead of GoogLeNetv3), their usage of hard negative mining, and the features extracted to train the slide-level random forest classifier. Our implementation achieved an AUC of 0.930 on the CAMELYON16 test set, similar to the 0.925 achieved in ref. 18. This model would have won the classification portion of the CAMELYON16 challenge and would be ranked fifth on the open leaderboard. The same model, trained under full supervision on CAMELYON16, was applied to the MSK test set of the axillary lymph nodes dataset and resulted in an AUC of 0.727, constituting a 20% drop compared with its performance on the CAMELYON16 test set (Fig. 5b, right panel). The reverse experiment, done by training our MIL model on the MSK axillary lymph node data and testing it on the CAMELYON16 test data, produced an AUC of 0.899, representing a much smaller drop in performance compared with the 0.965 on the MSK test set (Fig. 5b, left panel).
These results illustrate that current deep learning models, trained on small datasets, even with the advantage of exhaustive, pixel-wise labels, are not able to generalize to clinical-grade, real-world data. We hypothesize that small, well-curated datasets are not sufficient to capture the vast biological and morphological variability of cancer, as well as the technical variability introduced by the staining and preparation processes in histopathology. Our observations urge caution and in-depth evaluation on real-world datasets before applying deep learning models for decision support in clinical practice. These results also show that weakly supervised approaches such as the one proposed here have a clear advantage over conventional fully supervised learning in that they enable training on massive, diverse datasets without the necessity for data curation.
Discussion
The main hypothesis addressed in this work is that clinical-grade performance can be reached without annotating WSIs at the pixel level. To test our hypothesis, we developed a deep learning framework that combines convolutional neural networks with RNNs under a MIL approach. We compiled a large dataset comprising 44,732 slides from 15,187 patients across three different cancer types. We built a state-of-the-art compute cluster that was essential for the feasibility of the project. Extensive validation experiments confirmed the hypothesis and showed that clinical-grade decision support is feasible.
The implications of these results are wide ranging. (1) The fact that manual pixel-level annotation is not necessary allows for the compilation of datasets that are magnitudes larger than in previous studies. (2) This, in turn, allows our algorithm to learn from the full breadth of slides presented to clinicians from real-life clinical practice, representing the full wealth of biological and technical variability. (3) As a result, no data curation is necessary because the model can learn that artifacts are not important for the classification task. (4) The previous two points allow the model trained with the proposed method to generalize better to real data that would be observed in pathology practice. (5) The generalization performance is clinically relevant with AUCs greater than 0.98 for all cancer types tested. (6) We rigorously define clinical grade and propose a strategy to integrate this system in the clinical work flow.
Most literature refers to clinical grade in terms of comparison with a human performing the same task, usually under time or other constraints. We suggest that these comparisons are artificial and offer little insight into how to use such systems in clinical practice. We propose a different approach to measure clinical-grade performance. In clinical practice, a case, especially if challenging, is reviewed by multiple pathologists with the help of immunohistochemistry and molecular information in addition to hematoxylin and eosin morphology. On the basis of this companion information, one can assume that a team of pathologists at a comprehensive cancer center will operate with 100% sensitivity and specificity. Under these assumptions, clinical grade for a decision support system does not mean surpassing the performance of pathologists, which is impossible, but achieving 100% sensitivity with an acceptable false positive rate. This formulation lends itself to a clinical application as follows.
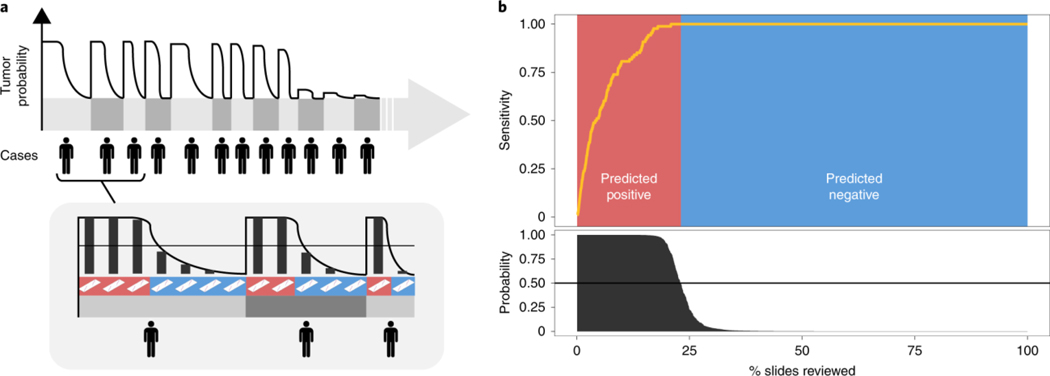
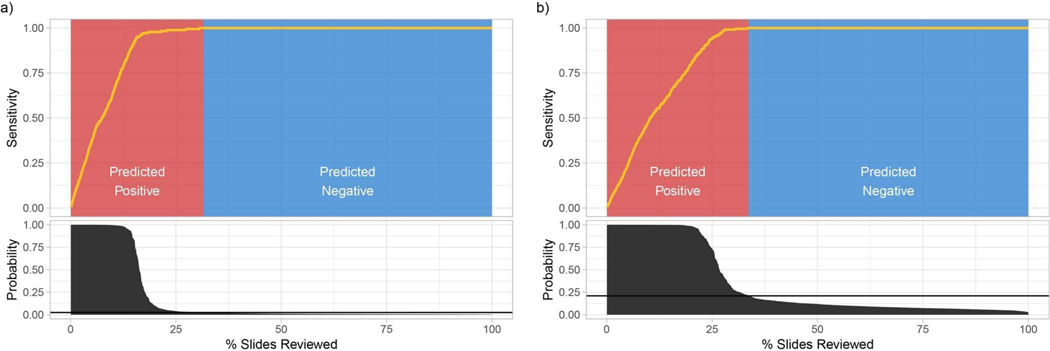
At a fully operational digital pathology department, the predictive model is run on each scanned slide. The algorithm sorts cases, and slides within each case, based on the predicted tumor probability, as soon as they are available from the pathology laboratory. During diagnostic reporting, the pathologist is presented with the model’s recommendations through an interface that would flag positive slides for rapid review in a screening scenario, or disregard all benign slides in a diagnostic scenario. In this latter case, we show in Fig. 6 (see Extended Data Fig. 6 for BCC and breast metastases) that our prostate model would allow the removal of more than 75% of the slides from the workload of a pathologist without any loss in sensitivity at the patient level. For pathologists who must operate in the increasingly complex, detailed and data-driven environment of cancer diagnostics, tools such as this will allow non-subspecialized pathologists to confidently and efficiently classify cancer with 100% sensitivity.
Fig. 6 |. Impact of the proposed decision support system on clinical practice.
a, By ordering the cases, and slides within each case, based on their tumor probability, pathologists can focus their attention on slides that are probably positive for cancer. b, Following the algorithm’s prediction would allow pathologists to potentially ignore more than 75% of the slides while retaining 100% sensitivity for prostate cancer at the case level (n = 1,784).
Methods
Hardware and software.
All experiments were conducted on MSK’s high-performance computing cluster. In particular, we took advantage of seven NVIDIA DGX-1 compute nodes, each containing eight V100 Volta graphics processing units (GPUs) and 8TB SSD local storage. Each model was trained on a single GPU. We used OpenSlide38 (version 3.4.1) to access the WSI files on the fly, and PyTorch39 (version 1.0) for data loading, building models and training. The final statistical analysis was performed in R40 (version 3.3.3), using pROC41 (version 1.9.1) for receiver operating characteristic (ROC) statistics and ggplot2 (version 3.0.0)42 for generating plots.
Statistics.
AUCs for the various ROC curves were calculated in R with pROC. Confidence intervals were computed with the pROC package41 using bootstrapping with nonparametric, unstratified resampling, as described by Carpenter and Bithell43. Pairs of AUCs were compared with the pROC package41 using the two-tailed DeLong’s test for two correlated ROC curves44.
WSI datasets.
We collected three large datasets of hematoxylin and eosin-stained digital slides for the following tasks: (1) prostatic carcinoma classification; (2) BCC classification; and (3) the detection of breast cancer metastasis in axillary lymph nodes. A description is given in Fig. 1a. Unless otherwise stated, glass slides were scanned at MSK with Leica Aperio AT2 scanners at 20× equivalent magnification (0.5 μm pixel−1). Each dataset was randomly divided at the patient level in training (70%), validation (15%) and test (15%) sets. The training and validation sets were used for hyper-parameter tuning and model selection. The final models were run once on the test set to estimate generalization performance.
The prostate dataset consisted of 12,132 core needle biopsy slides produced and scanned at MSK (we refer to these as in-house slides). A subset of 2,402 slides were positive for prostatic carcinoma (that is, contained Gleason patterns 3 and above). An in-depth stratification by Gleason grade and tumor size is included in Supplementary Table 1. In addition to the in-house set, we also retrieved a set of 12,727 prostate core needle biopsies submitted to MSK for a second opinion from other institutions around the world. These slides were produced at their respective institutions but scanned on the whole slide scanners at MSK. For prostate only, the external slides were not used during training, but only at test time to estimate generalization to various sources of technical variability in glass slide preparation. A portion of the prostate (1,274 out of 1,784) test set was scanned on a Philips IntelliSite Ultra Fast Scanner to test generalization performance to scanning variability.
The skin dataset consisted of 9,962 slides from biopsies and excisions of a wide range of neoplastic and non-neoplastic skin lesions, including 1,659 BCCs, with all common histological variants (superficial, nodular, micronodular and infiltrative) represented. The breast cancer metastases dataset of axillary lymph nodes consisted of 9,894 slides, 2,521 of which contained macro-metastases, micro-metastases or ITCs. Included in this dataset were slides generated from intraoperative consultations (for example, frozen section slides), in which the quality of staining varied from the standardized hematoxylin and eosin staining protocols used on slides from formalin-fixed, paraffin-embedded tissue. The dataset also included patients treated with neoadjuvant chemotherapy, which may be diagnostically challenging in routine pathology practice (that is, a small volume of metastatic tumor and therapy-related changes in tumor morphology) and are known to lead to high false negative rates45. For the skin and axillary lymph nodes data, external slides were included during training.
Slide diagnosis retrieval.
Pathology reports are recorded in the LIS of the pathology department. For the prostate and axillary lymph nodes datasets, the ground truth labels (that is, the slide-level diagnoses) are retrieved directly by querying the LIS database. This is made possible by the structured nature of the reporting done for these subspecialties. In dermatopathology, BCCs are not reported in structured form. To overcome this problem, a trained dermatopathologist (A.M.) checked the free text diagnoses and assigned final binary labels to each case manually.
Dataset curation.
The datasets were not curated, to test the applicability of the proposed system in a real-world, clinical scenario. Across all datasets, fewer than ten slides were removed due to excessive pen markings.
MIL-based slide diagnosis.
Classification of a whole digital slide (for example, WSI) based on a tile-level classifier can be formalized under the classic MIL approach when only the slide-level class is known and the classes of each tile in the slide are unknown. Each slide si from our slide pool S = {si : i = 1, 2, …, n} can be considered a bag consisting of a multitude of instances (we used tiles of size 224 × 224 pixels). For positive bags, there must exist at least one instance that is classified as positive by some classifier. For negative bags, instead, all instances must be classified as negative. Given a bag, all instances are exhaustively classified and ranked according to their probability of being positive. If the bag is positive, the top-ranked instance should have a probability of being positive that approaches 1; if it is negative, its probability of being positive should approach 0. Solving the MIL task induces the learning of a tile-level representation that can linearly separate the discriminative tiles in positive slides from all other tiles.
This representation will be used as input to an RNN. The complete pipeline for the MIL classification algorithm (Fig. 1c) comprises the following steps: (1) tiling of each slide in the dataset (for each epoch, which consists of an entire pass through the training data); (2) a complete inference pass through all of the data; (3) intraslide ranking of instances; and 4) model learning based on the top-ranked instance for each slide.
Slide tiling.
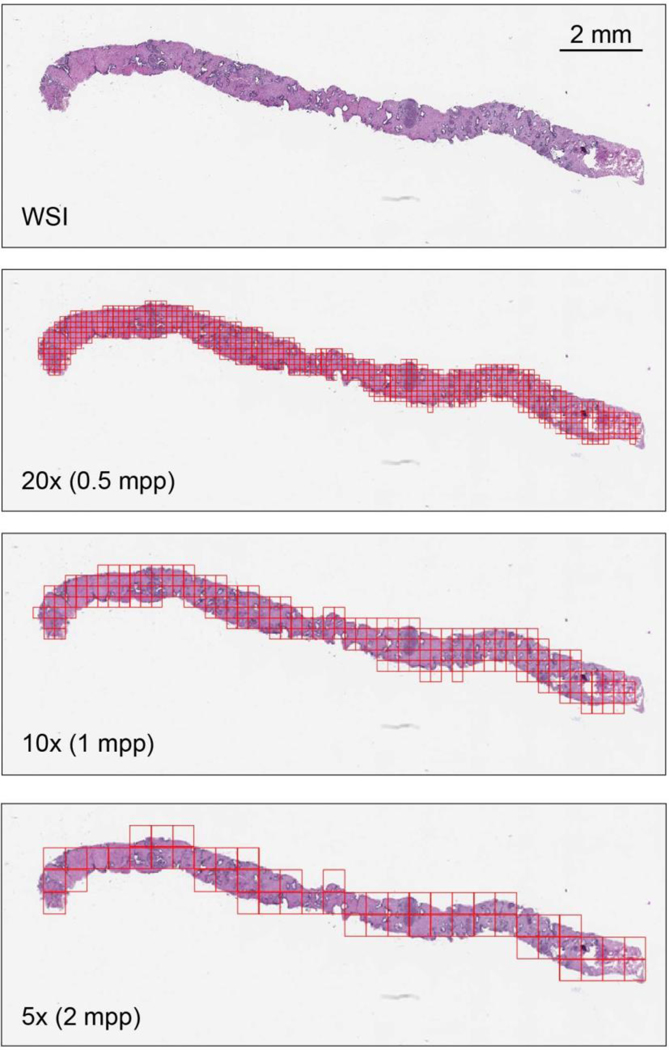
The instances were generated by tiling each slide on a grid (Extended Data Fig. 7). Otsu’s method is used to threshold the slide thumbnail image to efficiently discard all background tiles, thus drastically reducing the amount of computation per slide. Tiling can be performed at different magnification levels and with various levels of overlap between adjacent tiles. We investigated three magnification levels (5×, 10x and 20×). The amount of overlap used was different at each magnification during training and validation: no overlap at 20×, 50% overlap at 10× and 67% overlap at 5×. For testing, we used 80% overlap at every magnification. Given a tiling strategy, we produce bags , where is the bag for slide si containing mi total tiles.
Model training.
The model is a function fθ with current parameter θ that maps input tiles bi,j to class probabilities for ‘negative’ and ‘positive’ classes. Given our bags B, we obtain a list of vectors O = {oi: i = 1, 2,…, n}—one for each slide si containing the probabilities of class ‘positive’ for each tile bi,j: j = 1, 2,…, m in We then obtain the index ki of the tile within each slide, which shows the highest probability of being ‘positive’: ki = argmax(oi). This is the most stringent version of MIL, but we can relax the standard MIL assumption by introducing hyper-parameter K and assume that at least K tiles exist in positive slides that are discriminative. For K = 1, the highest ranking tile in bag is then bi,k. The output of the network can then be compared to yi, the target of slide si, through the cross-entropy loss l as in equation (1). Similarly, if K > 1, all selected tiles from a slide share the same target yi and the loss can be computed with equation (1) for each one of the K tiles:
| (1) |
Given the unbalanced frequency of classes, weights w0 and w1, for negative and positive classes, respectively, can be used to give more importance to the under-represented examples. The final loss is the weighted average of the losses over a mini-batch. Minimization of the loss is achieved via stochastic gradient descent (SGD) using the Adam optimizer and learning rate 0.0001. We used mini-batches of size 512 for AlexNet, 256 for ResNets and 128 for VGGs and DenseNet201. All models were initialized with ImageNet pretrained weights. Early stopping was used to avoid overfitting.
Model testing.
At validation/test time, all of the tiles for each slide are fed through the network. Given a threshold (usually 0.5), if at least one tile is positive, the entire slide is called positive; if all of the instances are negative, the slide is negative. In addition, we assume the probability of a slide being positive to be the highest probability among all of the tiles in that slide. This max-pooling over the tile probability is the easiest aggregation technique. We explore different aggregation techniques below.
Naive multiscale aggregation.
Given models f20×, f10x, and f5x trained at 20×, 10× and 5× magnifications, a multiscale ensemble can be created by pooling the predictions of each model with an operator. We used average and max-pooling to obtain naive multiscale models.
Random forest-based slide integration.
Given a model f trained at a particular resolution, and a WSI, we can obtain a heat map of tumor probability over the slide. We can then extract several features from the heat map to train a slide aggregation model. For example, Hou et al.36 used the count of tiles in each class to train a logistic regression model. Here, we extend that approach by adding several global and local features, and train a random forest to emit a slide diagnosis. The features extracted are: (1) total count of tiles with probability ≥0.5; (2–11) tenbin histogram of tile probability; (12–30) count of connected components for a probability threshold of 0.1 of size in the ranges 1–10, 11–15, 16–20, 21–25, 26–30, 31–40, 41–50, 51–60, 61–70 and >70, respectively; (31–40) ten-bin local histogram with a window of size 3 × 3 aggregated by max-pooling; (41–50) ten-bin local histogram with a window of size 3 × 3 aggregated by averaging; (51–60) ten-bin local histogram with a window of size 5 × 5 aggregated by max-pooling; (61–70) ten-bin local histogram with a window of size 5 × 5 aggregated by averaging; (71–80) ten-bin local histogram with a window of size 7 × 7 aggregated by max-pooling; (81–90) ten-bin local histogram with a window of size 7 × 7 aggregated by averaging; (91–100) ten-bin local histogram with a window of size 9 × 9 aggregated by max-pooling; (101–110) ten-bin local histogram with a window of size 9 × 9 aggregated by averaging; (111–120) ten-bin histogram of all tissue edge tiles; (121–130) ten-bin local histogram of edges with a linear window of size 3 × 3 aggregated by max-pooling; (131–140) ten-bin local histogram of edges with a linear window of size 3 × 3 aggregated by averaging; (141–150) ten-bin local histogram of edges with a linear window of size 5 × 5 aggregated by max-pooling; (151–160) ten-bin local histogram of edges with a linear window of size 5 × 5 aggregated by averaging; (161–170) ten-bin local histogram of edges with a linear window of size 7 × 7 aggregated by max-pooling; and (171–180) ten-bin local histogram of edges with a linear window of size 7 × 7 aggregated by averaging. The random forest was learned of the validation set instead of the training set to avoid over-fitting.
RNN-based slide integration.
Model f mapping a tile to class probability consists of two parts: a feature extractor fF that transforms the pixel space to representation space, and a linear classifier fC that projects the representation variables into the class probabilities. The output of fF for the ResNet34 architecture is a 512-dimensional vector representation. Given a slide and model f, we can obtain a list of the S most interesting tiles within the slide in terms of positive class probability. The ordered sequence of vector representations e = e1, e2,…, eS is the input to an RNN along with a state vector h. The state vector is initialized with a zero vector. Then, for step i = 1, 2,…, S of the recurrent forward pass, the new state vector hi is given by equation (2):
| (2) |
where We and Wh are the weights of the RNN model. At step S, the slide classification is simply o = WohS, where Wo maps a state vector to class probabilities. With S = 1, the model does not recur and the RNN should learn the fC classifier. This approach can be easily extended to integrate information at multiple scales. Given models f20×, f10x and f5x trained at 20×, 10× and 5× magnifications, we obtain the S most interesting tiles from a slide by averaging the prediction of the three models on tiles extracted at the same center pixel but at different magnifications. Now, the inputs to the RNN at each step i are e20x,i, e10x,i, e5x,i, and the state vector hi−1. The new state vector is then given by equation (3):
| (3) |
In all of the experiments, we used 128 dimensional vectors for the state representation of the recurrent unit, ten recurrent steps (S = 10), and weighted the positive class to give more importance to the sensitivity of the model. All RNN models were trained with cross-entropy loss and SGD with a batch size of 256.
MIL exploratory experiments.
We performed a set of exploratory experiments on the prostate dataset. At least five training runs were completed for each condition. The minimum balanced error on the validation set for each run was used to decide the best condition in each experiment. ResNet34 achieved the best results over other architectures tested. The relative balanced error rates with respect to ResNet34 were: +0.0738 for AlexNet, −0.003 for VGG11BN, +0.025 for ResNet18, +0.0265 for ResNet101 and +0.0085 for DenseNet201. Using a class-weighted loss led to better performance overall, and we adopted weights in the range of 0.80–0.95 in subsequent experiments. Given the scale of our data, augmenting the data with rotations and flips did not significantly affect the results: the best balanced error rate on the model trained with augmentation was 0.0095 higher than without augmentation. During training, we weighted the false negative errors more heavily to obtain models with high sensitivity.
Visualization of feature space.
For each dataset, we sampled 100 tiles from each test slide, in addition to its top-ranked tile. Given the trained 20× models, we extracted for each of the sampled tiles the final feature embedding before the classification layer. We used t-distributed stochastic neighbor embedding (t-SNE)46 for dimensionality reduction to two dimensions.
Pathology analysis of model errors.
A genitourinary subspecialized pathologist (V.E.R.) reviewed the prostate cases. A dermatopathology subspecialized pathologist (K.J.B.) reviewed the BCC cases. Two breast subspecialized pathologists (E.B. and M.G.H.) jointly reviewed the breast cases. For each tissue type, the respective pathologists were presented with all of the test errors and a randomly selected sample of 20 true positives. They were tasked with evaluating the model’s predictions and interpreting possible systematic error modalities. During the analysis, the pathologists had access to the model’s prediction and the full pathology report for each case.
CAMELYON16 experiments.
The CAMELYON16 dataset consists of 400 total patients for whom a single WSI is provided in a tag image file format (TIFF). Annotations are given in extensible markup language (XML) format, one per each positive slide. For each annotation, several regions, defined by vertex coordinates, may be present. Since these slides were scanned at a higher resolution than the slides scanned at MSK, a tiling method was developed to extract tiles containing tissue from both inside and outside the annotated regions at MSK’s 20× equivalent magnification (0.5 μm pixel−1) to enable direct comparison with our datasets. This method generates a grid of possible tiles, excludes background via Otsu thresholding and determines whether a tile is inside an annotation region by solving a point in polygon problem.
We used 80% of the training data to train our model, and we left 20% for model selection. We extracted at random 1,000 tiles from each negative slide, and 1,000 negative tiles and 1,000 positive tiles from the positive slides. A ResNet34 model was trained augmenting the dataset on the fly with 90° rotations, horizontal flips and color jitter. The model was optimized with SGD. The best-performing model on the validation set was selected. Slide-level predictions were generated with the random forest aggregation approach explained before and trained on the entire training portion of the CAMELYON16 dataset. To train the random forest model, we exhaustively tiled with no overlap the training slides to generate the tumor probability maps. The trained random forest was then evaluated on the CAMELYON16 test dataset and on our large breast lymph node metastasis test datasets.
Data protection.
This project was governed by an Institutional Review Board-approved retrospective research protocol under which consent/authorization was waived before research was carried out. All data collection, research and analysis was conducted exclusively at MSK.
All publicly shared WSIs were de-identified and do not contain any protected health information or label text.
Reporting Summary.
Further information on research design is available in the Nature Research Reporting Summary linked to this article.
Extended Data
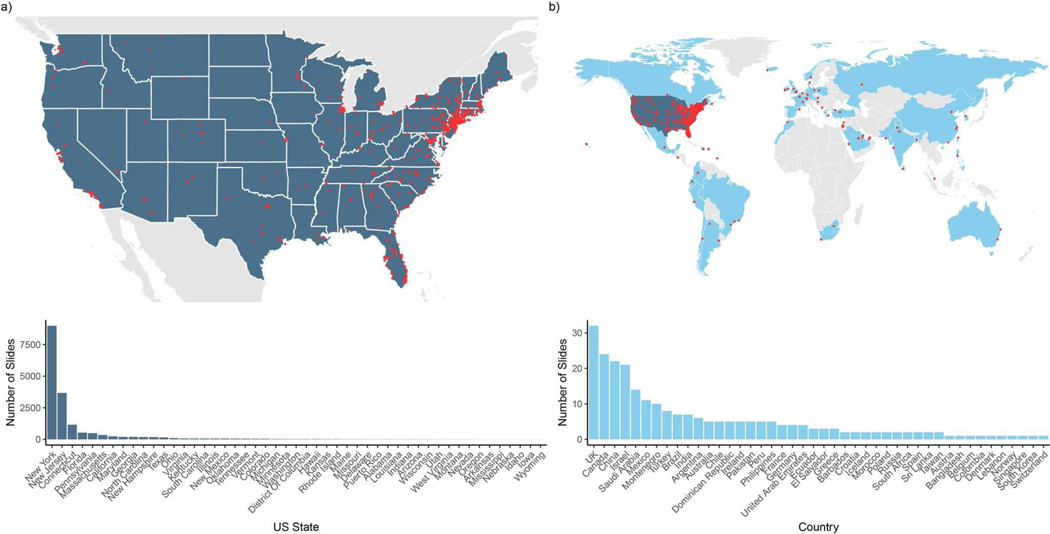
Extended Data Fig. 1 |. Geographical distribution of the external consultation slides submitted to MSKCC.
We included in our work a total of 17,661 consultation slides: 17,363 came from other US institutions located across 48 US states, Washington DC and Puerto Rico; 248 cases came from international institutions spread across 44 countries in all continents. a, Distribution of consultation slides coming from other US institutions. Top, geographical distribution of slides in the continental United States. Red points correspond to pathology laboratories. Bottom, consultation slides distribution per state (including Washington DC and Puerto Rico). b, Distribution of consultation slides coming from international institutions. Top, geographical locations of consultation slides across the world (light gray, countries that did not contribute slides; light blue, countries that contributed slides; dark blue, United States). Bottom, distribution of external consultation slides per country of origin (excluding the United States).
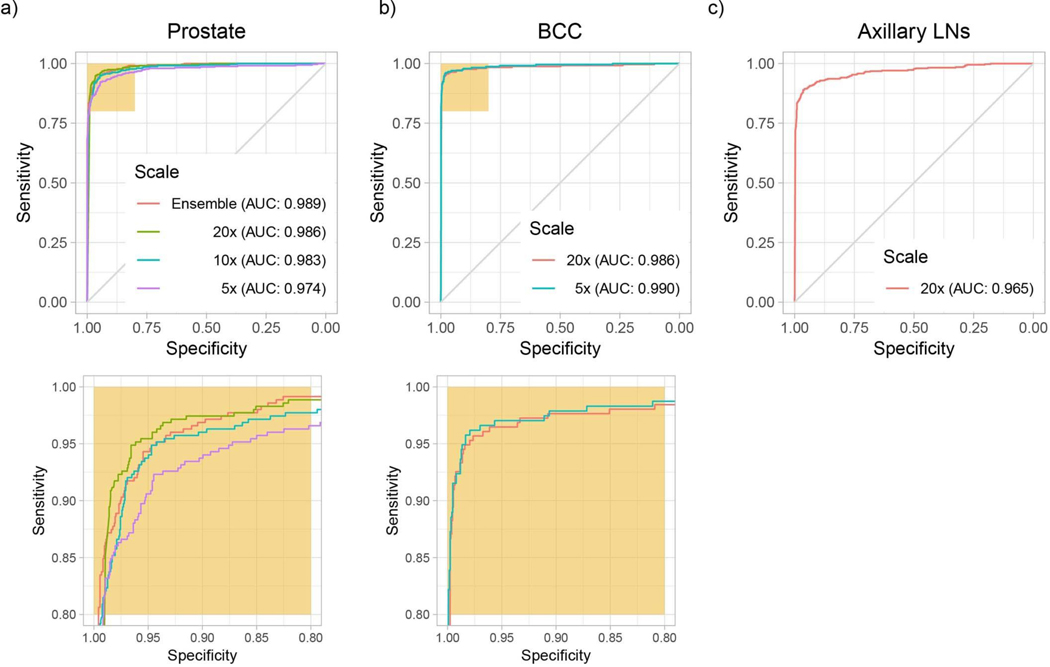
Extended Data Fig. 2 |. MiL model classification performance for different cancer datasets.
Performance on the respective test datasets was measured in terms of AUC. a, Best results were achieved on the prostate dataset (n = 1,784), with an AUC of 0.989 at 20× magnification. b, For BCC (n = 1,575), the model trained at 5× performed the best, with an AUC of 0.990. c, The worst performance came on the breast metastasis detection task (n = 1,473), with an AUC of 0.965 at 20×. The axillary lymph node dataset is the smallest of the three datasets, which is in agreement with the hypothesis that larger datasets are necessary to achieve lower error rates on real-world clinical data.
Extended Data Fig. 3 |. t-SNE visualization of the representation space for the BCC and axillary lymph node models.
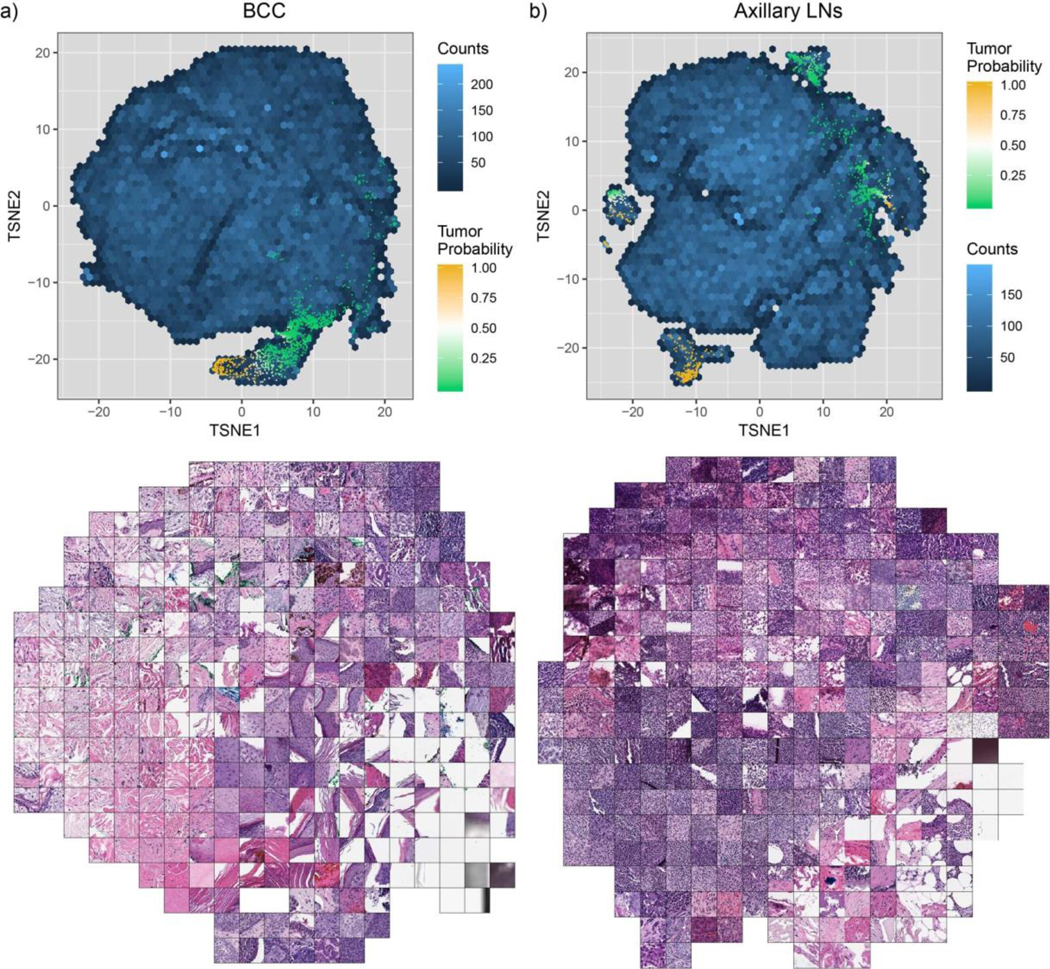
Two-dimensional t-SNE projection of the 512-dimensional representation space were generated for 100 randomly sampled tiles per slide. a, BCC representation (n = 144,935). b, Axillary lymph nodes representation (n = 139,178).
Extended Data Fig. 4 |. Performance of the MiL-RF model at multiple scales on the prostate dataset.
The MIL model was run on each slide of the test dataset (n = 1,784) with a stride of 40 pixels. From the resulting tumor probability heat map, hand-engineered features were extracted for classification with the random forest (RF) model. The best MIL-RF model (ensemble model; AUC = 0.987) was not statistically significantly better than the MIL-only model (20× model; AUC = 0.986; see Fig. 3), as determined using DeLong’s test for two correlated ROC curves.
Extended Data Fig. 5 |. ROC curves of the generalization experiments summarized in Fig. 5.
a, Prostate model trained with MIL on MSK in-house slides tested on: (1) an in-house slides test set (n = 1,784) digitized on Aperio scanners; (2) an in-house slides test set digitized on a Philips scanner (n = 1,274); and (3) external slides submitted to MSK for consultation (n = 12,727). b,c, Comparison of the proposed MIL approach with state-of-the-art fully supervised learning for breast metastasis detection in lymph nodes. For b, the breast model was trained on MSK data with our proposed method (MIL-RNN) and tested on the MSK breast data test set (n = 1,473) and on the test set of the CAMELYON16 challenge (n = 129), and achieved AUCs of 0.965 and 0.895, respectively. For c, the fully supervised model was trained on CAMELYON16 data and tested on the CAMELYON16 test set (n = 129), achieving an AUC of 0.930. Its performance dropped to AUC = 0.727 when tested on the MSK test set (n = 1,473).
Extended Data Fig. 6 |. Decision support with the BCC and breast metastases models.
For each dataset, slides are ordered by their probability of being positive for cancer, as predicted by the respective MIL-RNN model. The sensitivity is computed at the case level. a, BCC (n = 1,575): given a positive prediction threshold of 0.025, it is possible to ignore roughly 68% of the slides while maintaining 100% sensitivity. b, Breast metastases (n = 1,473): given a positive prediction threshold of 0.21, it is possible to ignore roughly 65% of the slides while maintaining 100% sensitivity.
Extended Data Fig. 7 |. Example of a slide tiled on a grid with no overlap at different magnifications.
A slide represents a bag, and the tiles constitute the instances in that bag. In this work, instances at different magnifications are not part of the same bag. mpp, microns per pixel.
Extended Data Fig. 8 |. The publicly shared MSK breast cancer metastases dataset is representative of the full MSK breast cancer metastases test set.
We created an additional dataset of the size of the test set of the CAMEYON16 challenge (130 slides) by subsampling the full MSK breast cancer metastases test set, ensuring that the models achieved similar performance for both datasets. Left, the model was trained on MSK data with our proposed method (MIL-RNN) and tested on: the full MSK breast data test set (n = 1,473; AUC = 0.968), the public MSK dataset (n = 130; AUC = 0.965); and the test set of the CAMELYON16 challenge (n = 129; AUC = 0.898). Right, the model was trained on CAMELYON16 data with supervised learning18 and tested on: the test set of the CAMELYON16 challenge (n = 129; AUC = 0.932); the full MSK breast data test set (n = 1,473; AUC = 0.731); and the public MSK dataset (n = 130; AUC = 0.737). Error bars represent 95% confidence intervals for the true AUC calculated by bootstrapping each test set.
Supplementary Material
Acknowledgements
We thank The Warren Alpert Center for Digital and Computational Pathology and MSK’s high-performance computing team for their support. We also thank J. Samboy for leading the digital scanning initative and E. Stamelos and F. Cao, from the pathology informatics team at MSK, for their invaluable help querying the digital slide and LIS databases. We are in debt to P. Schueffler for extending the digital whole slide viewer specifically for this study and for supporting its use by the whole research team. Finally, we thank C. Virgo for managing the project, D. V. K. Yarlagadda for development support and D. Schnau for help editing the manuscript. This research was funded in part through the NIH/NCI Cancer Center Support Grant P30 CA008748.
Footnotes
Competing interests
T.J.F. is the Chief Scientific Officer of Paige.AI. T.J.F. and D.S.K. are co-founders and equity holders of Paige.AI. M.G.H., V.W.K.S., D.S.K., and V.E.R. are consultants for Paige.AI. V.E.R. is a consultant for Cepheid. M.G.H. is on the medical advisory board of PathPresenter. D.S.K has received speaking/consulting compensation from Merck. G.C. and T.J.F. have intellectual property interests relevant to the work that is the subject of this paper. MSK has financial interests in Paige.AI. and intellectual property interests relevant to the work that is the subject of this paper.
Additional information
Extended data is available for this paper at https://doi.org/10.1038/s41591–019-0508–1.
Supplementary information is available for this paper at https://doi.org/10.1038/s41591–019-0508–1.
Peer review information: Javier Carmona was the primary editor on this article and managed its editorial process and peer review in collaboration with the rest of the editorial team.
Publisher’s note: Springer Nature remains neutral with regard to jurisdictional claims in published maps and institutional affiliations.
Online content
Any methods, additional references, Nature Research reporting summaries, source data, statements of code and data availability and associated accession codes are available at https://doi.org/10.1038/s41591–019-0508–1.
Data availability
The publicly shared MSK breast cancer metastases dataset is available at http://thomasfuchslab.org/data/. The dataset consists of 130 de-identified WSIs of axillary lymph node specimens from 78 patients (see Extended Data Fig. 8). The tissue was stained with hematoxylin and eosin and scanned on Leica Biosystems AT2 digital slide scanners at MSK. Metastatic carcinoma is present in 36 whole slides from 27 patients, and the corresponding label is included in the dataset. The remaining data that support the findings of this study were offered to editors and peer reviewers at the time of submission for the purposes of evaluating the manuscript upon request. The remaining data are not publicly available, in accordance with institutional requirements governing human subject privacy protection.
Code availability
The source code of this work can be downloaded from https://github.com/MSKCC-Computational-Pathology/MIL-nature-medicine-2019.
References
- 1.Ball CS The early history of the compound microscope. Bios 37, 51–60 (1966). [Google Scholar]
- 2.Hajdu SI Microscopic contributions of pioneer pathologists. Ann. Clin. Lab. Sci. 41, 201–206 (2011). [PubMed] [Google Scholar]
- 3.Fuchs TJ, Wild PJ, Moch H & Buhmann JM Computational pathology analysis of tissue microarrays predicts survival of renal clear cell carcinoma patients. In Proc. International Conference on Medical Image Computing and Computer-Assisted Intervention 1–8 (Lecture Notes in Computer Science Vol 5242, Springer, 2008). [DOI] [PubMed] [Google Scholar]
- 4.Fuchs TJ & Buhmann JM Computational pathology: challenges and promises for tissue analysis. Comput. Med. Imaging Graph. 35, 515–530 (2011). [DOI] [PubMed] [Google Scholar]
- 5.Louis DN et al. Computational pathology: a path ahead. Arch. Pathol. Lab. Med. 140, 41–50 (2016). [DOI] [PMC free article] [PubMed] [Google Scholar]
- 6.LeCun Y, Bengio Y & Hinton G Deep learning. Nature 521, 436–444 (2015). [DOI] [PubMed] [Google Scholar]
- 7.Deng J et al. ImageNet: a large-scale hierarchical image database. In Proc. IEEE Conference on Computer Vision and Pattern Recognition 248–255 (IEEE, 2009). [Google Scholar]
- 8.Krizhevsky A, Sutskever I & Hinton GE ImageNet classification with deep convolutional neural networks. Adv. Neural Inf. Process. Syst. 1097–1105 (2012). [Google Scholar]
- 9.Simonyan K & Zisserman A Very deep convolutional networks for large-scale image recognition. Preprint at https://arxiv.org/abs/1409.1556 (2014).
- 10.He K, Zhang X, Ren S & Sun J Deep residual learning for image recognition. Preprint at https://arxiv.org/abs/1512.03385 (2015).
- 11.Esteva A et al. Dermatologist-level classification of skin cancer with deep neural networks. Nature 542, 115–118 (2017). [DOI] [PMC free article] [PubMed] [Google Scholar]
- 12.De Fauw J et al. Clinically applicable deep learning for diagnosis and referral in retinal disease. Nat. Med. 24, 1342–1350 (2018). [DOI] [PubMed] [Google Scholar]
- 13.Liu Y et al. Detecting cancer metastases on gigapixel pathology images. Preprint at https://arxiv.org/abs/1703.02442 (2017).
- 14.Das K, Karri SPK, Guha Roy A, Chatterjee J & Sheet D Classifying histopathology whole-slides using fusion of decisions from deep convolutional network on a collection of random multi-views at multi-magnification. In 2017 IEEE 14th International Symposium on Biomedical Imaging 1024–1027 (IEEE, 2017). [Google Scholar]
- 15.Valkonen M et al. Metastasis detection from whole slide images using local features and random forests. Cytom. Part A 91, 555–565 (2017). [DOI] [PubMed] [Google Scholar]
- 16.Bejnordi BE et al. Using deep convolutional neural networks to identify and classify tumor-associated stroma in diagnostic breast biopsies. Mod. Pathol. 31, 1502–1512 (2018). [DOI] [PMC free article] [PubMed] [Google Scholar]
- 17.Mobadersany P et al. Predicting cancer outcomes from histology and genomics using convolutional networks. Proc. Natl Acad. Sci. USA 115, E2970–E2979 (2018). [DOI] [PMC free article] [PubMed] [Google Scholar]
- 18.Wang D, Khosla A, Gargeya R, Irshad H & Beck AH Deep learning for identifying metastatic breast cancer. Preprint at https://arxiv.org/abs/1606.05718 (2016).
- 19.Janowczyk A & Madabhushi A Deep learning for digital pathology image analysis: a comprehensive tutorial with selected use cases. J. Pathol. Inform. 7, 29 (2016). [DOI] [PMC free article] [PubMed] [Google Scholar]
- 20.Litjens G et al. Deep learning as a tool for increased accuracy and efficiency of histopathological diagnosis. Sci. Rep. 6, 26286 (2016). [DOI] [PMC free article] [PubMed] [Google Scholar]
- 21.Coudray N et al. Classification and mutation prediction from non-small cell lung cancer histopathology images using deep learning. Nat. Med. 24, 1559–1567 (2018). [DOI] [PMC free article] [PubMed] [Google Scholar]
- 22.Olsen T et al. Diagnostic performance of deep learning algorithms applied to three common diagnoses in dermatopathology. J. Pathol. Inform. 9, 32 (2018). [DOI] [PMC free article] [PubMed] [Google Scholar]
- 23.Ehteshami Bejnordi B et al. Diagnostic assessment of deep learning algorithms for detection of lymph node metastases in women with breast cancer. J. Am. Med. Assoc. 318, 2199–2210 (2017). [DOI] [PMC free article] [PubMed] [Google Scholar]
- 24.Siegel RL, Miller KD & Jemal A Cancer statistics, 2016. CA Cancer J. Clin. 66, 7–30 (2016). [DOI] [PubMed] [Google Scholar]
- 25.Ozdamar SO et al. Intraobserver and interobserver reproducibility of WHO and Gleason histologic grading systems in prostatic adenocarcinomas. Int. Urol. Nephrol. 28, 73–77 (1996). [DOI] [PubMed] [Google Scholar]
- 26.Svanholm H & Mygind H Prostatic carcinoma reproducibility of histologic grading. APMIS 93, 67–71 (1985). [DOI] [PubMed] [Google Scholar]
- 27.Gleason DF Histologic grading of prostate cancer: a perspective. Hum. Pathol. 23, 273–279 (1992). [DOI] [PubMed] [Google Scholar]
- 28.LeBoit PE et al. Pathology and Genetics of Skin Tumours (IARC Press, 2006). [Google Scholar]
- 29.Rogers HW, Weinstock MA, Feldman SR & Coldiron BM Incidence estimate of nonmelanoma skin cancer (keratinocyte carcinomas) in the US population, 2012. JAMA Dermatol. 151, 1081–1086 (2015). [DOI] [PubMed] [Google Scholar]
- 30.Dietterich TG, Lathrop RH & Lozano-P’erez T Solving the multiple instance problem with axis-parallel rectangles. Artif. Intell. 89, 31–71 (1997). [Google Scholar]
- 31.Andrews S, Hofmann T & Tsochantaridis I Multiple instance learning with generalized support vector machines In AAAI/IAAI 943–944 (AAAI, 2002). [Google Scholar]
- 32.Nakul V Learning from Data with Low Intrinsic Dimension (Univ. California, 2012). [Google Scholar]
- 33.Zhang C, Platt JC & Viola PA Multiple instance boosting for object detection. Adv. Neural Inf. Process. Syst. 1417–1424 (2006). [Google Scholar]
- 34.Zhang Q & Goldman SA EM-DD: an improved multiple-instance learning technique. Adv. Neural Inf. Process. Syst. 1073–1080 (2002). [Google Scholar]
- 35.Kraus OZ, Ba JL & Frey BJ Classifying and segmenting microscopy images with deep multiple instance learning. Bioinformatics 32, i52–i59 (2016). [DOI] [PMC free article] [PubMed] [Google Scholar]
- 36.Hou L et al. Patch-based convolutional neural network for whole slide tissue image classification. In Proc. IEEE Conference on Computer Vision and Pattern Recognition 2424–2433 (IEEE, 2016). [DOI] [PMC free article] [PubMed] [Google Scholar]
- 37.Bychkov D et al. Deep learning based tissue analysis predicts outcome in colorectal cancer. Sci. Rep. 8, 3395 (2018). [DOI] [PMC free article] [PubMed] [Google Scholar]
References
- 38.Goode A, Gilbert B, Harkes J, Jukic D & Satyanarayanan M OpenSlide: a vendor-neutral software foundation for digital pathology. J. Pathol. Inform. 4, 27 (2013). [DOI] [PMC free article] [PubMed] [Google Scholar]
- 39.Paszke A et al. Automatic differentiation in PyTorch. In 31st Conference on Neural Information Processing Systems (2017). [Google Scholar]
- 40.R Development Core Team R: A Language and Environment for Statistical Computing (R Foundation for Statistical Computing, 2017). [Google Scholar]
- 41.Robin X et al. pROC: an open-source package for R and S+ to analyze and compare ROC curves. BMC Bioinformatics 12, 77 (2011). [DOI] [PMC free article] [PubMed] [Google Scholar]
- 42.Wickham H ggplot2: Elegant Graphics for Data Analysis (Springer, 2016). [Google Scholar]
- 43.Carpenter J & Bithell J Bootstrap confidence intervals: when, which, what? A practical guide for medical statisticians. Stat. Med. 19, 1141–1164 (2000). [DOI] [PubMed] [Google Scholar]
- 44.DeLong ER, DeLong DM & Clarke-Pearson DL Comparing the areas under two or more correlated receiver operating characteristic curves: a nonparametric approach. Biometrics 44, 837–845 (1988). [PubMed] [Google Scholar]
- 45.Yu Y et al. Sentinel lymph node biopsy after neoadjuvant chemotherapy for breast cancer: retrospective comparative evaluation of clinically axillary lymph node positive and negative patients, including those with axillary lymph node metastases confirmed by fine needle aspiration. BMC Cancer 16, 808 (2016). [DOI] [PMC free article] [PubMed] [Google Scholar]
- 46.Van der Maaten L & Hinton G Visualizing data using t-SNE. J. Mach. Learn. Res. 9, 2579–2605 (2008). [Google Scholar]
Associated Data
This section collects any data citations, data availability statements, or supplementary materials included in this article.


