

Abstract
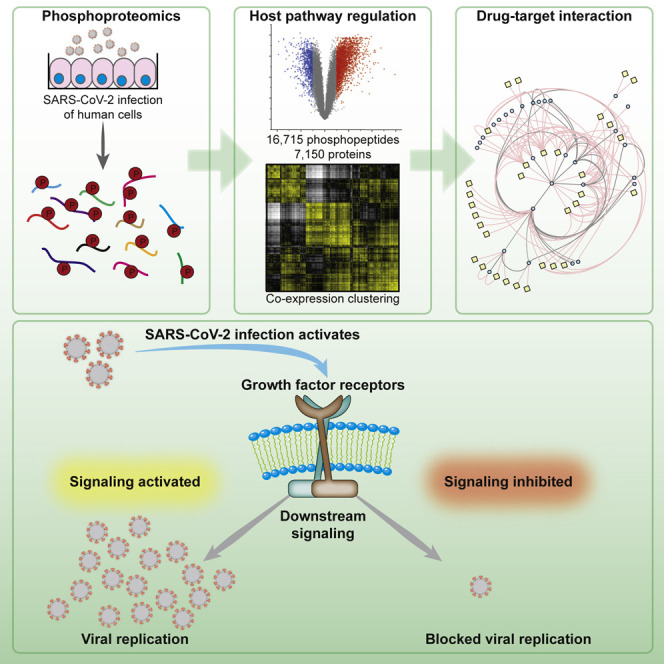
SARS-CoV-2 infections are rapidly spreading around the globe. The rapid development of therapies is of major importance. However, our lack of understanding of the molecular processes and host cell signaling events underlying SARS-CoV-2 infection hinders therapy development. We use a SARS-CoV-2 infection system in permissible human cells to study signaling changes by phosphoproteomics. We identify viral protein phosphorylation and define phosphorylation-driven host cell signaling changes upon infection. Growth factor receptor (GFR) signaling and downstream pathways are activated. Drug-protein network analyses revealed GFR signaling as key pathways targetable by approved drugs. The inhibition of GFR downstream signaling by five compounds prevents SARS-CoV-2 replication in cells, assessed by cytopathic effect, viral dsRNA production, and viral RNA release into the supernatant. This study describes host cell signaling events upon SARS-CoV-2 infection and reveals GFR signaling as a central pathway essential for SARS-CoV-2 replication. It provides novel strategies for COVID-19 treatment.
Keywords: SARS-CoV-2, proteomics, signaling, TMT, phosphoproteomics, COVID-19, viral replication, drug repurposing, RAS, PI3K
Graphical Abstract
Highlights
-
•
Phosphoproteomics of SARS-CoV-2-infected cells reveal the signaling landscape
-
•
SARS-CoV-2 proteins are extensively phosphorylated in host cells
-
•
Infection leads to the activation of growth factor receptor signaling
-
•
Drugs inhibiting growth factor receptor signaling prevent viral replication
In this study, Klann et al. dissected the host cell signaling landscape upon infection with SARS-CoV-2. Mapping differential signaling networks identified a number of pathways activated during infection. Drug-target network analysis revealed potential therapeutic targets. Growth factor receptor signaling was highly activated upon infection and its inhibition prevented SARS-CoV-2 replication in cells.
Introduction
Severe acute respiratory syndrome-coronavirus 2 (SARS-CoV-2), a novel coronavirus, has been rapidly spreading around the globe since the beginning of 2020. In people, it causes coronavirus disease 2019 (COVID-19), often accompanied by severe respiratory syndrome (Chen et al., 2020). To conquer the global health crisis triggered by COVID-19, rapidly establishing drugs is required to dampen the disease course and relieve healthcare institutions. Thus, repurposing already available and (ideally) approved drugs may be essential to rapidly treat COVID-19. Many studies for proposing repurposing of specific drugs have been conducted in the last several months, but mostly remain computational without tests in infection models (Smith and Smith, 2020; Wang, 2020). In addition, the studies are hindered by the lack of knowledge about the molecular mechanisms of SARS-CoV-2 infection and the resulting host-cell responses required to allow viral replication. To rationally repurpose drugs, a molecular understanding of the infection and the changes within the host cell pathways is essential. Experimentally identifying viral targets in the cell allows candidate drugs to be selected with high confidence for further testing in the clinics to reduce the risks to patients resulting from tests with drugs lacking in vitro validation.
Growth factor receptor (GFR) signaling plays important roles in cancer pathogenesis and has also been reported to be crucial for infection with some viruses (Beerli et al., 2019; Kung et al., 2011; Zhu et al., 2009). GFR activation leads to the modulation of a wide range of cellular processes, including proliferation, adhesion, or differentiation (Yarden, 2001). Various viruses, such as Epstein-Barr virus, influenza, or hepatitis C, have been shown to use the epidermal GFR (EGFR) as an entry receptor (Eierhoff et al., 2010; Kung et al., 2011; Lupberger et al., 2011). In addition, EGFR activation can suppress interferon signaling, and thus the antiviral response elicited in respiratory virus diseases, for instance, influenza A and rhinovirus (Ueki et al., 2013). The activation of GFR signaling may also play an important role in other respiratory viruses, such as SARS-CoV-2.
In the last few years, it has been shown for many viruses that the modulation of host cell signaling is crucial for viral replication and it may exhibit strong therapeutic potential (Beerli et al., 2019; Pleschka et al., 2001). However, how SARS-CoV-2 infection changes host cell signaling has remained unclear. We recently established an in vitro cell culture model of SARS-CoV-2 infection using the colon epithelial cell line Caco-2, which is highly permissive for the virus and commonly used for the study of coronaviruses (Herzog et al., 2008; Ren et al., 2006). Here, we determine changes in the cellular phosphoprotein networks upon infection with SARS-CoV-2 to gain insight into infection-induced signaling events. We found extensive rearrangements of cellular signaling pathways, particularly of GFR signaling. Inhibiting GFR signaling using prominent (anti-cancer) drugs—pictilisib, omipalisib, RO5126766, lonafarnib, and sorafenib—prevented SARS-CoV-2 replication in vitro, assessed by cytopathic effect and viral RNA replication and release. These compounds prevented replication at clinically achievable concentrations. Due to their clinical availability, these drugs could be rapidly transitioned to clinical trials to test their feasibility as a COVID-19 treatment option.
Results
Phosphoproteomics of Cells Infected with SARS-CoV-2
In a previous study, we analyzed the effect of SARS-CoV-2 infection on the host cell translatome and proteome (Bojkova et al., 2020). This study found the effects 24 h after SARS-CoV-2 infection especially useful for identifying druggable host pathways. To evaluate changes in intracellular signaling networks brought about by SARS-CoV-2 infection, we quantified phosphoproteome changes 24 h after infection (Figure 1 A). Caco-2 cells were mock-infected or infected with SARS-CoV-2 patient isolates (in 5 biological replicates at an MOI of 1) for 1 h, washed, and incubated for 24 h before cell harvest. Extracted proteins were digested and split to (1) carry out whole-cell proteomics of tandem mass tag (TMT) 10-plex samples using liquid chromatography-synchronous precursor selection-mass spectromety (LC-SPS-MS3) or (2) use iron loaded nitrilotriacetic acid (Fe-NTA) phosphopeptide enrichment (achieving 98% enrichment) for phosphoproteome analyses of a TMT 10-plex analyzed by LC-MS2, due to the higher precision and identification rates of MS2-based methods during phosphopeptide measurements (Hogrebe et al., 2018). We identified and quantified 7,150 proteins and 16,715 different phosphopeptides for a total of 15,093 different modification sites (Figures 1B, 1C, and S1; Tables S1 and S2). The main fraction of phosphopeptides were modified serines (86.4%), followed by threonine (13.4%), and tyrosine (0.2%) (Figure 1D). Upon infection, 2,197 and 799 phosphopeptides significantly increased or decreased, respectively (log2 fold change [FC] > 1, p < 0.05).
Figure 1.

Phosphoproteomic Profiling of SARS-CoV-2-Infected Cells
(A) Experimental scheme. Caco-2 cells were infected with SARS-CoV-2 for 1 h (MOI 1), washed, and incubated for an additional 24 h. Proteins were extracted and prepared for bottom-up proteomics. All 10 conditions were multiplexed using TMT10 reagents. A total of 250 μg pooled samples were used for whole-cell proteomics (24 fractions) and the remainder (~1 mg) enriched for phosphopeptides by Fe-NTA. Phosphopeptides were fractionated into 8 fractions and concatenated into 4 fractions. All of the samples were measured on an Orbitrap Fusion Lumos.
(B) Volcano plot showing fold changes (FCs) of infected versus mock cells for all quantified phosphopeptides. p values were calculated using an unpaired, 2-sided Student’s t test with equal variance assumed and adjusted using the Benjamini-Hochberg false discovery rate (FDR) method (N = 5 biological replicates). Orange or blue points indicate significantly increased or decreased phosphopeptides, respectively.
(C) Volcano plot showing differences between SARS-CoV-2 and mock-infected cells in total protein levels for all quantified proteins. p values were calculated using an unpaired, 2-sided Student’s t test with equal variance assumed and adjusted using the Benjamini-Hochberg FDR method (N = 5). Orange or blue points indicate significantly increased or decreased phosphopeptides, respectively.
(D) Distribution of phosphorylation sites identified across modified amino acids. See also Figure S1 and Tables S1 and S2.
(E–K) Domain structures of SARS-CoV-2 proteins predicted by InterPro. Identified phosphorylation sites are indicated. Protein 3a (E), membrane protein M (F), non-structural protein 6 (G), protein 9b (H), replicase polyprotein 1b (I), and nucleoprotein N (J). (K) X-ray structure of the RNA-binding domain (PDB: 6vyo, residues 47–173), with identified phosphorylation sites marked in red.
Viral proteins are produced in the host cell and underlie (and often require) post-translational modification (PTM) by host cell enzymes (Wu et al., 2009). Accordingly, we assessed viral proteins phosphorylated in the host cell. We identified 33 modification sites on 6 different viral proteins (Figures 1E–1J). The possible functions of the observed modifications largely remain unclear due to a lack of understanding of their molecular function and regulation. SARS-CoV-2 protein 3a was phosphorylated on the luminal side of this transmembrane protein (Figure 1E). Membrane protein M was phosphorylated at three serines in close proximity, at the C-terminal, cytoplasmic region of the protein (Figure 1F), suggesting a high-activity modification surface. SARS-CoV-1 protein 6 was described as accelerating infections in murine systems (Tangudu et al., 2007). We found a single phosphorylation of the SARS-CoV-2 protein homolog non-structural protein (NSP) 6 in host cells (Figure 1G). Protein 9b was modified at two sites (Figure 1H); however, its function in SARS-CoV-1 or SARS-CoV-2 remains unknown. Polyprotein 1b is a large, 7,096 amino acid protein heavily processed to generate distinct proteins in SARS-CoV-1 (Tangudu et al., 2007). We found polyprotein 1b to be modified at 3 residues, 2 in a region of unknown function and 1 in the NSP11 part of the protein (Figure 1I). Our data cannot distinguish whether phosphorylation occurred before or after cleavage and whether phosphorylation may affect processing. SARS-CoV-2 nucleoprotein was heavily phosphorylated (Figure 1J). Mapping phosphosites to the structure (residues 47–173, PDB: 6vyo) revealed a small surface region, suggesting specific regulation and interaction changes (Figure 1K). To reveal host kinases potentially phosphorylating viral proteins, we bioinformatically assessed identified phosphorylation motifs using NetPhos 3.1 and GPS5 (Blom et al., 2004; Wang et al., 2020; Table S3). Some motifs present in nucleoprotein were predicted to be modified by CMGC kinases. Among several others, casein kinase II (CK2) kinases are part of the CMGC family and have been independently identified as interaction partners of the nucleoprotein, when expressed in cells (Gordon et al., 2020). The inhibition of CK2 kinases could be used to study possible functional interactions between kinase and viral protein.
We identified extensive changes in the phosphorylation of host and viral proteins after SARS-CoV-2 infection. The roles of viral protein modifications remain unclear. However, targeting the corresponding host kinases may offer new treatment strategies.
Signaling Pathways Modulated upon Infection
To identify the key host signaling pathway networks modulated by infection, we carried out protein-protein co-regulation analysis on all of the proteins quantified in phosphorylation and total protein level. We standardized phosphorylation and total protein levels by individual Z scoring to compare the different datasets. Subsequently, to merge phosphorylation and proteome data, we collapsed all of the phosphosites for each protein into one average profile and calculated the combined Z scores. Patterns of co-regulation were identified using protein-protein correlation and hierarchical clustering (Figure 2 A). This generalized approach allows us to study large-scale patterns of dependencies of protein and phosphorylation levels, that can then be dissected into individual phosphorylation sites and protein levels for downstream analysis. The dynamic landscape of the proteome revealed three main clusters of co-regulated proteins, each one representing different sets of pathways (discussed in detail below).
Figure 2.

Correlation of Co-regulated Proteins Identifies Cellular Signaling Pathways Modulated upon Infection
(A) Correlation map of all detected phosphoproteins indicating Euclidean distance between proteins. To determine correlation, Z scores of phosphopeptides and total protein levels were added and all of the peptide values for 1 protein collapsed into an average Z score. Correlation clustering was performed by Euclidean distance on combined Z scores for all conditions. The red dashed line indicates the main clusters found and identified.
(B) Reactome pathway enrichment of proteins found in cluster I in (A). Shown are the number of proteins identified in the respective cluster versus the statistical significance of enrichment. The circles are increasingly sized according to the number of proteins found in the pathway.
(C) Scatterplot showing FCs of phosphopeptides compared to FCs of total protein levels. The yellow oval indicates peptides for which phosphorylation is not driven by changes in protein abundance.
(D) Reactome pathways found enriched in cluster II in (A); analyses and presentation as in (B).
(E) Scatterplot showing correlation between FCs of phosphopeptides compared to FCs of total proteins levels. Two subsets of phosphopeptides were detected: one was mainly regulated by differential modification (indicated in yellow), the other by changes in protein abundance.
(F) STRING network analysis of proteins decreased in total protein levels (Figure 1C). The inserts indicate pathways found in the network.
The first cluster mainly comprised receptor signaling and endocytic pathways (Figure 2B). Prominent among these pathways were platelet-derived growth factor receptor (PDGFR), ErbB1 (EGFR) signaling, metabolism, and various pathways associated with vesicle trafficking (Table S4). As changes in phosphopeptide abundance can represent different ratios in phosphorylated versus non-phosphorylated peptide or a change in protein abundance (with the same ratio of protein being phosphorylated), we integrated our phosphoproteome dataset with total proteome data (Figure 2C). When comparing abundances of individual phosphopeptides and their protein levels, extensive changes were observed in the phosphoproteome; however, no general changes were seen for the total proteome (Figure 2C; Table S2). Thus, phosphorylation changes were induced by signaling activity alterations, resulting in increased phosphorylation and not due to protein abundance differences.
The second cluster mainly comprised proteins decreased in phosphorylation and highly connected to cell-cycle and translation initiation (Figure 2D; Table S4). We reported recently that the inhibition of cellular translation prevented SARS-CoV-2 replication in cells (Bojkova et al., 2020), which is consistent with the regulation of translation by altering phosphorylation patterns. To further distinguish the regulations within this cluster, we correlated protein levels with differential phosphorylation abundance (Figure 2E) and found two groups of proteins. The first group contained translation-related pathways (identified in Figure 2E) and was predominantly regulated by decreased modification. The second set of proteins was decreased in phosphorylation and total protein level. The majority of the proteins found in the second cluster belonged to diverse cell-cycle pathways. Consistent with these findings, cell-cycle pathways were also enriched in the set of proteins significantly decreased in protein level (Figures 2F and S2; Tables S4 and S5). Translation pathways were not regulated in protein level to this extent.
Analysis of the third cluster revealed signaling events of the splicing machinery (Table S4) possibly explaining previously observed changes in splicing machinery abundance upon SARS-CoV-2 infection (Bojkova et al., 2020). Consistent with previous literature (Grimmler et al., 2005; Ilan et al., 2017; Mathew et al., 2008; Mermoud et al., 1994), we hypothesized that the host splicing machinery is extensively reshaped during viral infection. This finding further supports splicing as a potential therapeutic target, in agreement with decreased SARS-CoV-2 pathogenic effects when inhibiting splicing by pladienolide B. Additionally, we found carbon metabolism among the pathways showing significantly increased phosphorylation upon SARS-CoV-2 infection (Table S4), in addition to previously described changes in total protein levels of enzymes part of glycolysis and carbon metabolism (Bojkova et al., 2020; Figure S3).
Thus, we showed that during SARS-CoV-2 infection, specific rearrangements of signaling pathways were elicited in the cellular proteome. Regulation mainly comprised cellular signaling and translational pathways, as well as proteins regulated not only by phosphorylation but also in total protein abundance. Proteins exhibiting decreased protein levels were significantly enriched in cell-cycle proteins.
Drug-Target Network Reveal GF Signaling as Potent Therapy Candidate
We observed >2,000 phosphopeptides to be increased in abundance, while their protein levels stayed constant upon infection (Figures 2C and S4). This reveals differential modification activity (e.g., signaling events) for these phosphoproteins. For many kinases in cellular signaling pathways, there are already approved drugs available. Hence, we investigated the potential for repurposing drugs to treat COVID-19 by mapping already available drugs via ReactomeFI to the set of proteins increased in phosphorylation. We filtered the network for drugs and direct targets and found EGFR to be one of the central hits, including a number of regulated proteins in the downstream signaling pathway of EGFR (Figure 3 A). These downstream targets are also regulated by other GFRs and could thus also be explained by their observed activation upon SARS-CoV-2 infection (Figure 2). A total of 28 clinically approved drugs (largely used in cancer therapy) are already available to target EGFR or downstream targets. We found that a subnetwork of GFR signaling components was remodeled (Figure 3B). We mapped identified members of GFR signaling and their respective phosphorylation differences upon SARS-CoV-2 infection (Figure 3C), revealing an extensive overall increase in phosphorylation of the whole pathway, including related components for cytoskeleton remodeling and receptor endocytosis. How GFR signaling might regulate SARS-CoV-2 infection is still a matter for speculation. However, GFR signaling inhibition may provide a useful approach already implicated in SARS-CoV-induced fibrosis therapy (Venkataraman and Frieman, 2017) and may be a viable strategy to treat COVID-19.
Figure 3.

Drug-Target Phosphoprotein Network Analysis Identifies Growth Factor Signaling as Central Hub for Possible Intervention by Repurposed Drugs
(A) Proteins significantly increased in phosphorylation (FC > 1, FDR < 0.05) were subjected to ReactomeFI pathway analysis and overlaid with a network of US Food and Drug Administration (FDA)-approved drugs. The network was filtered for drugs and drug targets only, to identify pathways that could be modulated by drug repurposing. The red lines indicate drug-target interactions, and the gray lines protein-protein interactions. The identified drugs are represented with yellow rectangles, while proteins are represented by blue circles.
(B) Search across all proteins with significant phosphorylation changes upon SARS-CoV-2 infection for proteins related to the EGFR pathway. The STRING network highlights all of the proteins annotated for EGFR signaling and their direct interaction neighbors. The red lines indicate direct EGFR interactions, the black lines indicate interactions between pathway members, and the gray lines represent filtered interactions to represent the whole network.
(C) Pathway representation of proteins identified in (B) to be direct functional interactors of EGFR, according to the STRING interaction database (confidence cutoff 0.9). The phosphorylation changes of all significantly regulated sites are indicated by color-coded pie charts. Red indicates upregulation and blue indicates downregulation.
See also Figure S4.
Inhibition of GF Signaling Prevents Viral Replication
Since GFR signaling seems to be central in SARS-CoV-2 infection, we examined the use of inhibitors as antiviral agents. Since there are several GFRs integrating their signaling and regulating a number of processes inside the cell, directly targeting downstream signaling components is likely to be more successful to prevent the signaling of different GFRs and to avoid the mixed effects of multiple pathways. GFR signaling, among others, results in activation of (1) the RAF/MEK/ERK MAPK signaling cascade and (2) integrates (via phosphatidylinositol 3-kinase [PI3K] and protein kinase B [AKT]) into mammalian target of rapamycin complex 1 (mTORC1) signaling to regulating proliferation (Figure 4 A). To explore the antiviral efficiency of targeting proteins downstream of GFRs, we first tested the PI3K inhibitor pictilisib and dual PI3K and mTOR inhibitor omipalisib (Ippolito et al., 2016; Sarker et al., 2015; Schmid et al., 2016). Both compounds inhibited viral replication, based on their propensity to prevent the cytopathogenic effect (CPE) and viral RNA production in cells (Figures 4B–4D, S5, and S6). Our drug-target analyses identified mitogen-activated protein kinase kinase (MAP2K2, better known as MEK) and the RAF inhibitor sorafenib (Wilhelm et al., 2006) as promising targets inhibiting downstream signaling of GFRs (Figure 4A). Thus, we tested sorafenib and the dual RAF/MEK inhibitor RO5126766 in our viral replication assays. Both compounds inhibited cytopathic effects during infection and the viral replication (Figures 4B–4D, S5, and S6). To validate our findings in another cell line, we repeated the treatments in UKF-RC-2 cells infected with SARS-CoV-2. Quantifying the viral RNA copies in the supernatant, we observed that the compounds efficiently inhibited virus replication (Figures 4E and S7A) in non-toxic conditions (Figure S7B, except for sorafenib). Overall, five compounds, inhibiting downstream signaling of GFRs, prevented SARS-CoV-2 replication at clinically achievable concentrations (Figures 4B and 5 ; Eskens et al., 2001; Fucile et al., 2015; Martinez-Garcia et al., 2012; Munster et al., 2016; Sarker et al., 2015), emphasizing the importance of GFR signaling during SARS-CoV-2 infection and revealing clinically available treatment options as drug candidates for COVID-19.
Figure 4.

Inhibition of Growth Factor Receptor Downstream Signaling Prevents SARS-CoV-2 Replication
(A) Schematic representation of growth factor signaling pathways activated upon SARS-CoV-2 infection. The inhibitors tested are indicated and their targets are shown.
(B) Viral replication assay. The percentage inhibition of cytopathic effects (CPEs) is plotted versus compound concentration (N = 3 biological replicates for all compounds). The gray dots indicate replicate measurements, and the red lines indicate dose-response curve fits.
(C) Quantification of viral RNA in the supernatant of Caco-2 cells. The supernatants of control cells, infected cells (MOI 0.01), and infected cells treated either with pictilisib, omipalisib, sorafenib, RO5126766, or lorafenib at the indicated concentrations were analyzed by qPCR for viral genome. N = 3; bar indicates the mean of replicates, error bars indicate SDs.
(D) Microscopy images showing staining for double-stranded RNA (dsRNA) to determine viral dsRNA production and CPE. Mock- or SARS-CoV-2 infected cells are shown at left. SARS-CoV-2-infected cells were treated with different concentrations of inhibitors (as indicated) and imaged after 24 h. Pictilibsib: 0.625, 2.5, and 10 μM; omipalisib: 0.01, 0.625, and 2.5 μM; sorafenib: 2.5, 5, and 10 μM; RO5126766: 2.5, 5, and 10 μM; lonafarnib: 0.6, 2.5, and 10 μM. N = 3 technical replicates, 1 representative image is shown; 2 more areas of the same well are shown in Figure S4. Scale bar represents 100 μm.
(E) Quantification of viral RNA in the supernatant of UKF-RC-2 cells. Supernatant of control cells, SARS-CoV-2-infected cells (MOI 0.1) untreated or treated with pictilisib, omipalisib, sorafenib, RO5126766, or lorafenib at indicated concentrations were analyzed by qPCR for viral genome. N = 3 biological replicates; bar indicates the mean of replicates and the error bars indicate SDs.
See also Figure S5.
Figure 5.

Effect of Growth Factor Signaling on SARS-CoV-2 Replication
Upon infection, growth factor signaling is activated and leads, among others, to the induction of phosphatidylinositol 3-kinase (PI3K) and mitogen-activated protein kinase (MAPK) signaling events. The inhibition of either axis of the 2 (by sorafenib, RP5126766, lonafarnib, pictilisib, or omapalisib) leads to the decreased replication of SARS-CoV-2 inside the host cell.
Discussion
With the rapid spread of the COVID-19 pandemic, investigating the molecular mechanisms underlying SARS-CoV-2 infection is of high importance. In particular, the processes underlying infection and host-cell response remain unclear. These would offer potential avenues for pharmacological treatment of COVID-19. Here, we report global, differential phosphorylation analysis of host cells after infection with intact SARS-CoV-2 virus. We could identify phosphorylation sites on numerous viral proteins in cells, showing that they can undergo efficient modification in infected cells. Until now, we can only speculate about the host kinases involved and the functions driven by PTMs, which will be an important topic for follow-up studies. For SARS-CoV-1, it was shown that the modification of viral proteins can lead to the regulation of RNA binding of the nucleoprotein (Wu et al., 2009) and is needed for viral replication. Although similar effects in SARS-CoV-2 are likely, this remains to be studied in this novel virus. A recent article analyzed the interaction profile of SARS-CoV-2 proteins expressed in HEK293T cells (Gordon et al., 2020). For the heavily phosphorylated nucleoprotein, they could identify interactions with the host casein kinases, which may indicate possible modification events by the latter. Also, for the ORF9b/protein 9b that we found modified in cells, interaction mapping identified MARK kinases as interaction partners.
By exploring the signaling changes inside the host cell, we were able to gain important insights into host cell signaling during infection. We found essential GFR signaling pathways activated such as EGFR or PDGFR, together with a plethora of RhoGTPase-associated signaling molecules. Furthermore, we could show modulation of the splicing machinery, which is in line with previous results indicating dependency of viral in vitro pathology on the host spliceosome (Bojkova et al., 2020). The same is true for metabolic reprogramming, for which we found differential post-translational modification of most members of the carbon metabolic pathways, namely glycolysis, pentose phosphate, and the tricarboxylic acid (TCA) cycle. These metabolic pathways were significantly upregulated on total protein levels in the presented dataset, which is consistent with our previous study (Bojkova et al., 2020), suggesting that these key pathways are regulated on multiple levels.
A number of drugs to treat COVID-19 have been suggested, largely based on bioinformatics analyses of genetics or cellular data (Gordon et al., 2020; Li et al., 2020; Wang, 2020). However, for many of these compounds, studies explaining their working mechanisms in the context of SARS-CoV-2 or viral assays to determine their efficacy of blocking viral replication in cell models of SARS-CoV-2 infection are missing. While monitoring signaling changes in host cells, we observed activation of GFR signaling cascades after infection, which is consistent with other viruses relying on the receptors themselves or elicited signal transduction (Eierhoff et al., 2010; Kung et al., 2011; Lupberger et al., 2011; Ueki et al., 2013; Wu et al., 2017; Zhu et al., 2009). From our data we could not clearly conclude which GFR may be activated and thus tested whether GFR downstream signaling inhibition could prevent SARS-CoV-2 replication, as is reported for some other viruses (Baturcam et al., 2019; Pleschka et al., 2001). Previously, temporal kinome analysis identified the antiviral potential of RAS/RAF/MEK and PI3K/AKT/mTOR for Middle East respiratory syndrome (MERS)-CoV (Kindrachuk et al., 2015). By targeting the RAS/RAF/MEK and PI3K/AKT/mTOR downstream axes of GFR signaling, we found efficient inhibition of viral replication in two different cell lines derived from different tissues (Figure 4). GFR signaling was shown to play a role in diverse virus infections and in fibrosis induction by SARS-CoV-1 (Beerli et al., 2019; Kung et al., 2011; Lupberger et al., 2011; Pleschka et al., 2001; Ueki et al., 2013; Venkataraman et al., 2017). Thus, our results in cytopathic effects may indicate cytoprotective roles for GFR signaling axes during SARS-CoV-2 infection and the possible development of fibrosis (Luo et al., 2020). Notably, some inhibitors used in our study such as omipalisib were shown to suppress fibrosis progression in patients with idiopathic pulmonary fibrosis, which may share the deregulation of signaling pathways involved in lung fibrosis of coronavirus patients (Venkataraman et al., 2017). These findings suggest that inhibitors of GFR downstream signaling may be beneficial to COVID-19 patients independent of their antiviral activity.
This study provides new insights into molecular mechanisms elicited by SARS-CoV-2 infection. Proteomic analyses revealed several pathways that are rearranged during infection and showed that targeting those pathways is a valid strategy to inhibit cytopathic effects triggered by infection.
Limitations of Study
In this study, cancer cell lines were used to assess the effect of SARS-CoV-2 on host cells during infections. We chose the experimental time point, based on a previous analysis of the infection course in these cells (Bojkova et al., 2020). Notably, the kinetics of infection are likely to be different in other cell lines or primary material, since we also observed a different MOI needed for UKF-RC-2 cells. In addition, we tested the efficiency of the presented drugs only in the context of in vitro cell line experiments. Thus, the results do not represent direct evidence for the use of these therapeutics in patients, as the effects may differ in primary tissue. The results presented indicate potential antiviral effects that must be further validated in other models and clinical trials to assess their usefulness for the treatment of COVID-19.
STAR★Methods
Key Resources Table
| REAGENT or RESOURCE | SOURCE | IDENTIFIER |
|---|---|---|
| Antibodies | ||
| Streptavidin, peroxidase conjugated | Sigma aldrich | Cat# 189733 |
| anti-mouse, biotin coupled igG | Jackson ImmunoResearch Labs | Cat# 115-065-003, RRID:AB_2338557 |
| dsRNA | SCICONS | Cat# 10010200, RRID:AB_2651015 |
| Bacterial and Virus Strains | ||
| SARS-CoV-2 | Frankfurt | https://doi.org/10.1056/NEJMc2001899 |
| Chemicals, Peptides, and Recombinant Proteins | ||
| Amine reactive TMT reagents | ThermoFisher | CAT: #A34808 |
| Sorafenib | Selleckchem | CAT: #S7397 |
| Lonafarnib | Selleckchem | CAT: #S2797 |
| RO5126766 | Selleckchem | CAT: #S7170 |
| Pictilisib | Selleckchem | CAT: #S1065 |
| Omipalisib | Selleckchem | CAT: #S2658 |
| Deposited Data | ||
| Proteomics and Phosphoproteomics of SARS-CoV-2 infected cells | This study | Pride: PXD018357 |
| Annotated spectra of new SARS-CoV-2 phospho-peptides | This study | Mendeley data: https://data.mendeley.com/datasets//4g2zzdfd47/1 |
| Supplementary tables | This study | Mendeley data: https://data.mendeley.com/datasets/kpnzwh6v6j/1 |
| Experimental Models: Cell Lines | ||
| Caco-2 | DSMZ; Braunschweig, Germany). | ACC. 169 |
| UKF-RC-2 | This study | N/A |
| Software and Algorithms | ||
| Proteome Discoverer 2.4 | ThermoFisher | CAT: OPTON-30954 |
| Perseus 1.6.5.0 | MPI of biochemistry | https://maxquant.net/perseus/ |
| Cytoscape 3.8.0 | https://doi.org/10.1101/gr.1239303 | https://cytoscape.org/ |
| ReactomeFI plug-in | https://reactome.org/tools/reactome-fiviz | |
| stringApp for Cytoscape | https://doi.org/10.1021/acs.jproteome.8b00702 | https://apps.cytoscape.org/apps/stringapp |
| NetPhos 3.1 | Blom et al., 1999 | http://www.cbs.dtu.dk/services/NetPhos/ |
| GPS 5.0 | https://doi.org/10.1016/j.gpb.2020.01.001 | N/A |
Resource Availability
Lead Contact
Further information and requests for resources and reagents should be directed to and will be fulfilled by the lead contact: Christian Münch: ch.muench@em.uni-frankfurt.de.
Materials Availability
UKF-RC-2 human kidney cells derived from renal carcinoma are available upon request.
Data and Code Availability
The mass spectrometry proteomics data have been deposited to the ProteomeXchange Consortium via the PRIDE (Perez-Riverol et al., 2019) partner repository with the dataset identifiers PRIDE: PXD018357.
Experimental Model and Subject Details
Cell culture
Human Caco-2 cells, derived from colon carcinoma, was obtained from the Deutsche Sammlung von Mikroorganismen und Zellkulturen (DSMZ; Braunschweig, Germany). Cells were grown at 37°C in Minimal Essential Medium (MEM) supplemented with 10% fetal bovine serum (FBS) and containing 100 IU/ml penicillin and 100 μg/ml streptomycin. All culture reagents were purchased from Sigma.
Cell line designated UKF-RC-2 was established from a tumor sample of a patient with a diagnosis of renal carcinoma hospitalized at Department of Urology, University Hospital Frankfurt. Tumor tissue was cut in pieces and dissociated using 0.2% trypsin solution. Primary tumor cells and passaging of cell line was performed using IMDM medium supplemented with 10% FCS and antibiotics. UKF-RC-2 cells between passages 15 and 20 were used for antiviral experiments. All culture reagents were purchased from Sigma.
Virus preparation
SARS-CoV-2 was isolated from samples of travelers returning from Wuhan (China) to Frankfurt (Germany) using human colon carcinoma cell line CaCo-2 as described previously12. SARS-CoV-2 stocks used in the experiments had undergone one passage on CaCo-2 cells and were stored at –80°C. Virus titers were determined as TCID50/ml in confluent cells in 96-well microtiter plates.
Method Details
Antiviral and cell viability assays
Confluent layers of CaCo-2 cells in 96-well plates were infected with SARS-CoV-2 at MOI 0.01. Virus was added together with drugs and incubated in MEM supplemented with 2% FBS with different drug dilutions. Cytopathogenic effect (CPE) was assessed visually 48 h after infection. To assess effects of drugs on Caco-2 cell viability, confluent cell layers were treated with different drug concentration in 96-well plates. The viability was measured using the Rotitest Vital (Roth) according to manufacturer’s instructions. Data for each condition was collected for at least three biological replicates. For dose response curves, data was fitted with all replicates using OriginPro 2020 with the following equation:
IC50 values were generated by OriginPro 2020 together with metrics for curve fits.
For UKF-RC-2 cells, the assay was performed as described above, except for usage of a MOI of 0.1 as staining experiments for SARS-CoV-2 infection in UKF-RC-2 cells revealed the need of a higher MOI to achieve comparable effects to CaCo-2 cells.
Quantification of viral RNA
SARS-CoV-2 RNA from cell culture supernatant samples was isolated using AVL buffer and the QIAamp Viral RNA Kit (QIAGEN) according to the manufacturer’s instructions. Absorbance-based quantification of the RNA yield was performed using the Genesys 10S UV-Vis Spectrophotometer (Thermo Scientific). RNA was subjected to OneStep qRT-PCR analysis using the Luna Universal One-Step RT-qPCR Kit (New England Biolabs) and a CFX96 Real-Time System, C1000 Touch Thermal Cycler. Primers were adapted from the WHO protocol (Corman et al., 2020) targeting the open reading frame for RNA-dependent RNA polymerase (RdRp): RdRP_SARSr-F2 (GTG ARA TGG TCA TGT GTG GCG G) and RdRP_SARSr-R1 (CAR ATG TTA AAS ACA CTA TTA GCA TA) using 0.4 μM per reaction. Standard curves were created using plasmid DNA (pEX-A128-RdRP) harboring the corresponding amplicon regions for RdRP target sequence according to GenBank Accession number NC_045512. All quantification experiments have been carried out with biological replicates.
Detection of viral load by microscopy
Effect of selected compounds on viral replication was assessed by staining of double-stranded RNA, which has been shown to be sufficient for measurement of SARS-CoV-1 replication (Weber et al., 2006). Briefly, cells were fixed with acetone/methanol (40:60) solution 48 h post infection. Immunostaining was performed using a monoclonal antibody directed against dsRNA (1:150 dilution, SCICONS J2, mouse, IgG2a, kappa chain, English & Scientific Consulting Kft., Szirák, Hungary), which was detected with biotin-conjugated secondary antibody (1:1000 dilution, Jackson ImmunoResearch) followed by application streptavidin, peroxidase conjugate (1:3000 dilution, Sigma Aldrich). Lastly, the dsRNA positive cells were visualized by addition of AEC substrate. Wells were imaged at different areas to visualize a larger area (presented in Supplementary figures).
Sample preparation for mass spectrometry
For all proteomics analysis, Caco-2 cells were infected at an MOI of 1 and the sample preparation was performed as described previously (Klann et al., 2020). Briefly, lysates were precipitated by methanol/chloroform and proteins resuspended in 8 M Urea/10 mM EPPS pH 8.2. Concentration of proteins was determined by Bradford assay and 300 μg of protein per samples was used for digestion. For digestion, the samples were diluted to 1 M Urea with 10mM EPPS pH 8.2 and incubated overnight with 1:50 LysC (Wako Chemicals) and 1:100 Sequencing grade trypsin (Promega). Digests were acidified using TFA and tryptic peptideswere purified by tC18 SepPak (50 mg, Waters). 125 μg peptides per sample were TMT labeled and the mixing was normalized after a single injection measurement by LC-MS/MS to equimolar ratios for each channel. 250 μg of pooled peptides were dried for offline High pH Reverse phase fractionation by HPLC (whole cell proteome) and remaining 1 mg of multiplexed peptides were used for phospho-peptide enrichment by High-Select Fe-NTA Phosphopeptide enrichment kit (Thermo Fisher) after manufacturer`s instructions. After enrichment, peptides were dried and resuspended in 70% acetonitrile/0.1% TFA and filtered through a C8 stage tip to remove contaminating Fe-NTA particles. Dried phospho-peptides then were fractionated on C18 (Empore) stage-tip. For fractionation C18 stagetips were washed with 100% acetonitrile twice, followed by equilibration with 0.1% TFA solution. Peptides were loaded in 0.1% TFA solution and washed with water. Elution was performed stepwise with different acetonitrile concentrations in 0.1% Triethylamine solution (5%, 7.5%, 10%, 12.5%, 15%, 17.5%, 20%, 50%). The eight fractions were concatenated into four fractions and dried for LC-MS.
Offline high pH reverse phase fractionation
Peptides were fractionated using a Dionex Ultimate 3000 analytical HPLC. 250 μg of pooled and purified TMT-labeled samples were resuspended in 10 mM ammonium-bicarbonate (ABC), 5% ACN, and separated on a 250 mm long C18 column (X-Bridge, 4.6 mm ID, 3.5 μm particle size; Waters) using a multistep gradient from 100% Solvent A (5% ACN, 10 mM ABC in water) to 60% Solvent B (90% ACN, 10 mM ABC in water) over 70 min. Eluting peptides were collected every 45 s into a total of 96 fractions, which were cross-concatenated into 24 fractions and dried for further processing.
Liquid chromatography mass spectrometry
All mass spectrometry data was acquired in centroid mode on an Orbitrap Fusion Lumos mass spectrometer hyphenated to an easy-nLC 1200 nano HPLC system using a nanoFlex ion source (ThermoFisher Scientific) applying a spray voltage of 2.6 kV with the transfer tube heated to 300°C and a funnel RF of 30%. Internal mass calibration was enabled (lock mass 445.12003 m/z). Peptides were separated on a self-made, 32 cm long, 75μm ID fused-silica column, packed in house with 1.9 μm C18 particles (ReproSil-Pur, Dr. Maisch) and heated to 50°C using an integrated column oven (Sonation). HPLC solvents consisted of 0.1% Formic acid in water (Buffer A) and 0.1% Formic acid, 80% acetonitrile in water (Buffer B).
For total proteome analysis, a synchronous precursor selection (SPS) multi-notch MS3 method was used in order to minimize ratio compression as previously described (McAlister et al., 2014). Individual peptide fractions were eluted by a non-linear gradient from 7 to 40% B over 90 minutes followed by a stepwise increase to 95% B in 6 minutes which was held for another 9 minutes. Full scan MS spectra (350-1400 m/z) were acquired with a resolution of 120,000 at m/z 200, maximum injection time of 100 ms and AGC target value of 4 × 10⁵. The 20 most intense precursors with a charge state between 2 and 6 per full scan were selected for fragmentation (“Top 20”) and isolated with a quadrupole isolation window of 0.7 Th. MS2 scans were performed in the Ion trap (Turbo) using a maximum injection time of 50ms, AGC target value of 1.5 × 10⁴ and fragmented using CID with a normalized collision energy (NCE) of 35%. SPS-MS3 scans for quantification were performed on the 10 most intense MS2 fragment ions with an isolation window of 0.7 Th (MS) and 2 m/z (MS2). Ions were fragmented using HCD with an NCE of 65% and analyzed in the Orbitrap with a resolution of 50,000 at m/z 200, scan range of 110-500 m/z, AGC target value of 1.5 x10⁵ and a maximum injection time of 120ms. Repeated sequencing of already acquired precursors was limited by setting a dynamic exclusion of 45 s and 7 ppm and advanced peak determination was deactivated.
For phosphopeptide analysis, each peptide fraction was eluted by a linear gradient from 5 to 32% B over 120 minutes followed by a stepwise increase to 95% B in 8 minutes which was held for another 7 minutes. Full scan MS spectra (350-1400 m/z) were acquired with a resolution of 120,000 at m/z 200, maximum injection time of 100 ms and AGC target value of 4 × 10⁵. The 20 most intense precursors per full scan with a charge state between 2 and 5 were selected for fragmentation (“Top 20”), isolated with a quadrupole isolation window of 0.7 Th and fragmented via HCD applying an NCE of 38%. MS2 scans were performed in the Orbitrap using a resolution of 50,000 at m/z 200, maximum injection time of 86ms and AGC target value of 1 × 10⁵. Repeated sequencing of already acquired precursors was limited by setting a dynamic exclusion of 60 s and 7 ppm and advanced peak determination was deactivated. An MS2 based method was chosen, because of higher precision and identification rates (Hogrebe et al., 2018). Phospho-peptide fractions intrinsically exhibit lower complexity, rendering them less prone to ratio compression by isolation interference.
Mass spectrometry data analysis
Raw files were analyzed using Proteome Discoverer (PD) 2.4 software (ThermoFisher Scientific). Spectra were selected using default settings and database searches performed using SequestHT node in PD. Database searches were performed against trypsin digested Homo sapiens SwissProt database, SARS-CoV-2 database (Uniprot pre-release). Static modifications were set as TMT6 at the N terminus and lysines and carbamidomethyl at cysteine residues. Search was performed using Sequest HT taking the following dynamic modifications into account: Oxidation (M), Phospho (S, T, Y), Met-loss (Protein N terminus), Acetyl (Protein N terminus) and Met-loss acetyl (Protein N terminus). For whole cell proteomics, the same settings were used except phosphorylation was not allowed as dynamic modification. For phospho-proteomics all peptide groups were normalized by summed intensity normalization and then analyzed on peptide level. For whole cell proteomics normalized PSMs were summed for each accession and data exported for further use. Peptide and protein identifications were validated using a concatenated target-decoy strategy and FDR was estimated using q-values calculated by Percolator applying 1% and 5% cut-offs for high and medium confidence hits, while only high confident proteins are reported. Phosphosite localization probabilities were calculated using the ptmRS-node working in “PhosphoRS mode” and using default settings.
Quantification and Statistical Analysis
Significance testing
Unless otherwise stated significance was tested by unpaired, two-sided Student’s t tests with equal variance assumed. Resulting P values were corrected using the Benjamini-Hochberg FDR procedure. Adjusted P values smaller/equal 0.05 were considered significant. For phospho-proteomics an additional fold change cutoff was applied (log2 > |1|), while for total protein levels, due to different dynamic range, a fold change cutoff of log 2 > |0.5| was applied.
Prediction of kinase motifs
Kinase motifs of phosphopeptides from SARS-CoV-2 proteins were predicted using NetPhos 3.1 (Blom et al., 1999) and GPS 5.0 (stand-alone version) using the fasta-file of the Uniprot pre-release which was also used for the proteomics data analysis.(Blom et al., 2004; Wang et al., 2020). For NetPhos, only Kinases with a score above 0.5 were considered as positive hits. For GPS 5.0, sequences were submitted separately for S/T- and Y-kinases and the score threshold was set to “high.” For the final list in Table S3, only the top hits with the highest scores were considered.
Protein co-regulation analysis
Z-scores were calculated for each phospho-site and the total protein levels individually. Phosphosites were collapsed by average. For merging phosphorylation and total protein levels Z-scores for collapsed phosphorylation and protein level were added for each condition and replicate. Thus, both negative Z-scores (downregulation) will produce a lower combined Z-score and vice versa two positive Z-scores will produce a larger combined Z-score. Next, Euclidean distance correlation for all possible protein-protein pairs were calculated, taking all conditions and replicates individually into account. A heatmap was then build by Euclidean distance hierarchical clustering of the correlation matrix.
Pathway enrichment analysis
Pathway enrichment analysis was performed by ReactomeFI cytoscape plugin or by STRING functional enrichment analysis. Both analysis used Reactome database for pathway annotations.
Drug-target network analysis
All proteins were loaded into ReactomeFI cytoscape plugin to visualize protein-protein functional interaction network. Next, drugs were overlaid by ReactomeFI and network was filtered for the drugs and the first interacting partners. Layout was calculated by yFilesLayout algorithm.
Interaction network analysis
All proteins showing significant regulation were loaded by OmicsVisualizer cytoscape plugin and STRING interaction network was retrieved with a confidence cutoff of 0.9. For EGFR subnetwork, EGFR was selected with first interacting neighbors.
Acknowledgments
We thank the Quantitative Proteomics Unit (IBC2, Goethe University Frankfurt) for support and expertise on LC-MS instrumentation and data analysis and Christiane Pallas and Lena Stegmann for assistance with the experimental work. C.M. was supported by the European Research Council under the European Union’s Seventh Framework Programme (ERC StG 803565), Collaborative Research Center (CRC) 1177 and the Emmy Noether Programme of the Deutsche Forschungsgemeinschaft (DFG; MU 4216/1-1), the Johanna Quandt Young Academy at Goethe, the Aventis Foundation Bridge Award, and the Goethe Corona Fonds. J.C. was funded by the Hilfe für krebskranke Kinder Frankfurt e.V. and the Frankfurter Stiftung für krebskranke Kinder.
Author Contributions
Conceptualization, K.K., D.B., C.M., and J.C.; Methodology, K.K. and D.B.; Software, K.K.; Formal Analysis, K.K. and G.T.; Investigation, K.K., D.B., and J.C.; Data Curation, K.K.; Writing – Original Draft, K.K. and C.M.; Writing – Review & Editing, K.K., D.B., G.T., C.M., and J.C.; Visualization, K.K.; Supervision, C.M. and J.C.; Project Administration, C.M. and J.C.; Funding Acquisition, S.C., C.M., and J.C.
Declaration of Interests
The authors filed a patent application on the use of GFR signaling inhibitors for the treatment of COVID-19.
Published: August 11, 2020
Footnotes
Supplemental Information can be found online at https://doi.org/10.1016/j.molcel.2020.08.006.
Supplementary Information
Shown are Protein UniProt accessions together with gene names and modification sites (numbers in brackets indicate localization confidence). Log2 ratios between mock and SARS-CoV-2 infected cells were calculated together with p values. p values were adjusted using Benjamini Hochberg FDR adjustment. Additionally, replicate quantification values are given.
Uniprot Accessions, Protein description, number of PSMs used for quantification, gene symbol, replicate quantifications, log2 ratio and adjusted p values are shown. p values were adjusted using Benjamini Hochberg FDR adjustment.
Modified amino acid, position in peptide, site probability, peptide sequence, number of modified PSMs, unmodified PSMs, protein accession, protein description, position in protein and modification motifs are given for all identified viral modification sites. Additionally, results of kinase predictions by NetPhos 3.1 and GPS5 are added.
Reactome pathway, number of genes found in pathway, enrichment FDR and individual genes in pathway are given for all identified clusters.
Reactome pathway, number of genes found in pathway, enrichment FDR and individual genes in pathway are given.
References
- Baturcam E., Vollmer S., Schlüter H., Maciewicz R.A., Kurian N., Vaarala O., Ludwig S., Cunoosamy D.M. MEK inhibition drives anti-viral defence in RV but not RSV challenged human airway epithelial cells through AKT/p70S6K/4E-BP1 signalling. Cell Commun. Signal. 2019;17:78. doi: 10.1186/s12964-019-0378-7. [DOI] [PMC free article] [PubMed] [Google Scholar]
- Beerli C., Yakimovich A., Kilcher S., Reynoso G.V., Fläschner G., Müller D.J., Hickman H.D., Mercer J. Vaccinia virus hijacks EGFR signalling to enhance virus spread through rapid and directed infected cell motility. Nat. Microbiol. 2019;4:216–225. doi: 10.1038/s41564-018-0288-2. [DOI] [PMC free article] [PubMed] [Google Scholar]
- Blom N., Gammeltoft S., Brunak S. Sequence and structure-based prediction of eukaryotic protein phosphorylation sites. J. Mol. Biol. 1999;294:1351–1362. doi: 10.1006/jmbi.1999.3310. [DOI] [PubMed] [Google Scholar]
- Blom N., Sicheritz-Pontén T., Gupta R., Gammeltoft S., Brunak S. Prediction of post-translational glycosylation and phosphorylation of proteins from the amino acid sequence. Proteomics. 2004;4:1633–1649. doi: 10.1002/pmic.200300771. [DOI] [PubMed] [Google Scholar]
- Bojkova D., Klann K., Koch B., Widera M., Krause D., Ciesek S., Cinatl J., Münch C. Proteomics of SARS-CoV-2-infected host cells reveals therapy targets. Nature. 2020;583:469–472. doi: 10.1038/s41586-020-2332-7. [DOI] [PMC free article] [PubMed] [Google Scholar]
- Chen N., Zhou M., Dong X., Qu J., Gong F., Han Y., Qiu Y., Wang J., Liu Y., Wei Y. Epidemiological and clinical characteristics of 99 cases of 2019 novel coronavirus pneumonia in Wuhan, China: a descriptive study. Lancet. 2020;395:507–513. doi: 10.1016/S0140-6736(20)30211-7. [DOI] [PMC free article] [PubMed] [Google Scholar]
- Corman V.M., Landt O., Kaiser M., Molenkamp R., Meijer A., Chu D.K., Bleicker T., Brünink S., Schneider J., Schmidt M.L. Detection of 2019 novel coronavirus (2019-nCoV) by real-time RT-PCR. Euro Surveill. 2020;25:2000045. doi: 10.2807/1560-7917.ES.2020.25.3.2000045. [DOI] [PMC free article] [PubMed] [Google Scholar]
- Eierhoff T., Hrincius E.R., Rescher U., Ludwig S., Ehrhardt C. The epidermal growth factor receptor (EGFR) promotes uptake of influenza A viruses (IAV) into host cells. PLOS Pathog. 2010;6:e1001099. doi: 10.1371/journal.ppat.1001099. [DOI] [PMC free article] [PubMed] [Google Scholar]
- Eskens F.A.L.M., Awada A., Cutler D.L., de Jonge M.J.A., Luyten G.P.M., Faber M.N., Statkevich P., Sparreboom A., Verweij J., Hanauske A.-R., Piccart M., European Organization for Research and Treatment of Cancer Early Clinical Studies Group Phase I and pharmacokinetic study of the oral farnesyl transferase inhibitor SCH 66336 given twice daily to patients with advanced solid tumors. J. Clin. Oncol. 2001;19:1167–1175. doi: 10.1200/JCO.2001.19.4.1167. [DOI] [PubMed] [Google Scholar]
- Fucile C., Marenco S., Bazzica M., Zuccoli M.L., Lantieri F., Robbiano L., Marini V., Di Gion P., Pieri G., Stura P. Measurement of sorafenib plasma concentration by high-performance liquid chromatography in patients with advanced hepatocellular carcinoma: is it useful the application in clinical practice? A pilot study. Med. Oncol. 2015;32:335. doi: 10.1007/s12032-014-0335-7. [DOI] [PubMed] [Google Scholar]
- Gordon D.E., Jang G.M., Bouhaddou M., Xu J., Obernier K., White K.M., O’Meara M.J., Rezelj V.V., Guo J.Z., Swaney D.L. A SARS-CoV-2-Human Protein-Protein Interaction Map Reveals Drug Targets and Potential Drug-Repurposing. Nature. 2020;583:459–468. doi: 10.1038/s41586-020-2286-9. [DOI] [PMC free article] [PubMed] [Google Scholar]
- Grimmler M., Bauer L., Nousiainen M., Körner R., Meister G., Fischer U. Phosphorylation regulates the activity of the SMN complex during assembly of spliceosomal U snRNPs. EMBO Rep. 2005;6:70–76. doi: 10.1038/sj.embor.7400301. [DOI] [PMC free article] [PubMed] [Google Scholar]
- Herzog P., Drosten C., Müller M.A. Plaque assay for human coronavirus NL63 using human colon carcinoma cells. Virol. J. 2008;5:138. doi: 10.1186/1743-422X-5-138. [DOI] [PMC free article] [PubMed] [Google Scholar]
- Hogrebe A., von Stechow L., Bekker-Jensen D.B., Weinert B.T., Kelstrup C.D., Olsen J.V. Benchmarking common quantification strategies for large-scale phosphoproteomics. Nat. Commun. 2018;9:1045. doi: 10.1038/s41467-018-03309-6. [DOI] [PMC free article] [PubMed] [Google Scholar]
- Ilan L., Osman F., Namer L.S., Eliahu E., Cohen-Chalamish S., Ben-Asouli Y., Banai Y., Kaempfer R. PKR activation and eIF2α phosphorylation mediate human globin mRNA splicing at spliceosome assembly. Cell Res. 2017;27:688–704. doi: 10.1038/cr.2017.39. [DOI] [PMC free article] [PubMed] [Google Scholar]
- Ippolito T., Tang G., Mavis C., Gu J.J., Hernandez-Ilizaliturri F.J., Barth M.J. Omipalisib (GSK458), a Novel Pan-PI3K/mTOR Inhibitor, Exhibits In Vitro Anti-Lymphoma Activity in Chemotherapy-Sensitive and -Resistant Models of Burkitt Lymphoma. Blood. 2016;128:5376. [Google Scholar]
- Kindrachuk J., Ork B., Hart B.J., Mazur S., Holbrook M.R., Frieman M.B., Traynor D., Johnson R.F., Dyall J., Kuhn J.H. Antiviral potential of ERK/MAPK and PI3K/AKT/mTOR signaling modulation for Middle East respiratory syndrome coronavirus infection as identified by temporal kinome analysis. Antimicrob. Agents Chemother. 2015;59:1088–1099. doi: 10.1128/AAC.03659-14. [DOI] [PMC free article] [PubMed] [Google Scholar]
- Klann K., Tascher G., Münch C. Functional Translatome Proteomics Reveal Converging and Dose-Dependent Regulation by mTORC1 and eIF2α. Mol. Cell. 2020;77:913–925.e4. doi: 10.1016/j.molcel.2019.11.010. [DOI] [PMC free article] [PubMed] [Google Scholar]
- Kung C.-P., Meckes D.G., Raab-Traub N. Epstein-Barr Virus LMP1 Activates EGFR, STAT3, and ERK through Effects on PKCδ. J. Virol. 2011;85:4399–4408. doi: 10.1128/JVI.01703-10. [DOI] [PMC free article] [PubMed] [Google Scholar]
- Li X., Yu J., Zhang Z., Ren J., Peluffo A.E., Zhang W., Zhao Y., Yan K., Cohen D., Wang W. Network Bioinformatics Analysis Provides Insight into Drug Repurposing for COVID-2019. Preprints. 2020:2020030286. doi: 10.1016/j.medidd.2021.100090. [DOI] [PMC free article] [PubMed] [Google Scholar]
- Luo W., Yu H., Gou J., Li X., Sun Y., Li J., Liu L. Clinical Pathology of Critical Patient with Novel Coronavirus Pneumonia (COVID-19) Preprints. 2020:2020020407. [Google Scholar]
- Lupberger J., Zeisel M.B., Xiao F., Thumann C., Fofana I., Zona L., Davis C., Mee C.J., Turek M., Gorke S. EGFR and EphA2 are host factors for hepatitis C virus entry and possible targets for antiviral therapy. Nat. Med. 2011;17:589–595. doi: 10.1038/nm.2341. [DOI] [PMC free article] [PubMed] [Google Scholar]
- Martinez-Garcia M., Banerji U., Albanell J., Bahleda R., Dolly S., Kraeber-Bodéré F., Rojo F., Routier E., Guarin E., Xu Z.-X. First-in-Human, Phase I Dose-Escalation Study of the Safety, Pharmacokinetics, and Pharmacodynamics of RO5126766, a First-in-Class Dual MEK/RAF Inhibitor in Patients with Solid Tumors. Clin. Cancer Res. 2012;18:4806–4819. doi: 10.1158/1078-0432.CCR-12-0742. [DOI] [PubMed] [Google Scholar]
- Mathew R., Hartmuth K., Möhlmann S., Urlaub H., Ficner R., Lührmann R. Phosphorylation of human PRP28 by SRPK2 is required for integration of the U4/U6-U5 tri-snRNP into the spliceosome. Nat. Struct. Mol. Biol. 2008;15:435–443. doi: 10.1038/nsmb.1415. [DOI] [PubMed] [Google Scholar]
- McAlister G.C., Nusinow D.P., Jedrychowski M.P., Wühr M., Huttlin E.L., Erickson B.K., Rad R., Haas W., Gygi S.P. MultiNotch MS3 enables accurate, sensitive, and multiplexed detection of differential expression across cancer cell line proteomes. Anal. Chem. 2014;86:7150–7158. doi: 10.1021/ac502040v. [DOI] [PMC free article] [PubMed] [Google Scholar]
- Mermoud J.E., Cohen P.T., Lamond A.I. Regulation of mammalian spliceosome assembly by a protein phosphorylation mechanism. EMBO J. 1994;13:5679–5688. doi: 10.1002/j.1460-2075.1994.tb06906.x. [DOI] [PMC free article] [PubMed] [Google Scholar]
- Munster P., Aggarwal R., Hong D., Schellens J.H.M., van der Noll R., Specht J., Witteveen P.O., Werner T.L., Dees E.C., Bergsland E. First-in-Human Phase I Study of GSK2126458, an Oral Pan-Class I Phosphatidylinositol-3-Kinase Inhibitor, in Patients with Advanced Solid Tumor Malignancies. Clin. Cancer Res. 2016;22:1932–1939. doi: 10.1158/1078-0432.CCR-15-1665. [DOI] [PubMed] [Google Scholar]
- Perez-Riverol Y., Csordas A., Bai J., Bernal-Llinares M., Hewapathirana S., Kundu D.J., Inuganti A., Griss J., Mayer G., Eisenacher M. The PRIDE database and related tools and resources in 2019: improving support for quantification data. Nucleic Acids Res. 2019;47(D1):D442–D450. doi: 10.1093/nar/gky1106. [DOI] [PMC free article] [PubMed] [Google Scholar]
- Pleschka S., Wolff T., Ehrhardt C., Hobom G., Planz O., Rapp U.R., Ludwig S. Influenza virus propagation is impaired by inhibition of the Raf/MEK/ERK signalling cascade. Nat. Cell Biol. 2001;3:301–305. doi: 10.1038/35060098. [DOI] [PubMed] [Google Scholar]
- Ren X., Glende J., Al-Falah M., de Vries V., Schwegmann-Wessels C., Qu X., Tan L., Tschernig T., Deng H., Naim H.Y., Herrler G. Analysis of ACE2 in polarized epithelial cells: surface expression and function as receptor for severe acute respiratory syndrome-associated coronavirus. J. Gen. Virol. 2006;87:1691–1695. doi: 10.1099/vir.0.81749-0. [DOI] [PubMed] [Google Scholar]
- Sarker D., Ang J.E., Baird R., Kristeleit R., Shah K., Moreno V., Clarke P.A., Raynaud F.I., Levy G., Ware J.A. First-in-Human Phase I Study of Pictilisib (GDC-0941), a Potent Pan–Class I Phosphatidylinositol-3-Kinase (PI3K) Inhibitor, in Patients with Advanced Solid Tumors. Clin. Cancer Res. 2015;21:77–86. doi: 10.1158/1078-0432.CCR-14-0947. [DOI] [PMC free article] [PubMed] [Google Scholar]
- Schmid P., Pinder S.E., Wheatley D., Macaskill J., Zammit C., Hu J., Price R., Bundred N., Hadad S., Shia A. Phase II Randomized Preoperative Window-of-Opportunity Study of the PI3K Inhibitor Pictilisib Plus Anastrozole Compared With Anastrozole Alone in Patients With Estrogen Receptor-Positive Breast Cancer. J. Clin. Oncol. 2016;34:1987–1994. doi: 10.1200/JCO.2015.63.9179. [DOI] [PMC free article] [PubMed] [Google Scholar]
- Smith M., Smith J.C. Repurposing Therapeutics for COVID-19: Supercomputer-Based Docking to the SARS-CoV-2 Viral Spike Protein and Viral Spike Protein-Human ACE2 Interface. ChemRxiv. 2020 doi: 10.26434/chemrxiv.11871402.v4. [DOI] [Google Scholar]
- Tangudu C., Olivares H., Netland J., Perlman S., Gallagher T. Severe acute respiratory syndrome coronavirus protein 6 accelerates murine coronavirus infections. J. Virol. 2007;81:1220–1229. doi: 10.1128/JVI.01515-06. [DOI] [PMC free article] [PubMed] [Google Scholar]
- Ueki I.F., Min-Oo G., Kalinowski A., Ballon-Landa E., Lanier L.L., Nadel J.A., Koff J.L. Respiratory virus-induced EGFR activation suppresses IRF1-dependent interferon λ and antiviral defense in airway epithelium. J. Exp. Med. 2013;210:1929–1936. doi: 10.1084/jem.20121401. [DOI] [PMC free article] [PubMed] [Google Scholar]
- Venkataraman T., Frieman M.B. The role of epidermal growth factor receptor (EGFR) signaling in SARS coronavirus-induced pulmonary fibrosis. Antiviral Res. 2017;143:142–150. doi: 10.1016/j.antiviral.2017.03.022. [DOI] [PMC free article] [PubMed] [Google Scholar]
- Venkataraman T., Coleman C., Frieman M. Overactive EGFR Signaling Leads to Increased Fibrosis After SARS-CoV Infection. J. Virol. 2017;91 doi: 10.1128/JVI.00182-17. e00182-17. [DOI] [PMC free article] [PubMed] [Google Scholar]
- Wang J. Fast Identification of Possible Drug Treatment of Coronavirus Disease-19 (COVID-19) through Computational Drug Repurposing Study. J. Chem. Inf. Model. 2020;60:3277–3286. doi: 10.1021/acs.jcim.0c00179. [DOI] [PMC free article] [PubMed] [Google Scholar]
- Wang C., Xu H., Lin S., Deng W., Zhou J., Zhang Y., Shi Y., Peng D., Xue Y. GPS 5.0: An Update on the Prediction of Kinase-specific Phosphorylation Sites in Proteins. Genomics Proteomics Bioinformatics. 2020;18:72–80. doi: 10.1016/j.gpb.2020.01.001. [DOI] [PMC free article] [PubMed] [Google Scholar]
- Weber F., Wagner V., Rasmussen S.B., Hartmann R., Paludan S.R. Double-stranded RNA is produced by positive-strand RNA viruses and DNA viruses but not in detectable amounts by negative-strand RNA viruses. J. Virol. 2006;80:5059–5064. doi: 10.1128/JVI.80.10.5059-5064.2006. [DOI] [PMC free article] [PubMed] [Google Scholar]
- Wilhelm S., Carter C., Lynch M., Lowinger T., Dumas J., Smith R.A., Schwartz B., Simantov R., Kelley S. Discovery and development of sorafenib: a multikinase inhibitor for treating cancer. Nat. Rev. Drug Discov. 2006;5:835–844. doi: 10.1038/nrd2130. [DOI] [PubMed] [Google Scholar]
- Wu C.-H., Yeh S.-H., Tsay Y.-G., Shieh Y.-H., Kao C.-L., Chen Y.-S., Wang S.-H., Kuo T.-J., Chen D.-S., Chen P.-J. Glycogen synthase kinase-3 regulates the phosphorylation of severe acute respiratory syndrome coronavirus nucleocapsid protein and viral replication. J. Biol. Chem. 2009;284:5229–5239. doi: 10.1074/jbc.M805747200. [DOI] [PMC free article] [PubMed] [Google Scholar]
- Wu Y., Prager A., Boos S., Resch M., Brizic I., Mach M., Wildner S., Scrivano L., Adler B. Human cytomegalovirus glycoprotein complex gH/gL/gO uses PDGFR-α as a key for entry. PLOS Pathog. 2017;13:e1006281. doi: 10.1371/journal.ppat.1006281. [DOI] [PMC free article] [PubMed] [Google Scholar]
- Yarden Y. The EGFR family and its ligands in human cancer. Signalling mechanisms and therapeutic opportunities. Eur. J. Cancer. 2001;37(Suppl 4):S3–S8. doi: 10.1016/s0959-8049(01)00230-1. [DOI] [PubMed] [Google Scholar]
- Zhu L., Lee P.K., Lee W.M., Zhao Y., Yu D., Chen Y. Rhinovirus-induced major airway mucin production involves a novel TLR3-EGFR-dependent pathway. Am. J. Respir. Cell Mol. Biol. 2009;40:610–619. doi: 10.1165/rcmb.2008-0223OC. [DOI] [PMC free article] [PubMed] [Google Scholar]
Associated Data
This section collects any data citations, data availability statements, or supplementary materials included in this article.
Supplementary Materials
Shown are Protein UniProt accessions together with gene names and modification sites (numbers in brackets indicate localization confidence). Log2 ratios between mock and SARS-CoV-2 infected cells were calculated together with p values. p values were adjusted using Benjamini Hochberg FDR adjustment. Additionally, replicate quantification values are given.
Uniprot Accessions, Protein description, number of PSMs used for quantification, gene symbol, replicate quantifications, log2 ratio and adjusted p values are shown. p values were adjusted using Benjamini Hochberg FDR adjustment.
Modified amino acid, position in peptide, site probability, peptide sequence, number of modified PSMs, unmodified PSMs, protein accession, protein description, position in protein and modification motifs are given for all identified viral modification sites. Additionally, results of kinase predictions by NetPhos 3.1 and GPS5 are added.
Reactome pathway, number of genes found in pathway, enrichment FDR and individual genes in pathway are given for all identified clusters.
Reactome pathway, number of genes found in pathway, enrichment FDR and individual genes in pathway are given.
Data Availability Statement
The mass spectrometry proteomics data have been deposited to the ProteomeXchange Consortium via the PRIDE (Perez-Riverol et al., 2019) partner repository with the dataset identifiers PRIDE: PXD018357.