. 2020 Aug 10:202708. doi: 10.1148/radiol.2020202708

Figure 2b:

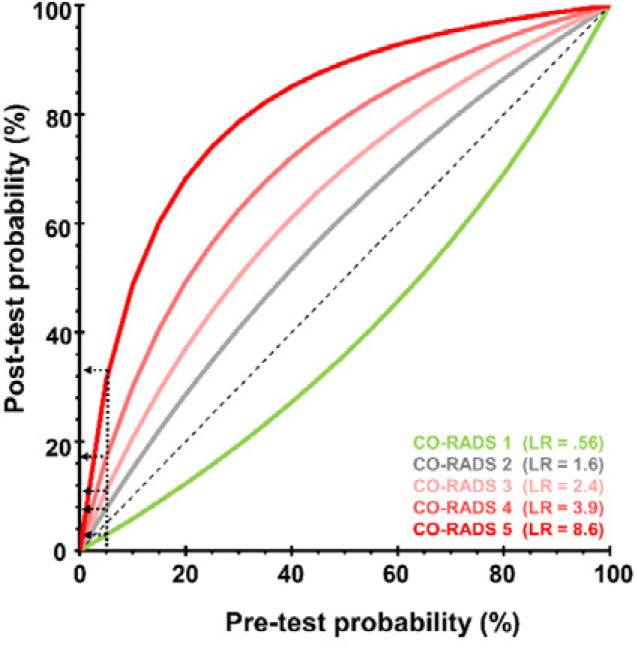
Diagnostic performance of CT-CORADS scoring in individuals with and without COVID-19 symptoms. A, The area under the receiver operating characteristics curve (AUC) of CT-CORADS to predict a positive SARS-CoV-2 PCR result in symptomatic (red line) and asymptomatic (blue line). The diagonal dashed line indicates no discrimination. B, Post-test probability of positive PCR as function of the pre-test probability for different likelihood ratios (LR) associated with the indicated CO-RADS score in 859 symptomatic individuals. The arrow indicates the pre-test probability as determined by overall prevalence of positive PCR (41.7%) in this sample. C, Post-test probability of positive PCR as function of the pre-test probability for different likelihood ratios (LR) associated with the indicated CO-RADS score in 1138 asymptomatic individuals. The arrow indicates the pre-test probability as determined by overall prevalence of positive PCR (5.2%) in this sample.

Diagnostic performance of CT-CORADS scoring in individuals with and without COVID-19 symptoms. A, The area under the receiver operating characteristics curve (AUC) of CT-CORADS to predict a positive SARS-CoV-2 PCR result in symptomatic (red line) and asymptomatic (blue line). The diagonal dashed line indicates no discrimination. B, Post-test probability of positive PCR as function of the pre-test probability for different likelihood ratios (LR) associated with the indicated CO-RADS score in 859 symptomatic individuals. The arrow indicates the pre-test probability as determined by overall prevalence of positive PCR (41.7%) in this sample. C, Post-test probability of positive PCR as function of the pre-test probability for different likelihood ratios (LR) associated with the indicated CO-RADS score in 1138 asymptomatic individuals. The arrow indicates the pre-test probability as determined by overall prevalence of positive PCR (5.2%) in this sample.