

ABSTRACT
Background
Limited data were available in infants and children when vitamin A (VA) DRIs were established; recommendations were developed based on average breast milk VA intake and extrapolation of data from adults.
Objectives
Our objective was to evaluate whether DRIs and reported intakes, with and without VA from intervention programs, would be sufficient to develop adequate VA stores from birth to age 5 y in Bangladeshi, Filipino, Guatemalan, and Mexican children.
Methods
A mathematical relationship was established, defined by a series of equations, to predict VA total body stores (TBS) as a function of age based on VA intake and utilization. TBS calculated using reported VA intakes, with and without additional VA from intervention programs, were compared to those predicted using DRIs (specifically, Adequate Intake and RDA). Liver VA concentrations were also estimated.
Results
Our predictions showed that for these 4 groups, DRIs were sufficient to attain liver VA concentrations >0.07 μmol/g by 1 wk of age and sustain positive VA balance for 5 y. Using reported intakes, which were lowest in Bangladeshis from 1 y on and highest in Guatemalans, predicted VA stores in Bangladeshi and Filipino children increased until ∼2–3 y, then TBS stabilized and liver VA concentrations decreased with age. When VA interventions were included, stores exceeded those predicted using DRIs by 12–18 mo. In contrast, reported intakes alone in Guatemalan and Mexican children resulted in VA stores that surpassed those calculated using DRIs. For all populations, reported intakes were sufficient to build liver concentrations >0.07 μmol/g by 3 mo.
Conclusions
Although more information is needed to better define dietary VA requirements in children, our results suggest that for an average, generally healthy child in a low- or middle-income country, current DRIs are sufficient to maintain positive VA balance during the first 5 y of life.
Keywords: dietary recommendations, mathematical modeling, nutritional assessment, vitamin A intake, vitamin A interventions, vitamin A kinetics, vitamin A requirements, vitamin A status
Introduction
In 2001, DRIs for vitamin A (VA) were established (1). As discussed by Ross and Moran (2) in this issue, the recommendations for young children were developed using limited data for infants (specifically, the average consumption of VA from breast milk) and extrapolation of data from adults, including a minimum acceptable concentration of VA in liver (0.07 μmol/g) as well as other variables related to VA utilization and storage. Although it was recognized that many factors, such as VA intake, age, kinetics, and physiological state, impact VA status (1, 3, 4) and thus needed to be considered when developing dietary recommendations, such data were not available in children.
However, in the years since the VA DRIs were developed, a substantial amount of new information has been published on VA intake, VA total body stores (TBS), and retinol kinetics in children. For example, using a deuterium oxide dilution technique, the volume of breast milk, and thus the amount of VA, consumed by infants has been determined (5, 6); TBS over a wide range (∼100–1100 μmol) has been estimated in children with various VA intakes [100–900 retinol activity equivalents (RAE)/d] using retinol isotope dilution equations (7–12) and model-based compartmental analysis (9, 12, 13); and compartmental modeling using a population-based (super-child) design has been successfully applied to quantify whole-body VA kinetics in children (9, 12, 13). In addition, numerous studies have been carried out to assess children's VA intake from breast milk, foods, and other sources, including VA supplements, micronutrient powders (MNPs), and fortified foods (for reviews, see references 14–18). Such information will be helpful when researchers or policy makers revisit the DRIs for VA.
In previous research, investigators have used mathematical approaches to study VA requirements in infants aged <6 mo (19), evaluate causes of VA deficiency in children (20), and quantify the expected change in TBS following VA intervention (21). We adapted these methods here to integrate current knowledge and hypotheses related to VA consumed in breast milk, foods, and supplements by children from birth to age 5 y and to predict changes in VA TBS and liver VA concentrations that would be expected to result from these intakes. To develop these predictions, we used information in the literature for VA intakes as well as recently published data on retinol kinetics in infants and preschool-aged children from Bangladesh (13), the Philippines (13), Guatemala (13), and Mexico (9, 12). Our results indicate that the current VA DRIs [specifically, Adequate Intake (AI) from birth to age 12 mo and RDA from 1 to 5 y] are sufficient to build and maintain VA stores during infancy and early childhood in these groups.
Methods
Overview
We adapted previously published approaches (19–21) and used mathematical modeling to predict changes in VA TBS from birth to age 5 y for children in Bangladesh, the Philippines, Guatemala, and Mexico. As detailed in the following sections, our model simulated TBS over time based on VA intake and utilization, comparing predictions using DRIs established by the Institute of Medicine (1), intakes reported in the literature, and reported intakes that included VA provided through VA intervention programs.
Descriptive data
To simulate TBS over time in young children, we used recently published VA intake and kinetic data for children in 4 countries. Specifically, we used data for groups of 1) Bangladeshi infants (mean age: 12 mo; n = 87) with an average VA intake of 1.23 μmol RAE/d and TBS of 198 μmol (13); 2) Filipino infants (mean age: 14 mo; n = 120) with a mean intake of 2.54 μmol RAE/d and VA TBS of 533 μmol (13); 3) Guatemalan children (mean age: 50 mo; n = 135) with an average VA intake of 2.67 μmol RAE/d and TBS of 1062 μmol (13); and 4) Mexican infants (mean age: 26 mo; n = 15) (9) and children (mean age: 58 mo; n = 24) (12) estimated to consume ∼1.4 μmol RAE/d with VA TBS of 844 and 1097 μmol, respectively. As detailed later, to obtain estimates of reported VA intake from birth to 5 y, we collected additional information from the literature for infants and children from these 4 countries. For comparative purposes, kinetic data were included from studies that followed a super-child modeling approach, which were only available for groups of children with adequate to high VA status (see Discussion for predictions using data for Peruvian children with low VA status).
Mathematical modeling
Here, we expanded on previously published approaches that used linear modeling techniques (19, 21) or a set of recursive equations (20) to estimate VA stores over time. Specifically, we developed a mathematical relationship to predict changes in TBS as a function of age based on VA intake and disposal (utilization) rate, in light of the fact that the VA disposal rate is a function of TBS and the system fractional catabolic rate (FCR; or the fraction of TBS utilized each day). We started with the premises that 1) in a steady state (i.e., VA balance), TBS is constant because VA input (i.e., absorbed dietary VA that mixes with stores) equals VA disposal rate; 2) when input is greater than disposal rate, the system is in positive VA balance and TBS will increase with time; and 3) when disposal rate is greater than input, the system is in negative VA balance and TBS will decrease with time. For each population, TBS were calculated daily to age 5 y assuming that TBS on day t equals TBS from the previous day minus VA utilized on that day plus VA input on day t, as shown in Equation 1:
 |
(1) |
where TBSt is TBS (μmol) on day t after birth; VA inputt is calculated as VA intaket (or μmol RAE consumed on day t) times the fraction of ingested VA that is absorbed and mixes with stores; TBSt–1 is TBS on the previous day (t – 1); and VA utilizedt–1 is μmol utilized on the previous day, where utilization (μmol) on day t was calculated as TBSt × FCRt (d−1). We assumed that TBS at birth (TBS0) was 6 μmol in all groups based on data from autopsy studies (22, 23). Population-specific estimates for VA intake and disposal/utilization rate were used as inputs in the equation, with disposal rate (μmol/d) calculated using published values for FCR extrapolated over time (discussed later); also, we assumed that 75% of ingested VA in both breast milk and foods was absorbed and mixed with stores (24).
Because liver VA concentration has been used to categories status into groups such as “deficient,” “adequate,” or “high” (23, 25), we calculated liver VA concentrations from birth to age 5 y using Equation 2:
 |
(2) |
where liver VA concentrationt (μmol/g) was calculated on each day t assuming 80% of TBS were found in the liver (26), and liver weightt (g) was estimated using body surface area (m2) in the regression equation presented by Yoshizumi et al. (27). Specifically, mean data for body weight (kg) and height (cm) from the WHO weight-for-age and length/height-for-age charts for boys and girls at the 50th percentile (28) were plotted from birth to 3 y, weighted using a fractional SD of 0.05, and fit to a 2-component exponential equation using the Simulation, Analysis and Modeling software [WinSAAM version 3.3.0 (29–31); www.winsaam.org]. Values for body weight and height were simulated on each day, extrapolated to 5 y, and used to estimate body surface area (27) as a function of age.
VA intake data
For TBS predictions based on DRIs, we used published values (1) for AI (1.40 μmol RAE/d from 0 to 6 mo and 1.75 μmol RAE/d from 7 to 12 mo) and RDA (1.05 μmol RAE/d from 1 to 3 y and 1.40 μmol RAE/d from 4 to 5 y).
For TBS predictions based on reported VA intakes, we used data for infants and children from Bangladesh (32–38), the Philippines (39–42), Guatemala (13, 43–46), and Mexico (6, 9, 12, 47). For each group, breast milk VA consumption was estimated based on the average daily consumption of breast milk (1, 48), using measured volumes of milk consumed in Bangladeshi (38) and Mexican children (6), and estimates reported for Guatemalan and Filipino children (39), as well as the VA content in breast milk at various stages of lactation (6, 32, 38, 39). Breast milk VA intake during the first 3 d of life was assumed to be the same for all groups based on mean consumption of and VA content in colostrum [(49) and VL-T, unpublished results]. Based on available data, we assumed that the contribution of VA from breast milk compared with foods was as follows: Bangladeshi children were exclusively breastfed for the first year (33), and VA intake from 1 to 5 y was assumed to be entirely from foods. Guatemalan children (39) were assumed to be exclusively breastfed to age 7 mo; from 7 to 12 mo, breast milk contributed ∼60% to the total VA intake, and it contributed 30% from 12 to 18 mo (45, 50). Then, from 18 mo to 5 y, intake was assumed to be entirely from foods, with sugar providing 1 μmol retinol/d to total dietary VA intake from 1 to 3 y (46). Filipino children were assumed to be exclusively breastfed for the first 6 mo of life (39, 42); breast milk provided 52% of total VA intake from 6 to 12 mo and 37% from 12 to 15 mo. From 15 mo to 5 y, intake was assumed to be entirely from foods (42). We assumed that Mexican children consumed only breast milk for the first 6 mo, and then from 6 mo to 5 y, intake was entirely from foods (14).
We also considered the impact on predicted TBS of additional VA typically consumed by children in the 4 countries as a result of recommended interventions, including large-dose VA supplements and MNPs. For our simulations, we assumed that Bangladeshi children received a 105 μmol dose of VA at age 10 mo, followed by 210 μmol doses every 6 mo until age 59 mo (51, 52). We assumed the Guatemalan children were given 63 μmol doses of VA at ages 12 and 20 mo plus 1.4 μmol RAE/d from MNPs every 6 mo in 60-d intervals from ages 6 to 59 mo (46). In the calculations for the Filipinos (40, 41) and Mexicans (53), a 105 μmol dose of VA was assumed to be administered at age 9 mo and then 210 μmol doses every 6 mo thereafter until age 59 mo. In addition, for the Filipinos, 1.4 μmol RAE/d from MNPs was included in 60-d intervals at ages 8, 14, and 21 mo (41). We assumed that 70% of the 105 and 63 μmol VA supplements (54), 50% of the larger 210 μmol VA supplements (55), and 75% of the VA from MNPs were absorbed and mixed with stores (24).
FCR and VA disposal rates
Values for FCR at different ages were obtained from references (9, 12, 13). Based on the rationale that FCR is inversely correlated with TBS (56, 57) and infants are born with very limited VA stores that, with adequate intake, increase with age (19, 23, 58), we hypothesized that FCR would decrease exponentially with age. Because data for FCR were not available before 1 y of age, we assumed 3%/d at birth for all groups, which, assuming TBS of 6 μmol at birth, translates to ∼1 mo worth of VA in stores on a VA-free diet (19, 59). Then, because population-specific values for FCR were desired for the calculations but data over time were not available for individual groups, we employed a technique similar to the partially parallel compartmental modeling approach used previously (13) to compensate for the limited data. Specifically, using WinSAAM, we plotted FCR as a function of age for each group independently. Then, data were weighted using a fractional SD of 0.05 and fit using an exponential function [FCR = a(–x)(age) + b]; the same value was used for a and x for each group, and the asymptote b was adjustable (see Supplemental WinSAAM Deck); during fitting for the Mexicans, infants and children were both included because we had estimates for FCR at both ages. Values for FCR for each group were simulated daily over 5 y and used to calculate VA utilization on each day as TBSt × FCRt.
Data management
Data were managed in Microsoft Excel. Graphics were created using GraphPad Prism 7.0 for Windows. Estimates for body weight, height, and FCR were simulated on each day using WinSAAM (29–31).
Results
Recommended compared with reported VA intakes
In Figure 1, reported VA intakes for infants and preschool-aged children from Bangladesh, the Philippines, Guatemala, and Mexico are plotted by age and compared with the DRIs (i.e., AI from 0 to 12 mo and RDA from 1 to 5 y); reported intakes are also presented in Supplemental Table 1. Among the groups, reported intakes in Bangladeshi children (Figure 1A) were lowest and relatively constant from 1 y on; estimates were consistently below the recommended intakes (<74% of the AI and below the RDA by 25–52% from 1 to 5 y). In Filipino infants (Figure 1B), reported intakes were less than half the AI; then, reported intakes fluctuated within 23% of the RDA from 1 to 3 y and were 70% of the RDA from 3 to 5 y. Reported intakes were highest in Guatemalan children (Figure 1C); intakes for infants were similar to the AI and 80–147% higher than the RDA in children aged 1–5 y. For Mexicans (Figure 1D), reported intakes were below the AI for infants, 28–43% higher than the RDA for children 1–3 y old, similar to the RDA for 3- and 4-y-olds, and 20% higher for children aged 4–5 y. Note that these estimates can be compared with average intakes reported in children from high-income countries of 2.1 μmol RAE/d from ages 0 to 6 mo, 2.8 μmol RAE/d from ages 6 to 12 mo, 2.2 μmol RAE/d from ages 1 to 3 y, and 2.0 μmol RAE/d from ages 3 to 5 y (15, 60, 61), which are consistently above the recommended intakes.
FIGURE 1.

DRIs and reported VA intakes as a function of age for children from 4 countries (Bangladesh, the Philippines, Guatemala, and Mexico). DRIs are AIs from 0 to 12 mo and RDAs from 1 to 5 y (1). For more details on reported intakes and groups, see Methods. AI, Adequate Intake; RAE, retinol activity equivalents; VA, vitamin A.
Simulated values for FCR
In addition to VA intakes, we needed estimates of FCR (and thus disposal rate) to predict TBS using Equation 1. Simulations for FCR decreased rapidly and then appeared to plateau by ∼3 y in all groups (Figure 2); values for Bangladeshi, Filipino, and Guatemalan children were similar, whereas those for Mexicans were consistently lower. In fact, although the reasons for these differences have not yet been determined, overall VA kinetics have been reported to be faster in Mexican children than in the other groups (9,12).
FIGURE 2.
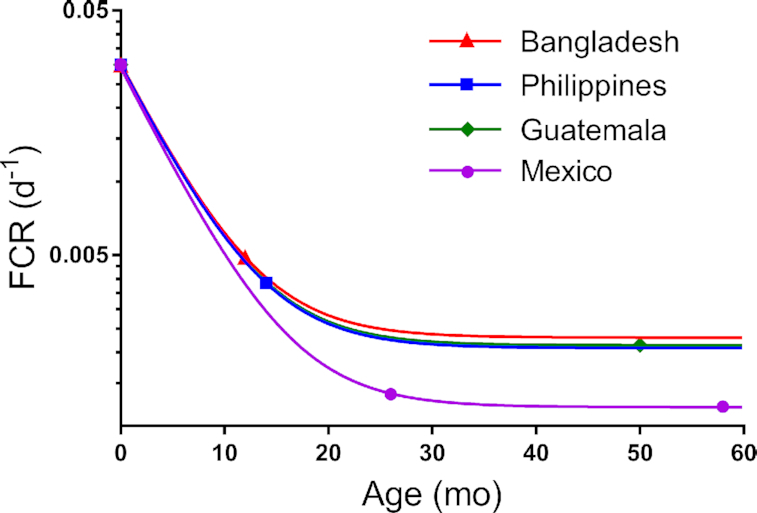
Simulated FCR for groups of Bangladeshi, Filipino, Guatemalan, and Mexican children as a function of age. Symbols are data fit to the exponential function FCR = a(–x)(age) + b, with the value for a and x set equal for all groups and the asymptote b adjustable. The value for FCR at birth was assumed to be 3%/d for all groups; values for FCR at different ages were obtained from previously published studies (9, 12, 13). FCR, fractional catabolic rate.
TBS predicted using the VA DRIs
As shown in Figure 3, when recommended VA intakes were used for the term “VA input” in Equation 1, predicted TBS increased with age. Overall, the current DRIs were sufficient to maintain positive VA balance over 5 y of age in all 4 groups. In the Bangladeshi, Filipino, and Guatemalan children (Figure 3A–C, respectively), predicted TBS increased rapidly to ∼160 μmol by age 1 y, to ∼300 μmol by age 3 y, and to ∼450 μmol by age 5 y. In comparison, predicted TBS in Mexican children (Figure 1D) increased faster, reaching 180 μmol by age 1 y, 413 μmol by age 3 y, and 683 μmol by age 5 y. Note that differences among groups in TBS predicted using the DRIs can be attributed to differences in FCR and thus disposal rates. Specifically, because simulations for FCR in the Bangladeshi, Filipino, and Guatemalan children were similar over 5 y (Figure 2), predictions of TBS were similar. However, simulated FCR for the Mexican children was consistently lower, resulting in lower disposal rates and thus a greater and more rapid accumulation of VA in stores.
FIGURE 3.

Predictions for VA TBS as a function of age using the DRIs, intakes reported in the literature, and reported intakes including VA provided through intervention programs for Bangladeshi (A), Filipino (B), Guatemalan (C), and Mexican children (D). Predictions were calculated using Equation 1. Reported intakes for each group and the DRIs are shown in Figure 1. For details on VA interventions recommended in each country, see Methods. Symbols (●) are previously published values for TBS derived using compartmental analysis of Bangladeshi and Filipino infants (13), Guatemalan children (13), and Mexican infants (9) and children (12). TBS, total body stores; VA, vitamin A.
Liver VA concentrations as a function of age calculated using Equation 2 with DRIs are shown in Figure 4. In all 4 groups, liver concentrations exceeded 0.07 μmol/g by 1 wk after birth and reached ∼0.45 μmol/g by 12 mo. Subsequently, predictions for the Bangladeshi, Filipino, and Guatemalan children (Figure 4A–C, respectively) increased to ∼0.55 μmol/g by 3 y and ∼0.70 μmol/g by 5 y, and those for Mexican children increased more rapidly, reaching 0.76 μmol/g by 3 y and 1.1 μmol/g by 5 y.
FIGURE 4.

Predictions for liver VA concentrations as a function of age using the DRIs and reported intakes, with and without VA provided through intervention programs for Bangladeshi (A), Filipino (B), Guatemalan (C), and Mexican children (D). Liver VA concentrations were calculated using predicted TBS for each group (Figure 3) in Equation 2. Symbols (●) are liver VA concentration estimated for previously studied groups of Bangladeshi and Filipino infants (13), Guatemalan children (13), and Mexican infants (9) and children (12); values were calculating using Equation 2, except that liver weight was assumed to be 3% (26) of body weight published for each group. VA, vitamin A.
TBS calculated using reported VA intakes
When reported intakes (Figure 1) were used as VA input in Equation 1, TBS predicted for the Bangladeshi children (Figure 3A) gradually increased to 160 μmol by 2 y, with a slower increase to reach 231 μmol at 5 y. In the Filipino children (Figure 3B), TBS increased to 26 μmol by 6 mo, then rapidly increased to 324 μmol by 3 y, followed by a slow increase to 344 μmol by 5 y. Predictions of TBS in both the Bangladeshi and Filipino groups appeared to stabilize by ∼2 and 3 y, respectively. For the Bangladeshi children, predictions remained below those calculated using the DRIs; similar results were observed in the Filipino children, except at ∼3 y, when TBS briefly exceeded predictions based on recommended intakes. In contrast, predicted TBS in the Guatemalan and Mexican children (Figure 3C and D, respectively) rapidly increased over 5 y, reflecting sustained positive VA balance. In Guatemalan infants, predictions during the first 12 mo were similar to those calculated using the DRIs; then, TBS rapidly exceeded those values, reaching 485 μmol by 2 y and nearly double that by 5 y (860 μmol). In Mexican children, TBS accumulated rapidly with age, following a nearly linear pattern, so that by ∼18 mo, predictions exceeded those calculated using the recommended intakes, reaching 801 μmol by 5 y.
We also estimated liver VA concentrations as a function of age for each group (Figure 4) based on TBS predicted using reported intakes. Predictions exceeded 0.07 μmol/g by ∼3 mo in the Bangladeshi children, ∼1 mo in the Filipino and Mexican children, and 10 d in the Guatemalan children. In Bangladeshi children (Figure 4A), liver concentrations increased to 0.37 μmol/g by 3 y and then after ∼45 mo slowly began to decrease to 0.36 μmol/g by 5 y. Similarly, in the Filipino children (Figure 4B), predictions increased to 0.60 μmol/g by 3 y and then declined to 0.54 μmol/g by 5 y. In Guatemalan children (Figure 4C), liver VA concentrations increased rapidly to 1.0 μmol/g by 2 y; predictions remained relatively constant until 3 y, followed by a rise until liver concentrations appeared to stabilize after ∼50 mo, reaching 1.36 μmol/g by 5 y. In Mexican children (Figure 4D), predictions increased rapidly to 1.0 μmol/g by 3 y, followed by a slower rise to 1.26 μmol/g by 5 y.
Impact of VA intervention programs on TBS
As a final step, we included VA intake attributable to intervention programs (including VA supplements and MNPs) that are currently recommended in each country (see Methods) and recalculated TBS as a function of age using Equation 1. For Bangladeshi children (Figure 3A), there was a precipitous rise in TBS following each VA supplement. After the first dose (105 μmol), the increase in TBS was sustained. However, after each later supplement (210 μmol), the increase in TBS was followed by a decline that, with age, resulted in progressively smaller absolute increases in TBS; this was due to the low and relatively constant reported dietary intake from 1 y on (Figure 1A). By 16 mo, predictions exceeded those calculated using DRIs and then, at 58 mo, the predicted value for TBS was nearly identical (∼420 μmol) to that calculated using the recommended intakes. Similar results were observed in Filipino children (Figure 3B) with respect to VA supplements. In addition, MNPs resulted in more gradual increases in TBS (Figure 3B). By 12 mo, predictions of TBS surpassed and remained above those calculated using the DRIs, reaching 615 μmol at 5 y. Note that if only MNPs were included with the reported intakes, TBS in the Filipino children reached 354 μmol by 5 y (data not shown). In Guatemalan children (Figure 3C), when the smaller doses of VA supplements (63 μmol at 12 and 20 mo) were added, subtle increases in predicted TBS were observed. In response to MNPs, TBS increased more gradually, reaching 998 μmol by 5 y. Interestingly, when only MNPs were included with the reported intakes, TBS reached a similar value (993 μmol), suggesting that only 5 μmol from the 2 doses of VA supplements was still present in stores at 5 y. In Mexican children (Figure 3D), TBS predictions increased rapidly with age, following a stepwise pattern. That is, after each VA supplement (105 or 210 μmol), TBS increased precipitously, followed by either a gradual rise or, after ∼40 mo, a plateau; TBS reached 1197 μmol by 5 y. Overall, our results in Bangladeshi and Filipino children show that at lower VA intakes, less of an increase in TBS from VA supplements was sustained, resulting in acute negative VA balance after each dose, whereas reported intakes for Mexican children were sufficient to maintain increases in TBS from continued, periodic VA supplementation. The latter would also be true for Guatemalan children, if VA supplements were consumed semiannually through 5 y of age. By 5 y, VA intervention programs increased TBS by 256 μmol in Bangladeshis, 271 μmol in Filipinos, 138 μmol in Guatemalans, and 396 μmol in Mexicans compared with the reported intakes alone.
For all 4 groups, estimated liver VA concentrations when interventions were included (Figure 4) followed similar trends to those observed for TBS. In the Bangladeshi children, the predicted liver VA concentration at 58 mo was nearly equal to the value calculated using DRIs (∼0.68 μmol/g), and at 5 y, the predicted value was 0.77 μmol/g. In the Filipino children, predictions reached 0.97 μmol/g at 5 y. In Guatemalan and Mexican children, predicted VA concentrations in the liver were 1.58 and 1.89 μmol/g by 5 y, respectively.
TBS predictions compared with published values
Included in Figure 3 are previously published values for TBS derived using compartmental modeling for the groups of Bangladeshi and Filipino infants (13), Guatemalan children (13), and Mexican infants (9) and for Mexican children (12); published values (symbols) are compared to predicted TBS at the mean age for each group. For the group of Bangladeshi infants, in whom the mean assessed VA intake was 1.23 μmol RAE/d (13), the published value for TBS was within 18% of our predictions using the DRIs and within 29% of those calculated using the reported intakes plus VA supplements (Figure 3A). For the Filipino infants, the published value for TBS was higher than our predictions (Figure 3B), presumably because VA intake assessed in that group [mean, 2.54 μmol RAE/d (13)] was much higher than intakes used in the current analysis (Figure 1B). For the group of Guatemalan children, in whom the assessed intake [mean, 2.67 μmol RAE/d (13)] was equal to the reported intake from 3 to 5 y (Figure 1C), the published value for TBS was within 9% of our predictions calculated using the reported intakes plus VA ingested as a result of intervention programs (Figure 3C). In the Mexican infants and children, in whom assessed VA intakes for both groups [mean, ∼1.4 μmol RAE/d (9, 12)] were similar to the reported intakes used in this analysis (Figure 1D), published values for TBS were within 37% and 10%, respectively, of our predictions using the reported intakes plus VA supplements (Figure 3D). Similar results were observed when we estimated liver VA concentrations for each group (Figure 4, symbols).
Discussion
Infants are born with very little VA in stores (19, 58), and sufficient dietary VA during infancy and early childhood is required for growth as well as for stores to accumulate to adequate levels (62, 63). To better understand how VA intake impacts VA stores during early life, we used mathematical modeling to predict changes in TBS from birth to 5 y of age in children from 4 low- and middle-income countries for which data on VA intake, kinetics, and status have been published (9, 12, 13). A comprehensive review of the literature provided country-specific data on VA intakes in early life (Figure 1), and data were compared to the current DRIs (1) to evaluate whether children were meeting these guidelines. Then, using an approach adapted from previous work (19–21), along with population-specific data on VA kinetics, TBS were predicted over 5 y using both recommended and reported intakes, with and without VA provided through intervention programs. Our results indicate that the VA intakes currently recommended as DRIs support VA sufficiency in these groups.
It has been suggested that healthy, well-nourished children should reach adequate VA status, defined as liver VA concentrations >0.07 μmol/g, by age 6 mo (23); during the first 6 mo of life, VA stores have been estimated to increase >10-fold to 70 μmol (64). Our TBS predictions (Figure 3), assuming the DRIs, were consistent with this estimate, ranging from 69 to 73 μmol for the groups included here. In contrast, when we used reported intakes from country-specific data to estimate TBS, predictions at 6 mo were 46 and 26 μmol in the Bangladeshi and Filipino children, respectively, and 66 and 56 μmol in the Guatemalan and Mexican groups. Our results for liver VA concentration are in agreement with those from an autopsy study of US children (23) in which liver VA concentrations >0.07 μmol/g were observed in nearly all infants by age 6 mo (Figure 4). Specifically, using the DRIs, liver VA concentrations exceeded 0.07 μmol/g by 1 wk after birth in all groups; using reported intakes, this level was exceeded by ∼3 mo in the Bangladeshi children, by ∼1 mo in the Filipino and Mexican children, and by 10 d in the Guatemalan infants due to higher VA intakes in the latter group (Figure 1C). In addition, our predictions using the DRIs agreed well with liver VA concentrations measured at 6 mo in US children at autopsy (∼0.2 μmol/g) (23). Using reported intakes, estimates for the Bangladeshi, Guatemalan, and Mexican children were comparable to that value; however, due to the lower intakes in Filipino children during the first 6 mo of life (Figure 1B), liver concentrations in this group were lower (0.082 μmol/g). Overall, in the current analysis, AI was sufficient to allow VA stores to accumulate over 6 mo of life. Moreover, adapting Equations 1 and 2 by fixing liver VA concentration and solving for VA intake, we predicted that VA intakes of ∼0.42–0.63 μmol/d were needed to reach a liver concentration of 0.07 μmol/g by age 2 mo and maintain this concentration through age 6 mo. These estimates are in agreement with the basal requirements reported previously (19, 20) and are near the lower range of VA concentrations in breast milk (0.59–2.76 μmol/L) of lactating mothers in low- and middle-income countries, which are considered sufficient to meet infant VA needs (59). It is noted that a liver VA concentration of 0.07 μmol/g is considered the minimum adequate reserve in adults (1); however, as suggested previously (23), using this criteria in infants and children may not be appropriate. Thus, future work should focus on developing evidence-based criteria for both liver VA concentration and TBS to categorize VA status in this age group.
Based on the observation that liver VA concentration increases as a function of age during early life (23), we hypothesize that to support proper body function during this period of rapid growth, children should be in positive VA balance through infancy and early childhood. In the Guatemalan and Mexican groups, the reported intakes (Figure 1) translated into VA stores that continued to increase rapidly with age (Figures 3 and 4). Similarly, published results for TBS in Mexican infants aged 1–3 y (TBS, 844 μmol) (9) and children aged 3–6 y (TBS, 1097 μmol) (12) (Figure 3D) suggest that positive balance was maintained in these children. In contrast, the reported intakes for Bangladeshi and Filipino children were only sufficient to build stores up to ∼2–3 y of age; then TBS began to stabilize (Figure 3A and B) as VA input and disposal rate converged (data not shown) and liver VA concentrations began to decrease as liver size increased. However, in all 4 groups, the DRIs were sufficient to maintain positive VA balance, allowing TBS and liver VA concentrations to increase over 5 y.
VA supplementation is one of the most widely used strategies for reducing VA deficiency (17) and has been successful in reducing child morbidity and mortality (65, 66). However, to our knowledge, studies that have quantitatively evaluated the impact of large-dose VA supplements on TBS are limited. Our results using modeling to predict TBS show that among the groups in which children receive semiannual VA supplements through age 5 y, supplementation increased TBS by ∼260 μmol in Bangladeshis and Filipinos and by ∼400 μmol in Mexicans by age 5 y. Our predictions for Bangladeshi and Filipino children are in agreement with the results of Palmer et al. (67), who reported that VA supplements improved VA status (based on plasma retinol concentrations) for up to 2–3 mo after dosing in children with low VA intakes. That is, in the Bangladeshi and Filipino children, after ∼1 y of age, VA supplements increased TBS and then predictions quickly began to fall until the next dose was given (Figure 3A and B); after ∼2–3 y, reported intakes were not sufficient to maintain increases in TBS from VA supplements. In contrast, although VA supplements are not intended to sustain improvements in VA status (17), the higher reported intakes by children in Mexico were sufficient to maintain these increases in TBS over 5 y.
In addition to VA supplementation, other intervention strategies, such as MNPs and food fortification, continue to be implemented in many groups (17). In Guatemala, where the prevalence of VA deficiency is now low and there is concern of excessive VA intakes from fortified sugar, the government recommends scaling back VA supplementation (68). Instead, MNPs are a commonly used strategy for delivering VA in Guatemala (46). Based on our predictions, this vehicle results in more gradual and sustained increases in TBS with age (133 μmol by 5 y compared with 5 μmol from the 2 doses of 63 μmol VA supplements). In Filipino children, the 3 MNP dosing periods between ages 8 and 22 mo accounted for an increase in TBS of ∼100 μmol at 2 y; however, because MNPs were not continued after 2 y, the absolute increase in TBS was only 10 μmol by 5 y. Taken together, we suggest that VA supplementation should be used with other strategies, including food fortification, MNPs, dietary diversification, and nutritional education, to improve VA intakes in a sustained manner. In addition, interventions need to better target children who are at risk for VA deficiency.
It is interesting to note that from a kinetics standpoint, it may be that VA supplements are not efficiently retained in stores due to “adaptive preservation” (57, 69). That is, in response to large VA loads, VA disposal rate increases as a protective mechanism to increase nonfunctional utilization. It is well established that VA stores increase as VA intake increases, and several studies have also observed that at yet higher intakes and liver stores, VA utilization increases (4, 56, 70, 71). In the current analysis, this was evident by the influx of VA into the system after each dose, causing a proportional increase in disposal rate, which then remained at a higher value based on the absolute increase in TBS. Moreover, using a simple 1-compartment model and a time-invariant FCR (at the value at which FCR stabilized for each group; Figure 2), we simulated the disappearance of VA supplements using WinSAAM. Predictions showed that of the VA supplement that was absorbed and mixed with stores, 66% (Bangladeshi), 68% (Filipino and Guatemalan), and 80% (Mexican children) remained in stores 6 mo after ingestion despite an increase in disposal rate; for the latter group, a greater fraction of the supplement was retained due to the lower FCR in that group (Figure 2). In contrast, studies in rats (56, 57, 72) have shown that as liver VA stores become depleted, VA disposal rate (presumably nonfunctional utilization) decreases, suggesting an adaptive mechanism to conserve VA. Because the contribution of functional compared with nonfunctional utilization to total VA disposal rate has not yet been quantified, it may be useful for investigators to consider doing VA turnover studies using compartmental analysis (73) to determine these differences. Such valuable information would lead to better understanding of the handling and storage efficiency of VA supplements as well as the adaptive responses under conditions of VA deficiency and excess.
For the current analysis, we gathered estimates of average VA intake for children in 4 specific countries (Figure 1) and, for comparative purposes, the included kinetic data were obtained from studies that used the same methodology (specifically, compartmental analysis and a super-child approach); these were only available for groups with adequate to high VA status (9, 12, 13). Thus, the conclusions reported here are specific for the inputs and assumptions used in our calculations. To expand this work over a broader range of status, we examined kinetic data from a group of Peruvian children (mean age: 18 mo) with low VA status (mean TBS: 97 μmol) (7). Using Equations 1 and 2, we fixed the liver VA concentration and solved for intake to estimate the minimum VA intake required to maintain liver stores >0.07 μmol/g over 5 y. Using the published value for FCR (2.2%/d) for the Peruvian children (7), we applied WinSAAM to simulate time-variant values for FCR using the same exponential equation provided in Methods (i.e., we used the same values for equation coefficients but the asymptote was adjustable). This analysis indicated that FCR at birth needed to be 5%/d (rather than the 3%/d used in our primary analysis). To reach liver VA concentrations of 0.07 μmol/g by 1 mo and sustain this level, VA intakes needed to be, on average, 1.0 μmol/d from 0 to 6 mo, 0.97 μmol/d from 6 to 12 mo, 1.05 μmol/d from 1 to 3 y, and 1.26 μmol/d from 3 to 5 y (287, 278, 300, and 361 μg/d for these age groups, respectively). Overall, predictions from 0 to 12 mo were lower than the AI but similar to the DRIs from 1 to 3 y.
Here, we advance previously published mathematical approaches (19–21) to predict changes in TBS in children from birth to age 5 y by including country-specific information for VA intake from breast milk, food, and intervention programs, as well as for VA kinetics. However, some limitations are worth noting. First, data on reported VA intake and FCR were obtained from cross-sectional studies and thus, to simulate longitudinal data, values for reported intake were pooled from various sources (Supplemental Table 1) to provide estimates over 5 y and computer software was used to simulate FCR as a function of age for each country (Figure 2). As mentioned previously, the conclusions presented herein are specific to the inputs and assumptions used, which were constrained by the available data; for example, published values for reported intake were obtained using different dietary assessment methods. Fortunately, for the purpose of this analysis, general estimates were sufficient. As new information becomes available, our calculations can be further developed. Finally, although it was beyond the scope of this work, investigators could use an approach similar to that of Miller et al. (20) to expand our analysis to evaluate the effect of underlying health conditions on VA stores and dietary VA requirements during early life.
In summary, understanding how VA intake influences VA stores through infancy and early childhood provides a foundation for establishing and/or re-evaluating dietary requirements for VA. Overall, by incorporating new data on VA kinetics with dietary intakes reported in the literature, with and without VA intervention programs, our results suggest that for an average, generally healthy child in a low- or middle-income country, the current DRIs are sufficient to build and maintain positive VA balance over 5 y of age. However, because various nutrient deficiencies and diseases can negatively affect VA status (e.g., by reducing VA intake, decreasing absorption, impairing VA storage, and increasing utilization) (3, 74), higher VA intakes may be advisable under such conditions, but further research is required to establish specific recommendations. In addition, more work needs to be done to determine appropriate indicators of VA status across the continuum (deficiency through excess) during early life. Specifically, it will be important to re-evaluate the appropriateness of the currently used cutoffs for liver VA concentration for this age group and to establish evidence-based cutoffs for TBS. Furthermore, additional kinetic studies should be performed in children, especially in those with low/deficient VA status; the population-based super-child approach (12, 13, 75) provides a feasible design for obtaining useful information on VA kinetics and VA status. As more information becomes available, the mathematical relationship defined in Equation 1 should provide a valuable tool for future work designed to assess dietary VA recommendations and the efficacy and safety of VA intervention strategies.
Supplementary Material
ACKNOWLEDGEMENTS
We thank Ken Brown and Janet Peerson (University of California, Davis) for sharing calculations used in their previous work. We gratefully acknowledge Joanne B Green (The Pennsylvania State University) for providing feedback on the first draft of the manuscript. The authors’ responsibilities were as follows—JLF and VL-T: developed the ideas, interpreted the results, and had primary responsibility for the final content; VL-T: collected intake data from the literature; JLF: performed mathematical modeling and wrote the paper; and both authors: read and approved the final manuscript.
Notes
The authors reported no funding received for this study.
Author disclosures: The authors report no conflicts of interest.
Supplemental WinSAAM Deck and Supplemental Table 1 are available from the “Supplementary data” link in the online posting of the article and from the same link in the online table of contents at https://academic.oup.com/cdn/.
Abbreviations used: AI, Adequate Intake; FCR, fractional catabolic rate; MNP, micronutrient powder; RAE, retinol activity equivalent; TBS, total body stores; VA, vitamin A; WinSAAM, Windows version of the Simulation, Analysis and Modeling software.
Contributor Information
Jennifer Lynn Ford, Email: jlf5271@psu.edu, Department of Nutritional Sciences, College of Health and Human Development, The Pennsylvania State University, University Park, PA, USA.
Veronica Lopez-Teros, Posgrado en Ciencias de la Salud, Universidad de Sonora, Hermosillo, Sonora, Mexico.
References
- 1. Institute of Medicine Dietary Reference Intakes for vitamin A, vitamin K, arsenic, boron, chromium, copper, iodine, iron, manganese, molybdenum, nickel, silicon, vanadium, and zinc. Washington (DC):National Academies Press;2001. [PubMed] [Google Scholar]
- 2. Ross AC, Moran NE. Our current vitamin A DRIs—now 20 years old. Curr Dev Nutr. 2020:nzaa096 Available from: https://doi.org/10.1093/cdn/nzaa096. [DOI] [PMC free article] [PubMed] [Google Scholar]
- 3. Olson JA. Recommended dietary intakes (RDI) of vitamin A in humans. Am J Clin Nutr. 1987;45:704–16. [DOI] [PubMed] [Google Scholar]
- 4. Olson JA. Serum levels of vitamin A and carotenoids as reflectors of nutritional status. J Natl Cancer Inst. 1984;73:1439–44. [PubMed] [Google Scholar]
- 5. Agne-Djigo A, Idohou-Dossou N, Kwadjode KM, Tanumihardjo SA, Wade S. High prevalence of vitamin A deficiency is detected by the modified relative dose–response test in six-month-old Senegalese breast-fed infants. J Nutr. 2012;142:1991–6. [DOI] [PubMed] [Google Scholar]
- 6. Lopez-Teros V, Limon-Miro AT, Astiazaran-Garcia H, Tanumihardjo SA, Tortoledo-Ortiz O, Valencia ME “Dose-to-mother” deuterium oxide dilution technique: an accurate strategy to measure vitamin A intake in breastfed infants. Nutrients. 2017;9:169. [DOI] [PMC free article] [PubMed] [Google Scholar]
- 7. Haskell MJ, Lembcke JL, Salazar M, Green MH, Peerson JM, Brown KH. Population-based plasma kinetics of an oral dose of [2H4]retinyl acetate among preschool-aged, Peruvian children. Am J Clin Nutr. 2003;77:681–6. [DOI] [PubMed] [Google Scholar]
- 8. Lopez-Teros V, Quihui-Cota L, Méndez-Estrada R, Grijalva-Haro MI, Esparza-Romero J, Valencia ME, Green MH, Tang G, Pacheco-Moreno BI, Tortoledo-Ortiz O et al. Vitamin A–fortified milk increases total body vitamin A stores in Mexican preschoolers. J Nutr. 2013;143:221–6. [DOI] [PubMed] [Google Scholar]
- 9. Lopez-Teros V, Ford JL, Green MH, Tang G, Grusak MA, Quihui-Cota L, Muzhingi T, Paz-Cassini M, Astiazaran-Garcia H. Use of a “super-child” approach to assess the vitamin A equivalence of Moringa oleifera leaves, develop a compartmental model for vitamin A kinetics, and estimate vitamin a total body stores in young Mexican children. J Nutr. 2017;147:2356–63. [DOI] [PubMed] [Google Scholar]
- 10. Newton S, Owusu-Agyei S, Asante KP, Amoaful E, Mahama E, Tchum SK, Ali M, Adjei K, Davis CR, Tanumihardjo SA. Vitamin A status and body pool size of infants before and after consuming fortified home-based complementary foods. Arch Public Health. 2016;74:10. [DOI] [PMC free article] [PubMed] [Google Scholar]
- 11. Van Stuijvenberg ME, Dhansay MA, Nel J, Suri D, Grahn M, Davis CR, Tanumihardjo SA. South African preschool children habitually consuming sheep liver and exposed to vitamin A supplementation and fortification have hypervitaminotic A liver stores: a cohort study. Am J Clin Nutr. 2019;110:91–101. [DOI] [PubMed] [Google Scholar]
- 12. Lopez-Teros V, Ford JL, Green MH, Monreal-Barraza B, García-Miranda L, Tanumihardjo SA, Valencia ME, Astiazaran-Garcia H. The “super-child” approach is applied to estimate retinol kinetics and vitamin A total body stores in Mexican preschoolers. J Nutr. 2020;150:1644–51. [DOI] [PubMed] [Google Scholar]
- 13. Ford JL, Green JB, Haskell MJ, Ahmad SM, Mazariegos Cordero DI, Oxley A, Engle-Stone E, Lietz G, Green MH. Use of model-based compartmental analysis and a super-child design to study whole-body retinol kinetics and vitamin A total body stores in children from 3 lower-income countries. J Nutr. 2020;150:411–8. [DOI] [PMC free article] [PubMed] [Google Scholar]
- 14. Lutter CK, Rivera JA. Nutritional status of infants and young children and characteristics of their diets. J Nutr. 2003;133:2941S–9S. [DOI] [PubMed] [Google Scholar]
- 15. Hilger J, Goerig T, Weber P, Hoeft B, Eggersdorfer M, Carvalho NC, Goldberger U, Hoffmann K. Micronutrient intake in healthy toddlers: a multinational perspective. Nutrients. 2015;7:6938–55. [DOI] [PMC free article] [PubMed] [Google Scholar]
- 16. West KP, Mehra S. Vitamin A intake and status in populations facing economic stress. J Nutr. 2010;140:201S–7S. [DOI] [PubMed] [Google Scholar]
- 17. Wirth JP, Petry N, Tanumihardjo SA, Rogers LM, McLean E, Greig A, Garrett GS, Klemm RDW, Rohner F. Vitamin A supplementation programs and country-level evidence of vitamin A deficiency. Nutrients. 2017;9:190. [DOI] [PMC free article] [PubMed] [Google Scholar]
- 18. Hombali AS, Solon JA, Venkatesh BT, Nair NS, Peña-Rosas JP. Fortification of staple foods with vitamin a for vitamin A deficiency. Cochrane Database Syst Rev. 2019;2019(5):CD010068. [DOI] [PMC free article] [PubMed] [Google Scholar]
- 19. Allen LH, Haskell M. Vitamin A requirements of infants under six months of age. Food Nutr Bull. 2001;22:214–34. [Google Scholar]
- 20. Miller M, Humphrey J, Johnson E, Marinda E, Brookmeyer R, Katz J. Why do children become vitamin A deficient?. J Nutr. 2002;132:2867S–80S. [DOI] [PubMed] [Google Scholar]
- 21. Lietz G, Haskell M, Melse-Boonstra A. Uncertainties of assessing total body vitamin A stores in community settings in low-income countries using the stable-isotope dilution methodology. Am J Clin Nutr. 2015;102:520–2. [DOI] [PMC free article] [PubMed] [Google Scholar]
- 22. Olson JA. Liver vitamin A reserves of neonates, preschool children and adults dying of various causes in Salvador, Brazil. Arch Latinoam Nutr. 1979;29:521–45. [PubMed] [Google Scholar]
- 23. Olson JA, Gunning DB, Tilton RA. Liver concentrations of vitamin A and carotenoids, as a function of age and other parameters, of American children who died of various causes. Am J Clin Nutr. 1984;39:903–10. [DOI] [PubMed] [Google Scholar]
- 24. Green MH, Green JB, Ford JL. Better predictions of vitamin A total body stores by the retinol isotope dilution method are possible with deeper understanding of compartmental modeling. J Nutr. 2020;150:989–93. [DOI] [PMC free article] [PubMed] [Google Scholar]
- 25. Tanumihardjo SA, Russell RM, Stephensen CB, Gannon BM, Craft NE, Haskell MJ, Lietz G, Schulze K, Raiten DJ. Biomarkers of nutrition for development (BOND)—vitamin A review. J Nutr. 2016;146:1816S–48S. [DOI] [PMC free article] [PubMed] [Google Scholar]
- 26. Gannon BM, Tanumihardjo SA. Comparisons among equations used for retinol isotope dilution in the assessment of total body stores and total liver reserves. J Nutr. 2015;145:847–54. [DOI] [PMC free article] [PubMed] [Google Scholar]
- 27. Yoshizumi T, Gondolesi GE, Bodian CA, Jeon H, Schwartz ME, Fishbein TM, Miller CM, Emre S. A simple new formula to assess liver weight. Transplant Proc. 2003;35:1415–20. [DOI] [PubMed] [Google Scholar]
- 28. WHO., WHO child growth standards and the identification of severe acute malnutrition in infants and children: a joint statement by the World Health Organization and the United Nations Children's Fund. Geneva (Switzerland): WHO; 2009. [PubMed] [Google Scholar]
- 29. Berman M, Weiss MF. The SAAM manual. Washington (DC): US Government Printing Office; 1978. [Google Scholar]
- 30. Wastney ME, Patterson BH, Linares OA, Greif PC, Boston RC. Investigating biological systems using modeling: strategies and software. San Diego (CA): Academic Press; 1999. [Google Scholar]
- 31. Stefanovski D, Moate PJ, Boston RC. WinSAAM: a Windows-based compartmental modeling system. Metabolism. 2003;52:1153–66. [DOI] [PubMed] [Google Scholar]
- 32. Rice AL, Stoltzfus RJ, De Francisco A, Chakraborty J, Kjolhede CL, Wahed MA. Maternal vitamin A or β-carotene supplementation in lactating Bangladeshi women: effects on mothers and infants. J Nutr. 1999;129:356–65. [DOI] [PubMed] [Google Scholar]
- 33. National Institute of Population Research and Training, Mitra and Associates, and ICF International Bangladesh Demographic and Health Survey 2014. Dhaka (Bangladesh): National Institute of Population Research Training, Mitra and Associates, and ICF International; 2016. [Google Scholar]
- 34. De Moura FF, Moursi M, Angel MD, Angeles-Agdeppa I, Atmarita A, Gironella GM, Muslimatun S, Carriquiry A. Biofortified β-carotene rice improves vitamin A intake and reduces the prevalence of inadequacy among women and young children in a simulated analysis in Bangladesh, Indonesia, and the Philippines. Am J Clin Nutr. 2016;104:769–75. [DOI] [PMC free article] [PubMed] [Google Scholar]
- 35. Rahman S, Rahman AS, Alam N, Ahmed AS, Ireen S, Chowdhury IA, Chowdhury FP, Mustafizur Rahman SM, Ahmed T. Vitamin A deficiency and determinants of vitamin A status in Bangladeshi children and women: findings of a national survey. Public Health Nutr. 2017;20:1114–25. [DOI] [PMC free article] [PubMed] [Google Scholar]
- 36. Hels O, Kidmose U, Larsen T, Hassan N, Tetens I, Thilsted SH. Estimated nutrient intakes and adequacies in Bangladesh change when newer values for vitamin A, iron and calcium in commonly consumed foods are applied. Int J Food Sci Nutr. 2003;54:457–65. [DOI] [PubMed] [Google Scholar]
- 37. Zeitlin MF, Megawangi R, Kramer EM, Armstrong HC. Mothers’ and children's intakes of vitamin A in rural Bangladesh. Am J Clin Nutr. 1992;56:136–47. [DOI] [PubMed] [Google Scholar]
- 38. Moore SE, Prentice AM, Coward WA, Wright A, Frongillo EA, Fulford AJC, Mander AP, Persson LÅ, Arifeen SE, Kabir I. Use of stable-isotope techniques to validate infant feeding practices reported by Bangladeshi women receiving breastfeeding counseling. Am J Clin Nutr. 2007;85:1075–82. [DOI] [PubMed] [Google Scholar]
- 39. DeMaeyer EM. A collaborative study on vitamins, minerals, and trace elements in breast milk. In: Berger H, editor Vitamins and minerals in pregnancy and lactation. New York: Raven Press; 1988. pp. 339–49. [Google Scholar]
- 40. Department of Health, National Center for Disease Prevention and Control The MNCHN strategy manual of operations 2011. 2nd ed. Manila (Republic of the Philippines): Department of Health, National Center for Disease Prevention and Control; 2011. [Google Scholar]
- 41. Republic of the Philippines Department of Health Micronutrient powder. [Internet]. [cited 2020 Jan 26]. Available from: https://www.doh.gov.ph/faqs/Micronutrient-Powder.
- 42. Denney L, Angeles-Agdeppa I, Capanzana MV, Toledo MB, Donohue J, Carriquiry A. Nutrient intakes and food sources of Filipino infants, toddlers and young children are inadequate: findings from the National Nutrition Survey 2013. Nutrients. 2018;10:1730. [DOI] [PMC free article] [PubMed] [Google Scholar]
- 43. Krause VM, Delisle H, Solomons NW. Fortified foods contribute one half of recommended vitamin A intake in poor urban Guatemalan toddlers. J Nutr. 1998;128:860–4. [DOI] [PubMed] [Google Scholar]
- 44. Gamero H, Arita M, Bulux J, Solomons NW. Patrón dietético e ingesta de nutrientes de niños pre-escolares de tres aldeas rurales del departamento de Santa Rosa, Guatemala. Arch Latinoam Nutr. 1996;46:22–6. [PubMed] [Google Scholar]
- 45. Whang C, Bermúdez O, Chomat AM, Solomons NW. Vitamin A concentrations in breast milk from rural Mam-Mayan women in the Western Highlands of Guatemala. Bull Res Abstr. 2012;23:6–7. [Google Scholar]
- 46. Mazariegos M, Martínez C, Mazariegos DI, Méndez H, Román AV, Palmieri M, Tomás V. Análisis de la situación y tendencias de los micronutrientes clave en Guatemala, con un llamado a la acción desde las políticas públicas. Washington (DC): FHI 360/FANTA; 2016. [Google Scholar]
- 47. Villalpando S, de la Cruz V, Shamah-Levy T, Rebollar R, Contreras-Manzano A. Nutritional status of iron, vitamin B12, folate, retinol and anemia in children to 11 years old: results of the Ensanut 2012. Salud Publica Mex. 2015;57:372–84. [DOI] [PubMed] [Google Scholar]
- 48. WHO Infant and young child feeding: Model chapter for textbooks for medical students and allied health professionals. Geneva (Switzerland): WHO; 2009. [PubMed] [Google Scholar]
- 49. Neville MC, Keller R, Seacat J, Lutes V, Neifert M, Casey C, Allen J, Archer P. Studies in human lactation: milk volumes in lactating women during the onset of lactation and full lactation. Am J Clin Nutr. 1988;48:1375–86. [DOI] [PubMed] [Google Scholar]
- 50. Vossenaar M, Hernández L, Campos R, Solomons NW. Several “problem nutrients” are identified in complementary feeding of Guatemalan infants with continued breastfeeding using the concept of “critical nutrient density.”. Eur J Clin Nutr. 2013;67:108–14. [DOI] [PubMed] [Google Scholar]
- 51. Raghavan R, Aaron GJ, Nahar B, Knowles J, Neufeld LM, Rahman S, Mondal P, Ahmed T. Household coverage of vitamin A fortification of edible oil in Bangladesh. PLoS One. 2019;14:e0212257. [DOI] [PMC free article] [PubMed] [Google Scholar]
- 52. Ahmed T, Mahfuz M, Ireen S, Shamsir Ahmed AM, Rahman S, Munirul Islam M, Alam N, Iqbal Hossain M, Mustafizur Rahman SM, Mohsin Ali M et al. Nutrition of children and women in Bangladesh: trends and directions for the future. J Health Popul Nutr. 2012;30:1–11. [DOI] [PMC free article] [PubMed] [Google Scholar]
- 53. Secretaría de Salud Lineamientos para la Suplementación con Hierro y Vitamina A en Recién Nacidos, Niños y Adolescentes. Mexico: Secretaría de Salud; 2009. [Google Scholar]
- 54. Reddy V, Raghuramulu N, Arunjyoti, Shivaprakash M, Underwood B. Absorption of vitamin A by children with diarrhoea during treatment with oral rehydration salt solution. Bull World Health Organ. 1986;64:721–4. [PMC free article] [PubMed] [Google Scholar]
- 55. Kusin JA, Reddy V, Sivakumar B. Vitamin E supplements and the absorption of a massive dose of vitamin A. Am J Clin Nutr. 1974;27:774–6. [DOI] [PubMed] [Google Scholar]
- 56. Green MH, Green JB, Lewis KC. Variation in retinol utilization rate with vitamin A status in the rat. J Nutr. 1987;117:694–703. [DOI] [PubMed] [Google Scholar]
- 57. Green MH, Green JB. Vitamin A intake and status influence retinol balance, utilization and dynamics in rats. J Nutr. 1994;124:2477–85. [DOI] [PubMed] [Google Scholar]
- 58. Wallingford JC, Underwood BA. Vitamin A deficiency in pregnancy, lactation, and the nursing child. In: Bauernfeind JC, editor Vitamin A deficiency and its control. New York: Academic Press; 1986. pp. 101–52. [Google Scholar]
- 59. Newman V. Vitamin A and breast-feeding: a comparison of data from developed and developing countries. Food Nutr Bull. 1994;15:1–16. [Google Scholar]
- 60. Bailey RL, Catellier DJ, Jun S, Dwyer JT, Jacquier EF, Anater AS, Eldridge AL. Total usual nutrient intakes of US children (under 48 months): findings from the Feeding Infants and Toddlers Study (FITS) 2016. J Nutr. 2018;148:1557S–66S. [DOI] [PMC free article] [PubMed] [Google Scholar]
- 61. US Department of Agriculture, Agricultural Research Service Nutrient intakes from food and beverages: mean amounts consumed per individual, by gender and age. In: What we eat in America, NHANES 2015–2016. Washington (DC): US Department of Agriculture; 2018. [Google Scholar]
- 62. Underwood BA. The role of vitamin A in child growth, development and survival. Adv Exp Med Biol. 1994;352:201–8. [DOI] [PubMed] [Google Scholar]
- 63. Underwood BA. Maternal vitamin A status and its importance in infancy and early childhood. Am J Clin Nutr. 1994;59:517S–24S. [DOI] [PubMed] [Google Scholar]
- 64. Humphrey JH, Rice AL. Vitamin A supplementation of young infants. Lancet. 2000;356:422–4. [DOI] [PubMed] [Google Scholar]
- 65. Beaton GH, Martorell R, Aronson KA, Edmonston B, McCabe G, Ross AC, Harvey B. Vitamin A supplementation and child morbidity and mortality in developing countries. Food Nutr Bull. 1994;15:1. [Google Scholar]
- 66. Imdad A, Herzer K, Mayo-Wilson E, Yakoob M, Bhutta Z. Vitamin A supplementation for preventing morbidity and mortality in children from six months to five years of age. Cochrane Database Syst Rev. 2017;2017:(3):CD008524. [DOI] [PMC free article] [PubMed] [Google Scholar]
- 67. Palmer AC, West KP Jr, Dalmiya N, Schultink W. The use and interpretation of serum retinol distributions in evaluating the public health impact of vitamin A programmes. Public Health Nutr. 2012;15:1201–15. [DOI] [PubMed] [Google Scholar]
- 68. Tanumihardjo SA, Mokhtar N, Haskell MJ, Brown KH. Assessing the safety of vitamin A delivered through large-scale intervention programs: workshop report on setting the research agenda. Food Nutr Bull. 2016;37:S63–74. [DOI] [PubMed] [Google Scholar]
- 69. Haskell MJ, Jamil KM, Peerson JM, Wahed MA, Brown KH. The paired deuterated retinol dilution technique can be used to estimate the daily vitamin A intake required to maintain a targeted whole body vitamin A pool size in men. J Nutr. 2011;141:428–32. [DOI] [PubMed] [Google Scholar]
- 70. Varma RN, Beaton GH. Quantitative aspects of the urinary and fecal excretion of radioactive metabolites of vitamin A in the rat. Can J Physiol Pharmacol. 1972;50:1026–37. [DOI] [PubMed] [Google Scholar]
- 71. Hicks VA, Gunning DB, Olson JA. Metabolism, plasma transport and biliary excretion of radioactive vitamin A and its metabolites as a function of liver reserves of vitamin A in the rat. J Nutr. 1984;114:1327–33. [DOI] [PubMed] [Google Scholar]
- 72. Lewis KC, Green MH, Underwood BA. Vitamin A turnover in rats as influenced by vitamin A status. J Nutr. 1981;111:1135–44. [DOI] [PubMed] [Google Scholar]
- 73. Cifelli CJ, Green JB, Green MH. Use of model-based compartmental analysis to study vitamin A kinetics and metabolism. Vitam Horm. 2007;75:161–95. [DOI] [PubMed] [Google Scholar]
- 74. Stephensen CB. Vitamin A, infection, and immune function. Annu Rev Nutr. 2001;21:167–92. [DOI] [PubMed] [Google Scholar]
- 75. Ford JL, Green JB, Green MH. A population-based (super-child) approach for predicting vitamin A total body stores and retinol kinetics in children is validated by the application of model-based compartmental analysis to theoretical data. Curr Dev Nutr. 2018;2:nzy071. [DOI] [PMC free article] [PubMed] [Google Scholar]
Associated Data
This section collects any data citations, data availability statements, or supplementary materials included in this article.