Summary
Cladribine (CdA), an oral prodrug approved for the treatment of relapsing multiple sclerosis, selectively depletes lymphocytes. CdA passes the blood–brain barrier, suggesting a potential effect on central nervous system (CNS) resident cells. We examined if CdA modifies the phenotype and function of naive and activated primary mouse microglia, when applied in the concentrations 0·1–1 μM that putatively overlap human cerebrospinal fluid (CSF) concentrations. Primary microglia cultures without stimulation or in the presence of proinflammatory lipopolysaccharide (LPS) or anti‐inflammatory interleukin (IL)‐4 were treated with different concentrations of CdA for 24 h. Viability was assessed by MTT [3‐(4,5‐dimethylthiazol‐2‐yl)‐2,5‐diphenyltetrazolium bromide] assay. Phagocytotic ability and morphology were examined by flow cytometry and random migration using IncuCyte Zoom and TrackMate. Change in gene expression was examined by quantitative polymerase chain reaction (qPCR) and protein secretion by Meso Scale Discovery. We found that LPS and IL‐4 up‐regulated deoxycytidine kinase (DCK) expression. Only activated microglia were affected by CdA, and this was unrelated to viability. CdA 0·1–1 μM significantly reduced granularity, phagocytotic ability and random migration of activated microglia. CdA 10 μM increased the IL‐4‐induced gene expression of arginase 1 (Arg1) and LPS‐induced expression of IL‐1β, tumor necrosis factor (TNF), inducible nitric oxide synthase (iNOS) and Arg1, but protein secretion remained unaffected. CdA 10 μM potentiated the increased expression of anti‐inflammatory TNF receptor 2 (TNF‐R2) but not TNF‐R1 induced by LPS. This suggests that microglia acquire a less activated phenotype when treated with 0·1–1 μM CdA that putatively overlaps human CSF concentrations. This may be related to the up‐regulated gene expression of DCK upon activation, and suggests a potential alternative mechanism of CdA with direct effect on CNS resident cells.
Keywords: cladribine, deoxycytidine kinase, microglia, migration, multiple sclerosis, phagocytosis, viability
Oral cladribine approved for the treatment of relapsing multiple sclerosis is a synthetic deoxyadenosine analogue that selectively depletes lymphocytes, but also crosses the blood brain barrier. We examined, if cladribine modifies the phenotype and function of naïve and activated primary mouse microglia, when applied in the concentrations that putatively overlaps human CSF concentrations. We found that microglia acquire a less activated phenotype when co‐treated with cladribine in such concentrations in vitro, suggesting a potential alternative mechanism with direct effect on CNS resident cells.
Introduction
Cladribine (CdA), also known as 2‐chlorodeoxyadenosine, is a synthetic deoxyadenosine analogue that selectively depletes lymphocytes [1, 2, 3]. CdA is a prodrug, and accumulation of the active drug ‘CdA triphosphate’ depends upon the ratio of deoxycytidine kinase (DCK), that catalyzes the first of three phosphorylation steps, and 5′‐nucleotidases (5′‐NTases), that convert phosphorylated cladribine to cladribine nucleoside, as CdA cannot be degraded by adenosine deaminase (ADA). This resistance to ADA‐mediated degradation results in apoptosis in cells with a high DCK to 5′‐NTase ratio such as lymphocytes, due to accumulation of CdA triphosphate. In dividing lymphocytes, CdA triphosphate affects DNA synthesis and repair by inhibition of ribonucleotide reductase and the formation of deoxynucleotides. Furthermore, CdA triphosphate competes with deoxyadenosine triphosphate for incorporation into DNA by DNA polymerases. In resting cells, CdA triphosphate induces DNA strand breaks, which leads to the activation of poly (ADP‐ribose) polymerase and depletion of nicotinamide adenine dinucleotide and adenosine triphosphate from the cells [2, 3].
Cladribine tablets have been approved for the treatment of relapsing multiple sclerosis (MS), based in part on a placebo‐controlled, double‐blind, multicenter Phase III trial [CLAdRIbine Tablets treating MS orally (CLARITY)]. In this trial, 3·5 mg/kg oral CdA reduced the annual relapse rate by approximately 57% [4], and the relative reduction in the risk of 3‐month sustained progression of disability was 33% compared to placebo. The mean number of active T2 lesions on magnetic resonance imaging (MRI) was reduced by 73·4% [4]. The extension of the Phase III trial showed a durable effect on MRI and clinical outcomes [5, 6].
The dose of 3·5 mg/kg CdA applied orally in short treatment cycles causes a short‐term lymphocyte depletion followed by immune reconstitution [7]. However, CdA passes the blood–brain barrier (BBB), and gives rise to 25% of the plasma concentration in the cerebrospinal fluid (CSF) resulting in a maximum CSF concentration of 0·019–0·025 μM [2, 3], and this may suggest a potential effect on central nervous system (CNS) resident cells.
Microglia comprise 10–15% of all glial cells in the CNS [8]. Proinflammatory microglia secrete proinflammatory cytokines, chemokines, and reactive oxygen and nitrogen species, which are toxic for oligodendrocytes and neurons [9, 10]. Lipopolysaccharides (LPS) induce a proinflammatory phenotype of microglia characterized by the expression of interleukin (IL)‐1β, IL‐6, major histocompatibility complex II (MHC II), tumor necrosis factor (TNF) and inducible nitric oxide synthase (iNOS) [11, 12]. Microglia also exert neuroprotective and repairing functions, and can produce neurotrophic factors and anti‐inflammatory cytokines [11, 13, 14]. The anti‐inflammatory cytokine IL‐4 induces the anti‐inflammatory phenotype characterized by arginase 1 (Arg1) and IL‐10 expression, among others [11, 12, 15].
Data concerning the effect of CdA on microglia are scarce [16]. When investigating the effect of the drug in murine cells, higher CdA concentrations are required as the activity of DCK is 10 times lower in mice than in humans [17, 18]. Here, we examined the effect of CdA on the phenotype and function of naive and activated mouse microglia in concentrations that putatively overlap with the levels in the human CSF.
Materials and methods
Animals
C57BL/6 mice were obtained from Taconic Ltd (Ry, Denmark). Mice were bred at the Biomedical Laboratory, University of Southern Denmark, according to protocols and guidelines approved by the Danish Animal Experiments Inspectorate (approval no. 2014‐15‐00369). Animal experiments complied with the European Union (EU) Directive 2010/63/EU for animal experiments.
Microglia cell culture
Mixed primary glial cell cultures were prepared by enzymatic dissociation of postnatal P0–P5 mouse brains using the neural tissue dissociation kit (P) (Miltenyi Biotec, Odense, Denmark; 130‐092‐628). The cells were allowed to proliferate for 10 days prior to isolation of microglia by the ‘shake off’ method [19]. The isolated microglia were, on average, 95% pure, when characterized as CD11b+/CD45low on the flow cytometer (BDTM LSR II; BD Biosciences, San Jose, CA, USA).
In‐vitro stimulation of microglia
CdA powder was provided by Merck. CdA was dissolved in dimethylsulfoxide (DMSO) (Sigma‐Aldrich, St Louis, MO, USA; D2438). Microglia were treated with 0·2% DMSO, LPS (10 ng/ml) (Sigma‐Aldrich; L2630), DMSO and LPS, one of four concentrations of CdA (0·01 μM, 0·1 μM, 1 μM and 10 μM) alone or in combination with LPS for 24 hours. For migration, the cells were stimulated immediately before placement in the IncuCyte. Microglia were stimulated with IL‐4 (20 ng/ml) or LPS (10 ng/ml) alone or together with CdA for 24 h for quantitative polymerase chain reaction (qPCR) and Meso Scale.
MTT [3‐(4,5‐dimethylthiazol‐2‐yl)‐2,5‐diphenyltetrazolium bromide] viability assay
MTT solution (0·5 mg/ml) (Sigma‐Aldrich; M0283) was added to LPS‐ and CdA‐pretreated microglia for 4 h. The absorbance was measured by a microplate reader (Molecular Devices, San Jose, CA, USA; 6465).
Phagocytosis assay, size and granularity
Microglia were incubated with fluorescent latex beads and analyzed by flow cytometry, as described previously [20]. Fluorescent latex beads (Polysciences, Inc., Warrington, PA, USA; 17154‐10) were added to LPS‐ and CdA‐treated microglia for 40 min at 37°C (sample) and 4°C (control). Cytochalasin D (5 μg/ml) was applied prior to addition of the beads as negative control. Phagocytosis was stopped by placing the cells on ice. Cells were detached using 0·2% Trypsin‐ethylenediamine tetraacetic acid (EDTA) and analyzed by flow cytometry and BD FACSDiva version 8.0.1 software. Microglia size and granularity were assessed by flow cytometry and BD FACSDiva version 8.0.1 software by measuring forward‐ (FSC) and side‐scatter (SSC), respectively.
Random migration assay
Microglia were seeded at a density of 12 000 cells/well in a poly‐D‐lysine (PDL)‐coated 96‐well ImageLock plate (Essen Bioscience, Ann Arbor, MI, USA; 4379) and stained with CellTracker Red CMTPX fluorescent probe (4·5 μM) (Life Technologies, Carlsbad, CA, USA). DMSO (0·2%), LPS (10 ng/ml) and CdA in different concentrations alone (0·1–10 μM) or together with LPS were added, and cells were placed in the IncuCyte Zoom live cell imaging system (Essen BioScience). Pictures were taken every 20 min for 24 h. Single‐cell motility was quantified using the Fiji plugin TrackMate for semi‐automated particle tracking [21]. To detect individual cells in TrackMate, the Laplacian of Gaussian (LoG) detector with estimated spot diameter of 24·12 μm and a threshold of 0·3 was used. The simple linear assignment problem (LAP) tracker with a linking maximum distance of 60 μm, a gap‐closing maximum distance of 15 μm and a gap‐closing maximum distance of 2 was used to track cell migration through the time–course films. The number of spots in track was set to 71·09 to exclude cells, which were not detectable throughout the films from the analysis.
RNA extraction and quantitative PCR
RNA was extracted using RNeasy micro kit (Qiagen, Copenhagen, Denmark) and reverse‐transcribed using a high‐capacity cDNA reverse transcription kit (Applied Biosystems, Foster city, CA, USA; 4374966). qPCR was performed on the Bio‐Rad CFX ConnectTM real‐time system (Software Bio‐Rad CFX Manager version 3.1) using SYBR green chemistry (Thermo Fisher Scientific, Fremont, CA, USA) and corresponding primers (Supporting information, Table S1). The expression levels are reported relative to the geometric mean of glyceraldehyde‐3‐phosphate dehydrogenase (GAPDH) and hypoxanthine phosphoribosyltransferase 1 (HPRT1).
Meso Scale Discovery (MSD) multiplex analysis
Cytokine levels in the microglia cell culture media were measured with the Meso Scale Discovery (MSD, Kenilworth, NJ, USA) proinflammatory mouse V‐Plex Plus kit [21].
Statistics
The statistical analyses were performed in Prism version 6.01 (GraphPad, San Diego, CA, USA) using one‐way analysis of variance (ANOVA) followed by Sidak’s or Dunnett’s multiple comparisons tests or by unpaired t‐test with Welch’s correction. Outliers were removed using the robust regression and outlier removal (ROUT) method (Q = 1%). Differences among means with P < 0·05 were accepted as statistically significant, while differences among means with 0·05 < P < 0·10 were accepted as representing tendencies of difference.
Results
Cladribine (0·01–10 μM) does not influence the viability of naive or LPS‐stimulated microglia
Microglia were treated with DMSO, LPS, DMSO and LPS and different concentrations of CdA and CdA together with LPS for 24 h before incubation with MTT. DMSO, LPS and their combination did not affect the viability of microglia compared to control (Fig. 1). CdA in the applied concentration range (0·01–10 μM) did not affect the viability of naive and LPS‐stimulated microglia compared to DMSO control (Fig. 1).
Fig. 1.

The effect of cladribine on the viability of naive and lipopolysaccharide (LPS)‐stimulated microglia. Microglia were treated with dimethylsulfoxide (DMSO) (0·2%), LPS (10 ng/ml), DMSO and LPS, different concentrations of cladribine (CdA) (0·01 μM, 0·1 μM, 1 μM and 10 μM) and different concentrations of CdA together with LPS for 24 h, followed by an MTT [3‐(4,5‐dimethylthiazol‐2‐yl)‐2,5‐diphenyltetrazolium bromide] assay. The results [mean ± standard deviation (s.d.)] are shown relative to DMSO control. n = 4–5 in each group, one‐way analysis of variance (ANOVA) followed by multiple comparison tests.
Cladribine (0·1 μM) decreases the granularity of LPS‐stimulated microglia
The size and granularity of naive and LPS‐stimulated microglia treated with CdA were investigated by flow cytometry (Fig. 2). LPS stimulation increased the SSC mean fluorescence intensity (MFI) indicating increased cellular granularity (Fig. 2a,b). We observed a trend towards reduced granularity of LPS‐stimulated microglia treated with 0·1 μM CdA (P = 0·07), while CdA did not influence the granularity of naive microglia (Fig. 2a,b). No apparent difference in cell size reflected by FSC MFI was observed (Fig. 2a,c).
Fig. 2.
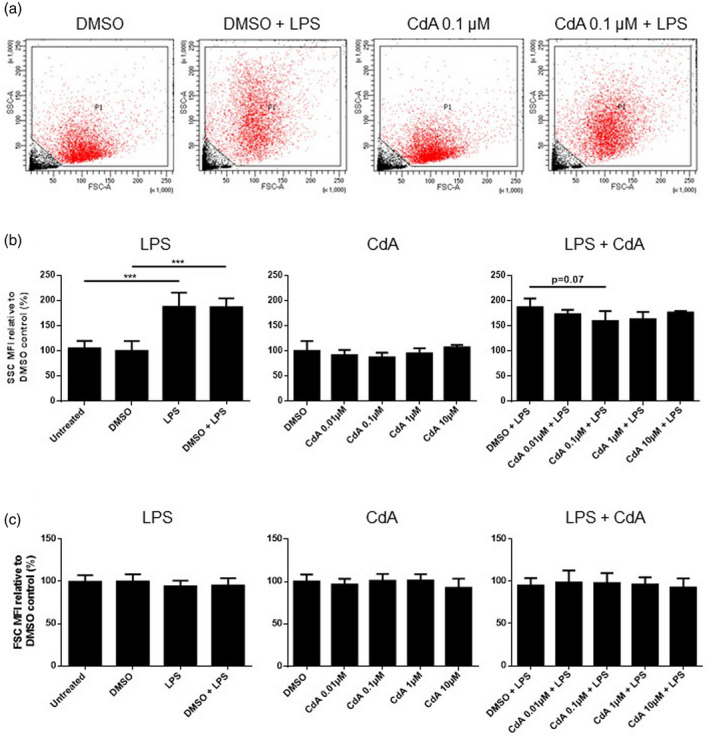
The effect of cladribine on microglia granularity and size. Microglia were treated with dimethylsulfoxide (DMSO) (0·2%), lipopolysaccharide (LPS) (10 ng/ml), DMSO and LPS, different concentrations of cladribine (CdA) (0·01 μM, 0·1 μM, 1 μM and 10 μM), and different concentrations of CdA together with LPS for 24 h. (a) A representative example of size [forward‐scatter (FSC)] and granularity [side‐scatter (SSC)] of microglia by flow cytometry. (b) The effect of CdA on the granularity (SSC) of naive and LPS‐stimulated microglia relative to DMSO control. (c) The effect of CdA on the size (FSC) of naive and LPS‐stimulated microglia relative to DMSO control. ***P ≤ 0·001, n = 3–4 in each group, one‐way analysis of variance (ANOVA) followed by multiple comparison tests, mean ± standard deviation (s.d.).
Cladribine (0·1–1 μM) decreases the phagocytotic ability of LPS‐stimulated microglia
To investigate the effect of CdA on phagocytosis by naive and LPS‐stimulated microglia, the cells were incubated with fluorescent latex beads and analyzed by flow cytometry. LPS stimulation significantly increased phagocytosis compared to control, while treatment with cytochalasin D, an inhibitor of actin polymerization, reduced phagocytosis (Fig. 3a). CdA in the range of 0·1–1 μM significantly decreased phagocytosis by LPS‐stimulated microglia, while treatment with CdA (0·01–10 μM) did not affect phagocytosis by naive microglia compared to DMSO control (Fig. 3a).
Fig. 3.
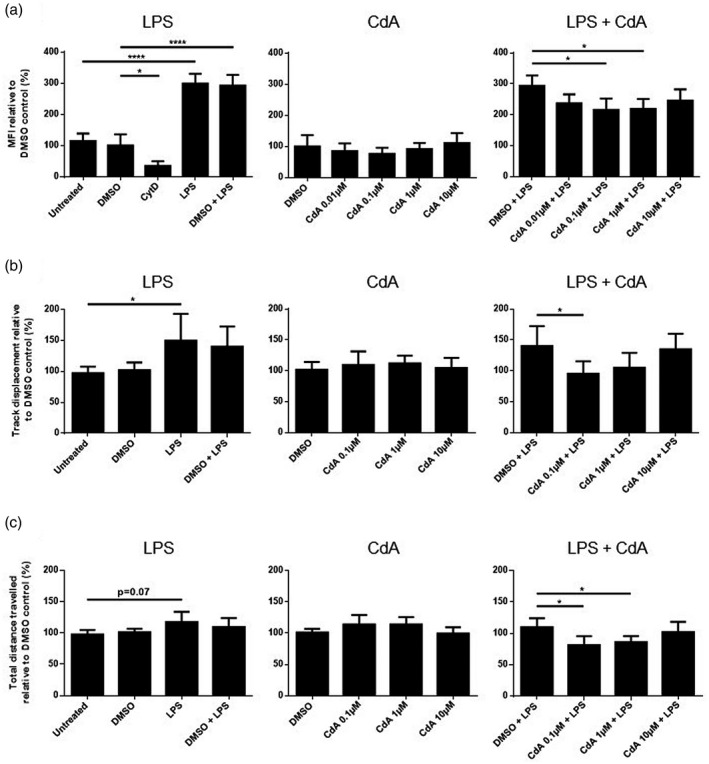
The effect of cladribine on the phagocytotic ability and random migration of microglia. (a) Phagocytosis was quantified after microglia were treated with dimethylsulfoxide (DMSO) (0·2%), lipopolysaccharide (LPS) (10 ng/ml), DMSO and LPS, different concentrations of cladribine (CdA) (0·01 μM, 0·1 μM, 1 μM and 10 μM), and different concentrations of CdA together with LPS for 24 h. Fluorescent latex beads were added to the cell media for 40 min. As negative control, microglia were treated with cytochalasin D (5 μg/ml) for 30 min before addition of latex beads. The cells were analyzed by flow cytometry, and the phagocytotic ability was quantified by mean fluorescent intensity (MFI) and presented relative to DMSO control. (b) Track displacement was quantified by analysis of timelapse videos using TrackMate after microglia were treated with DMSO (0·2%), LPS (10 ng/ml), DMSO and LPS, different concentrations of CdA (0·1 μM, 1 μM and 10 μM) and different concentrations of CdA together with LPS for 24 h. The results are shown relative to DMSO control. (c) Total distance travelled was quantified by analysis of timelapse videos using TrackMate after microglia were treated with DMSO (0·2%), LPS (10 ng/ml), DMSO and LPS, different concentrations of CdA (0·1 μM, 1 μM and 10 μM) and different concentrations of CdA together with LPS for 24 h. The results are shown relative to DMSO control. *P ≤ 0·05, ****P ≤ 0·0001, n = 3–5 in each group, one‐way analysis of variance (ANOVA) followed by multiple comparison tests, mean ± standard deviation (s.d.).
Cladribine (0·1–1 μM) decreases the motility of LPS‐stimulated microglia
Microglia motility after CdA treatment was measured by random migration: track displacement refers to the bee‐line distance the cells migrate in 24 h, while the total distance traveled is the actual distance covered by the cells. Microglia were stained with cell tracker and treated with DMSO, LPS, DMSO and LPS, different concentrations of CdA or CdA together with LPS. Films were recorded, and the track displacement and total distance traveled by the microglia were determined.
The microglia track displacement was significantly increased by LPS stimulation compared to untreated control (Fig. 3b). Treatment with CdA 0·1 μM significantly decreased the track displacement of LPS‐stimulated microglia, whereas CdA (0·1–10 μM) did not alter the track displacement of naive microglia compared to DMSO control (Fig. 3b).
The total distance travelled by microglia was not significantly increased by LPS stimulation, although a trend was observed (P = 0·07) (Fig. 3c). CdA in the range of 0.1‐1 µM significantly decreased the total distance travelled by LPS‐stimulated microglia (Fig. 3c). CdA 0·1–10 μM did not have an effect on the total distance traveled by naive microglia compared to DMSO control (Fig. 3c).
Cladribine (10 μM) alters expression but not secretion of pro‐ and anti‐inflammatory molecules by activated microglia
Next, we investigated the effect of CdA on the relative mRNA expression and protein secretion of selected pro‐ and anti‐inflammatory markers after stimulation with LPS or IL‐4 for 24 h. The expression of IL‐1β, TNF, IL‐10, TNF‐receptors, iNOS and Arg1 were examined by qPCR. The secretion of IL‐1β, TNF and IL‐10 were investigated by Meso Scale Discovery.
LPS stimulation resulted in an increased mRNA expression of IL‐1β, TNF and IL‐10 compared to control (Fig. 4a). Treatment with CdA 10 μM further increased the mRNA expression of IL‐1β and TNF in LPS‐stimulated cells (Fig. 4a). CdA (0.01‐10µM) did not affect the expression of these cytokines in naive microglia (data not shown).
Fig. 4.
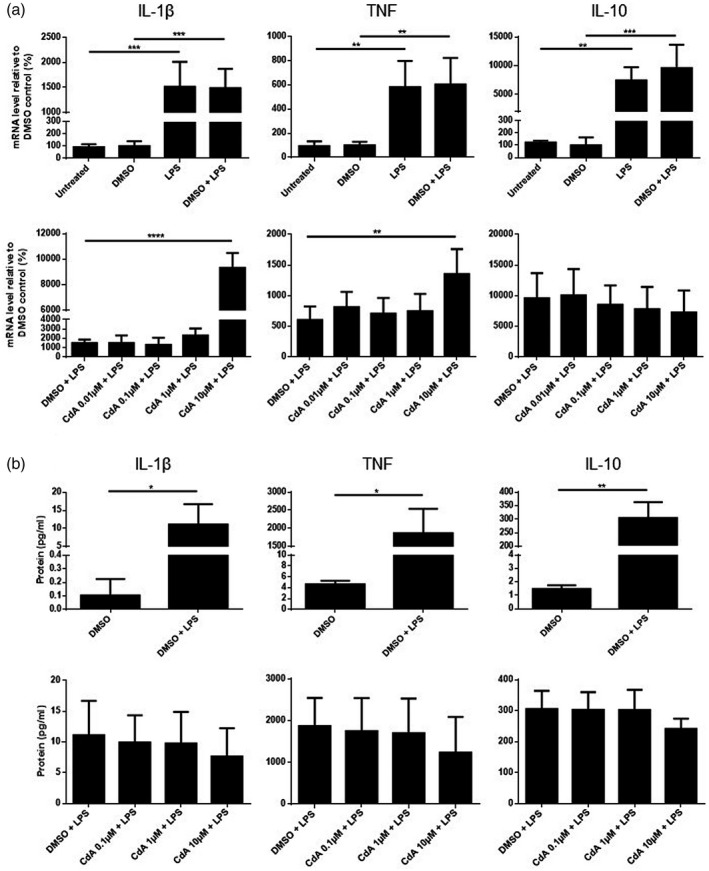
The effect of cladribine on the mRNA expression and protein secretion of cytokines by lipopolysaccharide (LPS)‐stimulated microglia. (a) mRNA expression of interleukin (IL)‐1β, tumor necrosis factor (TNF) and IL‐10 was quantified by quantitative polymerase chain reaction (qPCR) after microglia were treated with dimethylsulfoxide (DMSO) (0·2%), LPS (10 ng/ml), DMSO and LPS and different concentrations of cladribine (CdA) (0·01 μM, 0·1 μM, 1 μM and 10 μM) together with LPS for 24 h. The expression is shown relative to DMSO control. (b) The protein concentration of IL‐1β, TNF and IL‐10 in the microglia cell culture supernatant was quantified by Meso Scale. The microglia were treated with DMSO (0·2%), DMSO and LPS, and different concentrations of CdA (0·1 μM, 1 μM and 10 μM) together with LPS for 24 h. *P ≤ 0·05, **P ≤ 0·01, ***P ≤ 0·001, ****P ≤ 0·0001, n = 4 in each group, unpaired t‐test with Welch’s correction and one‐way analysis of variance (ANOVA) followed by Dunnett’s multiple comparison test, mean ± standard deviation (s.d.).
The protein secretion of IL‐1β, TNF and IL‐10 was increased by LPS stimulation (Fig. 4b). In contrast, CdA (0·1–10 μM) did not affect the secretion of IL‐1β, TNF and IL‐10 from LPS‐stimulated (Fig. 4b) or naive microglia.
LPS stimulation increased the mRNA expression (data not shown) of both TNF‐R1 and TNF‐R2 compared to control. CdA 10 μM further increased the expression of TNF‐R2 but not TNF‐R1 (Fig. 5). CdA (0·01–10 μM) did not affect the expression of TNF receptors in naive microglia (data not shown).
Fig. 5.
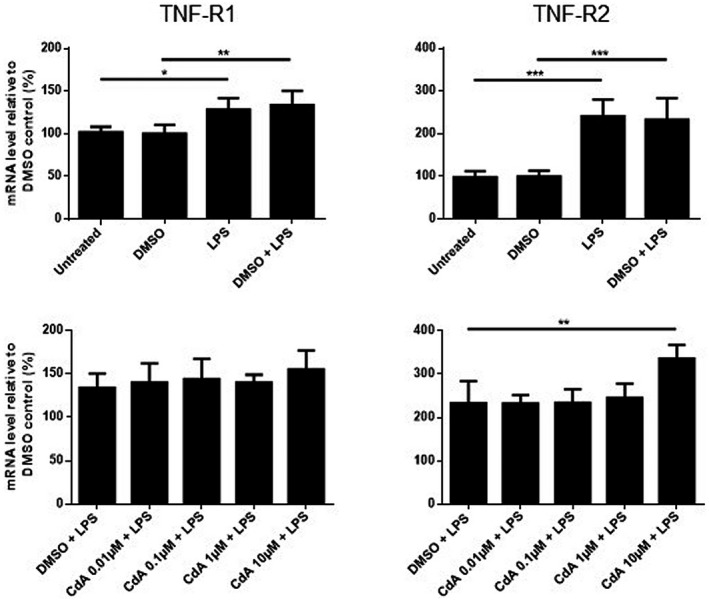
The effect of cladribine on the mRNA expression of tumor necrosis factor receptors (TNF‐R) in lipopolysaccharide (LPS)‐stimulated microglia. mRNA expression of TNF‐R1 and TNF‐R2 was quantified by quantitative polymerase chain reaction (qPCR) after microglia were treated with dimethylsulfoxide (DMSO) (0·2%), LPS (10 ng/ml), DMSO and LPS, and different concentrations of cladribine (CdA) (0·01 μM, 0·1 μM, 1 μM and 10 μM) together with LPS for 24 h. The expression is shown relative to DMSO control. *P ≤ 0·05, **P ≤ 0·01, ***P ≤ 0·001, n = 4 in each group, one‐way analysis of variance (ANOVA) followed by multiple comparison tests, mean ± standard deviation (s.d.).
LPS stimulation resulted in a significantly increased expression of iNOS and Arg1 mRNA compared to the untreated control, but these were reduced by DMSO co‐treatment (Fig. 6). Co‐treatment with 10 μM CdA significantly increased the expression of iNOS and Arg1 in LPS‐stimulated microglia compared to DMSO control (Fig. 6). CdA did not affect the mRNA expression of iNOS or Arg1 in naive microglia (data not shown).
Fig. 6.
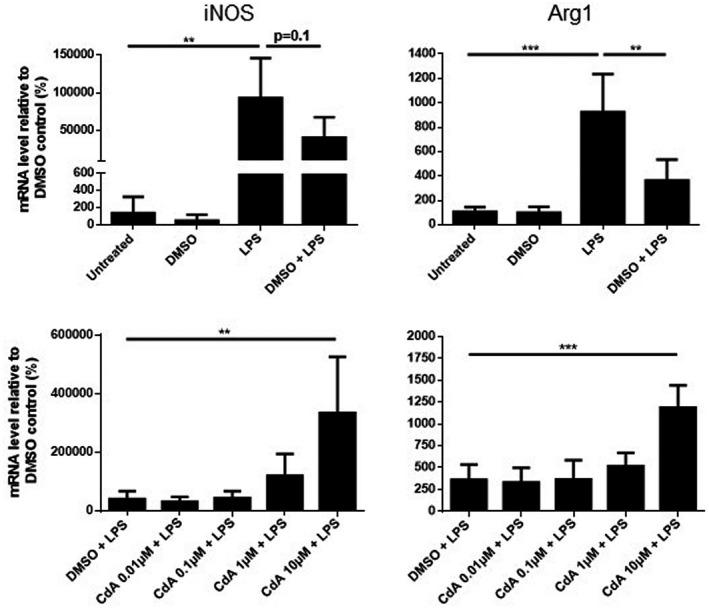
The effect of cladribine on the mRNA expression of arginase 1 (Arg1) and inducible nitric oxide synthase (iNOS) in lipopolysaccharide (LPS)‐stimulated microglia. mRNA expression of arginase 1 and iNOS was quantified by quantitative polymerase chain reaction (qPCR) after microglia were treated with dimethylsulfoxide (DMSO) (0·2%), LPS (10 ng/ml), DMSO and LPS and different concentrations of cladribine (CdA) (0·01 μM, 0·1 μM, 1 μM and 10 μM) together with LPS for 24 h. The expression is shown relative to DMSO control. **P ≤ 0·01, ***P ≤ 0·001, n = 4 in each group, one‐way analysis of variance (ANOVA) followed by multiple comparison tests, mean ± standard deviation (s.d.).
IL‐4 stimulation for 24 h only increased Arg1 expression, whereas no changes were observed in mRNA expression of IL‐1β, TNF, IL‐10, TNF‐R1 and TNF‐R2. Furthermore, the expression of these genes was not affected by CdA co‐treatment (Fig. 7 and Supporting information, Figs S1, S2). IL‐4 did not induce the expression of iNOS (data not shown). Similarly, no difference was observed in the secretion of IL‐1β, TNF and IL‐10 from IL‐4‐stimulated and CdA co‐treated microglia (Supporting information, Fig. S1).
Fig. 7.
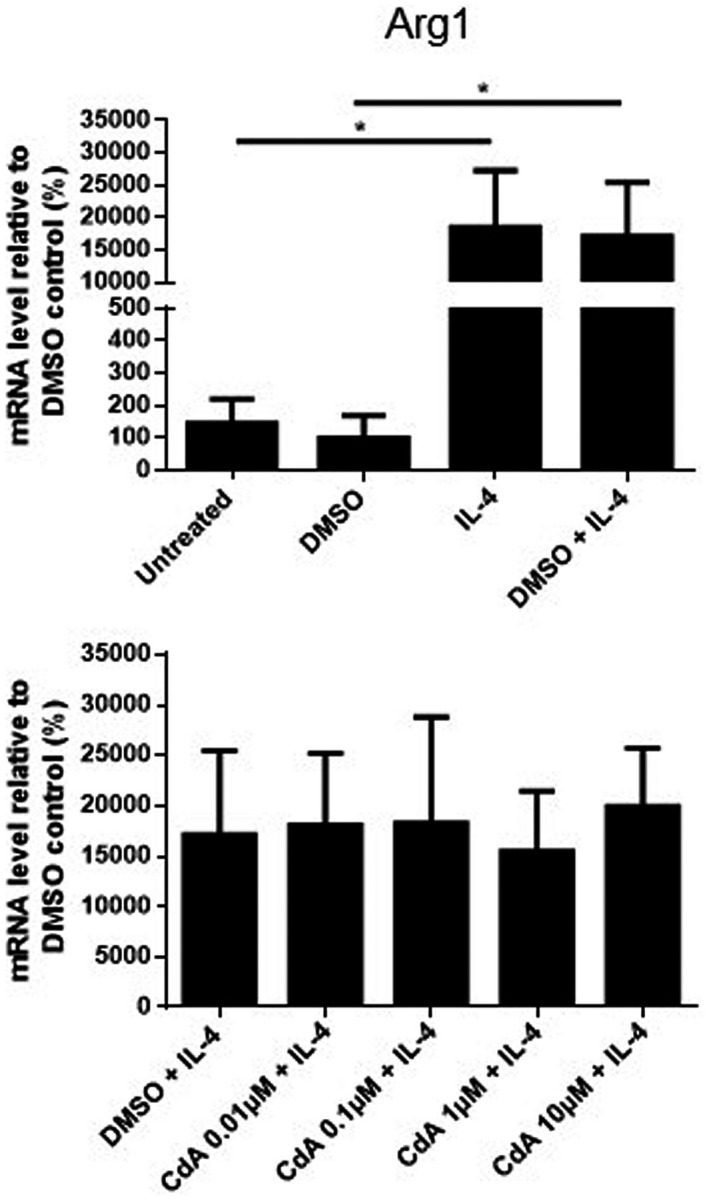
The effect of cladribine on the mRNA expression of arginase 1 (Arg1) in interleukin (IL)‐4‐stimulated microglia. mRNA expression of arginase 1 was quantified by quantitative polymerase chain reaction (qPCR) after microglia were treated with dimethylsulfoxide (DMSO) (0·2%), IL‐4 (20 ng/ml), DMSO and IL‐4, and different concentrations of cladribine (CdA) (0·01 μM, 0·1 μM, 1 μM and 10 μM) together with IL‐4 for 24 h. The expression is shown relative to DMSO control. *P ≤ 0·05, n = 3–4 in each group, one‐way analysis of variance (ANOVA) followed by multiple comparison tests, mean ± standard deviation (s.d.).
LPS and IL‐4 increase the mRNA expression of the enzyme DCK
We examined the mRNA expression of DCK in naive and activated microglia treated with CdA. LPS stimulation increased the expression of DCK, while IL‐4 stimulation resulted in a similar trend compared to DMSO control (P = 0.08) (Fig. 8a,b). CdA (0·01–10 μM) did not change the increased expression induced by LPS and IL‐4 (Fig. 8a,b). The expression of DCK was not affected by CdA (0·01–10 μM) in naive microglia either (data not shown).
Fig. 8.
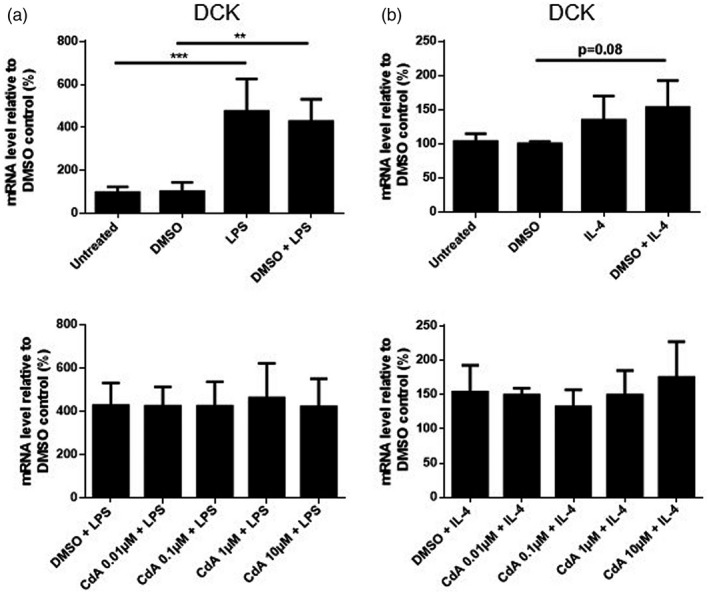
The effect of cladribine on the mRNA expression of deoxycytidine kinase (DCK) in lipopolysaccharide (LPS)‐ and interleukin (IL)‐4‐stimulated microglia. mRNA expression of DCK was quantified by quantitative polymerase chain reaction (qPCR) and is shown relative to dimethylsulfoxide (DMSO) control. (a) Microglia were treated with DMSO (0·2%), LPS (10 ng/ml), DMSO and LPS, and different concentrations of cladribine (CdA) (0·01 μM, 0·1 μM, 1 μM and 10 μM) together with LPS for 24 h. (b) Microglia were treated with DMSO (0·2%), IL‐4 (20 ng/ml), DMSO and IL‐4 and different concentrations of CdA (0·01 μM, 0·1 μM, 1 μM and 10 μM) together with IL‐4 for 24 h. **P ≤ 0·01, ***P ≤ 0·001, n = 3–4 in each group, one‐way analysis of variance (ANOVA) followed by multiple comparison tests, mean ± standard deviation (s.d.).
Discussion
To determine the effect of CdA on murine microglia, we examined phenotypical and functional properties of naïve, LPS‐ and IL‐4‐stimulated microglia treated with different concentrations of CdA for 24 h. We found that CdA only affects stimulated and not naive microglia. Furthermore, different concentrations of CdA influenced different aspects of microglia function. CdA concentrations putatively overlapping with CSF concentrations in humans (0.1‐1 µM) significantly reduced the granularity, phagocytotic ability and motility of LPS‐stimulated microglia, while a higher CdA concentration (10 μM) increased the mRNA expression of pro‐ and anti‐inflammatory molecules, but not protein secretion. In addition, we found that activation of microglia increased the expression of DCK responsible for the activation of the prodrug.
CdA can cross the BBB and thereby potentially exert an effect on CNS resident microglia [2, 3]. The maximum plasma concentration of CdA after administration of a 10‐mg tablet is in the range of 0·07–0·1 μM [22]. As the CSF concentration is 25% of the plasma concentration [2, 3], the maximum CSF concentration attainable is approximately 0·019–0.025 μM. The active form of CdA is CdA triphosphate, which is the phosphorylated form of the drug [2, 3]. The first step of this process is catalyzed by DCK, the activity of which is 10 times lower in mice than humans [17, 18]. The maximum CdA concentration detected in the CSF of patients thus may correspond to murine concentrations in the range of 0.1‐1 µM. Therefore, we applied CdA concentrations of 0·01–10 μM in this study of murine microglia.
We first investigated whether the applied CdA concentrations were toxic to microglia. We found that the viability of microglia was not affected during the short culture conditions, similar to a previous study that applied the intravenous compound to rat microglia cultures [16]. Therefore, we considered that using these concentrations for short‐term stimulation would not have a depleting effect on the cells.
LPS stimulation resulted in a morphological change of microglia characterized by an increase in SSC and thus a more granular morphology, as expected. Co‐treatment with CdA 0·1 μM showed a tendency towards decreased granularity, suggesting that CdA may have an effect on the functional properties of microglia. Further experiments with larger sample size may confirm this trend.
We then examined the phagocytotic ability and motility of microglia. We found that LPS stimulation significantly increased the phagocytotic ability of microglia, which correlated with the proinflammatory phenotype induced by LPS. Such increased phagocytotic ability of LPS‐stimulated microglia was decreased by CdA in the range of 0.1‐1 µM. Furthermore, the decrease in phagocytosis by CdA corresponds to the observed decreased granularity of microglia. CdA had no effect on naive microglia, which is consistent with findings of former studies performed on rat microglia [16], and murine dendritic cells [23].
Microglia motility is important for maintaining CNS homeostasis via interaction with other cells and scanning of the CNS environment [8, 11, 24, 25]. We measured the random migration by (i) track displacement, i.e. the distance from start to end point, and (ii) total distance travelled that includes twists and turns and describes the patrolling of migrating cells. LPS stimulation significantly increased track displacement and showed a tendency towards increased total distance travelled. This is consistent with the acquisition of effector functions induced by LPS and a tendency towards increased patrolling of the surroundings. In contrast to random migration, LPS decreased chemotactic migration of rat microglia [26]. We also found that CdA (0.1‐10 µM) did not affect the motility of resting microglia.
Observing changes in morphology, phagocytotic ability and migration of LPS‐stimulated microglia, we next examined how CdA alters gene expression and protein secretion of microglia stimulated with LPS and with anti‐inflammatory IL‐4. LPS increased the expression of pro‐ and anti‐inflammatory markers, consistent with a recently published study [26]. Co‐treatment with CdA in the high concentration (10 μM) increased the gene expression of both pro‐ and anti‐inflammatory markers, such as IL‐1β, TNF, iNOS, Arg1 and TNF‐R2, suggesting a potentiating effect on activated microglia. Interestingly, only the gene expression of anti‐inflammatory TNF‐R2, but not the proinflammatory TNF‐R1 [27], was potentiated by CdA. The increased protein secretion of IL‐1β, TNF and IL‐10 induced by LPS was not further increased by CdA (0.1‐10 µM), consistent with a previous study on rat microglia [16]. This suggests that CdA only affects gene expression but not protein secretion. We may speculate that accumulation of CdA in microglia may interfere with RNA processing besides interference with DNA replication and this may alter translational mechanisms. Another possible explanation for the potentiating effect of CdA on gene expression but not on protein secretion is that the cytokines remain intracellularly. IL‐1β may not be fully secreted under these conditions [28].
We also found that DMSO co‐treatment reduced the expression of iNOS and Arg1 in LPS‐stimulated microglia, while the expression of IL‐1β, TNF and IL‐10 remained unaffected. As the effect of DMSO on microglia has not been described, we speculate whether the applied DMSO concentration only affects the expression of enzymes, while higher concentrations may be required to affect the cytokine expression. This is supported by a study on LPS‐stimulated bone marrow derived macrophages, in which a DMSO concentration of 0·25% reduced the expression of iNOS similarly to our experiments [29].
We also found that IL‐4 stimulation resulted in an increased gene expression only of Arg1 but it was not affected by CdA co‐treatment. This could indicate that IL‐4 is a less potent stimulus in the short term, and microglia may not be sufficiently activated for the potentiating effect of CdA. In summary, CdA in the applied concentration did not have an effect on cytokine secretion of activated or resting microglia in short‐term primary cultures. The observed effect on gene expression was achieved by higher concentrations of CdA than may be expected in the human CSF during treatment.
Activation of microglia by LPS and IL‐4 also increased the gene expression of DCK that phosphorylates CdA to its active form. This may suggest that activated microglia may increase their ability to respond to CdA. In lymphocytes, CdA interferes with DNA synthesis and repair resulting in depletion of both proliferating and resting cells [2, 3]. The mechanism by which CdA affects microglia functions remains to be determined, and our data do not indicate microglia depletion in the short term. A previous study also suggested that an additional mechanism beside depletion may be responsible for the effects on microglia, such as reduced proliferation [16]. In dendritic cells, the function of CdA is partially independent from its phosphorylation [23]; however, this may not be true in microglia, as the effect of CdA on proliferation was lost upon addition of a competitive substrate of DCK [16].
In summary, we found that CdA used in a concentration that may be reached in the human CSF during approved treatment of MS affected activated but not naive microglia; this may be related to the up‐regulated gene expression of DCK upon activation. Co‐treatment with CdA reduced the phagocytotic ability and random migration of activated microglia, while viability was not affected among the applied conditions. Although gene expression of both pro‐ and anti‐inflammatory molecules was potentiated by CdA, it was induced only by a higher concentration (10 μM) than should be expected in the CSF, and protein secretion was not altered. CdA also potentiated the gene expression of anti‐inflammatory TNF‐R2. These data suggest that, as well as depletion of peripheral lymphocytes, CdA may induce additional effects, particularly in CNS resident cells that contribute to its beneficial effects in MS. It could therefore be interesting to examine the effect of CdA on the morphology and function of microglia from mice exposed to cuprizone, as it induces activation of microglia in vivo [21, 30, 31].
Disclosures
L. Ø. J. received support for congress participation from Merck. M. L. E. received a speaker fee from Merck. A. E. P. was affiliated with Merck during conductance of the study, and A. E. P. is now an employee with Almirall, but the work is unrelated to this employment. A. E. P. also hosts a guest affiliation with University of Copenhagen. Z. I. has served on scientific advisory boards, served as a consultant, received support for congress participation, received speaker honoraria and received research support, among others, from Biogen, Merck‐Serono, Sanofi‐Genzyme, Novartis, Roche and Lundbeckfonden. Å. F. S., A. B. W. and K. H. H. have nothing to declare.
Author contributions
L. Ø. J. was involved in the study design, performed experiments, analyzed the results and drafted the manuscript. K. H. H. performed experiments and analyzed the results. M. L. E. was involved in the study design, analyzed the results and revised the manuscript. A. B. W. performed experiments. A. E. P. was involved in the study design, analyzed the results and revised the manuscript. Å. F. S. was involved in the study design, analyzed the results and revised the manuscript. Z. I. was involved in the study design, analyzed the results and drafted the paper.
Supporting information
Fig. S1. The effect of cladribine on the mRNA expression and protein secretion of cytokines by IL‐4‐stimulated microglia. (a) mRNA expression of IL‐1β, TNF and IL‐10 was quantified by qPCR after microglia were treated with DMSO (0·2%), IL‐4 (20 ng/ml), DMSO and IL‐4, and different concentrations of CdA (0·01 μM, 0·1 μM, 1 μM and 10 μM) together with IL‐4 for 24 hours. The expression is shown relative to DMSO control. (b) The protein concentration of IL‐1β, TNF and IL‐10 in the microglia cell culture supernatant was quantified by Meso Scale. Microglia were treated with DMSO (0·2%), DMSO and IL‐4 (20 ng/ml), and different concentrations of CdA (0·1 μM, 1 μM and 10 μM) together with IL‐4 for 24 hours. n = 3‐4 in each group, unpaired t test with Welch’s correction and one‐way ANOVA followed by Dunnett’s multiple comparisons test, mean ± SD.
Fig. S2. The effect of cladribine on the mRNA expression of TNF receptors in IL‐4‐stimulated microglia. mRNA expression of TNF‐R1 and TNF‐R2 was quantified by qPCR after microglia were treated with DMSO (0·2%), IL‐4 (20 ng/ml), DMSO and IL‐4, and different concentrations of CdA (0·01 μM, 0·1 μM, 1 μM and 10 μM) together with IL‐4 for 24 hours. The expression is shown relative to DMSO control. n = 3‐4 in each group, one‐way ANOVA followed by multiple comparisons tests, mean ± SD.
Table S1. Sequences or primer IDs of the oligonucleotides used for qPCR amplification.
Acknowledgements
This study was supported by Merck A/S, Denmark; an affiliate of Merck KGaA, Darmstadt, Germany. We thank Ulla Damgaard Munk for expert technical assistance.
References
- 1. Sipe JC. Cladribine tablets: a potential new short‐course annual treatment for relapsing multiple sclerosis. Expert Rev Neurother 2010; 10:365–75. [DOI] [PubMed] [Google Scholar]
- 2. Giovannoni G. Cladribine to treat relapsing forms of multiple sclerosis. Neurotherapeutics 2017; 14:874–87. [DOI] [PMC free article] [PubMed] [Google Scholar]
- 3. Warnke C, Leussink VI, Goebels N et al Cladribine as a therapeutic option in multiple sclerosis. Clin Immunol 2012; 142:68–75. [DOI] [PubMed] [Google Scholar]
- 4. Giovannoni G, Comi G, Cook S et al A placebo‐controlled trial of oral cladribine for relapsing multiple sclerosis. N Engl J Med 2010; 362:416–26. [DOI] [PubMed] [Google Scholar]
- 5. Comi G, Cook S, Rammohan K et al Long‐term effects of cladribine tablets on MRI activity outcomes in patients with relapsing‐remitting multiple sclerosis: the CLARITY Extension study. Ther Adv Neurol Disord 2018; 11:1756285617753365. [DOI] [PMC free article] [PubMed] [Google Scholar]
- 6. Giovannoni G, Soelberg Sorensen P, Cook S et al Safety and efficacy of cladribine tablets in patients with relapsing‐remitting multiple sclerosis: results from the randomized extension trial of the CLARITY study. Mult Scler 2018; 24:1594–604. [DOI] [PubMed] [Google Scholar]
- 7. Rommer PS, Milo R, Han MH et al Immunological aspects of approved MS therapeutics. Front Immunol 2019; 10:1564. [DOI] [PMC free article] [PubMed] [Google Scholar]
- 8. Nayak D, Roth TL, McGavern DB. Microglia development and function. Annu Rev Immunol 2014; 32:367–402. [DOI] [PMC free article] [PubMed] [Google Scholar]
- 9. Dendrou CA, Fugger L, Friese MA. Immunopathology of multiple sclerosis. Nat Rev Immunol 2015; 15:545–58. [DOI] [PubMed] [Google Scholar]
- 10. Lannes N, Eppler E, Etemad S, Yotovski P, Filgueira L. Microglia at center stage: a comprehensive review about the versatile and unique residential macrophages of the central nervous system. Oncotarget 2017; 8:114393–413. [DOI] [PMC free article] [PubMed] [Google Scholar]
- 11. Kofler J, Wiley CA. Microglia: key innate immune cells of the brain. Toxicol Pathol 2011; 39:103–14. [DOI] [PubMed] [Google Scholar]
- 12. Loane DJ, Kumar A. Microglia in the TBI brain: the good, the bad, and the dysregulated. Exp Neurol 2016; 275(Pt 3):316–27. [DOI] [PMC free article] [PubMed] [Google Scholar]
- 13. Gudi V, Gingele S, Skripuletz T, Stangel M. Glial response during cuprizone‐induced de‐ and remyelination in the CNS: lessons learned. Front Cell Neurosci 2014; 8:73. [DOI] [PMC free article] [PubMed] [Google Scholar]
- 14. Mayo L, Quintana FJ, Weiner HL. The innate immune system in demyelinating disease. Immunol Rev 2012; 248:170–87. [DOI] [PMC free article] [PubMed] [Google Scholar]
- 15. Tang Y, Le W. Differential roles of M1 and M2 microglia in neurodegenerative diseases. Mol Neurobiol 2016; 53:1181–94. [DOI] [PubMed] [Google Scholar]
- 16. Singh V, Voss EV, Benardais K, Stangel M. Effects of 2‐chlorodeoxyadenosine (cladribine) on primary rat microglia. J Neuroimmune Pharmacol 2012; 7:939–50. [DOI] [PubMed] [Google Scholar]
- 17. Johansson M, Karlsson A. Differences in kinetic properties of pure recombinant human and mouse deoxycytidine kinase. Biochem Pharmacol 1995; 50:163–8. [DOI] [PubMed] [Google Scholar]
- 18. Habteyesus A, Nordenskjold A, Bohman C, Eriksson S. Deoxynucleoside phosphorylating enzymes in monkey and human tissues show great similarities, while mouse deoxycytidine kinase has a different substrate specificity. Biochem Pharmacol 1991; 42:1829–36. [DOI] [PubMed] [Google Scholar]
- 19. McCarthy KD, de Vellis J. Preparation of separate astroglial and oligodendroglial cell cultures from rat cerebral tissue. J Cell Biol 1980; 85:890–902. [DOI] [PMC free article] [PubMed] [Google Scholar]
- 20. Stangel M, Joly E, Scolding NJ, Compston DA. Normal polyclonal immunoglobulins (‘IVIg’) inhibit microglial phagocytosis in vitro . J Neuroimmunol 2000; 106:137–44. [DOI] [PubMed] [Google Scholar]
- 21. Martin NA, Molnar V, Szilagyi GT et al Experimental demyelination and axonal loss are reduced in microrna‐146a deficient mice. Front Immunol 2018;9:490. [DOI] [PMC free article] [PubMed] [Google Scholar]
- 22. Laugel B, Borlat F, Galibert L et al Cladribine inhibits cytokine secretion by T cells independently of deoxycytidine kinase activity. J Neuroimmunol 2011; 240–241:52–7. [DOI] [PubMed] [Google Scholar]
- 23. Kraus SH, Luessi F, Trinschek B et al Cladribine exerts an immunomodulatory effect on human and murine dendritic cells. Int Immunopharmacol 2014; 18:347–57. [DOI] [PubMed] [Google Scholar]
- 24. Kim SU, de Vellis J. Microglia in health and disease. J Neurosci Res 2005; 81:302–13. [DOI] [PubMed] [Google Scholar]
- 25. Vilhardt F. Microglia: phagocyte and glia cell. Int J Biochem Cell Biol 2005; 37:17–21. [DOI] [PubMed] [Google Scholar]
- 26. Lively S, Schlichter LC. Microglia responses to pro‐inflammatory stimuli (LPS, IFNγ+TNFα) and reprogramming by resolving cytokines (IL‐4, IL‐10). Front Cell Neurosci 2018; 12:215. [DOI] [PMC free article] [PubMed] [Google Scholar]
- 27. Gane JM, Stockley RA, Sapey E. TNF‐alpha autocrine feedback loops in human monocytes: the pro‐ and anti‐inflammatory roles of the TNF‐α receptors support the concept of selective TNFR1 blockade in vivo . J Immunol Res 2016; 2016:1079851. [DOI] [PMC free article] [PubMed] [Google Scholar]
- 28. Lopez‐Castejon G, Brough D. Understanding the mechanism of IL‐1β secretion. Cytokine Growth Factor Rev 2011; 22:189–95. [DOI] [PMC free article] [PubMed] [Google Scholar]
- 29. Elisia I, Nakamura H, Lam V et al DMSO represses inflammatory cytokine production from human blood cells and reduces autoimmune arthritis. PLOS ONE 2016; 11:e0152538. [DOI] [PMC free article] [PubMed] [Google Scholar]
- 30. Voss EV, Skuljec J, Gudi V et al Characterisation of microglia during de‐ and remyelination: can they create a repair promoting environment? Neurobiol Dis 2012; 45:519–28. [DOI] [PubMed] [Google Scholar]
- 31. Veto S, Acs P, Bauer J et al Inhibiting poly(ADP‐ribose) polymerase: a potential therapy against oligodendrocyte death. Brain 2010; 133(Pt 3):822–34. [DOI] [PMC free article] [PubMed] [Google Scholar]
Associated Data
This section collects any data citations, data availability statements, or supplementary materials included in this article.
Supplementary Materials
Fig. S1. The effect of cladribine on the mRNA expression and protein secretion of cytokines by IL‐4‐stimulated microglia. (a) mRNA expression of IL‐1β, TNF and IL‐10 was quantified by qPCR after microglia were treated with DMSO (0·2%), IL‐4 (20 ng/ml), DMSO and IL‐4, and different concentrations of CdA (0·01 μM, 0·1 μM, 1 μM and 10 μM) together with IL‐4 for 24 hours. The expression is shown relative to DMSO control. (b) The protein concentration of IL‐1β, TNF and IL‐10 in the microglia cell culture supernatant was quantified by Meso Scale. Microglia were treated with DMSO (0·2%), DMSO and IL‐4 (20 ng/ml), and different concentrations of CdA (0·1 μM, 1 μM and 10 μM) together with IL‐4 for 24 hours. n = 3‐4 in each group, unpaired t test with Welch’s correction and one‐way ANOVA followed by Dunnett’s multiple comparisons test, mean ± SD.
Fig. S2. The effect of cladribine on the mRNA expression of TNF receptors in IL‐4‐stimulated microglia. mRNA expression of TNF‐R1 and TNF‐R2 was quantified by qPCR after microglia were treated with DMSO (0·2%), IL‐4 (20 ng/ml), DMSO and IL‐4, and different concentrations of CdA (0·01 μM, 0·1 μM, 1 μM and 10 μM) together with IL‐4 for 24 hours. The expression is shown relative to DMSO control. n = 3‐4 in each group, one‐way ANOVA followed by multiple comparisons tests, mean ± SD.
Table S1. Sequences or primer IDs of the oligonucleotides used for qPCR amplification.


