

Abstract
Context:
Although spine fractures have important medical and prognostic significance, they are frequently unrecognized. According to the Surgeon General, more information about spine fracture epidemiology is needed.
Objectives:
The primary objective was to determine prevalence of vertebral fractures by Vertebral Fracture Assessment (VFA) in men and women aged ≥40. Additional objectives included determining characteristics of those with vertebral fractures, comparing self-report versus VFA-diagnosed fracture, and assessing prevalence in those meeting National Osteoporosis Foundation (NOF) criteria for spine imaging.
Design, Setting and Participants:
Cross-sectional analysis of 3330 US adults aged ≥40 who participated in the National Health and Nutrition Examination Survey (NHANES) 2013-2014 and had evaluable VFA data.
Main Outcome Measures:
VFA graded by semi-quantitative measurement, bone mineral density (BMD) of lumbar spine (LS) and proximal femur, osteoporosis questionnaire.
Results:
Overall prevalence of vertebral fractures was 5.4% and was similar in men and women. Prevalence increased with age (P < .01) from <5% in those <60 to 11% of those 70-79 and 18% of those ≥80. Fractures were more common in non-Hispanic whites, and in people with lower body mass index and lower BMD. Prevalence was higher in subjects who did versus did not meet selected NOF criteria for spine imaging (14% vs. 4.7%, P < .001). Among all subjects with vertebral fracture, 26% had osteoporosis at the LS or FN by BMD criteria. In those ≥65 with vertebral fracture, 38% had osteoporosis by at least one site, and only 22% were normal at both sites (compared to those without fracture where 14% had osteoporosis and 35% had normal BMD at both sites). Only 8% of people with a spine fracture by VFA had a self-reported fracture, and among those who self-reported a spine fracture, only 21% were diagnosed with fracture by VFA.
Conclusions:
Prevalence of vertebral fracture is similar in women and men and increases with age and lower BMD. Objective assessments with lateral spine imaging are critical for identifying subjects with vertebral fractures. The prevalence of vertebral fracture was three-fold higher in individuals who met NOF recommendations for targeted spine imaging
INTRODUCTION
Approximately 2 million Americans suffered an osteoporosis-related fracture in 2005, and this incidence was projected to increase to more than 3 million by 2025.1 Health care professionals frequently fail to diagnose and treat osteoporosis2–8 even after major fractures. 9
The Surgeon General’s Report on Bone Health and Osteoporosis highlights that providers should be aware of red flags signaling potential problems with an individual’s bone health and that national-level data on spine fracture is a public health priority.10 The presence of osteoporotic fracture indicates the skeleton has deteriorated and is unable to sustain day-to-day loads. Compared to standard lateral spine radiographs, lateral spine images from bone densitometers (Vertebral Fracture Assessment, VFA) have reduced resolution and higher noise, but less projection distortion (parallax) and lower radiation exposure, with nearly comparable accuracy to identify vertebral fractures.11–18
Spine fractures are associated with increased mortality,19,20 reduced lung volume,21 chronic pain, and impaired quality of life.22 Spine fractures are often the first osteoporotic fractures23 and are associated with substantially elevated risk for subsequent vertebral24 and nonvertebral fractures including those of the hip.25 In studies where most or all patients had baseline vertebral fractures,26–33 osteoporosis medications reduced risk of additional vertebral fractures and in some studies significantly reduced risk for nonvertebral and/or hip fractures.26–28,32,33 Accordingly, osteoporosis guidelines recommend that patients with vertebral fractures receive pharmacologic treatment.34–36 Because these fractures often do not come to clinical attention, patients with spine fractures are frequently not identified. As a result, proactive spine imaging with radiography or VFA has recently been recommended by the National Osteoporosis Foundation (NOF) in appropriate patients.34
The only major epidemiology study to assess the prevalence of vertebral fractures in the United States was the Study of Osteoporotic Fractures (SOF) which enrolled Caucasian women aged ≥65 beginning in 1986. Twenty percent of the 9575 subjects had a prevalent vertebral fracture defined by quantitative morphometry, which involves measurements of each vertebra without visual assessment for degenerative change or non-fracture anomalies.37 Additionally, spine radiography (semiquantitative methodology38) in 704 women and men in the Framingham study (mean age 53-54 years in 1967-1969), revealed the prevalence of vertebral fractures was 13-14% although the authors suggested that some fractures seen may have been a result of remote trauma, stress, sports, physical activity, or degenerative remodeling, rather than osteoporosis.39 In studies from Canada, Japan and many European countries, vertebral fracture prevalence rates varied from 4% to 25%, based on the population age, gender distribution, geography, ascertainment technique and other factors.24,25,40–45
The National Health and Nutrition Examination Survey (NHANES) has previously provided information regarding bone mineral density (BMD) of U.S. citizens, and the NHANES III database is the reference database for hip BMD.46 The goals of this study were to assess the prevalence of vertebral fractures in men and women aged ≥40 using VFA data collected in NHANES 2013-2014, to compare characteristics of subjects with versus without vertebral fractures, to compare self-report of vertebral fracture with VFA diagnosis, and to assess prevalence in those who met National Osteoporosis Foundation (NOF) criteria for spine imaging.34 These criteria were designed to identify individuals believed to have higher risk for prevalent vertebral fracture.”
METHODS
Study Design
The NHANES is conducted by the National Center for Health Statistics (NCHS) to assess the health and nutritional status of a representative sample of the non-institutionalized, civilian US population. Details about the plan, operation, and design of the survey are described elsewhere.47,48 Participants in NHANES underwent a detailed in-person home interview followed by physical assessments at a mobile examination center. All procedures in NHANES 2013-2014 were approved by the NCHS Research Ethics Review Board, and written informed consent was obtained from all subjects.
Assessments:
VFA using lateral spine imaging IVA™ mode and BMD of posterior-anterior (PA) lumbar spine and proximal femur with Hologic Discovery® A densitometers (Hologic Inc., Marlborough MA) were performed in the supine position. BMD was analyzed using APEX™ version 4.0. Images of T4 to L4 were viewed and results were stored using Optasia Medical SpineAnalyzer™ 4.0 software (Cheadle Hulme, United Kingdom). Each vertebra was graded using a semi-quantitative method38 by a reader at the NHANES DXA quality control center at the University of California San Francisco (UCSF) as normal (0), mild (1), moderate (2), or severe (3) fracture. Images of the 274 participants identified to have a fracture by the UCSF reader were re-read by an expert musculoskeletal radiologist (Genant) who determined that 88 (32%) did not have a fracture; the “false positives” were mostly mild wedge deformities, without evident endplate or cortical wall displacement, presumably representing acquired stress-related deformity or degenerative remodeling. The readings included inspection for vertebral body height loss and morphology out of step with adjacent vertebrae. Additional features supporting fracture diagnosis included buckling or bowing of the endplates and/or anterior cortical walls. Deformity related to degenerative change identified by intact and sometimes sclerotic endplates with accompanying adjacent disc-space narrowing were not diagnosed as fractures. Deformities such as Scheuermann’s disease or congenital vertebral fusion were also excluded as fractures. Subject status was defined as ‘normal’ if no fracture was observed and at least 9 of 10 vertebral bodies from T7-L4 were evaluable; T4-T6 were not required to be evaluable since they are not always well visualized and only a small proportion of vertebral fractures occur at these levels.12 Status was considered ‘fractured’ if a fracture was observed in T4 –L4, regardless if there were unevaluable levels elsewhere. Status was ‘uninterpretable’ for participants not meeting above criteria.
Measurement procedures and exclusion criteria for BMD of lumbar spine (LSBMD), total hip (TOTBMD), and femoral neck (FNBMD) have been described in detail elsewhere.49–52 LSBMD was calculated as the average of individual lumbar vertebra in respondents with at least two valid vertebrae between L1-L4.53 T-scores were calculated per the 2013 recommendations from the International Society for Clinical Densitometry.53
Self-reported race, ethnicity and previous fracture history were assessed by questionnaire. Prior low trauma fractures were defined as self-reported fractures that occurred at age ≥50 due to a fall from standing height or less, tripped/slipped, or fell out of bed (hip, wrist, or spine) or age ≥20 and not due to severe trauma such as a car accident, hard fall down steps or from a ladder (fractures other than hip, wrist, or spine).
The prevalence of vertebral deformities identified by VFA in men and women age ≥50 was compared in those who met selected NOF criteria for spine imaging with those who did not.34 NOF criteria used to determine VFA eligibility were: a) women age 65-69 and men age 70-79 whose FNBMD, TOTBMD or LSBMD T score was ≤ −1.5; b) women age ≥70 and men age ≥80 whose FNBMD, TOTBMD or LSBMD T score was ≤ −1.0; and c) men and women age ≥50 who reported a prior low trauma fracture that occurred at age ≥50. Data on additional conditions that define eligibility for spine imaging, such as height loss and glucocorticoid use, were not available for this analysis.
Statistical analyses
Analyses were conducted with PC-SAS (Version 9.3, SAS Institute, Cary NC) and SUDAAN (Version 11.0.1, Research Triangle Institute, NC). All analyses used the examination sample weights and accounted for the complex survey design when calculating statistical tests. Confidence intervals for percentages were calculated as recommended by Korn and Graubard.55 Tests of statistical significance were performed using t-tests or chi-square analyses (for unadjusted results) and linear or logistic regression (for age-adjusted results).
Study sample and missing data
The percentage of subjects age ≥40 who came to the mobile exam centers relative to the number selected to participate in NHANES 2013-2014 was 61.2%. Of the 3708 adults examined, 378 (10%) either did not undergo VFA due to pregnancy, body weight >450 pounds, history of radiographic contrast material exposure in past 7 days, or presence of Harrington Rod in the spine, or had scans excluded because of movement artifact. The final analytic VFA sample consisted of 3,330 subjects.
Because 10% of the examined sample were not included in the final VFA sample, nonresponse bias analyses were conducted. Excluded respondents were more likely to be older, female, nonwhite, have higher BMI, report their health as fair or poor, and report more sedentary time than respondents in the analytic sample. To further examine the potential for nonresponse bias, the publicly-released examination sample weights were adjusted for item non-response using the PROC WTADJUST procedure in SUDAAN. We used this model-based calibration procedure to reweight the data by computing nonresponse and post-stratification weight adjustments by age, sex, and race/Hispanic origin. The adjusted sample weights resulted in similar conclusions to those seen when the publicly released sample weights were used. It is important to note, however, that this analysis adjusted for biases associated with these three demographic characteristics only
RESULTS
The VFA sample included 1602 males and 1728 females. The weighted demographic characteristics of the VFA sample reflect those of the non-institutionalized US population aged ≥40 years: mean age was 57, while the race/ethnic composition was 71% non-Hispanic white, 11% Hispanic, 10% non-Hispanic black, 5% non-Hispanic Asian, and 2% other race. Mean BMI was 29 kg/m2 and mean BMD values were within the normal range (T score > - 1) at FNBMD, TOTBMD or LSBMD in both genders.
Table 1 shows the prevalence of vertebral fractures by age and gender. Overall 5.4% of subjects had vertebral fractures, including 6.2% of males and 4.6% of females. There was a significant increase in the prevalence of vertebral fractures by age in both genders (P = .03 for all). The prevalence increased from 3-5% in men and women < 60 to 16-21% in those age ≥80.
Table 1.
Vertebral Fracture by Age and Sex in US Adults Aged ≥40: NHANES 2013-2014
| Fracture | Normal | Uninterpretablea | |||||
|---|---|---|---|---|---|---|---|
| Sex | Age | n | % [95% CI] | n | % [95% CI] | n | % [95% CI] |
| Both sexes | 40+ | 186 | 5.4 [4.6, 6.3] | 3038 | 91.4 [89.9, 92.8] | 106 | 3.2 [2.3, 4.4] |
| 40-49 | 13 | 2.1 [1.2, 3.4] | 905 | 96.1 [94.9, 97.0] | 19 | 1.9 [1.1, 2.9] | |
| 50-59 | 33 | 4.2 [2.9, 6.0] | 785 | 93.3 [91.0, 95.2] | 19 | 2.5 [1.2, 4.5] | |
| 60-69 | 43 | 5.4 [3.6, 7.8] | 762 | 90.0 [86.7, 92.8] | 36 | 4.6 [2.8, 7.0] | |
| 70-79 | 53 | 10.5 [7.1, 14.8] | 399 | 85.7 [80.5, 90.0] | 15 | 3.8 [1.9, 6.7] | |
| 80+ | 44 | 18.0 [13.4, 23.3] | 187 | 74.7 [68.3, 80.5] | 17 | 7.3 [2.4, 16.3]c | |
| P age trend | 0.03 | ||||||
| Men | 40+ | 105 | 6.2 [4.8, 8.0] | 1455 | 91.3 [89.3, 93.0] | 42 | 2.5 [1.8, 3.3] |
| 40-49 | 10 | 3.5 [1.8, 6.1] | 423 | 94.9 [92.5, 96.7] | 9 | 1.6 [0.8, 2.8] | |
| 50-59 | 23 | 5.2 [2.9, 8.5] | 383 | 92.6 [89.4, 95.1] | 9 | 2.2 [0.7. 5.2]c | |
| 60-69 | 24 | 6.3 [2.8, 11.9]b | 364 | 89.8 [84.5, 93.7] | 15 | 3.9 [1.5, 8.0]b | |
| 70-79 | 26 | 10.3 [5.3, 17.6] | 198 | 87.8 [79.1, 93.8] | 3 | -- [--]d | |
| 80+ | 22 | 20.7 [13.3, 29.8] | 87 | 73.8 [64.5, 81.7] | 6 | -- [--]d | |
| P age trend | 0.01 | ||||||
| Women | 40+ | 81 | 4.6 [3.5, 5.9] | 1583 | 91.6 [88.9, 93.7] | 64 | 3.9 [2.5, 5.7] |
| 40-49 | 3 | -- [--]d | 482 | 97.2 [94.2, 98.9] | 10 | 2.1 [0.7, 5.1]c | |
| 50-59 | 10 | 3.3 [1.8, 5.3] | 402 | 94.0 [90.4, 96.5] | 10 | 2.8 [1.0, 6.1]b | |
| 60-69 | 19 | 4.6 [2.0, 8.9]b | 398 | 90.2 [85.4, 93.9] | 21 | 5.1 [2.8, 8.5] | |
| 70-79 | 27 | 10.6 [6.4, 16.2] | 201 | 84.0 [76.5, 89.8] | 12 | 5.4 [2.8, 9.3] | |
| 80+ | 22 | 16.3 [8.8, 26.5] | 100 | 75.3 [64.9, 83.9] | 11 | 8.4 [2.5, 19.6] c | |
| P age trend | <0.001 | ||||||
No fracture, 1+ un-interpretable vertebra in T7-L4. May be statistically unreliable for the following reason(s):
Relative standard error = 30-39%;
Relative standard error =40-49%;
Relative standard error ≥50%.
Table 2 shows age-adjusted characteristics of subjects with versus without vertebral fractures. Those with fracture were older, more likely to be non-Hispanic white, had a lower BMI and lower BMD at all sites. In contrast, gender distribution for normal vs fractured subjects was similar. A higher proportion of subjects with versus without vertebral fracture met BMD criteria for osteoporosis at the LS or FN (26.4% vs. 9.9%). In those ≥65 with vertebral fracture, 38% had osteoporosis by at least one site, compared to 14% of those without fracture, and only 22% had normal BMD at both sites, compared to 35% of the non-fracture population. The percent with normal BMD at both sites did not differ significantly by fracture status in the sample aged ≥ 50 (p=.06), but was significantly lower in those with vertebral fracture aged ≥65.
Table 2.
Selected Age-adjusteda Characteristics of Adults Aged ≥40 Years by VFA Fracture Status, NHANES 2013-14.
| No fracture | Fracture | ||||
|---|---|---|---|---|---|
| n | Mean or % [95% CI] | n | Mean or % [95% CI] | P value | |
| Age (unadjusted mean, years) | 3038 | 56.7 [56.2, 57.3] | 186 | 65.6 [63.6, 67.7] | <.001 |
| Sex (%) | .08 | ||||
| Men | 1455 | 47.9 [46.0, 49.8] | 105 | 57.0 [46.9, 66.5] | |
| Women | 1583 | 52.1 [50.2, 54.0] | 81 | 43.0 [33.5, 53.2] | |
| Race and Hispanic origin (%) | .01 | ||||
| NonHispanic white | 1295 | 70.8 [63.8, 76.9] | 127 | 80.0 [70.3, 87.2] | |
| NonHispanic black | 628 | 10.5 [7.8, 14.1] | 20 | 5.2 [3.1, 8.6] | |
| Hispanic | 693 | 11.5 [7.8, 16.7] | 24 | 7.7 [3.8, 15.0]d | |
| NonHispanic Asian | 356 | 5.0 [3.7, 6.9] | 13 | 4.0 [2.2, 7.3] | |
| Other | 66 | 2.1 [1.5, 3.1] | 2 | -- [--]e | |
| Self-reported spine fracture (%) | 3036 | 1.8 [1.2, 2.7] | 186 | 9.3 [4.6, 18.0] | <.001 |
| BMI (mean, kg/m2) | 3017 | 29.2 [28.8, 29.5] | 183 | 27.8 [26.6, 29.0] | .02 |
| Femur neck BMD (mean, gm/cm2) | 2859 | 0.783 [0.777, 0.790] | 172 | 0.722 [0.702, 0.743] | <.001 |
| Total femur BMD (mean, gm/cm2) | 2859 | 0.953 [0.944, 0.963] | 172 | 0.881 [0.852, 0.911] | <.001 |
| Lumbar spine BMD (mean, gm/cm2) | 2841 | 1.023 [1.015, 1.031] | 164 | 0.966 [0.936, 0.997] | .002 |
| Femur neck T score (mean)b | 1989 | −0.85 [−0.90, −0.80] | 159 | −1.37 [−1.58, −1.15] | <.001 |
| Total femur T score (mean)b | 1989 | −0.07 [−0.15, 0.02] | 159 | −0.68 [−0.93, −0.44] | <.001 |
| Lumbar spine T score (mean)b | 1938 | −0.32 [−0.38, −0.25] | 152 | −0.92 [−1.20, −0.64] | <0.001 |
| Lumbar spine and femoral neck statusc: | |||||
| Age 50+ | |||||
| Osteoporosis (%)b | 199 | 9.9 [8.5, 11.2] | 40 | 26.4 [16.2, 36.5] | <0.001 |
| Low bone mass (%)b | 794 | 45.0 [42.7, 47.2] | 64 | 38.6 [26.8, 50.4] | 0.29 |
| Normal (%)b | 817 | 45.2 [42.7, 47.7] | 37 | 35 [23.8, 46.3] | 0.06 |
| Age 65+ | |||||
| Osteoporosis (%)b | 107 | 13.8 [10.7, 16.9] | 33 | 37.9 [28.2, 47.6] | <0.001 |
| Low bone mass (%)b | 359 | 50.9 [46.8, 55.0] | 41 | 39.6 [29.3, 46.9] | 0.03 |
| Normal (%)b | 277 | 35.3 [32.5, 38.2] | 18 | 22.4 [11.8, 33.1] | 0.02 |
Abbreviations: BMD, bone mineral density; BMI, body mass index; VFA, vertebral fracture assessment
Linear or logistic regression was used to adjust results for comparison between groups that differed significantly in age. Specifically, age was included as an independent variable in the regression model, and means or proportions for the variable of interest were calculated by group after setting the value for age equal to the average age of the sample being modeled (57 years in the present study).
Respondents aged ≥50 only
Subjects classified based on the lowest T-score from lumbar spine or femoral neck: “osteoporosis” = T < −2.5 at either site; “low bone mass”= T score between −1 and −2.5 at one or both sites; “normal”= T score ≥ −1.0 at both sites.
May be statistically unreliable for the following reason(s):
Relative standard error = 30-39%;
Relative standard error ≥50%;
Table 3 shows spine fracture status by VFA compared with self-report. Less than 1% had spine fracture by both measures; 2% self-reported spine fracture but had normal VFA, and 5% had a VFA positive diagnosis without a self-reported fracture. Only 8% of those with a VFA diagnosis were aware of their fracture. Furthermore, only 21% of those who self-reported fracture had a proven VFA diagnosis.
Table 3.
Relationship Between VFA Spine Fracture and Self-reported Spine Fracture US Adults Aged ≥40, NHANES 2013-2014
| n | % [95% CI] | |
|---|---|---|
| Spine fracture status | ||
| Both VFA and self-reported spine fracture | 14 | 0.5 [0.2, 1.0]b |
| Self-reported spine fracture, no VFA spine fracture | 45 | 1.8 [1.2, 2.6] |
| VFA spine fracture, no self-reported spine fracture | 172 | 5.1 [4.5, 5.8] |
| No VFA or self-reported spine fracture | 2991 | 92.7 [91.5, 93.7] |
| Self-reported spine fracture status among those with VFA spine fracture | ||
| Yes | 14 | 8.2 [3.3, 16.3]a |
| No | 172 | 91.8 [83.7, 96.7] |
| VFA spine fracture status among those with self-reported spine fracture | ||
| Yes | 14 | 20.7 [8.1, 39.4]a,c |
| No | 45 | 79.3 [60.6, 91.9]c |
Abbreviation: VFA, vertebral fracture assessment
May be statistically unreliable for the following reason(s):
Relative standard error = 30-39%;
Relative standard error = 40-49%;
< 12 degrees of freedom.
Common locations for fractures in both genders were the mid-thoracic region and thoracolumbar junction (Figure 1). Fracture frequency appeared to be similar in men and women at most levels, but fractures at some levels appeared to be more common in men, including T11 and T12.
Figure 1.
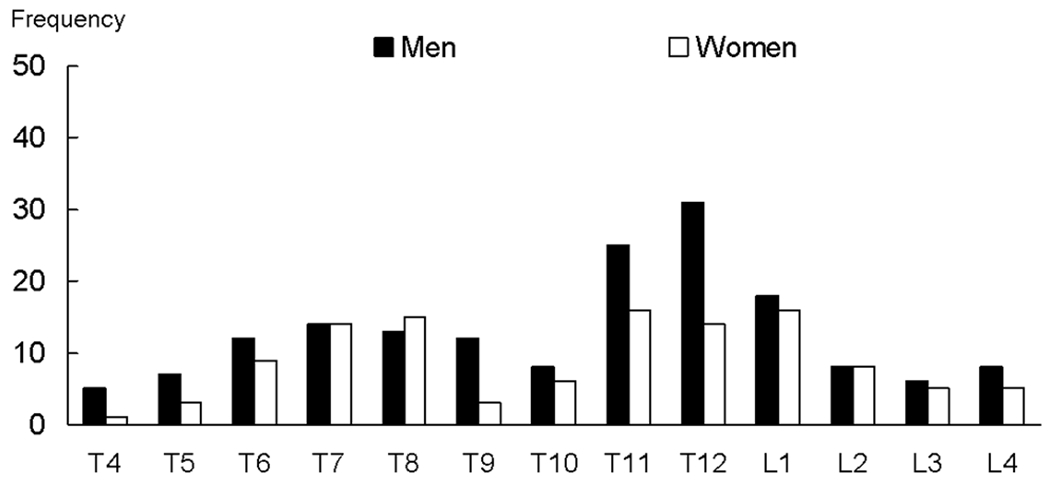
Distribution of fractures at individual vertebra by sex, NHANES 2013-14 VFA fracture sample (n = 186)*
The distribution of fractures at each level from T4 through L4 is shown for the 186 subjects found to have one or more vertebral fractures. Results are presented as frequency of fracture at each vertebral level. Note the precision of this information may be low at some levels, and these data are provided to illustrate distribution rather than exact prevalence at each level. As an additional caveat, visualization of T4-T6 was inadequate in some subjects, although only a small proportion of vertebral fractures occur at these levels.12
*Note: Results are presented as frequency of fracture at each vertebral level
Table 4 shows the prevalence of vertebral fracture in subjects meeting versus not meeting NOF criteria for spine imaging. The prevalence was higher in subjects meeting criteria overall (14.0 vs. 4.7%, P < .001), and considering men (20.1 vs. 5.6%, P =.003) and women (12.4 vs. 3.6%, P < .001) separately.
Table 4.
Prevalence of VFA Fracture by NOF Spine Imaging Criteria Status Among Adults Aged ≥50, NHANES 2013-2014a
| Sex | Met NOF spine imaging criteriab | Did not meet NOF spine imaging criteria | Met vs. did not meet criteria | ||
|---|---|---|---|---|---|
| n | % [95% CI] | n | % [95% CI] | P | |
| Both sexes | 482 | 14.0 [11.7, 16.7] | 1467 | 4.7% [3.2, 6.8] | <.001 |
| Men | 115 | 20.1 [13.2, 29.3] | 835 | 5.6% [3.5, 8.7] | .003 |
| Women | 367 | 12.4 [9.7, 15.6] | 632 | 3.6% [2.2, 6.0] | <.001 |
Abbreviations: NOF, National Osteoporosis Foundation; VFA, vertebral fracture assessment, FN_T, femoral neck T score; TOTHIP_T total femur T score; LS_T lumbar spine T score.
These results were not adjusted for age differences between the groups being compared because the objective was to test the impact of all the criteria, including age.
Criteria used:
i. Women aged ≥70 and men ≥80 if FN_T, LS_T, or TOTHIP_T is −1 or lower
ii. Women age 65-69 and men 70-79 if FN_T, LS_T or TOTHIP_T is −1.5 or lower
iii. Men or women aged ≥50 who report a fragility fracture after age 50
DISCUSSION
These data from NHANES 2013-14 provide the first nationally representative estimates of vertebral fractures in the US population aged ≥40. VFA identified vertebral fracture prevalence was very low in those aged 40-49 years, but increased to 11% of those aged 70-79 and 18% of those aged ≥80. Prevalence was similar in men and women. Beyond the association with age, those with vertebral fractures had lower BMI and lower BMD. Among participants with vertebral fractures, 26% had osteoporosis at the lumbar spine or femoral neck by BMD (T-score <−2.5) after age adjustment, although among participants ≥65 with vertebral fractures, the proportion with osteoporosis by BMD criteria was 38% and the proportion with normal BMD (T-score >−1.0) at both skeletal sites was only 22%. For hip fracture, the SOF study showed that 58% of fracture patients had osteoporosis at the lumbar spine or femoral neck.56 These studies confirm that many people with fractures do not meet BMD criteria for osteoporosis.
The prevalence of vertebral fractures in this study was lower than in some prior studies, likely due in part to the rigorous methodology for defining fractures. In many prior publications, visual assessments for degenerative change or non-fracture deformities were conducted in a subset or not at all;37,40 however, in studies which included stricter criteria, fracture rates were similar to those seen here.25, 44, 57 Additionally, this study focused on a younger segment of the US population, (mean age ~57 years, with >70% aged ≤65 years), compared with many prior studies. Both SOF and a UK study, which enrolled women aged ≥65, found 20% vertebral fracture prevalence.37,42 In another study, where all participants were women ≥75, prevalence was 14%, similar to the rate seen in our study in that age group.25 For studies which included a broad age range of participants, spine fracture prevalence increased from age 50 to 80.40,43,57 Most studies were performed outside the US, and so findings may not be directly comparable to ours, since genetic, ethnic, geographic and other factors may play a role in vertebral fracture occurrence. Moreover, this study determined vertebral fracture prevalence more recently than many prior studies. It is possible that vertebral fracture prevalence has declined, similarly to the decline in hip fracture incidence since the 1990s.58–60
In this study, a gold-standard radiologist endeavored to differentiate fractures from non-fracture deformities such as stress and degenerative remodeling. These latter deformities often occur at T7-T8 and T12-L1 where flexion compression force may be maximal, and suggest a chronic or intermittent stress-related phenomenon, rather than an acute fracture .61 Although discrimination of fracture from non-fracture deformities by readers with less expertise is challenging, multiple negative consequences have been associated with vertebral fractures defined by a variety of methodologies, usually with criteria less strict than those in this study.19–22,24–25,37,62 The clinical and prognostic significance of vertebral deformities by our strict criteria might be even more important. Further studies of the clinical and prognostic consequences of nonfracture vertebral deformities are warranted.
Over 90% of subjects who had a positive VFA diagnosis did not self-report a fracture and most subjects who self-reported a fracture did not have a VFA diagnosis. In another study, 93% of subjects with radiographic vertebral fractures were unaware of the fracture and among subjects who reported a vertebral fracture, 79% were found to have a radiographic vertebral fracture by morphometric analysis63 Most patients diagnosed with either morphometric or symptomatic vertebral fracture would be recommended for osteoporosis treatment based on current guidelines.34–36,64 Furthermore, the choice of therapeutic agent might differ after the diagnosis of vertebral fracture compared to a BMD diagnosis alone, since vertebral fractures suggest a much higher risk for fracture at any BMD.62
The prevalence of vertebral fracture was 14.0% (1 in 7 individuals) in those individuals who met NOF Clinician’s Guide criteria for routine screening vertebral imaging based on age and BMD or on previous fragility fracture34, compared to 4.7% in those who did not meet criteria. Vertebral fractures are associated with an increased risk (2-5 fold) for subsequent vertebral and other fractures;62 indeed, a high proportion (perhaps up to 50%) of patients with acute hip fracture have vertebral fractures found on routine spine imaging.66 Identifying the spine fracture and making appropriate interventions could potentially reduce the risk of having a subsequent hip fracture.
In those aged <50, very few of the females but approximately 3.5% of the males had vertebral fractures. The cause of the fractures in younger males is unknown, although athletic trauma or repetitive stress are possible etiologies. It is also conceivable that some of these subjects may have had glucocorticoid exposure during young adulthood, as glucocorticoids are known to contribute risk for fracture independently of BMD.67
This study has several strengths. It is the first to assess the prevalence of vertebral fractures by VFA in a nationally representative sample that included men and nonwhite groups. Strict criteria were utilized for diagnosis. A large body of additional information including multisite BMD assessment and fracture history were collected. However, the study also has some limitations. VFA was conducted rather than the usual conventional lateral radiographs, which in some reports12,15 has lower sensitivity and perhaps specificity, particularly for discriminating mild fractures from non-fracture deformities and normal vertebrae. Our radiologic re-read improved specificity but could not impact sensitivity, as negative VFA results were not re-analyzed. At the time this study was performed, it was not possible to completely assess the prevalence in those eligible for VFA imaging by NOF criteria, because not all of the necessary data were available. Data on use of bone active medications was also not yet available. Another limitation is potential nonresponse bias in the estimates presented. However, results from the analyses that were re-weighted to address nonresponse were similar to those obtained when the publicly-released sample weights were used, which suggests that non-response bias associated with these particular demographic variables is unlikely. Another limitation is lower statistical reliability of some of the estimates, as evidenced by wide confidence intervals. Finally, institutionalized persons, a group with a high prevalence of osteoporosis,68 were not part of the NHANES design and therefore were not included.
In conclusion, this study suggests that objective assessments with spine imaging are required for identifying subjects with vertebral fractures. The prevalence of vertebral fracture was three-fold higher in individuals who met NOF screening criteria based on age and BMD or on previous fracture34.
Acknowledgements
Financial support for the collection of osteoporosis-related data in NHANES 2013-2014 was provided by Eli Lilly through a grant to the CDC Foundation. Eli Lilly had no role in the collection of the data or the production of the public use datasets.
Financial Disclosure
Drs. Cosman, Looker, Schousboe, Fan, Sarafrazi Isfahani, and Shepherd have no financial disclosures. Drs. Krege and Krohn are employees and stockholders of Eli Lilly and Company. Dr. Steiger is a stockholder of Optasia Medical. Dr. Wilson is an employee and stockholder of Hologic, Inc. Dr. Genant is a consultant to Lilly, Amgen, Merck, Janssen, Regeneron, Medtronic, AgNovos, BioMarin, Medimune, and BioClinica.
Footnotes
Publisher's Disclaimer: Required disclaimer: The findings and conclusions in this report are those of the authors and not necessarily those of the Centers for Disease Control and Prevention.
Contributor Information
Felicia Cosman, Helen Hayes Hospital, West Haverstraw, NY, USA and Department of Medicine, Columbia University College of Physicians and Surgeons, NY, USA.
John H Krege, Eli Lilly and Company, Indianapolis, IN, USA.
Anne C Looker, National Center for Health Statistics, Centers for Disease Control and Prevention, Hyattsville, MD, USA.
John T Schousboe, HealthPartners Institute and Park Nicollet Clinic, HealthPartners, Minneapolis, MN 55416, USA.
Bo Fan, Department of Radiology, University of California, San Francisco, CA, USA.
Neda Sarafrazi Isfahani, National Center for Health Statistics, Centers for Disease Control and Prevention, Hyattsville, MD, USA.
John A Shepherd, Department of Radiology, University of California, San Francisco, CA, USA.
Kelly D Krohn, Eli Lilly and Company, Indianapolis, IN, USA.
Peter Steiger, Parexel International, Waltham, MA USA.
Kevin E Wilson, Hologic, Inc., Marlborough, MA, USA.
Harry K Genant, Department of Radiology, University of California, San Francisco, CA, USA.
REFERENCES
- 1.Burge R, Dawson-Hughes B, Solomon DH, Wong JB, King A, Tosteson A. Economic burden of osteoporosis-related fractures in the United States, 2005-2025. J Bone Miner Res 2007; 22:465–75. [DOI] [PubMed] [Google Scholar]
- 2.Andrade SE, Majumdar SR, Chan KA, Buist DS, Go AS, Goodman M, Smith DH, Platt R, Gurwitz JH. Low frequency of treatment of osteoporosis among postmenopausal women following a fracture. Arch Intern Med. 2003. September 22;163(17):2052–7. [DOI] [PubMed] [Google Scholar]
- 3.Feldstein AC, Nichols GA, Elmer PJ, Smith DH, Aickin M, Herson M. Older women with fractures: Patients falling through the cracks of guideline-recommended osteoporosis screening and treatment. J Bone Joint Surg Am 2003. December;85-A(12):2294–302. [PubMed] [Google Scholar]
- 4.Formiga F, Rivera A, Nolla JM, Coscujuela A, Sole A, Pufol R. (2005) Failure to treat osteoporosis and the risk of subsequent fractures I elderly patients with previous hip fracture: a five-year retrospective study. Aging Clin Exp Res 1&: 96–9. [DOI] [PubMed] [Google Scholar]
- 5.Gehlbach SH, Bigelow C, Heimisdottir M, May S, Walker M, Kirkwood JR. Recognition of vertebral fracture in a clinical setting. Osteoporos Int 11:577–82, 2000. [DOI] [PubMed] [Google Scholar]
- 6.Kamel HK, Hussain MS, Tariq S, Perry HM, Morley JE. Failure to diagnose and treat osteoporosis in elderly patients hospitalized with hip fracture. Am J Med 2000. September;109(4):326–8. [DOI] [PubMed] [Google Scholar]
- 7.Kiebzak GM, Beinart GA, Perser K, Ambrose CG, Siff SJ, Heggeness MH. Undertreatment of osteoporosis in men with hip fracture. Arch Intern Med. 2002;October 28;162(19):2217–22. [DOI] [PubMed] [Google Scholar]
- 8.Solomon DH, Levin E, Helfgott SM. Patterns of medication use before and after bone densitometry: Factors associated with appropriate treatment. J Rheumatol 2000;27:1496–500 [PubMed] [Google Scholar]
- 9.Solomon DH, Johnston SS, Boytsov NN, McMorrow D, Lane JM, Krohn KD. Osteoporosis medication use after hip fracture in U.S. patients between 2002 and 2011. J Bone Miner Res 2014; 29:1929–37. [DOI] [PMC free article] [PubMed] [Google Scholar]
- 10.U.S. Department of Health and Human Services. Bone Health and Osteoporosis: A Report of the Surgeon General. Rockville, MD: U.S. Department of Health and Human Services, Office of the Surgeon General, 2004. [Google Scholar]
- 11.Schousboe JT, Debold CR (2006) Reliability and accuracy of vertebral fracture assessment with densitometry compared to radiography in clinical practice. Osteoporos Int 17:281–289 [DOI] [PubMed] [Google Scholar]
- 12.Hospers IC, Van der Laan JG, Zeebregts CJ, Nieboer P, Wolfenbuttel BHR, Dierckx RA, Kreeftenberg HG, Jager PL, Slart RHJA. Vertebral fracture assessment in supine position: Comparison by using conventional semiquantitative radiography and visual radiography. Radiology 251: 822–8, 2009. [DOI] [PubMed] [Google Scholar]
- 13.Fuerst T, Wu C, Genant HK, von Ingersleben G, Chen Y, Johnston C, Econs MJ, Binkley N, Vokes TJ, Crans G, Mitlak BH (2009) Evaluation of vertebral fracture assessment by dual X-ray absorptiometry in a multicenter setting. Osteoporos Int 20:1199–1205 [DOI] [PubMed] [Google Scholar]
- 14.Damiano J, Kolta S, Porcher R, Tournoux C, Dougados M, Roux C (2006) Diagnosis of vertebral fractures by vertebral fracture assessment. J Clin Densitom 9:66–71 [DOI] [PubMed] [Google Scholar]
- 15.Ferrar L, Jiang G, Schousboe JT, DeBold CR, Eastell R (2008) Algorithm-based qualitative and semiquantitative identification of prevalent vertebral fracture: agreement between different readers, imaging modalities, and diagnostic approaches. J Bone Miner Res 23:417–424 [DOI] [PubMed] [Google Scholar]
- 16.Vokes TJ, Dixon LB, Favus MJ. Clinical utility of dual-energy vertebral assessment (DVA). Osteoporos Int 2003; 14:871–878 [DOI] [PubMed] [Google Scholar]
- 17.Rea JA, Li J, Blake GM, Steiger P, Genant HK, Fogelman I (2000) Visual assessment of vertebral deformity by X-ray absorptiometry: a highly predictive method to exclude vertebral deformity. Osteoporos Int 11:660–668 [DOI] [PubMed] [Google Scholar]
- 18.Schousboe JT, Vokes T, Broy SB, Ferrar L, McKiernan F, Roux C, Binkley N. Vertebral fracture assessment: the 2007 ISCD official positions. J Clin Densitom. 11: 92–108, 2008. [DOI] [PubMed] [Google Scholar]
- 19.Cauley JA, Thompson DE, Ensrud KC, Scott JC, Black D. Risk of mortality following clinical fractures. Osteoporos Int 2000, 11:556–61 [DOI] [PubMed] [Google Scholar]
- 20.Ensrud KE, Thompson DE, Cauley JA, Nevitt MC, Kado DM, Hochberg MC, Santora AC 2nd, Black DM. Prevalent vertebral deformities predict mortality and hospitalization in older women with low bone mass. Fracture Intervention Trial Research Group. J Am Geriatr Soc 2000; 48:241–9 [DOI] [PubMed] [Google Scholar]
- 21.Krege JH, Kendler D, Krohn K, Genant H, Alam J, Berclaz P-Y, Coffey B, Loghin C. Relationship Between Vertebral Fracture Burden, Height Loss, and Pulmonary Function in Postmenopausal Women with Osteoporosis. J Clin Densitom 2015;18:506–11. [DOI] [PubMed] [Google Scholar]
- 22.Lips P, Cooper C, Agnusdei D, Caulin F, Egger P, Johnell O, Kanis JA, Kellingray S, Leplege A, Liberman UA, McCloskey E, Minne H, Reeve J, Reginster JY, Scholz M, Todd C, de Vernejoul MC, Wiklund I. Quality of life in patients with vertebral fractures: validation of the Quality of Life Questionnaire of the European Foundation for Osteoporosis (QUALEFFO). Working Party for Quality of Life of the European Foundation for Osteoporosis. Osteoporosis Int 1999;10:150- [DOI] [PubMed] [Google Scholar]
- 23.Sontag A, Krege JH. First Fractures Among Postmenopausal Women with Osteoporosis. Journal of Bone and Mineral Metabolism 2010; 28: 485–8. DOI 10.1007/s00774-009-0144-9. [DOI] [PubMed] [Google Scholar]
- 24.Ferrar L, Roux C, Felsenberg D, Gluer CC, Eastell R (2011) Association between incident and baseline vertebral fractures in European women: vertebral fracture assessment in the Osteoporosis and Ultrasound Study (OPUS). Osteoporos Int 2011 [DOI] [PubMed] [Google Scholar]
- 25.McCloskey EV, Vasireddy S, Threlkeld J, Eastaugh J, Parry A, Bonnet N, Beneton M, Kanis JA, Charlesworth D (2008) Vertebral fracture assessment (VFA) with a densitometer predicts future fractures in elderly women unselected for osteoporosis. J Bone Miner Res 23:1561–1568 [DOI] [PubMed] [Google Scholar]
- 26.Neer RM, Arnaud CD, Zanchetta JR et al. (2001) Effect of parathyroid hormone (1-34) on fractures and bone mineral density in postmenopausal women with osteoporosis. N Engl J Med 344:1434–1441 [DOI] [PubMed] [Google Scholar]
- 27.Black DM, Cummings SR, Karpf DB, et al. Randomised trial of effect of alendronate on risk of fracture in women with existing vertebral fractures. Lancet 1996;348:1535–41 [DOI] [PubMed] [Google Scholar]
- 28.Harris ST, Watts NB, Genant HK, et al. Effects of risedronate treatment on vertebral and nonvertebral fractures in women with postmenopausal osteoporosis: a randomized controlled trial. Vertebral Efficacy With Risedronate Therapy (VERT) Study Group. JAMA 1999;282:1344–52 [DOI] [PubMed] [Google Scholar]
- 29.Reginster J, Minne HW, Sorensen OH, et al. Randomized trial of the effects of risedronate on vertebral fractures in women with established postmenopausal osteoporosis. Vertebral Efficacy with Risedronate Therapy (VERT) Study Group. Osteoporos Int 2000;11:83–91 [DOI] [PubMed] [Google Scholar]
- 30.Ettinger B, Black DM, Mitlak BH, et al. Reduction of vertebral fracture risk in postmenopausal women with osteoporosis treated with raloxifene: results from a 3-year randomized clinical trial. JAMA 1999;282:637–45 [DOI] [PubMed] [Google Scholar]
- 31.Chesnut III CH, Skag A, Christiansen C, et al. Effects of oral ibandronate administered daily or intermittently on fracture risk in postmenopausal osteoporosis. J Bone Miner Res 2004; 19:1241–9. [DOI] [PubMed] [Google Scholar]
- 32.Black DM, Delmas PD, Eastell R, et al. HORIZON Pivotal Fracture Trial. Once-yearly zoledronic acid for treatment of postmenopausal osteoporosis. N Engl J Med 2007;356:1809–22 [DOI] [PubMed] [Google Scholar]
- 33.Cummings SR, Martin JS, McClung MR, Siris ES, Eastell R, Reid IR, Delmas P, Zoog HB, Austin M, Wang A, Kutilek S, Adami S, Zanchetta J, Libanati C, Siddhanti S, Christiansen C. Denosumab for Prevention of Fractures in Postmenopausal Women with Osteoporosis. N Engl J Med 2009;361:756–65. [DOI] [PubMed] [Google Scholar]
- 34.Cosman F, deBeur SJ, LeBoff MS, Lewiecki EM, Tanner B, Randall S, Lindsay R. Clinicians’ guide to prevention and treatment of osteoporosis. Osteoporos Int 2014;25:2359–81. [DOI] [PMC free article] [PubMed] [Google Scholar]
- 35.Watts N, Bilezikian JP, Camacho PM, Greenspan SL, Harris ST, Hodgson SF, Kleerekoper M, Luckey MM, McClung MR, Pollack RP, Petak SM. American Association of Clinical Endocrinologists medical guidelines for clinicfal practice for the diagnosis and treatment of postmenopausal osteoporosis. Endocrine Practice 2010; 16(Suppl 3):1–37. [DOI] [PMC free article] [PubMed] [Google Scholar]
- 36.Kanis JA, McCloskey EV, Johansson H, Cooper C, Rizzoli R, Reginster J-Y, on behalf of the Scientific Advisory Board of the European Society for Clinical and Economic Aspects of Osteoporosis and Osteoarthritis (ESCEO) and the Committee of Scientific Advisors of the International Osteoporosis Foundation (IOF). Osteoporos Int 2013. January;24(1):23–57. doi: 10.1007/s00198-012-2074-y. Epub 2012 Oct 19 [DOI] [PMC free article] [PubMed] [Google Scholar]
- 37.Black DM, Arden NK, Palermo L, Pearson J, Cummings SR for the Study of Osteoporotic Fractures Research Group. Prevalent Vertebral Deformities Predict Hip Fractures and New Vertebral Deformities but Not Wrist Fractures. J Bone Miner Res 1999;14:821–828. [DOI] [PubMed] [Google Scholar]
- 38.Genant HK, Wu CY, van Kuijk C, Nevitt MC. 1993. Vertebral fracture assessment using a semiquantitative technique. J Bone Miner Res 8:1137–48. [DOI] [PubMed] [Google Scholar]
- 39.Samelson EJ, Hannan MT, Zhang Y, Genant HK, Felson DT, Kiel DP. Incidence and risk factors for vertebral fracture in women and men: 25-year follow-up results from the population-based Framingham Study. J Bone Mineral Res 2006; 21:1207–14. [DOI] [PubMed] [Google Scholar]
- 40.Jackson SA, Tenenhouse A, Robertson L and the CaMos Study Group. Vertebral fracture definition from population-based data: preliminary results from the Canadian Multicenter Osteoporosis Study (CaMos). Osteoporos Int 2000;680–7. [DOI] [PubMed] [Google Scholar]
- 41.O’Neill TW, Felsenberg D, Varlow J, Cooper C, Kanis JA, Silman AJ, The European Vertebral Osteoporosis Study Group. The prevalence of vertebral deformity in European men and women: The European Vertebral Osteoporosis Study. J Bone Mineral Res 1996; 11: 1010–8. [DOI] [PubMed] [Google Scholar]
- 42.Middleton ET, Steel SA. Routine versus targeted vertebral fracture assessment for the detection of vertebral fractures. Osteoporos Int (2008) 19:1167–1173. DOI 10.1007/s00198-007-0548-0 [DOI] [PubMed] [Google Scholar]
- 43.Sanfelix-Genoves J, Reig-Molla B, Sanfelix-Gemeno G, Peiro S, Graells-Ferrer M, Vega-Martinez M, Giner V. The population-based prevalence of osteoporotic vertebral fracture and densitometric osteoporosis in postmenopausal women over 50 in Valencia, Spain (the FRAVO Study). Bone 2010;47:610–16. [DOI] [PubMed] [Google Scholar]
- 44.Kanterewicz E, Puigoriol E, Garcia-Barrionuevo J, del Rio L, Casellas M, Peris P, Frodos Research Group. Prevalence of vertebral fractures and minor vertebral deformities evaluated by DXA-assisted vertebral fracture assessment (VFA) in a population-based study of postmenopausal women: the FRODOS study. Osteoporos Int 2014;25:1455–64. [DOI] [PubMed] [Google Scholar]
- 45.Fujiwara S, Hamaya E, Goto W, Masunari N, Furukawa K, Fukunaga M, Nakamura T, Miyauchi A, Chen P. Vertebral fracture status and the World Health Organization risk factors for predicting osteoporotic fracture risk in Japan. Bone 2011;49:520–5. [DOI] [PubMed] [Google Scholar]
- 46.Looker AC, Wahner HW, Dunn WL, Calvo MS, Harris TB, Heyse SP, Johnston CC, Lindsay R. Updated data on proximal femur bone mineral levels of US adults. Osteoporos Int 1998;8:468–89 [DOI] [PubMed] [Google Scholar]
- 47.Zipf GCM, Porter KS, Ostchega Y, Lewis BG, Dostal J (2013) National Health and Nutrition Examination Survey: Plan and Operations, 1999–2010. National Center for Health Statistics, Hyattsville, MD: [PubMed] [Google Scholar]
- 48.Johnson CL, Dohrmann SM, Burt VL, Mohadjer LK. National Health and Nutrition Examination Survey: Sample design, 2011-2014. National Center for Health Statistics. Vital Health Stat 2(162). 2014. [PubMed] [Google Scholar]
- 49.Centers for Disease Control and Prevention, National Center for Health Statistics. National Health and Nutrition Examination Survey Body Composition Procedure Manual: US Department of Health and Human Services, Centers for Disease Control and Prevention; 2013. Available at: http://www.cdc.gov/nchs/data/nhanes/nhanes_13_14/2013_Body_Composition_DXA.pdf [Google Scholar]
- 50.Centers for Disease Control and Prevention, National Center for Health Statistics. National Health and Nutrition Examination Survey 2013-2014 Data Documentation, Codebook, and Frequencies –Spine Dual-energy X-ray Absorptimetry (DXA) Procedure Manual Hyattsville, MD: US Department of Health and Human Services, Centers for Disease Control and Prevention; 2007. [cited 2011 May 5]. Available from: http://www.cdc.gov/nchs/data/nhanes/nhanes_07_08/manual_dexa.pdf. [Google Scholar]
- 51.Centers for Disease Control and Prevention National Center for Health Statistics (2015) 2013-2014 Data Documentation, Codebook, and Frequences: Dual-energy X-ray absorptiometry -- Spine (DXXSPN_H). https://wwwn.cdc.gov/Nchs/Nhanes/2013-2014/DXXSPN_H.htm
- 52.Centers for Disease Control and Prevention National Center for Health Statistics (2015) 2013-2014 Data Documentation, Codebook, and Frequences: Dual-energy X-ray absorptiometry -- Femur (DXXFEM_H). https://wwwn.cdc.gov/Nchs/Nhanes/2013-2014/DXXFEM_H.htm
- 53.2013 International Society for Clinical Densitometry Position Development Conference: Task Force on Normative Databases. Watts NB, Leslie WD, Foldes AJ, Miller PD. J Clin Densitom. 2013. Oct-Dec;16(4):472–81. doi: 10.1016/j.jocd.2013.08.001. Epub 2013 Sep 26 Review. [DOI] [PubMed] [Google Scholar]
- 54.Kanis JA, on behalf of the World Health Organisation Scientific Group. Assessment of osteoporosis at the primary health care level. WHO Collaborating Centre for Metabolic Bone Diseases, University of Sheffield 2007. Available at: http://www.shef.ac.uk/FRAX/pdfs/WHO_Technical_Report.pdf [Google Scholar]
- 55.Korn EL, Graubard BI. Confidence intervals for proportions with small expected number of positive counts estimated from survey data. Survey Methodology 1998; 24:193–201. [Google Scholar]
- 56.Wainwright SA, Marshall LM, Ensrud KE, Cauley JA, Black DM, Hillier TA, Hochberg MC, Vogt MT, Orwoll ES, for the Study of Osteoporotic Fractures Research Group. Hip fracture in women without osteoporosis. J Clin Endocrinol Metab 2005;90:2787–93. [DOI] [PubMed] [Google Scholar]
- 57.Ismail AA, Cooper C, Felsenberg D, Varlow J, Kanis JA, Silman AJ, O’Neill TW. Number and type of vertebral deformities: epidemiological characteristics and relation to back pain and height loss. European Vertebral Osteoporosis Study Group. Osteoporos Int. 1999;9(3):206–13. [DOI] [PubMed] [Google Scholar]
- 58.Brauer CA, Coca-Perraillon M, Cutler DM, Rosen AB: Incidence and mortality of hip fractures in the United States. JAMA 2009. October 14;302(14):1573–1579. doi: 10.1001/jama.2009.1462. [DOI] [PMC free article] [PubMed] [Google Scholar]
- 59.Stevens JA, Rudd RA. Declining hip fracture rates in the United States. Age Ageing 2010; 39 (4): 500–503. [DOI] [PubMed] [Google Scholar]
- 60.Wright NC, Saag KG, Curtis JR, et al. : Recent trends in hip fracture rates by race/ethnicity among older US adults. J Bone Miner Res 2012. November;27(11):2325–2332. doi: 10.1002/jbmr.1684 [DOI] [PubMed] [Google Scholar]
- 61.Yu W, Lin Q, Zhou X, Shao H, Sun P. Reconsideration of the relevance of mild wedge or short vertebral height deformities across a broad age distribution. Osteoporos Int 2014;25:2609–15. [DOI] [PubMed] [Google Scholar]
- 62.Siris ES, Genant HK, Laster AJ, Chen P, Misurski DA, Krege JH. Enhanced Prediction of Fracture Risk Combining Vertebral Fracture Status and BMD. Osteoporosis International 18(6):761–70, 2007 [DOI] [PubMed] [Google Scholar]
- 63.Krege JH, Wan X, Lentle BC, Berger C, Langsetmo L, Adachi JD, Prior JC, Tenenhouse A, Brown JP, Kreiger N, Olyzynski WP, Josse RG, Goltzman D. Fracture risk prediction: importance of age, BMD, and spine fracture status. BoneKEy Reports 2013. September 4;2:404. doi: 10.1038/bonekey.2013.138. [DOI] [PMC free article] [PubMed] [Google Scholar]
- 64.Siris ES, Adler R, Bilezikian J, Boognese M, Dawson-Hughes B, Favus MJ, Harris ST, Jan de Beur SM, Khosla S, Lane NE, Lindsay R, Nana AD, Orwoll ES, Saag K, Silverman S, Watts NB. The clinical diagnosis of osteoporosis: a position statement from the National Bone Health Alliance Working Group. Osteoporos Int 2014; 25:1439–43. [DOI] [PMC free article] [PubMed] [Google Scholar]
- 65.NHS Breast Screening Programme. http://www.hscic.gov.uk/catalogue/PUB13567/bres-scre-prog-eng-2012-13-rep.pdf.
- 66.Gallacher SJ, Gallagher AP, McQuillian C, Mitchell PJ, Dixon T. The prevalence of vertebral fracture amongst patients presenting with non-vertebral fractures. Osteoporos Int. 2007;18(2):185–92. [DOI] [PMC free article] [PubMed] [Google Scholar]
- 67.Van Staa TP, Laan RF, Barton IP, Cohen S, Reid DM, Cooper C. Bone density threshold and other predictors of vertebral fracture in patients receiving oral glucocorticoid therapy. Arthritis Rheum 2003; 48(11):3224–3229. [DOI] [PubMed] [Google Scholar]
- 68.Zimmerman SI, Girman CJ, Buie VC, Chandler J, Hawkes W, Martin A, Holder L, Hebel JR, Sloane PD, Magaziner J (1999) The prevalence of osteoporosis in nursing home residents. Osteoporos Int 9:151–157. [DOI] [PubMed] [Google Scholar]