

Abstract
Background
Smokeless tobacco (ST) is consumed by more than 300 million people worldwide. The distribution, determinants and health risks of ST differ from that of smoking; hence, there is a need to highlight its distinct health impact. We present the latest estimates of the global burden of disease due to ST use.
Methods
The ST-related disease burden was estimated for all countries reporting its use among adults. Using systematic searches, we first identified country-specific prevalence of ST use in men and women. We then revised our previously published disease risk estimates for oral, pharyngeal and oesophageal cancers and cardiovascular diseases by updating our systematic reviews and meta-analyses of observational studies. The updated country-specific prevalence of ST and disease risk estimates, including data up to 2019, allowed us to revise the population attributable fraction (PAF) for ST for each country. Finally, we estimated the disease burden attributable to ST for each country as a proportion of the DALYs lost and deaths reported in the 2017 Global Burden of Disease study.
Results
ST use in adults was reported in 127 countries; the highest rates of consumption were in South and Southeast Asia. The risk estimates for cancers were also highest in this region. In 2017, at least 2.5 million DALYs and 90,791 lives were lost across the globe due to oral, pharyngeal and oesophageal cancers that can be attributed to ST. Based on risk estimates obtained from the INTERHEART study, over 6 million DALYs and 258,006 lives were lost from ischaemic heart disease that can be attributed to ST. Three-quarters of the ST-related disease burden was among men. Geographically, > 85% of the ST-related burden was in South and Southeast Asia, India accounting for 70%, Pakistan for 7% and Bangladesh for 5% DALYs lost.
Conclusions
ST is used across the globe and poses a major public health threat predominantly in South and Southeast Asia. While our disease risk estimates are based on a limited evidence of modest quality, the likely ST-related disease burden is substantial. In high-burden countries, ST use needs to be regulated through comprehensive implementation of the World Health Organization Framework Convention for Tobacco Control.
Keywords: Cancer, Chewing, Ischaemic heart disease, Mouth, Oral, Oesophagus, Pharynx, Smokeless tobacco
Background
Smokeless tobacco (ST) refers to various tobacco-containing products that are consumed by chewing, keeping in the mouth or sniffing, rather than smoking [1]. ST products of many different sorts are used by people in every inhabited continent of the world (Table 1) [1]. For example, in Africa, toombak and snuff are commonly used, while in South America, chimó is the product of choice. In Australia, indigenous people use pituri or mingkulpa [2], and in Central Asia, nasvay consumption is very common. In North America, plug or snuff are favoured, and even in Western Europe, where ST products are largely banned, there are exemptions allowing people in Nordic countries to use snus [3]. All the above products vary in their preparation methods, composition and associated health risks (Table 1), but it is in South and Southeast Asia where the greatest diversity of ST products exists, accompanied by the highest prevalence of use [4]. Here, the level of cultural acceptability is such that ST products are often served like confectionery at weddings and other social occasions.
Table 1.
Smokeless tobacco products consumed most commonly across the world
| Smokeless tobacco products | Regions (WHO) | Countries (highest consumption) | Other ingredients | Preparation and use | pHa | Nicotinea (mg/g) | Total TSNAa (ng/g) |
|---|---|---|---|---|---|---|---|
| Snus (Swedish) | Europe (region A) | Nordic countries (Denmark, Finland, Iceland, Norway, Sweden) | Water, sodium carbonate, sodium chloride, moisturisers, flavouring | A heat treatment process; placed between the gum and upper lip | 6.6–7.2 | 7.8–15.2 | 601–723 |
| Plug, Snuff (US), Snus (US) | Americas (regions A and B) | The USA, Canada, Mexico | Sweeteners, liquorice | Plug; air cured | 4.7–7.8 | 3.9–40.1 | 313–76,500 |
| Dry or moist snuff; finely ground and fire cured | |||||||
| Snus; steam cured | |||||||
| Snuff; kept between lip and gum, dry snuff can be inhaled too | |||||||
| Chimó | Americas (region B) | Venezuela, Colombia | Sodium bicarbonate, brown sugar, Mamo’n tree ashes | Tobacco paste made from tobacco leaves; placed between the lip or cheek and gum and left there for some time | 6.9–9.4 | 5.3–30.1 | 9390 |
| Nass (Naswar) | Europe (region B) and Eastern Mediterranean (region D) | Uzbekistan, Kyrgyzstan, Tajikistan, Afghanistan, Pakistan, Iran | Lime, ash, flavourings (cardamom), indigo | Sundried and powdered; placed between lip or cheek and gum | 8.4–9.1 | 8.9–14.2 | 478–1380 |
| Toombak | Eastern Mediterranean (region D) and Africa (region D) | Sudan, Chad | Mixed with moist sodium bicarbonate | Fermented and grounded; placed and kept in mouth | 7.3–10.1 | 9.6–28.2 | 295,000–992,000 |
| Snuff (North and West African) | Africa (region D) | Nigeria, Ghana, Algeria, Cameroon, Chad, Senegal | Dried tobacco leaves mixed with potassium nitrate and other salts | Dry snuff; finely ground and inhaled as a pinch | 9.0–9.4 | 2.5–7.4 | 1520–2420 |
| Moist snuff is placed in mouth | |||||||
| Snuff (South African) | Africa (region E) | South Africa | Dried tobacco leaves mixed with ash | Dry snuff; finely ground and inhaled as a pinch | 6.5–10.1 | 1.2–17.2 | 1710–20,500 |
| Khaini | South East Asia (regions B and D),Western Pacific (region B), Eastern Mediterranean (region D), and Europe (region A) | India, Bangladesh, Nepal, Bhutan | Slaked lime, menthol, flavourings, areca nut | Shredded; kept in mouth between lips and gum | 9.6–9.8 | 2.5–4.8 | 21,600–23,900 |
| Zarda | Bangladesh, India, Pakistan, Myanmar, Thailand, Indonesia, Nepal, Maldives, Sri Lanka, UK | Served wrapped in a betel leaf with lime, catechu, areca nuts | Shredded tobacco leaves are boiled with lime and saffron; the mixture is dried then chewed and spat | 5.2–6.5 | 9.5–30.4 | 5490–53,700 | |
| Gutkha | India, Pakistan, Bangladesh, Nepal, Myanmar, Sri Lanka, UK | Betel nut, catechu, flavourings, sweeteners | Commercially manufactured; sucked, chewed, and spat | 7.4–8.9 | 0.2–4.2 | 83–23,900 | |
| Afzal | Eastern Mediterranean (region B) | Oman | Dried tobacco mixed with various additives | Fermented; kept in mouth between lips and gums, users suck the juice, and spit out the rest | 10.4 | 48.7 | 3573 |
| Iq’mik | Americas (region A) | The USA | Tobacco combined with fungus or plant ash | Involves a burning process to make fungus ash; chewed | 11.0 | 35.0–43.0 | 15–4910 |
| Rapé | Americas (region B) | Brazil | Tobacco mixed with finely ground plant materials (tonka bean, cinnamon, clove buds, etc.) or alkaline ashes | Nasal snuff; air cured or heated, then pulverised, finely sifted, and mixed | 5.2–10.2 | 6.3–47.6 | 88–24,200 |
| Pituri/Mingkulpa | Western Pacific (region B) | Australia | Tobacco mixed with wood ash | Chewed as quid, kept in mouth and/or held against skin | 5.47–11.6 | 4.8 | 15,280 |
ST products contain nicotine and are highly addictive. Often, they also contain carcinogens, such as tobacco-specific nitrosamines (TSNA), arsenic, beryllium, cadmium, nickel, chromium, nitrite and nitrate, in varying levels depending on the product [5, 6]. The pH of the products also varies widely, with some (e.g. khaini, zarda) listing slaked lime among their ingredients [7]. Raising the pH in this way increases the absorption of nicotine and enhances the experience of using the ST product, increasing the likelihood of dependence. The elevated pH also increases the absorption of carcinogens, leading to higher toxicity and greater risk of harm [7].
The harmful nature of many ST products, and the fact that 300 million people around the world use ST [8], make ST consumption a global public health issue. Many ST products lead to different types of head and neck cancers [9, 10]. An increased risk of cardiovascular deaths has been reported [11], and its use in pregnancy is associated with stillbirths and low birth weight [12, 13].
Because of the diversity described above, ST should not be considered as a single product, but rather as groups of products with differences in their toxicity and addictiveness, depending on their composition. As a consequence, it is difficult to estimate the global risks of ST to human health and to agree on international policies for ST prevention and control. Several country-specific studies [14, 15] have been carried out, and in 2015, we published an estimate of the global burden of disease associated with ST use [16]. We used a novel approach, whereby we classified ST products according to their availability in different geographical regions of the world. For example, ST products in South Asia pose a much greater risk to health than those available in Nordic countries, where the manufacturing process removes many of the toxins from the finished product [6, 17]. Using this approach, we estimated the worldwide burden of disease attributable to ST consumption, measured in terms of disability adjusted life years (DALYs) lost and the numbers of deaths in 2010 [16]. Here, we update this estimate to include data up to 2019, providing an indication of how the global ST arena has changed in the intervening years.
Methods
Our methods for updating the estimates of ST disease burden were broadly the same as those used in our earlier publication; these are well described elsewhere [16]. Here, we will summarise these methods and explain any modification made, particularly in relation to the revised timelines. We assessed disease burden for individual countries by varying their populations’ exposure to ST, using the comparative risk assessment method [15]. These individual estimates were then summarised for 14 World Health Organization (WHO) sub-regions (Additional file 1: Appendix 1) as well as for the world.
We first searched the literature to identify the latest point prevalence of ST use among adults ≥ 15 years in men and women for each country (see Additional file 1: Appendix 2 for detailed methods). We searched for the latest estimates for x countries included in our previous study as well as those additional y countries where estimates have been made available since 2014 for the first time. We derived single estimates for each country preferring nationally representative surveys using internationally comparable methods over non-standardised national or sub-national surveys.
We also updated risk estimates for individual diseases caused by ST; however, we kept to the original list of conditions, i.e. cancers of the oral cavity, pharynx and oesophagus, ischemic heart disease and stroke. We only searched for papers published since our last literature search; our updated search strategies can be found in Additional file 1: Appendix 3. As before, all searches and data extraction were independently scrutinised by a second researcher and any discrepancies were arbitrated by a third researcher. All case definitions for diseases and exposure (ST use) used in the retrieved articles were checked for accuracy and consistency and all analyses undertaken in these studies were assessed to see if they controlled for key confounders (mainly smoking and alcohol). We assessed study quality using the Newcastle-Ottawa Scale for assessing non-randomised studies in meta-analysis [24]. For all new studies, we log transformed their risk estimates and 95% confidence intervals to effect sizes and standard errors and added these to the rerun of our random-effects meta-analyses to estimate pooled risk estimates for individual conditions. Where possible, we pooled effect sizes to obtain country-specific risk estimates. For all outcomes in the meta-analyses, we conducted a GRADE assessment to assess the quality of evidence. We also pooled these effect sizes to obtain non-specific global risk estimates. Given that the risk varies from country to country, depending upon which products are locally popular, we used country-specific risk estimates where possible. In countries with no estimates, we used estimates of those countries where similar ST products were consumed. For other countries without estimates that consumed ST products known to contain high levels of TSNAs, we applied non-specific global estimates. Where no information was available on the composition of ST, we did not apply any estimates. Details on how these statistically significant estimates were applied to each WHO sub-region can be found in web Additional file 1: Appendix 4.
Based on the extent to which the included studies adjusted for potential confounders, we categorised them as ‘best-adjusted’ and ‘others’. We carried out a sensitivity analysis for all risks and attributable disease burden estimates including only ‘best-adjusted’ studies. A sensitivity analysis was also carried out by estimating risk estimates separating out cohort from case-control studies.
For each country, we used their point prevalence of ST use and the allocated risk estimate for each condition to estimate its population attributable fraction (PAF) as below:
Using the 2017 Global Burden of Disease (GBD) Study, we also extracted the total disease burden (B) in terms of number of deaths and DALYs lost due to the conditions associated with ST use for both men and women. The attributable burden (AB) due to ST was then estimated in deaths and DALYs lost for these conditions for both men and women using the following equation.
Results
ST consumption was reported in 127 countries (Fig. 1). These estimates were extracted from nationally representative cross-sectional surveys conducted either as part of international (97/127) or national (30/127) health and tobacco surveillance (Additional file 1: Appendix 5a). A variety of age ranges (as young as 15 or as old as 89, including no upper age limit) were used to define adults.
Fig. 1.

Smokeless tobacco prevalence among men and women
ST consumption was more common among males than females in 95 countries (Table 2). Among males, Myanmar (62.2%), Nepal (31.3%), India (29.6%), Bhutan (26.5%) and Sri Lanka (26.0%) had the highest consumption rates. Among females, Mauritania (28.3%), Timor Leste (26.8%), Bangladesh (24.8%), Myanmar (24.1%) and Madagascar (19.6%) had the highest consumption rates. Within Europe, Sweden (25.0% males, 7.0% females) and Norway (20.1% males, 6.0% females) had the highest ST (snus) consumption rates.
Table 2.
Prevalence of smokeless tobacco use (%) in different countries of the world according to WHO sub-regional classification
| WHO sub-regions | Country | M | F | Source | Year |
|---|---|---|---|---|---|
| Africa (region D) | Algeria* | 10 | 0.8 | Algeria Adult Tobacco Survey [25] | 2010 |
| Benin* | 9 | 3 | STEPS [26] | 2015 | |
| Burkina Faso* | 5.6 | 11.6 | STEPS [26] | 2013 | |
| Cameroon* | 2.2 | 3.8 | GATS [27] | 2013 | |
| Cape Verde | 3.5 | 5.8 | STEPS [26] | 2007* | |
| Chad | 1.9 | 0.4 | STEPS [26] | 2008 | |
| Comoros | 7.72 | 2.99 | DHS [28] | 2012 | |
| Gabon | 0.48 | 0.34 | DHS [28] | 2012 | |
| Gambia | 0.8 | 1.4 | STEPS [26] | 2010 * | |
| Ghana | 1.33 | 0.2 | DHS [28] | 2008 | |
| Guinea | 1.4 | 1.5 | STEPS [26] | 2009 | |
| Liberia* | 1.1 | 3.1 | STEPS [26] | 2011 | |
| Madagascar | 24.66 | 19.6 | DHS [28] | 2009 | |
| Mali | 5 | 1.2 | STEPS [26] | 2007 | |
| Mauritania | 5.7 | 28.3 | STEPS [26] | 2006 | |
| Niger | 4.55 | 2.3 | DHS [29] | 2012 | |
| Nigeria* | 2.9 | 0.9 | GATS [27] | 2012 | |
| Sao Tome & Principe | 3.8 | 1.9 | STEPS [26] | 2009 | |
| Senegal* | 0.3 | 1 | GATS [27] | 2015 | |
| Seychelles** | 0.3 | 0.4 | The Seychelles Heart Study IV [25] | 2013–14 | |
| Sierra Leone | 2.9 | 12.1 | STEPS [26] | 2009 | |
| Togo | 5.1 | 2.2 | STEPS [26] | 2010 | |
| Africa (region E) | *Botswana* | 1.5 | 6.5 | STEPS [26] | 2014 |
| *Burundi | 0.03 | 0.31 | DHS [28] | 2011 | |
| Congo (Brazzaville) | 8.3 | 1.54 | DHS [28] | 2012 | |
| Congo (Republic) | 8.67 | 3.22 | DHS [28] | 2013 | |
| Côte d’Ivoire | 0.61 | 1.27 | DHS [28] | 2012 | |
| Eritrea* | 11.6 | 0.1 | STEPS [26] | 2011 | |
| Ethiopia* | 2.6 | 0.8 | GATS [27] | 2016 | |
| Kenya* | 5.3 | 3.8 | GATS [27] | 2014 | |
| *Lesotho | 1.3 | 9.1 | DHS [29] | 2009 | |
| *Malawi | 1.9 | 5 | STEPS [26] | 2009 | |
| Mozambique | 10.94 | 0.82 | DHS [28] | 2011 | |
| Namibia | 1.8 | 2.3 | DHS [29] | 2006–07 | |
| Rwanda* | 0.6 | 3.3 | STEPS [26] | 2012 | |
| *South Africa* | 1.4 | 8.4 | South African Social Attitude Survey [25] | 2007 | |
| Swaziland* | 2.7 | 1.8 | STEPS [26] | 2014 * | |
| *Tanzania | 2.03 | 0.83 | DHS [28] | 2010 | |
| Uganda* | 1.7 | 3 | GATS [27] | 2013 | |
| Zambia* | 2.2 | 6.8 | STEPS [26] | 2017 | |
| Zimbabwe | 1.6 | 0.4 | DHS [30] | 2011 | |
| Americas (region A) | *Canada* | 0.8 | – | CTADS [31] | 2015* |
| USA | 6.5 | 0.4 | ICS [30] | 2010 | |
| Americas (region B) | Argentina | 0.1 | 0.2 | GATS [27] | 2012 |
| Barbados | 0 | 0.6 | STEPS [26] | 2007* | |
| *Brazil | 0.6 | 0.3 | GATS [27] | 2008 | |
| Costa Rica** | 0.1 | 0 | GATS [27] | 2015 | |
| Dominican Republic | 1.9 | 0.3 | DHS [29] | 2007* | |
| Grenada | 2.2 | 0.3 | STEPS [26] | 2011 | |
| Mexico* | 0.4 | 0 | GATS [27] | 2015 | |
| Panama** | 1 | 0.5 | GATS [27] | 2013 | |
| Paraguay | 3 | 1.6 | STEPS [25] | 2011 | |
| St Kitts & Nevisa | 0.3 | 0.1 | STEPS [26] | 2007 | |
| St Lucia** | 1.3 | 0.2 | STEPS [26] | 2012* | |
| Trinidad & Tobago | 0.5 | 0.3 | STEPS [26] | 2011 | |
| *Uruguay** | 0.3 | – | GATS [27] | 2009 | |
| Venezuela | 6.2 | 0.9 | National Survey of Drugs in the General Population [25] | 2011 | |
| Americas (region D) | Haiti | – | 2.5 | DHS [29] | 2005–06* |
| Eastern Mediterranean (region B) | Kuwait** | 0.5 | 0 | STEPS [26] | 2014 |
| Libya | 2.2 | 0.1 | STEPS [26] | 2009 | |
| Qatar** | 1.3 | 0 | GATS [27] | 2013 | |
| Saudi Arabia* | 1.5 | 0.3 | Saudi Health Information Survey [25] | 2014 | |
| Tunisia | 8.6 | 2.2 | ICS [30] | 2005–06 | |
| Eastern Mediterranean (region D) | Egypt* | 0.4 | 0 | STEPS [26] | 2017 |
| Iraq* | 0.4 | 0.02 | STEPS [26] | 2015 | |
| Morocco** | 4.4 | – | STEPS [26] | 2017 | |
| Pakistan* | 11.4 | 3.7 | GATS [27] | 2014 | |
| Sudan* | 14.3 | 0.2 | STEPS [26] | 2016 | |
| Yemen | 13.7 | 4.8 | National Health and Demographic Survey [25] | 2013 | |
| Europe (region A) | Austria* | 2.8 | 0.5 | Representative Survey on Substance Abuse [32] | 2015 |
| Belgium | 1.1 | 0.6 | SEBS [33] | 2012 | |
| Cyprus | 2.1 | 0.4 | SEBS [33] | 2012 | |
| Czech Republic* | 2.2 | 1.2 | The use of tobacco in the Czech Republic [25] | 2015 | |
| Denmark* | 2.3 | 0.9 | Monitoring Smoking Habits in the Danish Population [25] | 2015 | |
| Finland* | 5.6 | 0.4 | Health Behaviour and Health among the Finnish Adult Population [25] | 2014 | |
| France | 1.2 | 0.6 | SEBS [33] | 2012 | |
| Germany | 3.4 | 3.4 | SEBS [33] | 2012 | |
| Iceland* | 13 | 3 | May–December Household Surveys done by Gallup [25] | 2015 | |
| Ireland | 2.2 | 0.9 | SEBS [33] | 2012 | |
| Italy | 1.8 | 1.5 | SEBS [33] | 2012 | |
| Luxembourg | 1.8 | 1 | SEBS [33] | 2012 | |
| Malta | 5.5 | 1.5 | SEBS [33] | 2012 | |
| Netherlands | 0.3 | 0.1 | The Dutch Continuous Survey of Smoking Habits [25] | 2011 | |
| Norway* | 21 | 6 | Statistics Norway Smoking Habits Survey [25] | 2015 | |
| Portugal | 4.4 | 1.1 | SEBS [33] | 2012 | |
| Slovenia | 1.8 | 0.4 | SEBS [33] | 2012 | |
| Spain | 0.4 | 0.2 | SEBS [33] | 2012 | |
| Sweden* | 25 | 7 | National Survey of Public Health [25] | 2015 | |
| Switzerland* | 4.2 | 1.2 | Addiction Monitoring survey [25] | 2013 | |
| United Kingdom | 1.6 | 0.5 | SEBS [33] | 2012 | |
| Europe (Region B) | Azerbaijan* | 0.2 | 0 | National study of risk factors for non-communicable diseases [25] | 2011 |
| Armenia | 1.8 | 0 | DHS [29] | 2005 | |
| Bulgaria | 0.3 | 0 | SEBS [33] | 2012 | |
| Georgia | 1 | 0.2 | Survey of Risk Factors of Non-Communicable Diseases [25] | 2010 | |
| *Kazakhstan** | 2.8 | 0 | GATS [27] | 2014 | |
| Kyrgyzstan* | 10.1 | 0.1 | STEPS [26] | 2013 | |
| Poland | 1 | 0.1 | GATS [27] | 2009 | |
| *Romania | 0.4 | 0.2 | GATS [27] | 2011 | |
| Slovakia* | 1.9 | 0.8 | Tobacco and Health Education Survey [25] | 2014 | |
| Uzbekistan* | 23.2 | 0.2 | STEPS [26] | 2014 | |
| Europe (region C) | Latvia* | 0.1 | 0 | Health Behaviour among Latvian Adult Population [25] | 2014 |
| Lithuania | 1.2 | 0.2 | SEBS [33] | 2012 | |
| Moldova* | 0.1 | 0 | DHS [29] | 2013 | |
| Russia* | 0.8 | 0.1 | GATS [27] | 2016 | |
| Ukraine* | 0.4 | 0 | GATS [27] | 2017 | |
| South East Asia (region B) | Indonesia* | 3.9 | 4.8 | Basic Health Research [25] | 2013 |
| Sri Lanka* | 26 | 5.3 | STEPS [26] | 2014 | |
| Thailand | 1.1 | 5.2 | GATS [27] | 2011 | |
| South East Asia (region D) | Bangladesh* | 16.2 | 24.8 | GATS [27] | 2017 |
| Bhutan* | 26.5 | 11 | STEPS [26] | 2014 | |
| India* | 29.6 | 12.8 | GATS [27] | 2017 | |
| Maldives* | 3.9 | 1.4 | STEPS [26] | 2011 | |
| Myanmar* | 62.2 | 24.1 | STEPS [26] | 2014 | |
| Nepal* | 31.3 | 4.8 | STEPS [26] | 2013 | |
| Timor Leste* | 16.1 | 26.8 | National survey for non-communicable disease risk factors and injuries [34] | 2014 | |
| Western Pacific (region A) | Australia* | 0.6 | 0.3 | National Drug Strategy Household Survey [25] | 2013 |
| Brunei Darussalam** | 1.3 | 2.7 | Knowledge, Attitudes and Practices Survey on Non-communicable Diseases [25] | 2014–15 | |
| Western Pacific (region B) | Cambodia* | 0.8 | 8.6 | National Adult Tobacco Survey of Cambodia [25] | 2014 |
| China | 0.7 | 0 | GATS [27] | 2010 | |
| Lao People’s Democratic Republic* | 0.5 | 8.6 | National Adult Tobacco Survey [25] | 2015 | |
| Malaysia* | 20.4 | 0.8 | National Health And Morbidity Survey [25] | 2015 | |
| Marshall Islands** | 13.7 | 4 | STEPS [26] | 2002 | |
| Micronesia | 22.4 | 3 | STEPS [26] | 2002 | |
| Mongolia* | 0.8 | 0.2 | STEPS [26] | 2015 | |
| Niue** | 0.3 | 0.2 | STEPS [26] | 2011 | |
| Philippines* | 2.7 | 0.7 | GATS [27] | 2015 | |
| Vietnam* | 0.8 | 2 | GATS [27] | 2015 |
CTADS Canadian Tobacco Alcohol and Drugs Survey, DHS the Demographic and Health Surveys, ICS Individual Country Survey, GATS Global Adult Tobacco Survey, SEBS The Special Europe Barometer Survey, STEPS STEPwise approach to Surveillance, WHO World Health Organization
aPopulations of St Kitts and Nevis are tiny and unlikely to affect our estimates
*Countries included in the earlier paper (n = 55), but with updated values
**New countries not included in the earlier paper (n = 12)
Our post-2014 systematic literature search identified an additional four studies demonstrating a causal association between ST and oral cancer; these included two Pakistan-based and one India-based case-control studies and one US-based cohort study (Table 3). No new studies were found for pharyngeal and oesophageal cancers. PRISMA flow diagrams describing the selection process of the studies identified in the literature searches are provided in Additional file 1: Appendix 5b,c. By adding the new studies to the list of studies selected in our first estimates and revising the meta-analyses, we found that the pooled estimates were statistically significant for cancers of the mouth (Fig. 2). The non-specific pooled estimate for oral cancers, based on 36 studies, were 3.94 (95% CI 2.70–5.76). The country-specific relative risk for oral cancers for India was higher (RR 5.32, 95% CI 3.53–8.02) than no-specific estimates and for the USA remained statistically insignificant (RR 0.95, 95% CI 0.70–1.28). Since no new studies were added for pharyngeal and oesophageal cancers, their non-specific risk estimates of 2.23 (95% CI 1.55–3.20) and 2.17 (95% CI 1.70–2.78) remained as per our original estimates, respectively. For cardiovascular diseases, we identified another three Swedish studies for ischaemic heart disease and another two (one in Asia and one in Sweden) for stroke (Table 3). In the absence of any new non-Swedish studies on ischaemic heart disease (Fig. 3), we considered the relative risk (adjusted odds ratio 1.57, 95% CI 1.24–1.99) of myocardial infarction due to ST identified in the 52-country INTERHEART study [35] (conducted across nine WHO regions) as a valid estimate. However, the country-specific (Sweden) relative risk for ischaemic heart disease (RR 0.94, 95% CI 0.87–1.03) and both country-specific (RR 1.02, 95% CI 0.93–1.13 [Sweden]) and non-specific relative risks for stroke (RR 1.03, 95% CI 0.94–1.14) remained statistically insignificant. The GRADE assessment was moderate for oral, pharyngeal and oesophageal cancers and low for IHD (see Additional file 1: Appendix 7).
Table 3.
Smokeless tobacco use and risk of cancers, ischaemic heart disease, and stroke—studies included in meta-analysis
| Country | Study period | Study design | Exposure status | Inclusion of cigarette/alcohol users | Outcome | Odds ratio/relative risk (95% CIs) | Comments | Quality assessment (NOS)a | Reference |
|---|---|---|---|---|---|---|---|---|---|
| Cancers | |||||||||
| India | 2001–2004 | Case–control | SLT with or without additives | No/no | Oral cancer | 0.49 (0.32–0.75) | Exclusive SLT users |
Selection**** Comparability** Exposure* |
[36] |
| India | 1996–1999 | Case–control | Ever SLT users | Yes/yes | Oral cancer | 7.31 (3.79–14.1) | Never drinkers adjusted for smoking |
Selection**** Comparability** Exposure* |
[37] |
| 9.19 (4.38–19.28) | Never smokers adjusted for alcohol | ||||||||
| India | 1982–1992 | Case–control | Tobacco quid chewing | Yes/no | Oral cancer | 5.80 (3.60–9.34) | Adjusted for smoking |
Selection*** Comparability* Exposure* |
[38] |
| Pharyngeal cancer | 1.20 (0.80–1.80) | ||||||||
| Lung cancer | 0.70 (0.40–1.22) | ||||||||
| India | Not clear | Case–control | Chewing tobacco | No/no | Oral cancer | 10.75 (6.58–17.56) | Exclusive SLT users |
Selection** Comparability* Exposure0 |
[39] |
| India | 1990–1997 | Cohort | Current SLT users | No/no | Oral cancer | 5.50 (3.30–9.17) | Exclusive SLT users |
Selection**** Comparability* Outcome** |
[40] |
| Former SLT users | 9.20 (4.60–18.40) | ||||||||
| India | 1990–1997 | Cohort | Current SLT user | Yes/yes | Oral cancer | 2.40 (1.70–3.39) | Adjusted for smoking and alcohol |
Selection**** Comparability* Outcome*** |
[41] |
| Former SLT users | 2.10 (1.30–3.39) | ||||||||
| India | Not clear | Case–control | Ever SLT users | No/no | Oral cancer | 4.23 (3.11–5.75) | Exclusive SLT users |
Selection*** Comparability** Exposure0 |
[42] |
| Pharyngeal cancer | 2.42 (1.74–3.37) | ||||||||
| Laryngeal cancer | 2.80 (2.07–3.79) | ||||||||
| Oesophageal cancer | 1.55 (1.15–2.07) | ||||||||
| India | 1968 | Case–control | Tobacco | Yes/no | Oral cancer | 4.63 (3.50–6.14) | Exclusive chewers and non-chewers data available |
Selection*** Comparability** Exposure0 |
[43] |
| Pharyngeal cancer | 3.09 (2.31–4.13) | ||||||||
| Laryngeal cancer | 2.29 (1.72–3.05) | ||||||||
| Oesophageal cancer | 3.82 (2.84–5.13) | ||||||||
| India | 2005–2006 | Case–control | Tobacco flakes | Yes/yes | Oral cancer | 7.60 (4.90–11.79) | Adjusted for smoking and alcohol |
Selection**** Comparability** Exposure* |
[44] |
| Gutkha | 12.70 (7.00–23.04) | ||||||||
| Mishiri | 3.00 (1.90–4.74) | ||||||||
| India | Not clear | Case–control | Chewing tobacco | Yes/yes | Oral cancer | 5.00 (3.60–6.94) | Adjusted for smoking and alcohol |
Selection**** Comparability* Exposure* |
[45] |
| India | 1982–1984 | Case–control | Chewing tobacco | Yes/no | Oral cancer | 10.20 (2.60–40.02) | Adjusted for smoking |
Selection*** Comparability** Exposure* |
[46] |
| India | 1980–1984 | Case–control | SLT users | No/no | Oral cancer | 1.99 (1.41–2.81) | Exclusive SLT users |
Selection** Comparability0 Exposure* |
[47] |
| India | 1952–1954 | Case–control | Chewing tobacco | No/no | Oral cancer | 4.85 (2.32–10.14) | Exclusive SLT users |
Selection*** Comparability** Exposure0 |
[48] |
| Pharyngeal cancer | 2.02 (0.94–4.33) | ||||||||
| Laryngeal cancer | 0.76 (0.37–1.56) | ||||||||
| India | 1983–1984 | Case–control | Snuff (males only) | Yes/yes | Oral cancer | 2.93 (0.98–8.76) | Adjusted for smoking and alcohol; adjusted effect size is only among males |
Selection*** Comparability0 Exposure* |
[49] |
| India | Not given | Case–control | Tobacco chewing | Yes/yes | Oropharyngeal cancer | 7.98 (4.11–13.58)b | Adjusted for smoking and alcohol |
Selection*** Comparability** Exposure0 |
[50] |
| India | 1991–2003 | Case–control | Chewing tobacco | No/no | Oral cancer | 5.88 (3.66–7.93) | Exclusive SLT users |
Selection**** Comparability** Exposure** |
[51] |
| India | 1950–1962 | Case–control | Tobacco with or without paan or lime | Yes/no | Oral and oropharyngeal cancer | 41.90 (34.20–51.33) | Exclusive chewer data available; data of habit was not available for the whole cohort |
Selection** Comparability** Exposure0 |
[52] |
| Pakistan | 1996–1998 | Case–control | Naswar | Yes/yes | Oral cancer | 9.53 (1.73–52.50) | Adjusted for smoking and alcohol |
Selection*** Comparability** Exposure* |
[53] |
| Paan with tobacco | 8.42 (2.31–30.69) | ||||||||
| Sweden | 1973–2002 | Cohort | Snus | Yes/yes | Oral and pharyngeal cancer combined | 3.10 (1.50–6.41) | Adjusted for smoking and alcohol |
Selection** Comparability** Outcome*** |
[54] |
| India | 1993–1999 | Case–control | Chewing tobacco | Yes/yes | Oral cancer | 5.05 (4.26–5.99) | Adjusted for smoking and alcohol |
Selection*** Comparability** Exposure* |
[55] |
| Pharyngeal cancer | 1.83 (1.43–2.34) | ||||||||
| Oesophageal cancer | 2.06 (1.62–2.62) | ||||||||
| Norway | 1966–2001 | Cohort | Chewing tobacco plus oral snuff | No/no | Oral cancer | 1.10 (0.50–2.42) | Adjusted for smoking, might be confounded by alcohol use |
Selection*** Comparability* Outcome*** |
[56] |
| Oesophageal cancer | 1.40 (0.61–3.21) | ||||||||
| Pancreatic cancer | 1.67 (1.12–2.49) | ||||||||
| Lung cancer | 0.80 (0.61–1.05) | ||||||||
| Sweden | 1988–1991 | Case–control | Oral snuff | Yes/yes | Oral cancer | 1.40 (0.80–2.45) | Adjusted for smoking and alcohol |
Selection** Comparability** Exposure* |
[57] |
| Laryngeal cancer | 0.90 (0.50–1.62) | ||||||||
| Oesophageal cancer | 1.20 (0.70–2.06) | ||||||||
| Pharyngeal cancer | 0.70 (0.40–1.22) | ||||||||
| Sweden | 1969–1992 | Cohort | Snus | No/no | Oral cancer | 0.80 (0.40–1.60) | Exclusive SLT users |
Selection*** Comparability* Outcome*** |
[58] |
| Lung cancer | 0.80 (0.50–1.28) | ||||||||
| Pancreatic cancer | 2.00 (1.20–3.33) | ||||||||
| Sweden | 2000–2004 | Case–control | Oral snuff | Yes/yes | Oral cancer | 0.70 (0.30–1.63) | Adjusted for smoking and alcohol |
Selection*** Comparability** Exposure** |
[59] |
| Sweden | 1980–1989 | Case–control | Oral snuff | Yes/yes | Oral cancer | 0.80 (0.50–1.28) | Adjusted for smoking and alcohol |
Selection** Comparability** Exposure*** |
[60] |
| USA | 1972–1983 | Case–control | Oral snuff | Yes/yes | Oral cancer | 0.80 (0.40–1.60) | Not clear if adjusted for smoking and alcohol |
Selection** Comparability0 Exposure* |
[61] |
| Chewing tobacco | 1.00 (0.70–1.43) | ||||||||
| USA | Not given | Case–control | SLT use | Yes/yes | Oral cancer | 0.90 (0.38–2.13) | Adjusted for smoking and alcohol |
Selection*** Comparability** Exposure* |
[10] |
| Pharyngeal cancer | 1.59 (0.84–3.01) | ||||||||
| Laryngeal cancer | 0.67 (0.19–2.36) | ||||||||
| India | 2001–2004 | Case–control | Chewing tobacco | No/no | Pharyngeal cancer | 3.18 (1.92–5.27) | Exclusive SLT users |
Selection*** Comparability** Exposure* |
[62] |
| Laryngeal cancer | 0.95 (0.52–1.74) | ||||||||
| Pakistan | 1998–2002 | Case–control | Snuff dipping | No/no | Oesophageal cancer | 4.10 (1.30–12.93) | Adjusted for areca nut |
Selection*** Comparability** Exposure** |
[63] |
| Quid with tobacco | 14.20 (6.40–31.50) | ||||||||
| India | 2008–2012 | Case–control | Nass chewing | No/no | Oesophageal cancer | 2.88 (2.06–4.03) | Exclusive SLT users |
Selection*** Comparability** Exposure** |
[64] |
| Gutkha chewing | 2.87 (0.87–9.47) | ||||||||
| India | 2007–2011 | Case–control | Oral snuff | Yes/yes | Oesophageal cancer | 3.86 (2.46–6.06) | Adjusted for smoking and alcohol |
Selection** Comparability** Exposure* |
[65] |
| India | 2011–2012 | Case–control | Chewing tobacco | Yes/yes | Oesophageal cancer | 2.63 (1.53–4.52) | Adjusted for smoking and alcohol |
Selection*** Comparability** Exposure* |
[66] |
| Sweden | 1995–1997 | Case–control | Oral snuff | Yes/yes | Oesophageal adenocarcinoma | 1.20 (0.70–2.06) | Adjusted for smoking and alcohol |
Selection*** Comparability** Exposure* |
[67] |
| Squamous cell carcinoma | 1.40 (0.90–2.18) | ||||||||
| Sweden | 1969–1993 | Cohort | Oral snuff | Yes/no | Oesophageal adenocarcinoma | 1.30 (0.80–2.11) | Adjusted for smoking |
Selection** Comparability* Outcome** |
[68] |
| Squamous cell carcinoma | 1.20 (0.80–1.80) | ||||||||
| Sweden | 1974–1985 | Cohort | SLT users | No/NA | Lung cancer | 0.90 (0.20–4.05) | Adjusted for age, region of origin |
Selection*** Comparability* Outcome** |
[69] |
| Morocco | 1996–1998 | Case–control | SLT users | Yes/no | Lung cancer | 1.05 (0.28–3.94) | Adjusted for smoking |
Selection** Comparability** Exposure** |
[70] |
| USA | 1977–1984 | Case–control | SLT users | Yes/no | Oesophageal cancer | 1.20 (0.10–14.40) | Adjusted for smoking |
Selection*** Comparability** Exposure** |
[71] |
| USA | 1986–1989 | Case–control | SLT users | Yes/no | Pancreatic cancer | 1.40 (0.50–3.92) | Adjusted for smoking |
Selection*** Comparability* Exposure** |
[72] |
| USA | 2000–2006 | Case–control | Chewing tobacco | Yes/yes | Pancreatic cancer | 0.60 (0.30–1.20) | Adjusted for smoking and alcohol |
Selection**** Comparability** Exposure* |
[73] |
| Oral snuff | 0.50 (0.10–2.50) | ||||||||
| Pakistan | 2014–2015 | Case–control | Ever use of naswar | Yes/yes | Oral cancer | 21.20 (8.40–53.8) | Adjusted for smoking; restricted control for alcohol due to cultural sensitivity |
Selection**** Comparability** Exposure*** |
[74] |
| India | March–July, 2013 | Case–control | Gutkha | Yes/yes | Oral cancer | 5.10 (2.00–10.30) | Adjusted for smoking and alcohol |
Selection*** Comparability* Exposure** |
[75] |
| Chewing tobacco | 6.00 (2.30–15.70) | ||||||||
| Supari with tobacco | 11.40 (3.40–38.20) | ||||||||
| Quid with tobacco | 6.40 (2.60–15.50) | ||||||||
| Pakistan | 1996–1998 | Case–control | Quid with tobacco | Yes/yes | Oral cancer | 15.68 (3.00–54.90) | Adjusted for smoking and alcohol |
Selection** Comparability* Exposure*** |
[76] |
| Cardiovascular diseases (ischaemic heart disease and stroke) | |||||||||
| 52 countries | 1999–2003 | Case–control | Chewing tobacco | Yes/yes | Myocardial infarction | 1.57 (1.24–1.99) | Adjusted for smoking, diet, diabetes, abdominal obesity, exercise, hypertension |
Selection**** Comparability** Exposure* |
[35] |
| Pakistan | 2005–2011 | Case–control | Dippers (Naswar) | No/NA | Myocardial infarction | 1.46 (1.21–1.78) | Adjusted for age, gender, region, ethnicity, diet, socioeconomic status |
Selection**** Comparability** Exposure** |
[77] |
| Chewers (Paan/Supari/Gutkha) | 1.71 (1.46–2.00) | ||||||||
| Bangladesh | 2006–2007 | Case–control | Ever SLT users | Yes/NA | Myocardial infarction, angina pectoris | 2.80 (1.10–7.30) | Adjusted for age, gender, smoking, hypertension | Selection** Comparability** Exposure** | [78] |
| Bangladesh | 2010 | Case–control | Ever SLT users | No/NA | Myocardial infarction, angina pectoris | 0.77 (0.52–1.13) | Adjusted for age, gender, area of residence, hypertension, diabetes, stress | Selection*** Comparability** Exposure* | [79] |
| India | 2013 | Case–control | Current SLT users | Yes/yes | Stroke | 1.50 (0.80–2.79) | Adjusted for age, smoking, alcohol, diabetes, hypertension | Selection** Comparability** Exposure* | [80] |
| Sweden | 1989–1991 | Case–control | Current snuff users | No/NA | Myocardial infarction | 0.89 (0.62–1.29) | Adjusted for age | Selection**** Comparability** Exposure* | [81] |
| Sweden | 1991–1993 | Case–control | Current snuff users | No/NA | Myocardial infarction | 0.58 (0.35–0.94) | Adjusted for heredity, education, marital status, hypertension, diabetes, cholesterol | Selection**** Comparability** Exposure** | [82] |
| Sweden | 1985–2000 | Case–control | Current snuff users | No/NA | Stroke | 0.87 (0.41–1.83) | Adjusted for education, marital status, diabetes, hypertension, cholesterol | Selection**** Comparability** Exposure** | [83] |
| Sweden | 1998–2005 | Case–control | Current snuff users | No/NA | Myocardial infarction | 0.73 (0.35–1.50) | Adjusted for age, hospital catchment area | Selection*** Comparability** Exposure** | [84] |
| Former snuff users | 1.20 (0.46–3.10) | ||||||||
| Sweden | 1988–2003 | Cohort | Current use of snuff | No/NA | Ischaemic heart disease | 0.77 (0.51–1.15) | Adjusted for age, socioeconomic status, residential area, self-reported health, longstanding illnesses, physical activity | Selection*** Comparability** Outcome*** | [85] |
| Stroke | 1.07 (0.65–1.77) | ||||||||
| Sweden | 1978–2004 | Cohort | Ever snuff users | No/NA | Myocardial infarction | 0.99 (0.90–1.10) | Adjusted for age, BMI, region of residence | Selection** Comparability** Outcome*** | [86] |
| Sweden | 1985–1999 | Case–control | Current snuff users | No/NA | Myocardial infarction | 0.82 (0.46–1.43) | Adjusted for BMI, leisure time, physical activity, education, cholesterol | Selection**** Comparability** Exposure* | [87] |
| Former snuff users | 0.66 (0.32–1.34) | ||||||||
| Sweden | 1978–2003 | Cohort | Ever snuff users | No/NA | Stroke | 1.02 (0.92–1.13) | Adjusted for age, BMI, region of residence | Selection** Comparability** Outcome*** | [88] |
| Sweden | 1998–2005 | Cohort | Current snuff users | No/NA | Ischaemic heart disease | 0.85 (0.51–1.42) | Adjusted for age, hypertension, diabetes, cholesterol | Selection*** Comparability** Outcome* | [89] |
| Former snuff users | 1.07 (0.56–2.04) | ||||||||
| Current snuff users | Stroke | 1.18 (0.67–2.08) | |||||||
| Former snuff users | 1.35 (0.65–2.82) | ||||||||
| Sweden | 1991–2004 | Cohort | Current snuff users | No/NA | Myocardial infarction | 0.75 (0.30–1.87) | Adjusted for age, marital status, occupation, diabetes, BMI, hypertension, physical activity | Selection*** Comparability** Outcome** | [90] |
| Stroke | 0.59 (0.20–1.50) | ||||||||
BMI body mass index, NA not applicable, NOS Newcastle-Ottawa Scale, SLT smokeless tobacco
aNOS for assessing the quality of non-randomised studies in meta-analyses based on selection, comparability, and exposure/outcome. Number of stars (*) indicates the number of criteria met for each of these three categories
bEffect sizes are for oral and pharyngeal cancers combined and were included in the meta-analysis for oral cancer only
Fig. 2.

Risk estimates for oral cancers among ever ST users
Fig. 3.
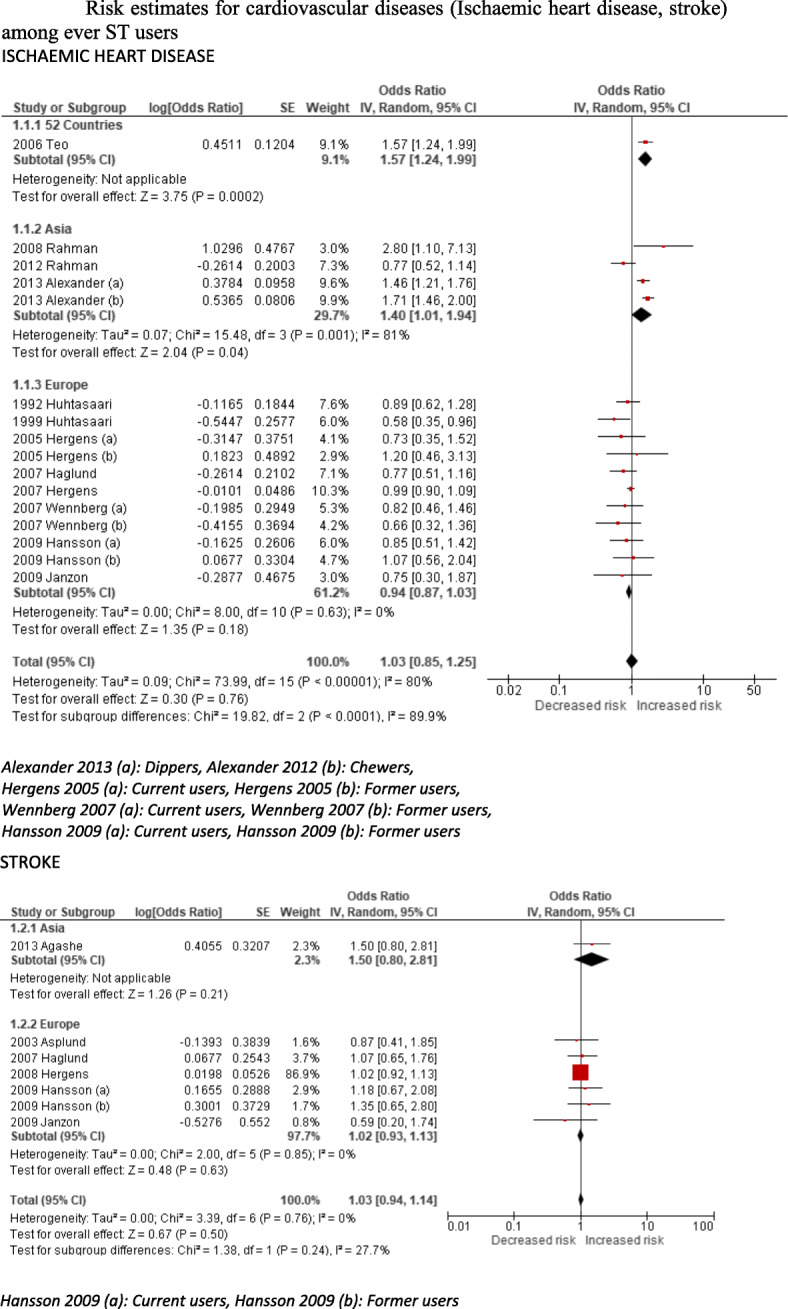
Risk estimates for cardiovascular diseases (ischaemic heart disease, stroke) among ever ST users
We found that most of the included studies adjusted for potential confounders (35/38 for oral, 10/10 for pharyngeal and 15/16 for oesophageal cancers; and 13/16 for IHD) and classified as providing ‘best adjusted’ estimates. According to a sensitivity analysis restricted to only ‘best-adjusted’ studies, the overall risk estimates (RR/OR) for oral cancer increased from 3.94 to 4.46 and for oesophageal cancer from 2.17 to 2.22 (see Additional file 1: sensitivity analysis #1). Separate risk estimates for cohort and case-control studies are included in the Additional file 1: sensitivity analysis #2).
The above risk estimates were included in the mathematical model to estimate the population attributable fraction (PAF), as follows (also see Additional file 1, Appendix 4 for detailed justification): For oral, pharyngeal and oesophageal cancers, Sweden- and US-based country-specific risk estimates were applied to Europe A and America A regions, respectively. Similarly, India-based country-specific risk estimates were applied to Southeast Asia B and D and Western Pacific B regions. No risk estimates were applied to Europe C due to the non-existence of any risk estimates or information about the toxicity of ST products. For all other regions, non-specific country estimates were applied. A few exceptions were made to the above assumptions: a Pakistan-based country-specific estimate was applied for oral cancers for Pakistan and an India-based estimate for the other two cancers; for the UK, India-based country specific estimates were applied due to the predominant use of South Asian products in the country. For ischaemic heart disease, the INTERHEART disease estimates were applied to all WHO regions except two, i.e. Europe A due to the availability of Sweden-based country specific estimates and Europe C due to the non-availability of relevant information. As previously stated, an exception was made for the UK and the INTERHEART estimates were applied.
According to our 2017 estimates, 2,556,810 DALYs lost and 90,791 deaths due to oral, pharyngeal and oesophageal cancers can be attributed to ST use across the globe (Table 4). By applying risk estimates obtained from the INTERHEART study, 6,135,017 DALYs lost and 258,006 deaths from ischaemic heart disease can be attributed to ST use. The overall global disease burden due to ST use amounts to 8,691,827 DALYs lost and 348,798 deaths. The attributable disease burden estimates when restricted to only ‘best adjusted’ studies, did not change significantly; the DALYs lost attributable to ST increased to 8,698,142 and deaths to 349,222.
Table 4.
Number of deaths and DALYs lost from SLT use in 2017, by WHO sub-region as defined in Additional file 1: Appendix 1
| WHO sub-regionsa | Mouth cancer | Pharyngeal cancer | Oesophageal cancer | Ischaemic heart disease | All causes | ||||||||||
|---|---|---|---|---|---|---|---|---|---|---|---|---|---|---|---|
| M | F | All | M | F | All | M | F | All | M | F | All | M | F | All | |
| Deaths | |||||||||||||||
| Africa D | 184 | 83 | 267 | 120 | 37 | 157 | 294 | 124 | 418 | 3414 | 1497 | 4911 | 4012 | 1741 | 5753 |
| Africa E | 305 | 149 | 454 | 95 | 41 | 136 | 449 | 276 | 725 | 2231 | 1797 | 4027 | 3079 | 2263 | 5343 |
| Americas A | 0 | 0 | 0 | 0 | 0 | 0 | 0 | 0 | 0 | 10,298 | 565 | 10,863 | 10,298 | 565 | 10,863 |
| Americas B | 1189 | 112 | 1301 | 46 | 4 | 50 | 103 | 12 | 115 | 1275 | 260 | 1535 | 2613 | 389 | 3001 |
| Americas D | 0 | 3 | 3 | 0 | 1 | 1 | 0 | 2 | 2 | 0 | 76 | 76 | 0 | 82 | 82 |
| Eastern Mediterranean B | 27 | 3 | 31 | 21 | 1 | 22 | 13 | 1 | 14 | 818 | 122 | 940 | 879 | 128 | 1007 |
| Eastern Mediterranean D | 5488 | 3756 | 9244 | 611 | 138 | 749 | 752 | 269 | 1021 | 13,062 | 1982 | 15,045 | 19,913 | 6146 | 26,059 |
| Europe A | 69 | 14 | 84 | 30 | 3 | 33 | 246 | 42 | 288 | 0 | 0 | 0 | 346 | 60 | 405 |
| Europe B | 286 | 5 | 291 | 85 | 1 | 86 | 189 | 2 | 192 | 6552 | 163 | 6715 | 7112 | 170 | 7283 |
| Europe C | 0 | 0 | 0 | 0 | 0 | 0 | 0 | 0 | 0 | 0 | 0 | 0 | 0 | 0 | 0 |
| Southeast Asia B | 663 | 467 | 1130 | 394 | 148 | 542 | 260 | 123 | 383 | 5014 | 3349 | 8363 | 6330 | 4087 | 10,418 |
| Southeast Asia D | 25,966 | 9829 | 35,795 | 16,378 | 4499 | 20,876 | 9366 | 3493 | 12,859 | 147,065 | 50,509 | 197,573 | 198,774 | 68,329 | 267,103 |
| Western Pacific A | 8 | 2 | 11 | 3 | 1 | 4 | 8 | 2 | 10 | 53 | 23 | 76 | 73 | 27 | 100 |
| Western Pacific B | 781 | 173 | 954 | 611 | 44 | 655 | 1841 | 49 | 1890 | 7084 | 798 | 7883 | 10,317 | 1065 | 11,382 |
| Worldwide | 34,966 | 14,597 | 49,563 | 18,394 | 4918 | 23,312 | 13,519 | 4397 | 17,916 | 196,867 | 61,140 | 258,006 | 263,746 | 85,052 | 348,798 |
| DALYs | |||||||||||||||
| Africa D | 5350 | 2499 | 7849 | 3823 | 1245 | 5068 | 7860 | 3166 | 11,027 | 78,500 | 31,152 | 109,651 | 95,533 | 38,062 | 133,595 |
| Africa E | 9242 | 4105 | 13,348 | 3174 | 1323 | 4497 | 12,358 | 6590 | 18,948 | 59,082 | 32,930 | 92,012 | 83,856 | 44,948 | 128,804 |
| Americas A | 0 | 0 | 0 | 0 | 0 | 0 | 0 | 0 | 0 | 180,756 | 6870 | 187,626 | 180,756 | 6870 | 187,626 |
| Americas B | 2283 | 315 | 2598 | 1321 | 104 | 1425 | 2562 | 261 | 2823 | 28,177 | 4397 | 32,575 | 34,344 | 5077 | 39,421 |
| Americas D | 0 | 68 | 68 | 0 | 34 | 34 | 0 | 62 | 62 | 0 | 1745 | 1745 | 0 | 1909 | 1909 |
| Eastern Mediterranean B | 758 | 90 | 848 | 593 | 42 | 634 | 301 | 23 | 324 | 16,420 | 1919 | 18,339 | 18,072 | 2073 | 20,145 |
| Eastern Mediterranean D | 177,353 | 126,901 | 304,254 | 19,303 | 4655 | 23,958 | 20,904 | 7393 | 28,298 | 324,744 | 46,679 | 371,423 | 542,305 | 185,628 | 727,933 |
| Europe A | 1618 | 272 | 1890 | 686 | 76 | 763 | 4959 | 682 | 5641 | 0 | 0 | 0 | 7263 | 1030 | 8293 |
| Europe B | 5714 | 106 | 5820 | 2642 | 30 | 2672 | 4871 | 55 | 4926 | 141,562 | 2177 | 143,740 | 154,789 | 2369 | 157,158 |
| Europe C | 0 | 0 | 0 | 0 | 0 | 0 | 0 | 0 | 0 | 0 | 0 | 0 | 0 | 0 | 0 |
| Southeast Asia B | 17,730 | 10,792 | 28,523 | 11,164 | 4319 | 15,484 | 6608 | 2951 | 9558 | 122,177 | 68,896 | 191,073 | 157,679 | 86,958 | 244,637 |
| Southeast Asia D | 767,549 | 258,275 | 1,025,824 | 471,141 | 131,531 | 602,672 | 252,556 | 87,759 | 340,314 | 3,697,819 | 1,114,976 | 4,812,796 | 5,189,065 | 1,592,540 | 6,781,606 |
| Western Pacific A | 201 | 48 | 249 | 78 | 15 | 93 | 166 | 24 | 191 | 809 | 233 | 1042 | 1255 | 320 | 1575 |
| Western Pacific B | 20,556 | 3795 | 24,351 | 18,452 | 1324 | 19,776 | 40,948 | 1055 | 42,003 | 157,624 | 15,371 | 172,995 | 237,580 | 21,545 | 259,124 |
| Worldwide | 1,008,356 | 407,266 | 1,415,621 | 532,378 | 144,696 | 677,074 | 354,093 | 110,021 | 464,114 | 4,807,671 | 1,327,346 | 6,135,017 | 6,702,497 | 1,989,330 | 8,691,827 |
Among these figures, three quarters of the total disease burden was among men. Geographically, > 85% of the disease burden was in South and Southeast Asia, India accounting for 70%, Pakistan for 7% and Bangladesh for 5% DALYs lost due to ST use (Additional file 1: Appendix 6).
Discussion
ST consumption is now reported in at least two thirds of all countries; however, health risks and the overall disease burden attributable to ST use vary widely depending on the composition, preparation and consumption of these products. Southeast Asian countries share the highest disease burden not only due to the popularity of ST but also due to the carcinogenic properties of ST products. In countries (e.g. Sweden) where ST products are heavily regulated for their composition and the levels of TSNAs, the risk to the population is minimal.
We found ST prevalence figures in 12 countries that did not previously report ST use; new figures were also obtained for 55 countries included in the previous estimates [16]. Among these 55 countries: 19 reported a reduction in ST use among both men and women (e.g. Bangladesh, India, Nepal), 14 only among men (e.g. Laos, Pakistan) and eight only among women (e.g. Bhutan, Sri Lanka) (Fig. 4a, b). On the other hand, 13 countries showed an incline in ST use among both men and women (e.g. Indonesia, Myanmar, Malaysia, Timor Leste) and one country (Sweden) among men only. Overall, our updated ST-related disease burden in 2017 was substantially higher than that for 2010—by approximately 50% for cancers and 25% for ischaemic heart disease. This occurred despite a substantial reduction in ST prevalence in India (constituting 70% of the disease burden) and little change in the disease risk estimates. We are now reporting ST use in 12 more countries; however, the main reason for the increased burden of disease was a global rise in the total mortality and DALYs lost—oral, pharyngeal and oesophageal cancers, in particular. The disease burden due to these cancers lags several decades behind the risk exposure. Therefore, a significant reduction in ST-related disease burden as a result of a reduced prevalence will not become apparent for some time to come. Among other studies estimating ST-related global disease burden, our mortality estimates were far more conservative than those reported by Sinha et al. (652,494 deaths); however, their methods were different from ours [9]. Moreover, Sinha et al.’s estimates included a number of additional diseases such as cervical cancer, stomach cancer and stroke. None of these risks were substantiated in our systematic reviews and meta-analyses. On the other hand, our estimates of 2,556,810 DALYs lost and 90,791 deaths due to cancers are close to those estimated by the GBD Study for 2017, i.e.1,890,882 DALYs lost and 75,962 deaths due to cancers [91]. A reason for the slight difference between these two estimates might be that ours included pharyngeal cancers in the estimates while GBD Study only included oral and oesophageal cancers.
Fig. 4.

a Countries with a proportional change in female ST use between 2015 and 2020 estimates. b Countries with a proportional change in male ST use between 2015 and 2020 estimates
Our methods have several limitations. These have been described in detail elsewhere [16] but are summarised here. Our estimates were limited by the availability of reliable data and caveated by several assumptions. The ST use prevalence data were not available for a third of countries despite reports of ST use there. Where prevalence data were available, there were very few studies providing country-specific disease risks—a particular limitation in Africa and South America. In the absence of country-specific risk estimates, the model relied on assuming that countries that share similar ST products also share similar disease risks. For example, oral cancers risk estimates were only available from five countries (India, Norway, Pakistan, Sweden and the USA). For other countries, the extrapolated risks were based on similarities between ST products sold there and in the above five countries. The estimates for ischemic heart disease must be interpreted with caution, in particular, as the risk estimates for most countries were extrapolated from a single (albeit multi-country) study (INTERHEART). However, we excluded those regions from the above extrapolation where the INTERHEART study was not conducted. As previously noted, the total disease burden observed in 2017 is a consequence of risk exposure over several decades. Therefore, the attributable risk based on the prevalence figures gathered in the last few years may not be accurate. If ST prevalence has been declining in a country over the last few decades, the disease burden obtained by applying more recent prevalence figures may underestimate attributable disease burden. This may well be the case in India where ST use has declined by 17% between the 2009 and 2017 GATS surveys [92]. On the other hand, if ST use is on the rise (e.g. in Timor Leste), the attributable disease burden for 2017 could be an overestimate.
While we found a few more recent ST prevalence surveys and observational studies on the risks associated with ST use, big evidence gaps still remain. The ST surveillance data for many countries are either absent or outdated. The biggest gap is in the lack of observational studies on the risks associated with various types of ST used both within and between countries. While longitudinal studies take time, global surveillance of ST products, their chemical composition and risk profile can help improve the precision of future estimates. As cancer registries become more established around the globe, their secondary data analysis can also provide opportunities to estimate ST-related risks.
ST is the main form of tobacco consumption by almost a quarter of all tobacco users in the world. Yet, its regulation and control lags behind that of cigarettes. The diversity in the composition and toxicity of ST products and the role of both formal and informal sectors in its production, distribution and sale make ST regulation a particular challenge. In a recent policy review of 180 countries that are signatories to WHO FCTC, we found that only a handful of countries have addressed ST control at par with cigarettes [93]. The regulatory bar is often much lower for ST than cigarettes [94]. Where ST control policies are present, there are gaps in their enforcement [95]. On the other hand, Sweden has demonstrated what can be achieved through strong regulations; ST-related harm has not only been reduced significantly, but snus is now used to reduce harm from smoking. Countries where ST use is popular and poses risks to health need to prioritise ST control and apply WHO FCTC articles comprehensively and evenly across all forms of tobacco.
Conclusions
ST is consumed across the globe and poses a major public health threat predominantly in South and Southeast Asia. While our disease risk estimates are based on a limited number of studies with modest quality, the likely disease burden attributable to ST is substantial. In high-burden countries, ST use needs to be regulated through comprehensive implementation and enforcement of the WHO FCTC.
Supplementary information
Additional file 1. Supplementary description of methods and results sections.
Abbreviations
- CI
Confidence intervals
- DALYs
Disability-adjusted life years
- DHS
Demographic and Health Surveys
- GATS
Global Adult Tobacco Survey
- ICS
Individual Country Survey
- PAF
Population attributable fraction
- SEBS
Special Europe Barometer Survey
- ST
Smokeless tobacco
- STEPS
STEPwise Approach to Surveillance
- TSNA
Tobacco-specific nitrosamines
- WHO
World Health Organization
Authors’ contributions
KS jointly developed the study idea, planned the analysis, interpreted the findings, wrote the methods, results and discussion sections and approved the final manuscript. SH led two literature reviews, interpreted the findings, contributed to the tables and approved the final manuscript.
AV led one of the literature reviews, interpreted the findings, drafted several tables and approved the final manuscript. AR contributed to the literature reviews, interpreted the findings, wrote the background section and approved the final manuscript. MM contributed to the literature reviews, interpreted the findings, reviewed the analysis and the tables and approved the final manuscript. AS jointly developed the study idea, interpreted the findings, critically reviewed the write up and approved the final manuscript.
Funding
This study was funded by the National Institute for Health Research by a Grant No: 17/63/76 to support a Global Health Research Group on Addressing Smokeless Tobacco and building Research capacity in south Asia (ASTRA).
Availability of data and materials
All data generated or analysed during this study are included in this published article and its supplementary information file 1.
Ethics approval and consent to participate
Given that this is a secondary analysis of anonymised data that were already publicly available, ethics approval and consent to participate were not applicable.
Consent for publication
As above, consent for publication was not applicable.
Competing interests
None declared
Footnotes
Publisher’s Note
Springer Nature remains neutral with regard to jurisdictional claims in published maps and institutional affiliations.
Contributor Information
Kamran Siddiqi, Email: Kamran.siddiqi@york.ac.uk.
Scheherazade Husain, Email: scheherazade_husain@alumni.brown.edu.
Aishwarya Vidyasagaran, Email: aishwarya.vidyasagaran@york.ac.uk.
Anne Readshaw, Email: anne.readshaw@york.ac.uk.
Masuma Pervin Mishu, Email: masuma.mishu@york.ac.uk.
Aziz Sheikh, Email: Aziz.sheikh@ed.ac.uk.
Supplementary information
Supplementary information accompanies this paper at 10.1186/s12916-020-01677-9.
References
- 1.National Cancer Institute and Centers for Disease Control and Prevention. Smokeless tobacco and public health: a global perspective. U.S. Department of Health and Human Services, Centers for Disease Control and Prevention and National Institutes of Health, National Cancer Institute; 2014. Bethesda, MD NIH Publication No 14–-7983. https://cancercontrol.cancer.gov/brp/tcrb/global-perspective/SmokelessTobaccoAndPublicHealth.pdf.
- 2.Moghbel N, Ryu B, Cabot PJ, Ratsch A, Steadman KJ. In vitro cytotoxicity of Nicotiana gossei leaves, used in the Australian Aboriginal smokeless tobacco known as pituri or mingkulpa. Toxicol Lett. 2016;254:45–51. doi: 10.1016/j.toxlet.2016.05.011. [DOI] [PubMed] [Google Scholar]
- 3.Maki J. The incentives created by a harm reduction approach to smoking cessation: snus and smoking in Sweden and Finland. Int J Drug Policy. 2015;26:569–574. doi: 10.1016/j.drugpo.2014.08.003. [DOI] [PubMed] [Google Scholar]
- 4.Palipudi K, Rizwan SA, Sinha DN, Andes LJ, Amarchand R, Krishnan A, et al. Prevalence and sociodemographic determinants of tobacco use in four countries of the World Health Organization: South-East Asia region: findings from the Global Adult Tobacco Survey. Indian J Cancer. 2014;51(Suppl 1):S24–S32. doi: 10.4103/0019-509X.147446. [DOI] [PubMed] [Google Scholar]
- 5.IARC Working Group on the Evaluation of Carcinogenic Risks to Humans, World Health Organization, International Agency for Research on Cancer. Smokeless Tobacco and Some Tobacco-specific N-nitrosamines. Lyon: World Health Organization; 2007. https://monographs.iarc.fr/wp-content/uploads/2018/06/mono89.pdf.
- 6.Stanfill SB, Connolly GN, Zhang L, Jia LT, Henningfield JE, Richter P, et al. Global surveillance of oral tobacco products: total nicotine, unionised nicotine and tobacco-specific N-nitrosamines. Tob Control. 2011;20:e2. doi: 10.1136/tc.2010.037465. [DOI] [PubMed] [Google Scholar]
- 7.Sankhla B, Kachhwaha K, Hussain SY, Saxena S, Sireesha SK, Bhargava A. Genotoxic and carcinogenic effect of gutkha: a fast-growing smokeless tobacco. Addict Health. 2018;10:52–63. doi: 10.22122/ahj.v10i1.537. [DOI] [PMC free article] [PubMed] [Google Scholar]
- 8.National Cancer Institute, Division of Cancer Control, Population Science. Smokeless tobacco and public health: a global perspective | BRP | DCCPS/NCI/NIH. https://cancercontrol.cancer.gov/brp/tcrb/global-perspective/. Accessed 18 Apr 2020. Accessed 18 Apr 2020.
- 9.Sinha DN, Suliankatchi RA, Gupta PC, Thamarangsi T, Agarwal N, Parascandola M, et al. Global burden of all-cause and cause-specific mortality due to smokeless tobacco use: systematic review and meta-analysis. Tob Control. 2018;27:35–42. doi: 10.1136/tobaccocontrol-2016-053302. [DOI] [PubMed] [Google Scholar]
- 10.Zhou J, Michaud DS, Langevin SM, McClean MD, Eliot M, Kelsey KT. Smokeless tobacco and risk of head and neck cancer: evidence from a case-control study in New England. Int J Cancer. 2013;132:1911–1917. doi: 10.1002/ijc.27839. [DOI] [PMC free article] [PubMed] [Google Scholar]
- 11.Vidyasagaran AL, Siddiqi K, Kanaan M. Use of smokeless tobacco and risk of cardiovascular disease: a systematic review and meta-analysis. Eur J Prev Cardiol. 2016;23:1970–1981. doi: 10.1177/2047487316654026. [DOI] [PubMed] [Google Scholar]
- 12.Inamdar AS, Croucher RE, Chokhandre MK, Mashyakhy MH, Marinho VCC. Maternal smokeless tobacco use in pregnancy and adverse health outcomes in newborns: a systematic review. Nicotine Tob Res. 2015;17:1058–1066. doi: 10.1093/ntr/ntu255. [DOI] [PubMed] [Google Scholar]
- 13.Gupta PC, Subramoney S. Smokeless tobacco use and risk of stillbirth: a cohort study in Mumbai. India Epidemiology. 2006;17:47–51. doi: 10.1097/01.ede.0000190545.19168.c4. [DOI] [PubMed] [Google Scholar]
- 14.Ezzati M, Lopez AD, Rodgers A, Vander Hoorn S, Murray CJL, Comparative Risk Assessment Collaborating Group Selected major risk factors and global and regional burden of disease. Lancet. 2002;360:1347–1360. doi: 10.1016/S0140-6736(02)11403-6. [DOI] [PubMed] [Google Scholar]
- 15.Lim SS, Vos T, Flaxman AD, Danaei G, Shibuya K, Adair-Rohani H, et al. A comparative risk assessment of burden of disease and injury attributable to 67 risk factors and risk factor clusters in 21 regions, 1990-2010: a systematic analysis for the Global Burden of Disease Study 2010. Lancet. 2012;380:2224–2260. doi: 10.1016/S0140-6736(12)61766-8. [DOI] [PMC free article] [PubMed] [Google Scholar]
- 16.Siddiqi K, Shah S, Abbas SM, Vidyasagaran A, Jawad M, Dogar O, et al. Global burden of disease due to smokeless tobacco consumption in adults: analysis of data from 113 countries. BMC Med. 2015;13:194. doi: 10.1186/s12916-015-0424-2. [DOI] [PMC free article] [PubMed] [Google Scholar]
- 17.Lee PN. Epidemiological evidence relating snus to health – an updated review based on recent publications. Harm Reduction J. 2013;10:36. doi: 10.1186/1477-7517-10-36. [DOI] [PMC free article] [PubMed] [Google Scholar]
- 18.Hearn BA, Renner CC, Ding YS, Vaughan-Watson C, Stanfill SB, Zhang L, et al. Chemical analysis of Alaskan Iq’mik smokeless tobacco. Nicotine Tob Res. 2013;15:1283–1288. doi: 10.1093/ntr/nts270. [DOI] [PMC free article] [PubMed] [Google Scholar]
- 19.Lawler TS, Stanfill SB, Zhang L, Ashley DL, Watson CH. Chemical characterization of domestic oral tobacco products: total nicotine, pH, unprotonated nicotine and tobacco-specific N-nitrosamines. Food Chem Toxicol. 2013;57:380–386. doi: 10.1016/j.fct.2013.03.011. [DOI] [PMC free article] [PubMed] [Google Scholar]
- 20.Stanfill SB, Oliveira da Silva AL, Lisko JG, Lawler TS, Kuklenyik P, Tyx RE, et al. Comprehensive chemical characterization of Rapé tobacco products: nicotine, un-ionized nicotine, tobacco-specific N’-nitrosamines, polycyclic aromatic hydrocarbons, and flavor constituents. Food Chem Toxicol. 2015;82:50–8. [DOI] [PMC free article] [PubMed]
- 21.Al-Mukhaini NM, Ba-Omar TA, Eltayeb EA, Al-Shehi AH. Characterisation of nicotine and cancer-enhancing anions in the common smokeless tobacco Afzal in Oman. Sultan Qaboos Univ Med J. 2015;15:e469–e476. doi: 10.18295/squmj.2015.15.04.005. [DOI] [PMC free article] [PubMed] [Google Scholar]
- 22.Al-Mukhaini N, Ba-Omar T, Eltayeb EA, Al-Shehi AA. Analysis of tobacco-specific nitrosamines in the common smokeless tobacco Afzal in Oman. Sultan Qaboos Univ Med J. 2016;16:e20–e26. doi: 10.18295/squmj.2016.16.01.005. [DOI] [PMC free article] [PubMed] [Google Scholar]
- 23.Ratsch AM, Mason A, Rive L, Bogossian FE, Steadman KJ. The Pituri Learning Circle: central Australian Aboriginal women’s knowledge and practices around the use of Nicotiana spp. as a chewing tobacco. Rural Remote Health. 2017;17:4044. doi: 10.22605/RRH4044. [DOI] [PubMed] [Google Scholar]
- 24.Stang A. Critical evaluation of the Newcastle-Ottawa scale for the assessment of the quality of nonrandomized studies in meta-analyses. Eur J Epidemiol. 2010;25:603–605. doi: 10.1007/s10654-010-9491-z. [DOI] [PubMed] [Google Scholar]
- 25.World Health Organization WHO report on the global tobacco epidemic, 2017: Monitoring tobacco use and prevention policies. World Health Organization; 2017.
- 26.STEPS Country Reports. http://www.who.int/chp/steps/reports/en/..
- 27.Global Adult Tobacco Survey. http://www.who.int/tobacco/surveillance/gats/en/.
- 28.Sreeramareddy CT, Pradhan PM, Sin S. Prevalence, distribution, and social determinants of tobacco use in 30 sub-Saharan African countries. BMC Med. 2014;12:243. doi: 10.1186/s12916-014-0243-x. [DOI] [PMC free article] [PubMed] [Google Scholar]
- 29.Ansara DL, Arnold F, Kishor S, Hsia J, Kaufmann R. Tobacco use by men and women in 49 countries with demographic and health surveys. 2013. [Google Scholar]
- 30.World Health Organization. WHO Report on the Global Tobacco Epidemic, 2013: Enforcing bans on tobacco advertising, promotion and sponsorship. World Health Organization; 2013.
- 31.Health Canada . Canadian tobacco, alcohol and drugs survey (CTADS): summary of results for 2015. 2016. [Google Scholar]
- 32.SAMHSA . Results from the 2015 national survey on drug use and health: detailed tables. Rockville: SAMHSA Office of Applied Studies; 2016. [Google Scholar]
- 33.Agaku IT, Filippidis FT, Vardavas CI, Odukoya OO, Awopegba AJ, Ayo-Yusuf OA, et al. Poly-tobacco use among adults in 44 countries during 2008-2012: evidence for an integrative and comprehensive approach in tobacco control. Drug Alcohol Depend. 2014;139:60–70. doi: 10.1016/j.drugalcdep.2014.03.003. [DOI] [PubMed] [Google Scholar]
- 34.World Health Organization. National survey for non-communicable disease risk factors and injuries: using WHO STEPS approach in Timor-Leste--2014. 2014;5224. http://apps.who.int/iris/bitstream/10665/204350/5B.
- 35.Teo KK, Ounpuu S, Hawken S, Pandey MR, Valentin V, Hunt D, et al. Tobacco use and risk of myocardial infarction in 52 countries in the INTERHEART study: a case-control study. Lancet. 2006;368:1474–547X. doi: 10.1016/S0140-6736(06)69249-0. [DOI] [PubMed] [Google Scholar]
- 36.Anantharaman D, Chaubal PM, Kannan S, Bhisey RA, Mahimkar MB. Susceptibility to oral cancer by genetic polymorphisms at CYP1A1, GSTM1 and GSTT1 loci among Indians: tobacco exposure as a risk modulator. Carcinogenesis. 2007;28:1455–1462. doi: 10.1093/carcin/bgm038. [DOI] [PubMed] [Google Scholar]
- 37.Balaram P, Sridhar H, Rajkumar T, Vaccarella S, Herrero R, Nandakumar A, et al. Oral cancer in southern India: the influence of smoking, drinking, paan-chewing and oral hygiene. Int J Cancer. 2002;98:440–445. doi: 10.1002/ijc.10200. [DOI] [PubMed] [Google Scholar]
- 38.Dikshit RP, Kanhere S. Tobacco habits and risk of lung, oropharyngeal and oral cavity cancer: a population-based case-control study in Bhopal, India. Int J Epidemiol. 2000;29:609–614. doi: 10.1093/ije/29.4.609. [DOI] [PubMed] [Google Scholar]
- 39.Goud ML, Mohapatra SC, Mohapatra P, Gaur SD, Pant GC, Knanna MN. Epidemiological correlates between consumption of Indian chewing tobacco and oral cancer. Eur J Epidemiol. 1990;6:219–222. doi: 10.1007/BF00145797. [DOI] [PubMed] [Google Scholar]
- 40.Jayalekshmi PA, Gangadharan P, Akiba S, Nair RRK, Tsuji M, Rajan B. Tobacco chewing and female oral cavity cancer risk in Karunagappally cohort, India. Br J Cancer. 2009;100:848–852. doi: 10.1038/sj.bjc.6604907. [DOI] [PMC free article] [PubMed] [Google Scholar]
- 41.Jayalekshmi PA, Gangadharan P, Akiba S, Koriyama C, Nair RRK. Oral cavity cancer risk in relation to tobacco chewing and bidi smoking among men in Karunagappally, Kerala, India: Karunagappally cohort study. Cancer Sci. 2011;102:460–467. doi: 10.1111/j.1349-7006.2010.01785.x. [DOI] [PMC free article] [PubMed] [Google Scholar]
- 42.Jayant K, Balakrishnan V, Sanghvi LD, Jussawalla DJ. Quantification of the role of smoking and chewing tobacco in oral, pharyngeal, and oesophageal cancers. Br J Cancer. 1977;35:232–235. doi: 10.1038/bjc.1977.31. [DOI] [PMC free article] [PubMed] [Google Scholar]
- 43.Jussawalla DJ, Deshpande VA. Evaluation of cancer risk in tobacco chewers and smokers: an epidemiologic assessment. Cancer. 1971;28:244–252. doi: 10.1002/1097-0142(197107)28:1<244::aid-cncr2820280150>3.0.co;2-h. [DOI] [PubMed] [Google Scholar]
- 44.Madani AH, Jahromi AS, Madhurima D, Debanshu B, et al. Risk assessment of tobacco types and oral cancer. Am J Pharmacol Toxicol. 2010;5:9–13. [Google Scholar]
- 45.Muwonge R, Ramadas K, Sankila R, Thara S, Thomas G, Vinoda J, et al. Role of tobacco smoking, chewing and alcohol drinking in the risk of oral cancer in Trivandrum, India: a nested case-control design using incident cancer cases. Oral Oncol. 2008;44:446–454. doi: 10.1016/j.oraloncology.2007.06.002. [DOI] [PubMed] [Google Scholar]
- 46.Nandakumar A, Thimmasetty KT, Sreeramareddy NM, Venugopal TC, Rajanna, Vinutha AT, et al. A population-based case-control investigation on cancers of the oral cavity in Bangalore, India. Br J Cancer. 1990;62:847–851. doi: 10.1038/bjc.1990.392. [DOI] [PMC free article] [PubMed] [Google Scholar]
- 47.Rao DN, Ganesh B, Rao RS, Desai PB. Risk assessment of tobacco, alcohol and diet in oral cancer—a case-control study. Int J Cancer. 1994;58:469–473. doi: 10.1002/ijc.2910580402. [DOI] [PubMed] [Google Scholar]
- 48.Sanghvi LD, Rao KC, Khanolkar VR. Smoking and chewing of tobacco in relation to cancer of the upper alimentary tract. Br Med J. 1955;1:1111–1114. doi: 10.1136/bmj.1.4922.1111. [DOI] [PMC free article] [PubMed] [Google Scholar]
- 49.Sankaranarayanan R, Duffy SW, Padmakumary G, Day NE, Krishan NM. Risk factors for cancer of the buccal and labial mucosa in Kerala, southern India. J Epidemiol Community Health. 1990;44:286–292. doi: 10.1136/jech.44.4.286. [DOI] [PMC free article] [PubMed] [Google Scholar]
- 50.Wasnik KS, Ughade SN, Zodpey SP, Ingole DL. Tobacco consumption practices and risk of oro-pharyngeal cancer: a case-control study in Central India. Southeast Asian J Trop Med Public Health. 1998;29:827–834. [PubMed] [Google Scholar]
- 51.Subapriya R, Thangavelu A, Mathavan B, Ramachandran CR, Nagini S. Assessment of risk factors for oral squamous cell carcinoma in Chidambaram, Southern India: a case–control study. Eur J Cancer Prev. 2007;16:251. doi: 10.1097/01.cej.0000228402.53106.9e. [DOI] [PubMed] [Google Scholar]
- 52.Wahi PN, Kehar U, Lahiri B. Factors influencing oral and oropharyngeal cancers in India. Br J Cancer. 1965;19:642–660. doi: 10.1038/bjc.1965.80. [DOI] [PMC free article] [PubMed] [Google Scholar]
- 53.Merchant A, Husain SS, Hosain M, Fikree FF, Pitiphat W, Siddiqui AR, et al. Paan without tobacco: an independent risk factor for oral cancer. Int J Cancer. 2000;86:128–131. doi: 10.1002/(sici)1097-0215(20000401)86:1<128::aid-ijc20>3.0.co;2-m. [DOI] [PubMed] [Google Scholar]
- 54.Roosaar A, Johansson ALV, Sandborgh-Englund G, Axéll T, Nyrén O. Cancer and mortality among users and nonusers of snus. Int J Cancer. 2008;123:168–173. doi: 10.1002/ijc.23469. [DOI] [PubMed] [Google Scholar]
- 55.Znaor A, Brennan P, Gajalakshmi V, Mathew A, Shanta V, Varghese C, et al. Independent and combined effects of tobacco smoking, chewing and alcohol drinking on the risk of oral, pharyngeal and esophageal cancers in Indian men. Int J Cancer. 2003;105:681–686. doi: 10.1002/ijc.11114. [DOI] [PubMed] [Google Scholar]
- 56.Boffetta P, Aagnes B, Weiderpass E, Andersen A. Smokeless tobacco use and risk of cancer of the pancreas and other organs. Int J Cancer. 2005;114:992–995. doi: 10.1002/ijc.20811. [DOI] [PubMed] [Google Scholar]
- 57.Lewin F, Norell SE, Johansson H, Gustavsson P, Wennerberg J, Biörklund A, et al. Smoking tobacco, oral snuff, and alcohol in the etiology of squamous cell carcinoma of the head and neck: a population-based case-referent study in Sweden. Cancer. 1998;82:1367–1375. doi: 10.1002/(sici)1097-0142(19980401)82:7<1367::aid-cncr21>3.0.co;2-3. [DOI] [PubMed] [Google Scholar]
- 58.Luo J, Ye W, Zendehdel K, Adami J, Adami H-O, Boffetta P, et al. Oral use of Swedish moist snuff (snus) and risk for cancer of the mouth, lung, and pancreas in male construction workers: a retrospective cohort study. Lancet. 2007;369:2015–2020. doi: 10.1016/S0140-6736(07)60678-3. [DOI] [PubMed] [Google Scholar]
- 59.Rosenquist K, Wennerberg J, Schildt E-B, Bladström A, Hansson BG, Andersson G. Use of Swedish moist snuff, smoking and alcohol consumption in the aetiology of oral and oropharyngeal squamous cell carcinoma. A population-based case-control study in southern Sweden. Acta Otolaryngol. 2005;125:991–998. doi: 10.1080/00016480510043440. [DOI] [PubMed] [Google Scholar]
- 60.Schildt E-B, Eriksson M, Hardell L, Magnuson A. Oral snuff, smoking habits and alcohol consumption in relation to oral cancer in a Swedish case-control study. Int J Cancer. 1998;77:341–346. doi: 10.1002/(sici)1097-0215(19980729)77:3<341::aid-ijc6>3.0.co;2-o. [DOI] [PubMed] [Google Scholar]
- 61.Mashberg A, Boffetta P, Winkelman R, Garfinkel L. Tobacco smoking, alcohol drinking, and cancer of the oral cavity and oropharynx among U.S. veterans. Cancer. 1993;72:1369–1375. doi: 10.1002/1097-0142(19930815)72:4<1369::aid-cncr2820720436>3.0.co;2-l. [DOI] [PubMed] [Google Scholar]
- 62.Sapkota A, Gajalakshmi V, Jetly DH, Roychowdhury S, Dikshit RP, Brennan P, et al. Smokeless tobacco and increased risk of hypopharyngeal and laryngeal cancers: a multicentric case–control study from India. Int J Cancer. 2007;121:1793–1798. doi: 10.1002/ijc.22832. [DOI] [PubMed] [Google Scholar]
- 63.Akhtar S, Sheikh AA, Qureshi HU. Chewing areca nut, betel quid, oral snuff, cigarette smoking and the risk of oesophageal squamous-cell carcinoma in South Asians: a multicentre case–control study. Eur J Cancer. 2012;48:655–661. doi: 10.1016/j.ejca.2011.06.008. [DOI] [PubMed] [Google Scholar]
- 64.Dar NA, Bhat GA, Shah IA, Iqbal B, Makhdoomi MA, Nisar I, et al. Hookah smoking, nass chewing, and oesophageal squamous cell carcinoma in Kashmir, India. Br J Cancer. 2012;107:1618–1623. doi: 10.1038/bjc.2012.449. [DOI] [PMC free article] [PubMed] [Google Scholar]
- 65.Sehgal S, Kaul S, Gupta BB, Dhar MK. Risk factors and survival analysis of the esophageal cancer in the population of Jammu, India. Indian J Cancer. 2012;49:245–250. doi: 10.4103/0019-509X.102921. [DOI] [PubMed] [Google Scholar]
- 66.Talukdar FR, Ghosh SK, Laskar RS, Mondal R. Epigenetic, genetic and environmental interactions in esophageal squamous cell carcinoma from northeast India. PLoS One. 2013;8:e60996. doi: 10.1371/journal.pone.0060996. [DOI] [PMC free article] [PubMed] [Google Scholar]
- 67.Lagergren J, Bergström R, Lindgren A, Nyrén O. The role of tobacco, snuff and alcohol use in the aetiology of cancer of the oesophagus and gastric cardia. Int J Cancer. 2000;85:340–346. [PubMed] [Google Scholar]
- 68.Zendehdel K, Nyrén O, Luo J, Dickman PW, Boffetta P, Englund A, et al. Risk of gastroesophageal cancer among smokers and users of Scandinavian moist snuff. Int J Cancer. 2008;122:1095–1099. doi: 10.1002/ijc.23076. [DOI] [PubMed] [Google Scholar]
- 69.Bolinder G, Alfredsson L, Englund A, de Faire U. Smokeless tobacco use and increased cardiovascular mortality among Swedish construction workers. Am J Public Health. 1994;84:399–404. doi: 10.2105/ajph.84.3.399. [DOI] [PMC free article] [PubMed] [Google Scholar]
- 70.Sasco AJ, Merrill RM, Dari I, Benhaïm-Luzon V, Carriot F, Cann CI, et al. A case--control study of lung cancer in Casablanca, Morocco. Cancer Causes Control. 2002;13:609–616. doi: 10.1023/a:1019504210176. [DOI] [PubMed] [Google Scholar]
- 71.Brown LM, Blot WJ, Schuman SH, Smith VM, Ershow AG, Marks RD, et al. Environmental factors and high risk of esophageal cancer among men in coastal South Carolina. J Natl Cancer Inst. 1988;80:1620–1625. doi: 10.1093/jnci/80.20.1620. [DOI] [PubMed] [Google Scholar]
- 72.Alguacil J, Silverman DT. Smokeless and other noncigarette tobacco use and pancreatic cancer: a case-control study based on direct interviews. Cancer Epidemiol Biomark Prev. 2004;13:55–58. doi: 10.1158/1055-9965.epi-03-0033. [DOI] [PubMed] [Google Scholar]
- 73.Hassan MM, Abbruzzese JL, Bondy ML, Wolff RA, Vauthey J-N, Pisters PW, et al. Passive smoking and the use of noncigarette tobacco products in association with risk for pancreatic cancer: a case-control study. Cancer. 2007;109:2547–2556. doi: 10.1002/cncr.22724. [DOI] [PMC free article] [PubMed] [Google Scholar]
- 74.Khan Z, Dreger S, Shah SMH, Pohlabeln H, Khan S, Ullah Z, et al. Oral cancer via the bargain bin: the risk of oral cancer associated with a smokeless tobacco product (Naswar) PLoS One. 2017;12:e0180445. doi: 10.1371/journal.pone.0180445. [DOI] [PMC free article] [PubMed] [Google Scholar]
- 75.Mahapatra S, Kamath R, Shetty BK, Binu VS. Risk of oral cancer associated with gutka and other tobacco products: a hospital-based case-control study. J Cancer Res Ther. 2015;11:199–203. doi: 10.4103/0973-1482.143332. [DOI] [PubMed] [Google Scholar]
- 76.Merchant AT, Pitiphat W. Total, direct, and indirect effects of paan on oral cancer. Cancer Causes Control. 2015;26:487–491. doi: 10.1007/s10552-014-0516-x. [DOI] [PMC free article] [PubMed] [Google Scholar]
- 77.Alexander M. Tobacco use and the risk of cardiovascular diseases in developed and developing countries. University of Cambridge; 2013. https://www.repository.cam.ac.uk/handle/1810/245058..
- 78.Rahman MA, Zaman MM. Smoking and smokeless tobacco consumption: possible risk factors for coronary heart disease among young patients attending a tertiary care cardiac hospital in Bangladesh. Public Health. 2008;122:1331–1338. doi: 10.1016/j.puhe.2008.05.015. [DOI] [PubMed] [Google Scholar]
- 79.Rahman MA, Spurrier N, Mahmood MA, Rahman M, Choudhury SR, Leeder S. Is there any association between use of smokeless tobacco products and coronary heart disease in Bangladesh? PLoS One. 2012;7:e30584. doi: 10.1371/journal.pone.0030584. [DOI] [PMC free article] [PubMed] [Google Scholar]
- 80.Agashe A, Gawde N. Stroke and the use of smokeless tobacco--a case-control study. Healthline. 2013;4:13–18. [Google Scholar]
- 81.Huhtasaari F, Asplund K, Lundberg V, Stegmayr B, Wester PO. Tobacco and myocardial infarction: is snuff less dangerous than cigarettes? BMJ. 1992;305:1252–1256. doi: 10.1136/bmj.305.6864.1252. [DOI] [PMC free article] [PubMed] [Google Scholar]
- 82.Huhtasaari F, Lundberg V, Eliasson M, Janlert U, Asplund K. Smokeless tobacco as a possible risk factor for myocardial infarction: a population-based study in middle-aged men. J Am Coll Cardiol. 1999;34:1784–1790. doi: 10.1016/s0735-1097(99)00409-x. [DOI] [PubMed] [Google Scholar]
- 83.Asplund K, Nasic S, Janlert U, Stegmayr B. Smokeless tobacco as a possible risk factor for stroke in men: a nested case-control study. Stroke. 2003;34:1754–1759. doi: 10.1161/01.STR.0000076011.02935.A1. [DOI] [PubMed] [Google Scholar]
- 84.Hergens M-P, Ahlbom A, Andersson T, Pershagen G. Swedish moist snuff and myocardial infarction among men. Epidemiology. 2005;16:12–16. doi: 10.1097/01.ede.0000147108.92895.ba. [DOI] [PubMed] [Google Scholar]
- 85.Haglund B, Eliasson M, Stenbeck M, Rosén M. Is moist snuff use associated with excess risk of IHD or stroke? A longitudinal follow-up of snuff users in Sweden. Scand J Public Health. 2007;35:618–622. doi: 10.1080/14034940701436949. [DOI] [PubMed] [Google Scholar]
- 86.Hergens M-P, Alfredsson L, Bolinder G, Lambe M, Pershagen G, Ye W. Long-term use of Swedish moist snuff and the risk of myocardial infarction amongst men. J Intern Med. 2007;262:351–359. doi: 10.1111/j.1365-2796.2007.01816.x. [DOI] [PubMed] [Google Scholar]
- 87.Wennberg P, Eliasson M, Hallmans G, Johansson L, Boman K, Jansson J-H. The risk of myocardial infarction and sudden cardiac death amongst snuff users with or without a previous history of smoking. J Intern Med. 2007;262:360–367. doi: 10.1111/j.1365-2796.2007.01813.x. [DOI] [PubMed] [Google Scholar]
- 88.Hergens M-P, Lambe M, Pershagen G, Terent A, Ye W. Smokeless tobacco and the risk of stroke. Epidemiology. 2008;19:794–799. doi: 10.1097/EDE.0b013e3181878b33. [DOI] [PubMed] [Google Scholar]
- 89.Hansson J, Pedersen NL, Galanti MR, Andersson T, Ahlbom A, Hallqvist J, et al. Use of snus and risk for cardiovascular disease: results from the Swedish Twin Registry. J Intern Med. 2009;265:717–724. doi: 10.1111/j.1365-2796.2009.02081.x. [DOI] [PubMed] [Google Scholar]
- 90.Janzon E, Hedblad B. Swedish snuff and incidence of cardiovascular disease. A population-based cohort study BMC Cardiovasc Disord. 2009;9:21. doi: 10.1186/1471-2261-9-21. [DOI] [PMC free article] [PubMed] [Google Scholar]
- 91.GBD Results Tool | GHDx. http://ghdx.healthdata.org/gbd-results-tool. Accessed 6 Apr 2020. Accessed 6 Apr 2020.
- 92.Singh PK, Yadav A, Lal P, Sinha DN, Gupta PC, Swasticharan L, et al. Dual burden of smoked and smokeless tobacco use in India, 2009–2017: a repeated cross-sectional analysis based on global adult tobacco survey. Nicotine Tobacco Research. 2020. 10.1093/ntr/ntaa033. [DOI] [PubMed]
- 93.Mehrotra R, Yadav A, Sinha DN, Parascandola M, John RM, Ayo-Yusuf O, et al. Smokeless tobacco control in 180 countries across the globe: call to action for full implementation of WHO FCTC measures. Lancet Oncol. 2019;20:e208–e217. doi: 10.1016/S1470-2045(19)30084-1. [DOI] [PubMed] [Google Scholar]
- 94.Siddiqi K, Islam Z, Khan Z, Siddiqui F, Mishu M, Dogar O, et al. Identification of policy priorities to address the burden of smokeless tobacco in Pakistan: a multimethod analysis. Nicotine Tob Res. 2019. 10.1093/ntr/ntz163. [DOI] [PMC free article] [PubMed]
- 95.Mehrotra R, Kaushik N, Kaushik R. Why smokeless tobacco control needs to be strengthened? Cancer Control. 2020;27:1073274820914659. doi: 10.1177/1073274820914659. [DOI] [PMC free article] [PubMed] [Google Scholar]
Associated Data
This section collects any data citations, data availability statements, or supplementary materials included in this article.
Supplementary Materials
Additional file 1. Supplementary description of methods and results sections.
Data Availability Statement
All data generated or analysed during this study are included in this published article and its supplementary information file 1.