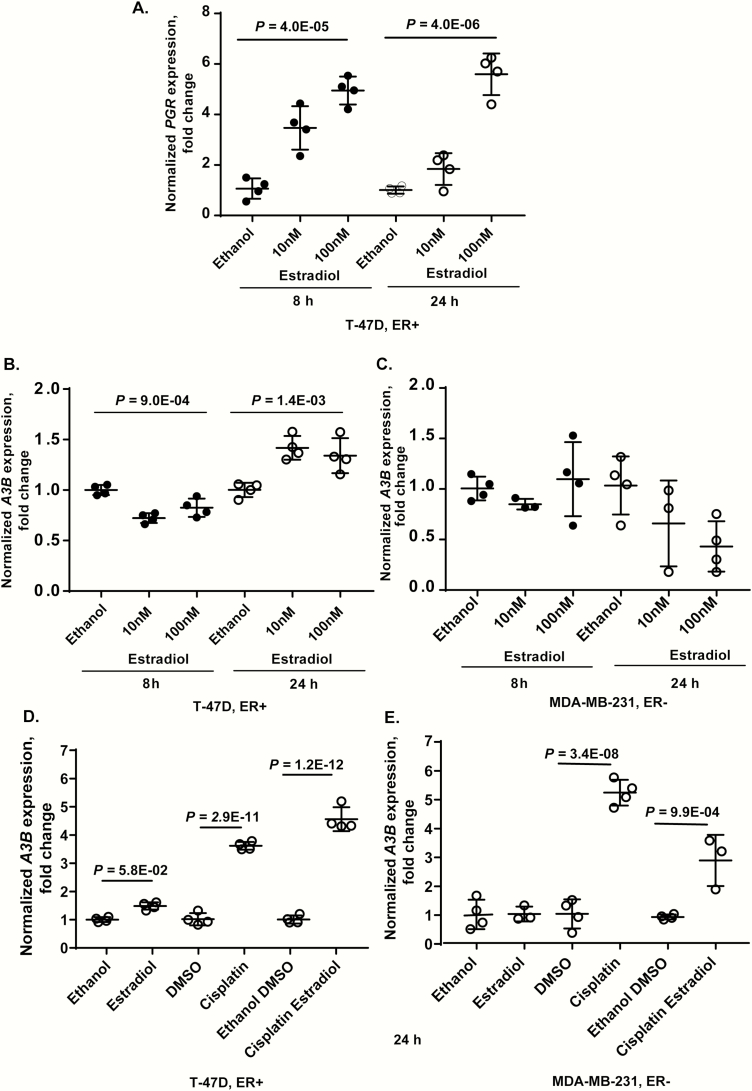
Figure 1.
Expression of PGR and APOBEC3B (A3B) in breast cancer cell lines. (A) Estradiol treatment significantly induced PGR expression in the ER+ cell line T-47D but expression of PGR was not detectable in the ER− cell line MDA-MB-231 at baseline or after treatment (data not shown); (B and C) estradiol treatment reduced A3B expression at 8 h but induced at 24 h in the ER+ cell line, without causing significant effects in the ER− cell line; (D and E) expression of A3B in ER+ and ER− breast cancer cell lines treated for 24 h with 100 nM estradiol, 40 µM cisplatin or a combination of these drugs. In the ER+ cell line, expression of A3B induced by the combination of estradiol and cisplatin was significantly higher than by estradiol alone (P = 2.64E−12) or cisplatin alone (P = 1.25E−04). In the ER− cell line, expression of A3B induced by the combination of estradiol and cisplatin was significantly higher than by estradiol alone (P = 3.0E−3) but lower than by cisplatin alone (P = 1.39E−04). All results are presented as fold difference comparing treatment conditions to vehicle only (ethanol and dimethyl sulfoxide for estradiol and cisplatin, respectively) at corresponding time points. Plots show values for individual replicates, group means and standard deviations. P-values are for one-way analysis of variance, based on biological replicates. For D and E plots—P-values are for one-way analysis of variance between all groups with Tukey test applied for comparisons between the indicated groups.

