

Abstract
Background:
A systematic review of clinical decision rules to identify patients at low risk for community-acquired pneumonia (CAP) has not been previously presented in the literature.
Methods:
A systematic review of MEDLINE for prospective studies that used at least 2 signs, symptoms, or point-of-care tests to determine the likelihood of CAP. We included studies that enrolled adults and adolescents in the outpatient setting where all or a random sample of patients received a chest radiograph as the reference standard. We excluded retrospective studies and studies that recruited primarily patients with hospital-acquired CAP.
Results:
Our search identified 974 articles, 12 of which were included in the final analysis. The simple heuristic of normal vital signs (temperature, respiratory rate, and heart rate) to identify patients at low risk for CAP was reported by 4 studies and had a summary estimate of the negative likelihood ratio (LR−) of 0.24 (95% CI, 0.17 to 0.34) and a sensitivity of 0.89 (95% CI, 0.79 to 0.94). The simple heuristic of normal vital signs combined with a normal pulmonary examination to identify patients at low risk for CAP was reported by 3 studies, and had a summary estimate of LR− of 0.10 (95% CI, 0.07 to 0.13) with an area under the receiver operating characteristic curve of 0.92.
Conclusions:
Adults with an acute respiratory infection who have normal vital signs and a normal pulmonary examination are very unlikely to have CAP. Given a baseline CAP risk of 4%, these patients have only a 0.4% likelihood of Cap.
Keywords: Community-Acquired Infections, Meta-Analysis, Outpatients, Pneumonia, Prospective Studies, Systematic Review
Community-acquired pneumonia (CAP) is a significant source of morbidity and mortality for adults in the United States. Episodes requiring hospitalization occur at an estimated annual incidence rate of 25 to 36 cases per 10,000 adults, trailing only live births as a reason for hospitalization.1,2 In 2015, there were over 50,000 deaths due to pneumonia (about 1.6 deaths per 10,000 persons) and when combined with influenza, it is the eighth leading cause of death in the United States.3
The recommended test for diagnosing CAP is by chest radiograph (CXR).4 However, obtaining a CXR in all outpatients with acute cough would be costly, inconvenient, and would expose many patients to radiation unnecessarily. A way to limit unnecessary testing of these patients is by stratifying risk of CAP based on the clinical presentation. Patients identified as low risk for CAP could avoid the need for CXR and antibiotics, reducing overall health system costs, antibiotic use, and unnecessary radiation exposure.
A clinical decision rule (CDR) is an algorithm, point score, or simple heuristic (ie, rule of thumb”) that categorizes patients as having a risk for disease as confirmed by a valid reference standard test. These are typically developed with a multivariate analysis using independent predictors such as demographics, signs, symptoms, and point-of-care (POC) tests. An example of a CDR is the Strep Score (widely known as the Centor Score), which uses tonsillar exudates, swollen tender anterior cervical nodes, lack of a cough, and history of fever to categorize the risk of strep throat.5
While the use of signs and symptoms to diagnose CAP has been well studied,6–9 the focus has generally been on diagnosing CAP rather than on ruling it out. For the outpatient primary care physician, especially one who does not have ready access to chest radiography, the question of ruling out CAP is equally relevant. In this study, we systematically reviewed the literature to identify CDRs that may be used to rule out CAP in otherwise-healthy adults, also known as “low-risk criteria” for CAP. Our goal is to identify the combination(s) of signs (including vital signs), symptoms, and POC tests with the lowest negative likelihood ratio (LR−), to help physicians confidently rule out CAP without having to obtain a CXR in the outpatient setting.
Methods
Inclusion and Exclusion Criteria
Our search was designed to identify studies that used a CDR to diagnose, predict, or rule out CAP in the outpatient setting. A study was included if it used a CXR or computed tomography scan as the primary reference standard and was given to all patients enrolled in the study. If the reference standard was used in a random or systematic sample of low-risk CAP patients to minimize radiation exposure, the study was also included. Studies had to gather data prospectively and only studies that recruited adults or adolescents in an outpatient setting (emergency department, urgent care, primary care, or outpatient clinic) were included.
Studies where a majority of the enrolled patients had hospital-acquired or ventilator-associated pneumonia, were immunocompromised, or that were conducted in special populations such as military or nursing homes were excluded. We excluded studies that were not prospective, such as case-control studies, case reports, and outbreak investigations. An exception was made if the case-control study enrolled symptomatic patients prospectively, such as a consecutive series where patients with similar symptoms but with and without CAP were matched.
Search Strategy
We performed a systematic review of articles published in MEDLINE from inception to January 2017 (Appendix A). Any systematic reviews that appeared in our results were reviewed for relevant articles that fit our inclusion and exclusion criteria. We also searched the reference lists of any article that were reviewed in full text form.
Each author independently reviewed the titles and abstracts to identify any articles that required a full text review. Any article identified by at least 1 reviewer had its full text reviewed. The full text review and all data abstraction methods described hereafter were performed independently, in parallel, by 2 authors with a third author who helped resolve any discrepancies. We used the Preferred Reporting Items for Systematic Reviews and MetaAnalyses (PRISMA)10 to document our search process.
Data Abstraction and Analysis
We first abstracted the study characteristics, including the combination of signs, symptoms, or POC tests that were used to diagnose CAP. Articles were assessed for bias using the Quality Assessment Tool for Diagnostic Accuracy Studies (QUADAS-2) framework adapted for our study.11 The evaluation consists of 4 areas: patient selection, index test, reference standard, and flow and timing. For each, a set of questions assess the article for bias, answering yes, no, high, low, or unknown. A final overall assessment for each article was given a low, moderate, or high risk for bias.
When available, true positive (CDR+, CAP+), false positive (CDR+, CAP−), true negative (CDR−, CAP−) and false negative (CDR−, CAP+) rates of each CDR were recorded. When not directly provided, they were calculated using data from the study. These data were used to calculate positive and negative likelihood ratios (LR+ and LR−) for CDRs reporting a dichotomous outcome of CAP versus no CAP, and stratum-specific likelihood ratios (SSLRs) for CDRs reporting more than 2 possible outcomes (eg, low-, moderate-, and high-risk groups). Post-test probabilities were calculated for standardized low-prevalence (4%) and high-prevalence (20%) populations, to represent typical outpatient primary care and emergency department populations respectively, using summary estimates of likelihood ratios for high-performing CDRs.6,12
Lastly, we calculated 3 risk groups (low, moderate, and high) as part of a post-hoc analysis of any CDR that was based on a multichotomous score.6,7 The risk groups were assigned based on the distribution of likelihood ratios from the studies’ published data.
If 3 or more studies reported data for a single CDR, we performed a bivariate meta-analysis to calculate summary estimates and 95% confidence intervals for sensitivity, specificity, LR+, LR−, and the area under the receiver operating characteristic curves (AUROCCs). These were performed using the mada (Meta-Analysis of Diagnostic Accuracy) package in R, version 3.4.3 (R Foundation for Statistical Computing, Vienna, Austria) using the Reitsma method.13
Institutional Review Board approval was classified as exempt as this was a secondary analysis of previously published data, and no funding was provided for this research.
Results
Our initial search strategy identified 974 articles (Figure 1). The title and abstract review eliminated 906 articles. Sixty-eight articles had full text review and after identifying an additional 42 articles through a bibliography review, we excluded 98. The most common reasons to exclude a study were because it was not prospective, was a literature review or guideline, did not report any usable patient data, or did not present data that met our criteria for a CDR. An updated search before writing (January 2018) did not yield additional studies to add. A final total of 12 studies were included.6–9,14–21
Figure 1.
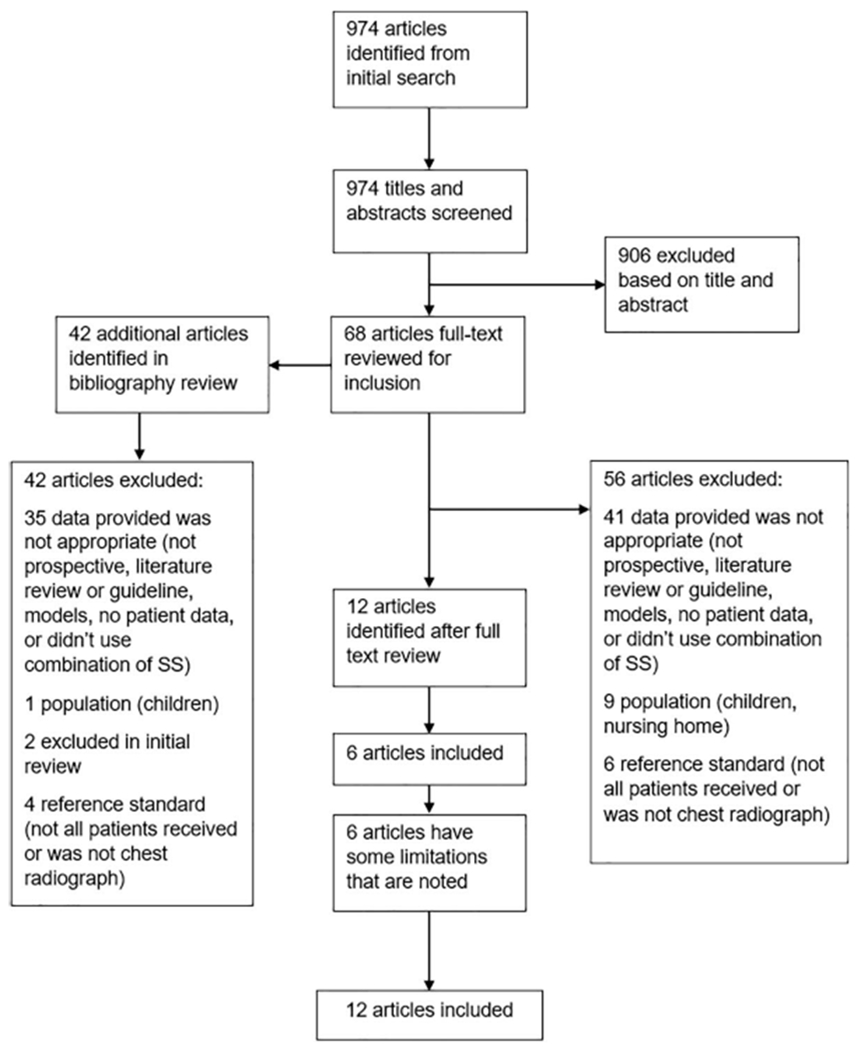
PRISMA flow diagram of search strategy and selection of articles.
Study Characteristics and Quality Assessment
Study characteristics are summarized in Table 1. Almost half were performed in the United States6,7,14,16,20 and no other country appeared more than once. Enrollment of patients occurred from 1984 to 2010, with a mean age between 32 and 65 years. Six studies were performed in the emergency department setting and the other 6 in primary care. Sample sizes ranged from 246 to 2820 patients.
Table 1.
Characteristics of Included Studies
| Author, Year | Country | Design | Setting | Year Recruited | Sample Size | Inclusion Age | Mean or Median Age |
|---|---|---|---|---|---|---|---|
| Diehr, 19847 | United States | Prospective | ED | Not reported | 1758 | Adults | Not reported |
| Gennis, 198920 | United States | Prospective | ED | 1984 to 1985 | 308 | ≥16 years | 53.6 years (mean) |
| Singal, 198914 | United States | Prospective | ED | 1986 to 1987 | 255 | ≥18 years | Not reported |
| Heckerling, 19907 | United States | Prospective | ED | 1987 to 1988 | 1436 | ≥16 years | 45.4 years (mean): Illinois/Nebraska; 41.4 years (mean): Virginia |
| Melbye, 199217 | Norway | Prospective | ED | 1988 to 1989 | 581 | ≥18 years | 32.1 (mean) |
| Hopstaken, 200318 | The Netherlands | Cross-sectional/prospective | Primary care | 1998 to 1999 | 246 | ≥18 years | 52 years (mean) |
| O’Brien, 200616 | United States | Case-control/prospective | Outpatient/ED | 2004 to 2005 | 700 | ≥18 years | 65 years (mean): cases; 66 years (mean): controls |
| Holm, 200719 | Denmark | Prospective | Primary care | 2002 to 2003 | 364 | ≥18 years | 50 years (median) |
| Saldias, 200715 | Chile | Prospective | ED | 2005 | 325 | ≥15 years | 53.4 years (mean) |
| Steurer, 20118 | Switzerland | Prospective | Primary care | 2006 to 2009 | 621 | ≥18 years | 46.8 years (mean) |
| van Vugt, 20139 | 12 European countries | Prospective | Primary care | 2007 to 2010 | 2820 | Adults | 50 years (mean) |
| Ebrahimzadeh, 201521 | Iran | Case-control/prospective | Outpatient/ED | 2008 to 2009 | 840 | ≥18 years | 60 years (mean): cases; 63 years (mean): controls |
ED, emergency department.
The QUADAS-2 assessment of bias for the 12 studies is presented in Appendix B1. Overall, 6 studies were determined to be at low risk of bias and the other 6 at moderate risk of bias. Those that were moderate risk were only included after consideration of their limitations.6,14,16,17,20,21 Two were case control studies16,21 but enrolled patients prospectively in a consecutive series, and a CXR was performed on each patient. In 1 study,17 not all patients received the reference standard CXR; those with a low probability of CAP were randomized to receive one or not. The final 3 studies that we included6,14,20 enrolled patients when a CXR was ordered because pneumonia was suspected or the physician considered the probability of pneumonia to be greater than zero. We chose to accept this limitation because we are interested in when it is appropriate to order a CXR for CAP in this clinical situation.
Clinical Decision Rules Identified
Studies evaluated CDRs with between 3 and 10 elements (Appendix B2). The 4 individual signs or symptoms that appeared in at least half of the studies were elevated temperature, elevated heart rate, crackles on auscultation, and decreased breath sounds. Elevated temperature was the most common shared sign or symptom, found in 10 of the 12 studies. The definition of elevated temperature was not consistent, with some using greater than 37.8°C, some greater than 38.0°C, and 2 described as just “fever.” The other 3 signs or symptoms were used in 6 studies.
Three studies evaluated a simple point score (see Appendix B3 for calculation of the scores, which had varying points assigned to each of the symptoms). These scores and their classification of patients into post hoc low-, moderate-, and high-risk groups is summarized in Table 2.6,7,9 In the study of Diehr and colleagues,7 patients with a score from −3 to 0 had a SSLR of 0.47, and a 1.2% probability of CAP given a baseline prevalence of 2.6%. The high-risk group had a 27.3% probability of CAP and a SSLR of 14.0.
Table 2.
Clinical Decision Rules That Used a Point Score to Diagnose Pneumonia
| Author, Year (Signs, Symptoms, Tests Used in CDR) | CDR Score | CAP | No CAP | PV | LR |
|---|---|---|---|---|---|
| Diehr, 19847 (>37.8°C, >25 breath/min, myalgia, night sweats, sputum, sore throat, rhinorrhea) | −3 | 0 | 140 | 0.0% | 0.00 |
| −2 | 4 | 552 | 0.7% | 0.27 | |
| −1 | 8 | 504 | 1.6% | 0.59 | |
| 0 | 7 | 316 | 2.2% | 0.82 | |
| 1 | 12 | 124 | 8.8% | 3.60 | |
| 2 | 6 | 52 | 10.3% | 4.29 | |
| 3 | 4 | 12 | 25.0% | 12.41 | |
| 4 | 3 | 8 | 27.3% | 13.96 | |
| 5 | 1 | 4 | 20.0% | 9.30 | |
| 6 | 1 | 0 | 100.0% | † | |
| Total | 46 | 1712 | |||
| Low: −3 to −2* | 4 | 1512 | 0.3% | 0.10 | |
| Mod: −1 to 1* | 27 | 176 | 13.3% | 5.7 | |
| High: 2 to 6* | 15 | 24 | 38.5% | 23.3 | |
| Heckerling, 19906 (>37.8°C, HR >100/min, rales, absence of asthma, decrease breath sounds) | Derivation: Illinois | ||||
| 0 | 1 | 48 | 2.0% | 0.12 | |
| 1 | 11 | 316 | 3.4% | 0.20 | |
| 2 | 28 | 232 | 10.8% | 0.70 | |
| 3 | 42 | 149 | 22.0% | 1.64 | |
| 4 | 37 | 30 | 55.2% | 7.18 | |
| 5 | 15 | 5 | 75.0% | 17.5 | |
| Total | 134 | 780 | |||
| Low: 0 to 1* | 12 | 364 | 3.2% | 0.19 | |
| Mod: 2 to 3* | 70 | 381 | 15.5% | 1.07 | |
| High: 4 to 5* | 52 | 35 | 59.8% | 8.6 | |
| Validation: Nebraska | |||||
| 0 | 0 | 5 | 0.0% | 0.000 | |
| 1 | 3 | 28 | 9.7% | 0.20 | |
| 2 | 11 | 26 | 29.7% | 0.78 | |
| 3 | 12 | 16 | 42.9% | 1.38 | |
| 4 | 11 | 2 | 84.6% | 10.1 | |
| 5 | 5 | 0 | 100.0% | † | |
| Total | 42 | 77 | |||
| Low: 0 to 1* | 3 | 33 | 8.3% | 0.17 | |
| Mod: 2 to 3* | 23 | 42 | 35.4% | 1.00 | |
| High: 4 to 5* | 16 | 2 | 88.9% | 14.7 | |
| Validation: Virginia | |||||
| 0 | 1 | 7 | 12.5% | 0.51 | |
| 1 | 2 | 30 | 6.3% | 0.24 | |
| 2 | 8 | 44 | 15.4% | 0.65 | |
| 3 | 6 | 16 | 27.3% | 1.35 | |
| 4 | 11 | 8 | 57.9% | 4.93 | |
| 5 | 1 | 0 | 100.0% | † | |
| Total | 29 | 104 | |||
| Low: 0 to 1* | 3 | 37 | 7.5% | 0.29 | |
| Mod: 2 to 3* | 14 | 60 | 18.9% | 0.84 | |
| High: 4 to 5* | 12 | 8 | 60.0% | 54 | |
| Pooled | |||||
| 0 | 2 | 60 | 3.2% | 0.16 | |
| 1 | 16 | 374 | 4.1% | 0.20 | |
| 2 | 47 | 302 | 13.5% | 0.73 | |
| 3 | 60 | 181 | 24.9% | 1.55 | |
| 4 | 59 | 40 | 59.6% | 6.92 | |
| 5 | 21 | 5 | 80.8% | 19.7 | |
| Total | 60 | 205 | |||
| Low: 0 to 1* | 18 | 434 | 4.0% | 0.19 | |
| Mod: 2 to 3* | 107 | 483 | 18.1% | 1.04 | |
| High: 4 to 5* | 80 | 45 | 64.0% | 8.33 | |
| van Vugt, 20139 (decreased breath sounds, crackles, breathlessness, vesicular breath sounds, absence of runny nose, >37.8C, HR >100/min, CRP >30) | CDRw/outCRP | ||||
| Low: <2.5% | 11 | 654 | 1.7% | 0.32 | |
| Mod: 2.5% to 20% | 105 | 1987 | 5.0% | 1.01 | |
| High: >20% | 24 | 39 | 38.1% | 11.8 | |
| Total | 140 | 2680 | |||
| CDR and CRP >30 | |||||
| Low: 0 | 4 | 568 | 0.7% | 0.14 | |
| Mod: 1 to 2 | 73 | 1829 | 3.8% | 0.76 | |
| High: ≥3 | 63 | 283 | 18.2% | 4.26 | |
| Total | 140 | 2680 |
CAP, community-acquired pneumonia; CDR, clinical decision rule; CRP, c-reactive protein; HR, heart rate; NR, not reported; LR, likelihood ratio; PV, predictive value.
Risk groups calculated post hoc and were not in original publication.
Unable to calculate due to zero value for no CAP.
Heckerling and colleagues6 used a derivation set (Illinois) to develop a point score and then validated it with data from 2 other locations (Nebraska and Virginia). The Illinois derivation set had an AUROCC of 0.82 (95% CI, 0.78 to 0.86), while the Nebraska and Virginia validation sets had AUROCCs of 0.82 (95% CI, 0.74 to 0.90) and 0.76 (95% CI, 0.66 to 0.86), respectively. Low-, moderate-, and high-risk groups were created post hoc for the derivation set and validation set, and were pooled for the entire study. Overall, patients presenting with no or 1 abnormal finding in the pooled set had a low risk of CAP, with a probability of 4.0% given a baseline prevalence of 29.2% and a SSLR of 0.19. The high-risk group with 4 or 5 abnormal findings had a 64.0% probability of CAP and a SSLR of 8.3.
The study by Van Vugt9 and colleagues incorporated a POC test, c-reactive protein (CRP). The overall model had an AUROCC of 0.77 (0.73 to 0.81). The low-risk group with a score of zero, had 0.7% probability of CAP given a prevalence of 5.2%, with a SSLR of 0.14. The SSLRs for moderate and high-risk groups were 0.76 and 4.3, respectively.
The remaining 9 studies reported the accuracy of 18 simple heuristics that predict a dichotomous outcome of CAP versus no CAP (Appendix B4). A CDR using the presence of normal vital signs to exclude CAP was the most common, appearing in 4 studies,15,16,20,21 while a CDR using normal vital signs plus a normal pulmonary examination to exclude CAP appeared in 3 studies.15,16,21
Fourteen CDRs have good sensitivities (above 75%) while 12 lacked specificity (below 60%). The highest sensitivity was 100%, for a clinical decision tree that used CRP less than 10 μg/mL or CRP 11 to 50 μg/mL and absence of dyspnea or daily fever to exclude CAP.8 Only 2 studies reported CDRs that were both sensitive and specific (86%/72% and 81%/64%), and both used normal vital signs to exclude CAP (temperature, heart rate, and respiratory rate).16,21
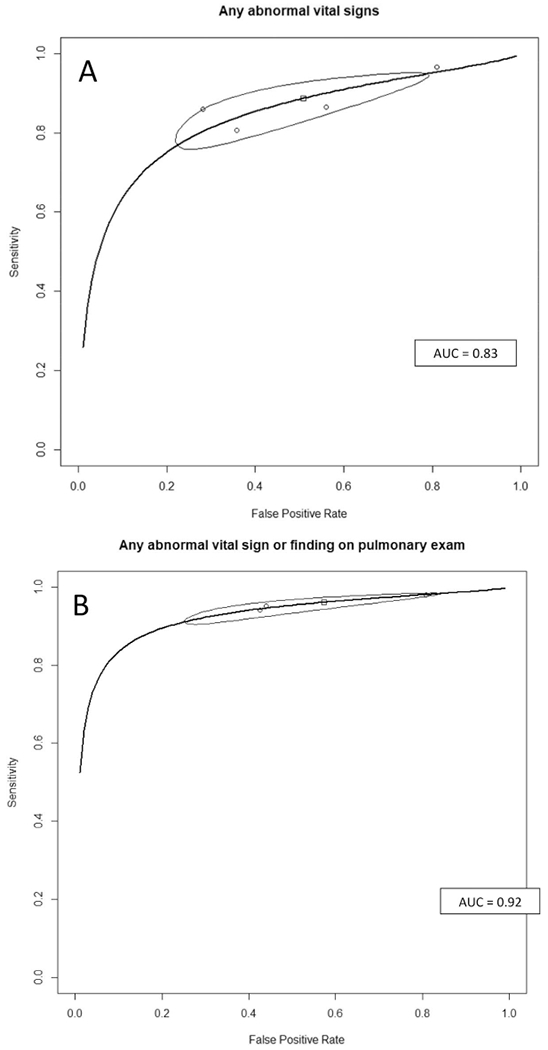
Normal vital signs accompanied by no findings on a pulmonary examination rules out CAP well, with 3 studies of this CDR having LR−s 0.09 to 0.11.15,16,21 A meta-analysis of the 4 studies that reported normal vital signs15,16,20,21 as low-yield criteria for CAP had a summary estimate of sensitivity of 0.89 (95% CI, 0.79 to 0.94) and a summary LR− of 0.24 (95% CI, 0.17 to 0.34) (Table 3). The summary receiver operating characteristic (ROC) curve (Appendix C) has good discrimination and a narrow confidence interval, with an AUROCC of 0.89. For the studies reporting the combination of normal vital signs plus normal findings on the pulmonary examination to exclude CAP,15,16,21 the overall sensitivity was 0.96 (95% CI, 0.92 to 0.98) and the LR− 0.10 (95% CI, 0.07 to 0.13). The summary ROC curve for this CDR also had a narrow confidence range around the summary estimate, with an AUROCC of 0.92.
Table 3.
Summary Estimates of Meta-Analysis for the Diagnostic Accuracy of Clinical Decision Rules that Diagnose (Rule in) CAP
| CDR Used to Diagnose CAP (Rule in) | Sensitivity (95% CI) | Specificity (95% CI) | LR+ (95% CI) | LR− (95% CI) | AUROCC |
|---|---|---|---|---|---|
| Any abnormal vital signs | 0.89 (0.79 to 0.94) | 0.49 (0.25 to 0.73) | 1.84 (1.25 to 3.03) | 0.24 (0.17 to 0.34) | 0.83 |
| Any abnormal signs or any abnormal pulmonary exam finding | 0.96 (0.92 to 0.98) | 0.43 (0.20 to 0.69) | 1.79 (1.22 to 3.01) | 0.10 (0.07 to 0.13) | 0.92 |
AUROCC, area under the receiver operating characteristic curve; CAP, community-acquired pneumonia; CDR, clinical decision rule; CI, confidential interval; LR, likelihood ratio.
Discussion
In this systematic review, we identified 2 potentially useful low-risk criteria for use in the outpatient setting to identify patients at very low risk of CAP: normal vital signs, and normal vital signs plus normal pulmonary findings. The latter simple heuristic performed very well, with very high sensitivity (0.96), low LR− (0.10), and an AUROCC of 0.92.
Only 1 study included a physician’s overall clinical impressions as part of the CDR.19 It also included CRP and oxygen saturation, and had unhelpfully high LR− (0.35 to 0.74). Further study of the physician’s overall clinical impression would be helpful, including studies to identify which components of the impression had the greatest impact on decision making.
In our systematic review, 5 studies incorporated CRP in their CDR.8,9,18,19,21 Among those, a decision tree developed by Steurer et al8 ruled out CAP in all patients with a CRP less than 10 μg/mL or when CRP was between 11 and 50 μg/mL in patients without persistent dyspnea or fever. This is a potentially very useful CDR that requires prospective validation. In a large, multi-country, prospective study of over 2500 patients where the prevalence of CAP was 5%, the addition of CRP to the score improved discrimination based on the area under the ROC and diagnostic accuracy.9
Of the 12 studies included, 3 were CDRs using a point score. For each rule, the low-risk group had a negative likelihood ratio less than 0.2. In a standardized low prevalence setting (4%), intended to simulate the prevalence of CAP among patients with acute cough in primary care, these scores would reduce the likelihood of CAP in the low-risk group to approximately 0.4% to 0.8% (Table 4). Only 1 of the 3 point scores,6 developed by Heckerling and colleagues, was externally validated, had a large sample size, and of all the CDRs produced in our review had the highest AUROCC. However, it has not been validated in over 20 years. Thus, validation of these CDRs in a contemporary population of patients with acute lower respiratory tract infections or clinically suspected CAP would be helpful.
Table 4.
Simulated Primary Care (4%) and Emergency Department (20%) Prevalence Rates for Selected CDRs
| LR | % CAP Given Baseline Prevalence of | ||
|---|---|---|---|
| Score or CDR | 4% | 20% | |
| Normal signs and no pulmonary finding15,16,21 | 0.10 | 0.4% | 2.4% |
| Normal vital signs15,16,20,21 | 0.24 | 1.0% | 5.7% |
| Diehr, 19847 | |||
| Low (−3 to −2)* | 0.10 | 0.4% | 2.4% |
| Mod (−1 to 1)* | 5.7 | 19.2% | 58.8% |
| High (2 to 6)* | 23.3 | 49.2% | 85.3% |
| Heckerling, 19906 | |||
| Pooled (all 3 states) | |||
| Low (0 to 1)* | 0.19 | 0.8% | 4.6% |
| Mod (2 to 3)* | 1.04 | 4.1% | 20.6% |
| High (4 to 5)* | 8.33 | 25.8% | 67.6% |
| van Vugt, 20139 | |||
| Low (0) | 0.14 | 0.6% | 3.3% |
| Interm (1 to 2) | 0.76 | 3.1% | 16.0% |
| High (≥3) | 4.26 | 15.1% | 51.6% |
Risk groups calculated post hoc and were not in original publication.
CAP, community-acquired pneumonia; CDR, clinical decision rule.
The use of “big data” and machine learning methods with electronic health records (EHRs) will likely be important in the future.22,23 Although EHRs contain a vast amount of patient data, they are often incomplete and are unable to automate the CDR.24 The CDRs found in this systematic review (normal vital signs or normal vital signs and normal pulmonary examination) are simple and allow a physician to quickly rule out CAP and avoid unnecessary CXRs without the need of access to an EHR or other algorithms. These quick decisions are valuable in high turnover settings such as emergency departments or urgent care, which are also where physicians are more likely to encounter adults with a cough.
We are primarily limited by the quality of the included studies, with half of the included studies judged to be a moderate risk of bias. To limit this impact, we only included prospective studies where all participants received the same reference standard. In addition to using MEDLINE, we also reviewed other systematic reviews, the references of included articles, and ran a Google search to assure completeness of the search.
Conclusions
The simple heuristic of normal vital signs and normal pulmonary examination greatly reduces the likelihood of CAP in outpatient with acute cough illness (LR−, 0.1). Clinicians can use this to confidently identify patients with acute cough who do not require a CXR, in the absence of other factors such as signs of malignancy or prolonged symptoms. A simple heuristic that also incorporates CRP is promising, as are several point scores,6,7,9 but these require prospective validation in contemporary outpatient populations.
Appendix A
Search Strategy for MEDLINE:
(“clinical criteria”[TIAB] OR “diagnostic value” [TIAB] OR “predictive value”[TIAB] OR “rule out”[TIAB] OR decision[TIAB] OR prediction-[TIAB]) AND (“pneumonia”[MeSH Terms] OR pneumonia[TIAB] OR pneumoniae[TIAB]) AND (community[TIAB] OR emergency[TIAB] OR urgent[TIAB] OR primary[TIAB] OR acute[TIAB] OR “general practice”[TIAB]) NOT (“hospital-ac-quired”[TIAB] OR “hospital-associated”[TIAB] OR “healthcare-associated”[TIAB] OR nosocomial[TIAB] OR stroke[TIAB] OR klebsiella[TIAB] OR tuberculosis[TIAB] OR surgery[TIAB] OR ventilator[TIAB] OR “intensive care unit”[TIAB] OR “ICU”[TIAB] OR retrospectively[TIAB] OR retrospective[TIAB] OR “case-control”[TIAB] OR “case report”[TIAB] OR “case series”[TIAB] OR gastrointestinal[TIAB] OR immunocompromised-[TIAB] OR HIV[TIAB] OR cancer[TIAB]) AND hasabstract[text].
Appendix B1. Assessment of Study Quality Using the Quality Assessment Tool for Diagnostic Accuracy Studies (QUADAS-2) Framework
| Author, Year | Consecutive or random sample enrolled? (Y/N/U) | Case-control design avoided? (Y/N/U) | Avoided inappropriate exclusion criteria? (Y/N/U) | Likelihood that patient selection could have introduced bias? (H/L/U) | Concerns that included patients and setting do not match the review question? (Y/N/U) | CDR results interpreted without knowledge of reference standard? (Y/N/U) | Likelihood that conduct or interpretation of the CDR have introduced bias? (H/L/U) | Concerns that the CDR differs from the review question? (Y/N/U) | Reference standard likely to correctly classify patients as pneumonia? (Y/N/U) | Reference standard interpreted without knowledge of index test? (Y/N/U) | Likelihood that conduct or interpretation of reference standard introduced bias? (H/L/U) | Conditions defined by the reference standard do not match the review question? (Y/N/U) | All patients receive a reference standard? (Y/N/U) | Did all patients receive the same reference standard? (Y/N/U) | Were all patients included in the analysis? (Y/N/U) | Patient flow have introduced bias? (H/L/U) | Overall assessment of risk of bias (H/M/L) |
|---|---|---|---|---|---|---|---|---|---|---|---|---|---|---|---|---|---|
| Diehr, 1984 | Y | Y | Y | L | N | Y | L | N | Y | Y | L | N | Y | Y | Y | L | L |
| Ebrahimzadeh, 2015 | U | N | Y | H | N | Y | L | N | Y | Y | L | N | Y | Y | Y | L | M |
| Gennis, 1989 | Y | Y | N | H | N | Y | L | N | Y | Y | L | N | Y | Y | Y | L | M |
| Heckerling, 1990 | Y | Y | N | H | N | Y | L | N | Y | Y | L | N | Y | Y | Y | L | M |
| Holm, 2007 | Y | Y | Y | L | N | Y | L | N | Y | Y | L | N | Y | Y | Y | L | L |
| Hopstaken, 2003 | Y | Y | Y | L | N | Y | L | N | Y | Y | L | N | Y | Y | Y | L | L |
| Melbye, 1992 | Y | Y | Y | L | N | Y | L | N | Y | Y | L | N | N | Y | Y | H | M |
| Obrien, 2006 | U | N | Y | H | N | Y | L | N | Y | Y | L | N | Y | Y | Y | L | M |
| Saldias, 2007 | Y | Y | Y | L | N | Y | L | N | Y | Y | L | N | Y | Y | Y | L | L |
| Singal, 1989 | Y | Y | N | H | N | Y | L | N | Y | Y | L | N | Y | Y | Y | L | M |
| Steurer, 2011 | Y | Y | Y | L | N | Y | L | N | Y | Y | L | N | Y | Y | Y | L | L |
| van Vugt, 2013 | Y | Y | Y | L | N | Y | L | N | Y | Y | L | N | Y | Y | Y | L | L |
Y: yes; N: No; U: unknown; H; high, M: moderate; L: low; CDR: clinical decision rule.
Appendix B2. Individual Signs, Symptoms, and Point Care Tests Used in Clinical Decision Rules (CDRs) to Diagnose or Rule Out Pneumonia
| Author, Year | Temp (C) | Pulse (per min) | Crackles | Decreased breath sounds | Resp (per min) | Other signs, symptoms or point of care tests | ||||
|---|---|---|---|---|---|---|---|---|---|---|
| Diehr, 1984 | >37.8 | >25 | sore throat | night sweats | myalgia | rhinorrhea | sputum | |||
| Ebrahimzadeh, 2015 | ≥38 | ≥100 | X | X | ≥20 | CRP | dullness on percussion | rhonchi | ESR | WBC |
| Gennis, 1989 | >37.8 | >100 | X | >20 | rales | wheezes | rhonchi | |||
| Heckerling, 1990 | >37.8 | >100 | X | rales | absence of asthma | |||||
| Holm, 2007 | CRP | clinical pneumonia | SATO2 | |||||||
| Hopstaken, 2003 | ≥38 | CRP<20 | diarrhea | ESR <20 | dry cough | |||||
| Melbye, 1992 | X | X | pleural rubs | dullness on percussion | ||||||
| Obrien, 2006 | ≥38 | ≥100 | X | X | >20 | rhonchi | dullness on percussion | |||
| Saldias, 2007 | ≥38 | ≥100 | X | ≥20 | orthopnea | dullness on percussion | abnormal auscultation | |||
| Singal, 1989 | X | X | cough | |||||||
| Steurer, 2011 | X | CRP >11 | dyspnea | |||||||
| van Vugt, 2013 | >37.8 | >100 | X | X | CRP >30 | breathlessness | Vesicular sounds | absence of runny nose | ||
Boxes in gray indicate not used in study. X: used in study but did not give specific value; Temp: temperature in Celsius.
Resp: respiratory rate; CRP: c-reactive protein ESR: erythrocyte sedimentation rate; WBC: white blood cell count; SATO2: oxygen saturation.
Appendix B3. Diagnostic Accuracy of Clinical Decision Rules Using Signs, Symptoms, and Point of Care Tests to Diagnose (Rule In) Pneumonia
| Author, Year | CDR used to diagnose CAP (rule in) | CDR expressed as low yield criteria (rule out) | Sensitivity (TP/P+FN) | Specificity (TN/N+FP) | LR+ | LR− |
|---|---|---|---|---|---|---|
| Ebrahimzadeh, 2015 | Any abnormal VS | Normal VS | 0.86 (361/420) | 0.72 (302/420) | 3.06 | 0.20 |
| Any abnormal VS or PE finding | Normal VS and no PE findings | 0.94 (395/420) | 0.57 (241/420) | 2.21 | 0.10 | |
| Any abnormal lab (CRP, ESR, WBC) | Normal labs | 0.60 (254/420) | 0.74 (310/420) | 2.31 | 0.54 | |
| Gennis, 1989 | Any abnormal VS | Normal VS | 0.97 (114/118) | 0.19 (36/190) | 1.19 | 0.18 |
| Any abnormal auscultatory findings | Normal auscultatory findings | 0.78 (92/118) | 0.38 (73/190) | 1.27 | 0.57 | |
| Holm, 2007 | GP diagnosis of CAP and CRP ≥ 20 | GP diagnosis of CAP or CRP < 20 | 0.49 (23/47) | 0.84 (249/297) | 3.03 | 0.61 |
| GP diagnosis of CAP and SATO2 ≤ 95% | GP diagnosis of CAP or SATO2 > 95% | 0.32 (15/47) | 0.92 (268/291) | 4.04 | 0.74 | |
| GP diagnosis of CAP or CRP ≥ 20 | GP diagnosis of CAP and CRP < 20 | 0.83 (39/47) | 0.48 (144/297) | 1.61 | 0.35 | |
| GP diagnosis of CAP or SATO2 ≤ 95% | GP diagnosis of CAP and SATO2 > 95% | 0.79 (37/47) | 0.56 (164/291) | 1.80 | 0.38 | |
| Hopstaken, 2003 | > 1 (diarrhea, dry cough, ≥ 38C) or CRP ≥ 20 | < = 1 of 3 sign/symptom + CRP <20 | 0.91 (29/32) | 0.49 (104/211) | 1.79 | 0.19 |
| > 1 (diarrhea, dry cough, ≥ 38C) or ESR ≥ 20 | < = 1 of 3 sign/symptom + ESR <20 | 0.81 (26/32) | 0.55 (115/211) | 1.79 | 0.34 | |
| Melbye, 1992 | Abnormal auscultatory signs | Normal auscultatory signs | 0.40 (8/12) | 0.88 (336/382) | 3.32 | 0.68 |
| O’Brien, 2006 | Any abnormal VS | Normal VS | 0.81 (282/350) | 0.64 (225/350) | 2.26 | 0.30 |
| Any abnormal VS or PE finding | Normal VS and no PE findings | 0.95 (333/350) | 0.56 (196/350) | 2.16 | 0.09 | |
| Saldias, 2007 | Any abnormal VS | Normal VS | 0.86 (89/103) | 0.44 (85/193) | 1.54 | 0.31 |
| Abnormal VS or PE finding | Normal VS and no PE findings | 0.98 (101/103) | 0.19 (37/193) | 1.21 | 0.10 | |
| Singal, 1989 | Fever, cough, crackles | Absence of fever, cough, crackles | 0.93 (37/40) | 0.27 (57/215) | 1.26 | 0.28 |
| Steurer, 2011 | CRP>50 or CRP 11–50 and dyspnea or daily fever | CRP < 10 or CRP 11–50, no dyspnea, and no daily fever | 1.00 (127/127) | 0.38 (190/494) | 1.63 | 0.00 |
CDR: clinical decision rule; CAP; community-acquired pneumonia; VS: vital signs; PE: pulmonary exam; GP: general practitioner; CRP: c-reactive protein; ESR: erythrocyte sedimentation rate; WBC: white blood cell count; SATO2: oxygen saturation; Sensitivity and specificity calculated using ruling in criteria.
Appendix B4. Summary Receiver Operating Characteristic Curves for Clinical Decision Rules Using any Abnormal Vital Signs (A), and Any Abnormal Vital Sign and Abnormal Pulmonary Exam (B) to Diagnose (Rule in) Community Acquired Pneumonia.
Appendix C
Dier, 1984
| Symptom | Points/Score assigned |
|---|---|
| Rhinorrhea | −2 |
| Sore throat | −1 |
| Night sweats | 1 |
| Myalgia | 1 |
| Sputum all day | 1 |
| Respiratory rate >25 | 2 |
| Temp. 100F or more | 2 |
| Symptom | Logistic coefficient |
|---|---|
| Temp. > 37.8C | 0.494 |
| Pulse ?100 beats/min | 0.428 |
| Rales | 0.658 |
| Decreased breath sounds | 0.638 |
| Absence of asthma | 0.691 |
| Intercept | −1.705 |
| Symptom | Points/Score assigned |
|---|---|
| Absence of running nose | 1 |
| Breathlessness | 1 |
| Crackles | 1 |
| Diminished vesicular breathing | 1 |
| Raised pulse (>100/min) | 1 |
| Fever (temp. >37.8C) | 1 |
| Raised CRP (>30 mg/L) | 1 |
CRP, c-reactive protein.
Footnotes
Conflict of interest: none declared.
References
- 1.Pfuntner A, Wier LM, Stocks C. Most Frequent Conditions in U.S. Hospitals, 2011: Statistical Brief #162 In: Healthcare Cost and Utilization Project (HCUP) Statistical Briefs. Rockville, MD: Agency for Healthcare Research and Quality (US); 2006. [PubMed] [Google Scholar]
- 2.Jain S, Self WH, Wunderink RG, et al. Community-acquired pneumonia requiring hospitalization among U.S. adults. N Engl J Med 2015;373:415–427. [DOI] [PMC free article] [PubMed] [Google Scholar]
- 3.CDC. Deaths: Final Data for 2015. National Vital Statistics Report. Available from: https://www.cdc.gov/nchs/data/nvsr/nvsr66/nvsr66_06_tables.pdf. Accessed February 16, 2018. [PubMed]
- 4.Mandell LA, Wunderink RG, Anzueto A, et al. Infectious Diseases Society of America/American Thoracic Society consensus guidelines on the management of community-acquired pneumonia in adults. Clin Infect Dis 2007;44(Suppl 2):S27–S72. [DOI] [PMC free article] [PubMed] [Google Scholar]
- 5.Centor RM, Witherspoon JM, Dalton HP, Brody CE, Link K. The diagnosis of strep throat in adults in the emergency room. Med Decis Making 1981;1: 239–246. [DOI] [PubMed] [Google Scholar]
- 6.Heckerling PS, Tape TG, Wigton RS, et al. Clinical prediction rule for pulmonary infiltrates. Ann Intern Med 1990;113:664–670. [DOI] [PubMed] [Google Scholar]
- 7.Diehr P, Wood RW, Bushyhead J, Krueger L, Wolcott B, Tompkins RK. Prediction of pneumonia in outpatients with acute cough—A statistical approach. J Chronic Dis 1984;37:215–225. [DOI] [PubMed] [Google Scholar]
- 8.Steurer J, Held U, Spaar A, et al. A decision aid to rule out pneumonia and reduce unnecessary prescriptions of antibiotics in primary care patients with cough and fever. BMC Med 2011;9:56. [DOI] [PMC free article] [PubMed] [Google Scholar]
- 9.van Vugt SF, Broekhuizen BD, Lammens C, et al. Use of serum C reactive protein and procalcitonin concentrations in addition to symptoms and signs to predict pneumonia in patients presenting to primary care with acute cough: Diagnostic study. BMJ 2013; 346:f2450. [DOI] [PMC free article] [PubMed] [Google Scholar]
- 10.Moher D, Liberati A, Tetzlaff J, Altman DG. Preferred reporting items for systematic reviews and meta-analyses: the PRISMA statement. J Clin Epidemiol. 2009;62:1006–1012. [DOI] [PubMed] [Google Scholar]
- 11.Whiting PF, Rutjes AW, Westwood ME, et al. QUADAS-2: A revised tool for the quality assessment of diagnostic accuracy studies. Ann Intern Med 2011;155:529–536. [DOI] [PubMed] [Google Scholar]
- 12.van Vugt SF, Verheij TJ, de Jong PA, et al. Diagnosing pneumonia in patients with acute cough: Clinical judgment compared to chest radiography. Eur Respir J 2013;42:1076–1082. [DOI] [PubMed] [Google Scholar]
- 13.Reitsma JB, Glas AS, Rutjes AW, Scholten RJ, Bossuyt PM, Zwinderman AH. Bivariate analysis of sensitivity and specificity produces informative summary measures in diagnostic reviews. J Clin Epidemiol 2005;58:982–90. [DOI] [PubMed] [Google Scholar]
- 14.Singal BM, Hedges JR, Radack KL. Decision rules and clinical prediction of pneumonia: Evaluation of low-yield criteria. Ann Emerg Med 1989;18:13–20. [DOI] [PubMed] [Google Scholar]
- 15.Saldías PF, Cabrera TD, de Solminihac LI, Hernández AP, Gederlini GA, Díaz FA. [Predictive value of history and physical examination for the diagnosis of community-acquired pneumonia in adults]. Revista Med Chile 2007;135:143–152. [DOI] [PubMed] [Google Scholar]
- 16.O’Brien WT Sr, Rohweder DA, Lattin GE Jr., et al. Clinical indicators of radiographic findings in patients with suspected community-acquired pneumonia: Who needs a chest x-ray? J Am Coll Radiol 2006;3:703–706. [DOI] [PubMed] [Google Scholar]
- 17.Melbye H, Straume B, Aasebo U, Dale K. Diagnosis of pneumonia in adults in general practice. Relative importance of typical symptoms and abnormal chest signs evaluated against a radiographic reference standard. Scand J Prim Health Care 1992;10:226–233. [DOI] [PubMed] [Google Scholar]
- 18.Hopstaken RM, Muris JW, Knottnerus JA, Kester AD, Rinkens PE, Dinant GJ. Contributions of symptoms, signs, erythrocyte sedimentation rate, and c-reactive protein to a diagnosis of pneumonia in acute lower respiratory tract infection. Br J Gen Pract 2003;53:358–364. [PMC free article] [PubMed] [Google Scholar]
- 19.Holm A, Nexoe J, Bistrup LA, et al. Aetiology and prediction of pneumonia in lower respiratory tract infection in primary care. Br J Gen Pract 2007;57: 547–554. [PMC free article] [PubMed] [Google Scholar]
- 20.Gennis P, Gallagher J, Falvo C, Baker S, Than W. Clinical criteria for the detection of pneumonia in adults: Guidelines for ordering chest roentgenograms in the emergency department. J Emerg Med 1989;7:263–268. [DOI] [PubMed] [Google Scholar]
- 21.Ebrahimzadeh A, Mohammadifard M, Naseh G, Mirgholami A. Clinical and laboratory findings in patients with acute respiratory symptoms that suggest the necessity of chest x-ray for community-acquired pneumonia. Iran J Radiol 2015;12(1): e13547. [DOI] [PMC free article] [PubMed] [Google Scholar]
- 22.Murdoch TB, Detsky AS. The inevitable application of big data to health care. JAMA 2013;309:1351–1352. [DOI] [PubMed] [Google Scholar]
- 23.Obermeyer Z, Emanuel EJ. Predicting the future—Big data, machine learning, and clinical medicine. N Engl J Med 2016;375:1216–1219. [DOI] [PMC free article] [PubMed] [Google Scholar]
- 24.Perry WM, Hossain R, Taylor RA. Assessment of the feasibility of automated, real-time clinical decision support in the emergency department using electronic health record data. BMC Emerg Med 2018;18:19. [DOI] [PMC free article] [PubMed] [Google Scholar]