Abstract
Human spaceflight and the characteristics of people who become astronauts have changed over time. Here we present an analysis of n=1,265 manned spaceflights by n=562 astronauts from 1961–2020 to investigate historical trends over time and between space agencies in terms of astronaut demographics and spaceflight duration. Generalized linear models and generalized linear mixed models were implemented with adjustments for all available demographic data as covariates. Women continue to be underrepresented as astronauts, and were younger, had fewer children, and were less likely to have a military background than their male counterparts. Astronaut age has increased over time, although this increase was significant only for first-time spaceflights. The proportion of astronauts from civilian backgrounds has generally increased over time, although there is evidence this trend may be reversing. Spaceflight duration has increased over time, and has been longest for ROSCOSMOS cosmonauts and shortest for Chinese taikonauts. There were also differences between space agencies in terms of astronaut demographics, particularly between NASA and ROSCOSMOS, with first-time NASA astronauts more likely to be women, civilian and older than first-time ROSCOSMOS cosmonauts. As humankind embarks on exploration-class missions back to the lunar surface and then onward to Mars, and with new nations and commercial entities entering the international space community, the nature of spaceflight, and the diversity of the astronauts, will continue to evolve.
Keywords: astronaut demographics, inter-agency differences, gender, military
1. Introduction
Since Yuri Gagarin became the first human in space almost 60 years ago, a total of 563 individuals have made and continue to make human spaceflights. These individuals have flown under the auspices of six space agencies, namely the U.S. National Aeronautics and Space Administration (NASA); the Russian State Corporation for Space Activities (ROSCOSMOS), including missions flown during the earlier Soviet space program; the European Space Agency (ESA); the Japan Aerospace Exploration Agency (JAXA), the China National Space Administration (CNSA); and the Canadian Space Agency (CSA). The number of nations embarking on human spaceflight will continue to grow; for instance, the Indian Space Research Organisation (ISRO) targets a late 2021 date for their first manned mission of the Gaganyaan spacecraft. Human spaceflight is an international, collaborative and continuing endeavor. The International Space Station (ISS) is currently maintained and operated by NASA, ROSCOSMOS, ESA, JAXA and CSA. These same five agencies are currently involved in the development of the next generation space station, the Lunar Gateway. With the Artemis program, NASA in collaboration with ESA, JAXA, CSA and the Australian Space Agency (ASA) plans to return humans to the surface of the moon by 2024, including the first woman. These lunar missions are intended to serve as a proving ground for future human missions to Mars [1], targeted by NASA as early as in the next decade (2030’s). The nature of manned spaceflight has quite clearly changed over time, and will continue to evolve in the future. In 2014, Clément and Bukley published a simple analysis of the number and duration of human spaceflights, although they did not account for possible differences due to the demographics of individual astronauts [2]. Also in 2014, Goel et al. reported that female astronauts performing spaceflights to the ISS between 1998–2013 were less likely to have military training, less likely to have children, and fewer children in total, than males [3]. However, these analyses were limited to U.S. astronauts only. The authors also reported that female astronauts of all nationalities were younger and more likely to have doctoral degrees than males, but these data were only from the same 15-year period, subgroup analysis was performed on U.S. astronauts only, and the analyses were not adjusted for potential confounding. In an attempt to uncover trends in astronaut demographics over time and between space agencies, this paper presents a historical analysis of publicly available data on all human spaceflights, up to and including the landing of Soyuz MS-13 on February 6th 2020.
2. Methods
2.1. Definitions
The Kármán line is defined by the Fédération Aéronautique Internationale (FAI) as the boundary between aeronautics and astronautics, i.e. “the edge of space”, and lies 100 km above the mean sea level of Earth [4]. We defined “spaceflight” as an orbital flight in which the spacecraft reached an altitude above the Kármán line. Flights that did not pass this altitude, including the 1986 space shuttle Challenger disaster, were not included in analysis. Flights in which the craft did not reach orbital velocity, i.e. the velocity necessary to orbit around the Earth, were not included in our analysis, even if above the Kármán line. Suborbital flights excluded therefore contain the 1961 Mercury 3 and Mercury 4 missions by Americans Alan Shepherd and Virgil Grissom, and five other suborbital flights from a total of N=3 U.S. pilots (Brian Binnie, Mike Melvill and Joseph Walker) who would not later perform orbital spaceflights.
We use the term “astronaut” throughout this paper to refer to all space travelers regardless of space agency. We therefore include both Russian/Soviet cosmonauts and Chinese taikonauts when referring to “astronauts” in addition to astronauts from NASA, ESA, CSA and JAXA.
2.2. Spaceflight data extraction
Data were manually extracted from an online database of all manned spaceflights [5]. We extracted name, date of birth, gender, nationality, military background, education, marital status, number of children, space agency with which the astronaut flew, number of career spaceflights, launch date of all spaceflights and duration of all spaceflights. In the case of dual citizenship, the country of primary residence was used. Extracted data include up to and including the launch of Soyuz MS-15 on September 25th 2019, and the landing of Soyuz MS-13 on February 6th 2020.
2.3. Statistical analysis
We performed two separate sets of analysis of astronaut demographics, one on the level of individual astronauts, and one on the level of individual spaceflight missions. In this way, each unique astronaut represents only a single data point in the individual-level analysis, but could represent multiple data points in the mission-level analysis if they had made multiple spaceflights.
2.3.1. Regression model variables
Dependent variables
To investigate differences in astronaut demographics between space agencies, and the change in astronaut demographics over time, our dependent outcomes of interest were astronaut age in years as a continuous variable, gender as a dichotomous variable (male/female) and military background as a dichotomous variable (yes/no). To investigate changes in human spaceflight missions between agencies and over time, we analyzed mission duration (days) as a continuous dependent variable.
Astronaut-level covariates
Gender and military background were included as covariates in the models unless they were the dependent variable being examined. Marital status was included as a three-level categorical variable (Unmarried/Married/Divorced). Education was included as a four-level categorical variable (No higher education/Bachelor’s degree or equivalent/Master’s degree or equivalent/PhD or MD or equivalent). Age in years was coded as a continuous variable. In the individual-level analyses, we used age at the launch of the astronaut’s first spaceflight. For the mission-level analysis, we used age at launch of each separate spaceflight. The total number of children of an astronaut was coded as a continuous variable. We used the total number of children for both the individual- and mission-level analyses, since data on the number of children at mission launch were not available.
Mission-level covariates
The space agency under which the astronaut flew was coded as a 6-level categorical variable. These 6 agencies are the NASA, ROSCOSMOS, ESA, JAXA, CNSA and CSA.
Mission launch year was binned into decades, starting from the first human spaceflight in 1961. Mission launch decade was coded as 6-level categorical variable (levels: 1961–70 / 71–80 / 81–90 / 91–2000 / 2000–10 / 11–20). In the individual-level analyses, we used the launch decade of the astronaut’s first mission. For the mission-level analysis, we used the launch decade of each separate mission.
The total number of missions flown by an astronaut was coded as a continuous variable.
2.3.2. Regression modelling procedure
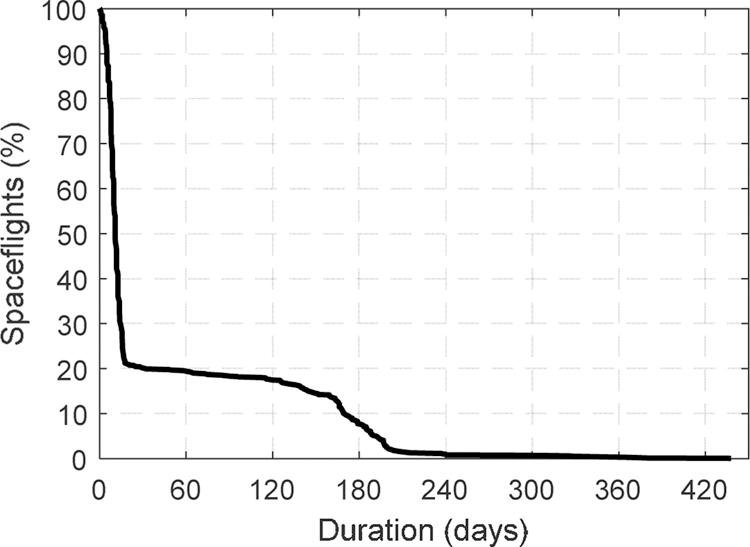
We performed statistical analyses in SPSS v. 26 (IBM Corp, Armonk, NY). Demographics of individual astronauts were analyzed in generalized linear models (GLiM, GENLIN procedure). Astronaut demographics at the level of individual missions were analyzed in generalized linear mixed models (GLMM) with a random intercept for each astronaut (GENLINMIXED procedure). The GLiM and GLMM were implemented with a normal distribution and identity link function for continuous outcomes (age at first mission, age at mission launch), and with a binomial distribution with logit link function for dichotomous outcomes (gender, military background). Because there have historically been many short duration spaceflights (Figure 1), the mission duration data were not normally distributed, and therefore the GLMM for mission duration was implemented with a Gamma distribution with a log-link function.
Figure 1.
Number and duration of all human spaceflights. The ordinate indicates the number of spaceflights as a percentage of all spaceflights (n=1265) that have had a duration equal to or exceeding the duration listed on the abscissa.
Results of regression models are presented as estimated marginal means (EMM) from the regression models for continuous outcomes and odds ratios (OR) for categorical outcomes. Post-hoc tests of pairwise comparisons between the levels of categorical covariates were performed only if the Type III effect was significant. A p-value of <0.05 was considered statistically significant.
3. Results
3.1. Overall descriptive analysis
As of March 2020, there had been a total of 1268 person flights flown by 562 unique astronauts (Table 1). According to these historical data, the average first-time astronaut was a 40 year old married male with a military background and at least a Master’s level education, had 2.1 children, flew with NASA and would eventually complete 2.3 spaceflights. Excluding the six recently completed or ongoing spaceflights that were not included in analysis (Soyuz missions MS-15 and MS-16), the mean duration of all missions was 41.5 days, ranging from 1 hour and 46 minutes for the first human spaceflight by Yuri Gagarin in April 1961, to the 437.8 days spent by Valery Polyakov aboard the Mir space station from January 1994 to March 1995. The majority of all spaceflights have been shorter than 20 days in duration (Figure 1). The combined duration of all 1265 of these spaceflights reflect a total of 52484.1 person days (143.79 years) spent by humans in space.
Table 1.
Astronaut demographics at the individual- and mission-level.
| Variable | Category | Individual-level | Mission-level | ||||
|---|---|---|---|---|---|---|---|
| n | % | n | % | ||||
| Gender | Female | 64 | 11.4 | 142 | 11.2 | ||
| Male | 498 | 88.6 | 1126 | 88.8 | |||
| Military | No | 209 | 37.2 | 466 | 36.8 | ||
| Yes | 353 | 62.8 | 802 | 63.2 | |||
| Education a | None | 5 | 0.9 | 6 | 0.5 | ||
| B | 96 | 17.1 | 219 | 17.3 | |||
| M | 257 | 45.7 | 596 | 47.0 | |||
| PhD/MD | 199 | 35.4 | 440 | 34.7 | |||
| Marital status b | Unmarried | 25 | 4.4 | 51 | 4.0 | ||
| Married | 513 | 91.3 | 1177 | 92.8 | |||
| Divorced | 20 | 3.6 | 34 | 2.7 | |||
| Agency | NASA | 349 | 62.1 | 860 | 67.8 | ||
| ROSCOS MOS | 146 | 26.0 | 297 | 23.4 | |||
| ESA | 36 | 6.4 | 61 | 4.8 | |||
| CNSA | 11 | 2.0 | 14 | 1.1 | |||
| CSA | 9 | 1.6 | 17 | 1.3 | |||
| JAXA | 11 | 2.0 | 19 | 1.5 | |||
| Launch decade c | 1961–70 | 47 | 8.4 | 71 | 5.6 | ||
| 1971–80 | 52 | 9.3 | 85 | 6.7 | |||
| 1981–90 | 140 | 24.9 | 253 | 20.0 | |||
| 1991–00 | 158 | 28.1 | 449 | 35.4 | |||
| 2001–10 | 120 | 21.4 | 285 | 22.5 | |||
| 2011–20 | 45 | 8.0 | 125 | 9.9 | |||
| Variable | n | Mean ±SD | Range | n | Mean ±SD | Range | |
| Age at first mission (years) | 562 | 39.8 ±5.28 | 25–60 | - | - | - | |
| Children (n) d | 562 | 2.1 ±1.36 | 0–8 | - | - | - | |
| Total missions (n) | 562 | 2.3 ±1.28 | 1–7 | - | - | - | |
| Mission duration (days) | - | - | - | 1265 | 41.5 ±68.04 | 0.1–437.8 | |
| Age at mission launch (years) | - | - | - | 1268 | 42.4 ± 5.83 | 25–77 | |
Categorical data are shown as the number and percentage of astronauts in each category. Continuous data are shown as mean ±standard deviation (SD) and range.
Education data not available for n=5 (0.9%) at the individual-level and n=7 (0.6%) at the mission-level.
Marital status not available for n=4 (0.7%) at the individual-level and n=6 (0.5%) at the mission-level.
Launch decade of an astronaut’s first spaceflight at the individual-level; launch decade of each spaceflight at the mission-level.
Children data not available for n=6 (1.1%) at the individual-level and n=11 (0.9%) at the mission-level.
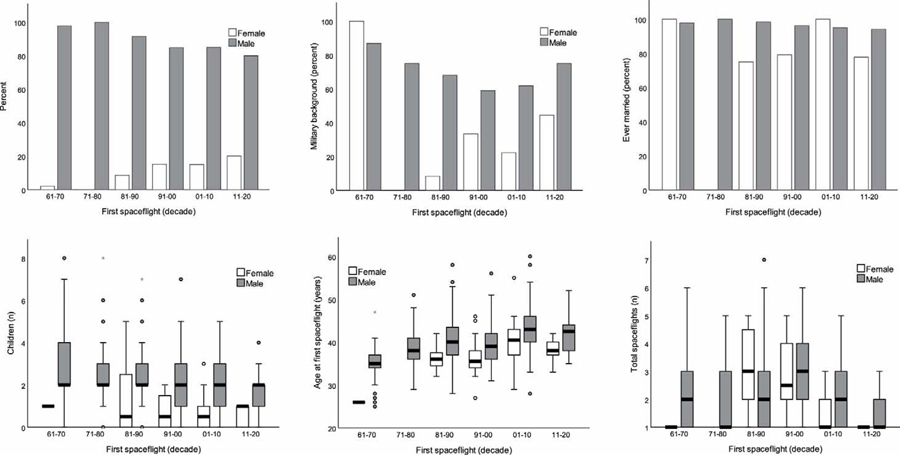
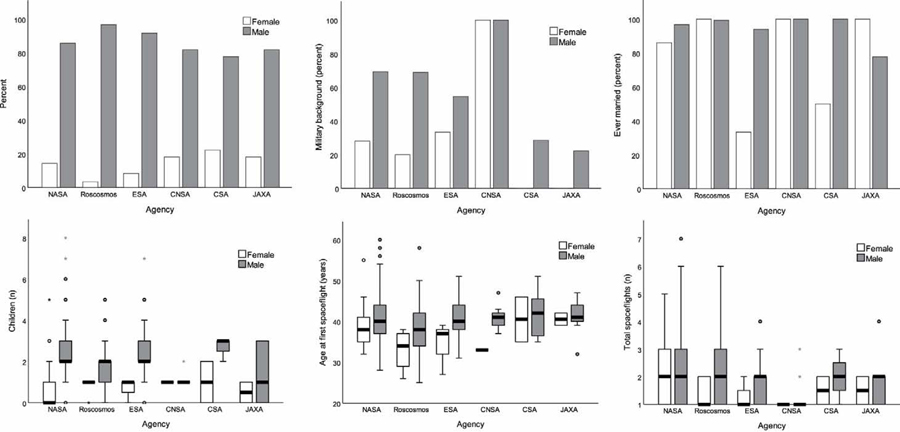
Individual-level data for number of children, age at first mission and total number of spaceflights, and percentages of astronauts who had a military background and were ever married (married or divorced) are shown across decade of first spaceflight in Figure 2 and space agency in Figure 3, stratified by gender.
Figure 2.
Individual-level astronaut demographics across decade of first spaceflight, stratified by gender (female in white, male in gray). Ever married includes astronauts listed either as married or divorced. Boxplots indicate median thick (horizontal lines), interquartile range (IQR, boxes), 1.5×IQR (whiskers), outliers 1.5–3.0×IQR (○), extreme outliers >3.0×IQR (★).
Figure 3.
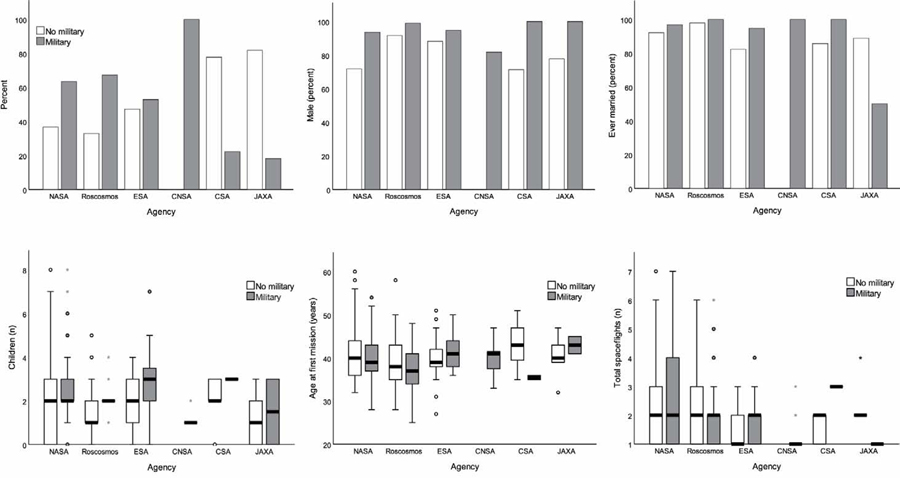
Individual-level astronaut demographics across agency, stratified by gender (female in white, male in gray). Ever married includes astronauts listed either as married or divorced. Boxplots indicate median thick (horizontal lines), interquartile range (IQR, boxes), 1.5×IQR (whiskers), outliers 1.5–3.0×IQR (○), extreme outliers >3.0×IQR (★).
3.1. Gender
There were no spaceflights by women in the 1971–1980 decade (see Figure 2), so data from this decade were excluded from regression analysis when gender was the outcome investigated (n=52 individual-level; n=85 mission-level). Only five astronauts, and no women, have ever had no college-level education (Table S1), and no JAXA or CSA astronauts have had no college-level education (Table S2). To avoid quasi-complete separation of data we therefore excluded the n=5 astronauts who did not have any college education. Results were similar for both the individual- and mission-level analyses, so we here present data from the individual-level regression analysis only. Complete results of the mission-level analysis for military background are provided in the Supplemental Results.
Due to missing data, 6 astronauts (1.2%) could not be included in regression analysis of astronaut gender at the level of individual astronauts. There were significant effects on gender by agency, military background, children and age at first mission (Table 2, Figure 2 and Figure 3). Astronauts with a military background were around three times less likely to be women. First-time astronauts were increasingly less likely to be women with increasing age and increasing number of children. Post-hoc tests for agency indicated that ROSCOSMOS astronauts were significantly less likely to be women than NASA astronauts (OR=0.10, p<0.001; see Table S5). There were no statistically significant differences in the likelihood of being a female astronaut between all other space agencies. The gender of an astronaut was not significantly affected by total number of spaceflights, decade of first spaceflight, marital status or education.
Table 2.
Individual-level effects on gender. Statistically significant Type III effects highlighted with bold typeface. Odds ratios (OR) for being female are shown for each level of categorical variables, and for each one unit increase of continuous variables.
| Covariate | Type III test | Odds ratios | ||||
|---|---|---|---|---|---|---|
| Wald χ2 | df | p-value | Level | OR | 95% CI | |
| Education | 0.9 | 2 | 0.643 | No college | - | - |
| B | Reference level | |||||
| M | 1.31 | 0.34; 5.06 | ||||
| PhD/MD | 1.78 | 0.46; 6.94 | ||||
| Marital status | 1.3 | 2 | 0.525 | Unmarried | Reference level | |
| Married | 1.24 | 0.41; 3.80 | ||||
| Divorced | 2.64 | 0.48; 14.65 | ||||
| Total mission | 1.2 | 1 | 0.273 | OR/mission | 0.85 | 0.63; 1.14 |
| Children | 22.5 | 1 | <0.001 | OR/child | 0.39 | 0.27; 0.58 |
| Decade of first mission | 7.8 | 4 | 0.100 | 1960s | Reference level | |
| 1970s | - | - | ||||
| 1980s | 2.35 | 0.25; 22.01 | ||||
| 1990s | 2.73 | 0.29; 25.85 | ||||
| 2000s | 5.48 | 0.56; 53.94 | ||||
| 2010s | 11.67 | 1.06; 127.95 | ||||
| Agency | 16.3 | 5 | 0.006 | NASA | Reference level | |
| ROSCOSMOS | 0.10 | 0.03; 0.37 | ||||
| ESA | 0.23 | 0.04; 1.25 | ||||
| CNSA | 0.80 | 0.07; 8.70 | ||||
| CSA | 2.45 | 0.38; 15.63 | ||||
| JAXA | 0.25 | 0.04; 1.48 | ||||
| Military background | 6.1 | 1 | 0.014 | No | Reference level | |
| Yes | 0.34 | 0.14; 0.80 | ||||
| Age at first mission | 18.0 | 1 | <0.001 | OR/year | 0.83 | 0.76; 0.90 |
df: degrees of freedom; CI: confidence interval
Results of the mission-level analysis of gender are given in Table S3. Similarly to the individual-level analysis, astronauts were significantly less likely to be female with increasing age and with increasing numbers of children, and if they had a military background. The point estimates for the likelihood of an astronaut being a female have increased over time, but this was not statistically significant. Unlike the individual-level analysis, there was no significant main effect of agency on gender in the mission-level analysis.
3.2. Military background
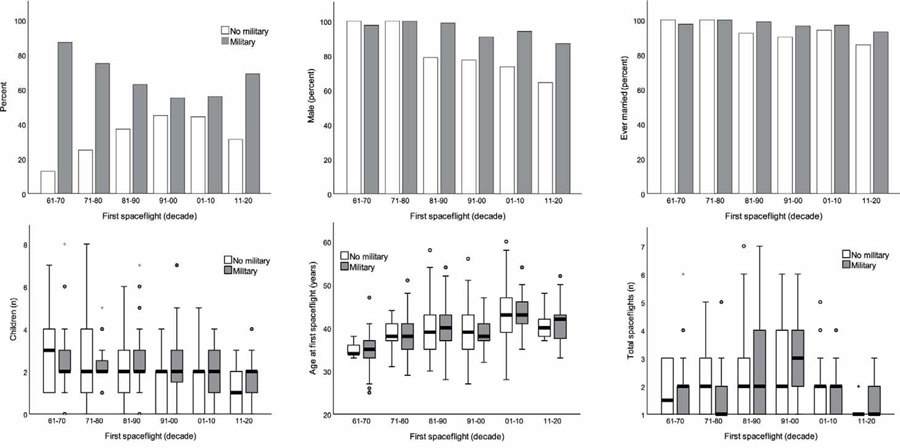
Data for military background of astronauts at the individual-level are shown in Figure 4 and Figure 5. All CNSA astronauts had a military background (n=11), and therefore this agency was excluded from the regression models of military background. Results were similar in for both the individual- and mission-level analyses, so we here present data from the individual-level regression analysis only. Complete results of the mission-level analysis for military background are provided in the Supplemental Results.
Figure 4.
Individual-level astronaut demographics across decade of first spaceflight, stratified by military background (civilian background in white, military background in gray). Ever married includes astronauts listed either as married or divorced. Boxplots indicate median thick (horizontal lines), interquartile range (IQR, boxes), 1.5×IQR (whiskers), outliers 1.5–3.0×IQR (○), extreme outliers >3.0×IQR (★).
Figure 5.
Individual-level astronaut demographics across agency, stratified by military background (civilian background in white, military background in gray). Ever married includes astronauts listed either as married or divorced. Boxplots indicate median thick (horizontal lines), interquartile range (IQR, boxes), 1.5×IQR (whiskers), outliers 1.5–3.0×IQR (○), extreme outliers >3.0×IQR (★).
Due to missing data, 9 astronauts (1.6%) could not be included in regression analysis of military background at the level of individual astronauts. At this individual level, there were significant effects on military background by education, decade, agency and gender (Table 3). Astronauts with a military background were over three times more likely to be men than women.
Table 3.
Individual-level effects on military background. Statistically significant Type III effects highlighted with bold typeface. Odds ratios (OR) for having a military background are shown for each level of categorical variables, and for each one unit increase of continuous variables.
| Covariate | Type III test | Odds ratios |
||||
|---|---|---|---|---|---|---|
| Wald χ2 | df | p-value | Level | OR | 95% CI | |
| Education | 114.0 | 3 | <0.001 | No college | Reference level | |
| B | 1.68 | 0.13; 22.35 | ||||
| M | 1.99 | 0.16; 25.51 | ||||
| PhD/MD | 0.13 | 0.01; 1.69 | ||||
| Marital status | 1.0 | 2 | 0.612 | Unmarried | Reference level | |
| Married | 1.18 | 0.39; 3.60 | ||||
| Divorced | 0.63 | 0.12; 3.23 | ||||
| Total mission | 0.0 | 1 | 0.919 | OR/mission | 0.99 | 0.82; 1.20 |
| Children | 0.0 | 1 | 0.934 | OR/child | 1.01 | 0.82; 1.24 |
| Decade | 22.3 | 5 | <0.001 | 1960s | Reference level | |
| 1970s | 0.39 | 0.11; 1.34 | ||||
| 1980s | 0.13 | 0.04; 0.42 | ||||
| 1990s | 0.10 | 0.03; 0.34 | ||||
| 2000s | 0.07 | 0.02; 0.24 | ||||
| 2010s | 0.17 | 0.04; 0.72 | ||||
| Agency | 10.7 | 4 | 0.031 | NASA | Reference level | |
| ROSCOSMOS | 0.51 | 0.28; 0.92 | ||||
| ESA | 0.83 | 0.33; 2.08 | ||||
| CNSA | - | - | ||||
| CSA | 0.27 | 0.04; 1.71 | ||||
| JAXA | 0.11 | 0.02; 0.71 | ||||
| Gender | 10.5 | 1 | 0.001 | Women | Reference level | |
| Men | 3.70 | 1.68; 8.16 | ||||
| Age at first mission | 0.0 | 1 | 0.851 | OR/year | 1.00 | 0.95; 1.04 |
df: degrees of freedom; CI: confidence interval
Post hoc tests for education (see Table S6) indicated that astronauts with a military background were substantially less likely to have a PhD/MD-level education than a Master’s-level (OR=0.066, p<0.001) or Bachelor’s-level education (OR=0.078, p<0.001). The likelihood of an astronaut having a military background was not significantly different between other levels of education.
Post hoc tests for launch decade (see Table S7) indicated that compared to the 1960’s, astronauts were less likely to have a military background in the 1980’s (OR=0.128, p<0.001), 1990’s (OR=0.102, p<0.001), 2000’s (OR=0.067, p<0.001) and 2010’s (OR=0.173, p=0.016). Compared to the 1970s, astronauts were less likely to have a military background in the 1980’s (OR=0.333, p=0.021), 1990’s (OR=0.264, p=0.006) and 2000’s (OR=0.174, p<0.001). The likelihood of an astronaut having a military background was not significantly different between any other launch decades.
Post hoc tests for agency (see Table S8) indicated that JAXA astronauts were less likely to have a military background than astronauts from NASA (OR=0.113, p=0.020) and ESA (OR=0.137, p=0.048). ROSCOSMOS astronauts were almost twice more likely to have a military background than NASA astronauts (OR=1.966, p=0.027). The likelihood of an astronaut having a military background was not significantly different between any other agencies.
Results of the mission-level analysis of military background are given in Table S4. As with the individual-level analysis, there were significant effects of education, launch decade and gender on the likelihood of the astronaut having a military background. Unlike the individual-level analysis, there was no significant main effect of agency.
3.3. Age
3.3.1. Individual-level
Due to missing data, 13 astronauts (2.3%) could not be included in regression analysis of age at first spaceflight. Astronaut age was significantly dependent on education, total number of missions, number of children, gender, decade of first mission and agency (Table 4). First-time women astronauts were an average of 3.6 years younger than first-time male astronauts. For each child that an astronaut had, they were an average of 0.37 years older at the time of their first spaceflight. For each spaceflight that an astronaut would eventually fly, they were an average of 0.72 years younger at the time of their first spaceflight, likely because of an increased time window in which to make subsequent spaceflights. Post hoc tests indicated that astronauts with a PhD/MD-level education were on average 1.5 years older than astronauts with a Master’s level education (p=0.003).
Table 4.
Individual-level effects on age at first spaceflight. Statistically significant Type III effects highlighted with bold typeface. Parameter estimates are shown as estimated marginal means (EMM) for each level of categorical variables, and as regression coefficients (Beta) for continuous variables.
| Covariate | Type III test | Parameter estimates | |||||
|---|---|---|---|---|---|---|---|
| Wald χ2 | df | p-value | Level | EMM/Beta (years) | SE | 95% CI | |
| Education | 9.1 | 3 | 0.028 | No college | 37.2 | 2.7 | 32.0; 42.5 |
| Bachelor’s | 36.9 | 0.8 | 35.4; 38.4 | ||||
| Master’s | 36.2 | 0.8 | 34.7; 37.7 | ||||
| PhD/MD | 37.7 | 0.7 | 36.2; 39.1 | ||||
| Marital status | 0.9 | 2 | 0.628 | Unmarried | 36.7 | 1.2 | 34.3; 39.2 |
| Married | 37.5 | 0.9 | 35.8; 39.2 | ||||
| Divorced | 36.8 | 1.3 | 34.2; 39.3 | ||||
| Total missions | 20.0 | 1 | <0.001 | Beta | −0.72 | 0.16 | −1.04; −0.41 |
| Children | 4.9 | 1 | 0.027 | Beta | 0.37 | 0.17 | 0.04; 0.70 |
| Gender | 30.4 | 1 | <0.001 | Women | 35.2 | 1.1 | 33.1; 37.2 |
| Men | 38.8 | 0.9 | 37.0; 40.6 | ||||
| Decade | 126.2 | 5 | <0.001 | 1960s | 31.9 | 1.2 | 29.6; 34.2 |
| 1970s | 35.7 | 1.2 | 33.5; 38.0 | ||||
| 1980s | 37.3 | 1.0 | 35.3; 39.3 | ||||
| 1990s | 37.0 | 1.0 | 35.1; 38.9 | ||||
| 2000s | 40.6 | 1.0 | 38.7; 42.6 | ||||
| 2010s | 39.4 | 1.1 | 37.2; 41.6 | ||||
| Agency | 26.1 | 5 | <0.001 | NASA | 38.4 | 0.8 | 36.7; 40.0 |
| ROSCOSMOS | 36.2 | 0.9 | 34.4; 37.9 | ||||
| ESA | 37.1 | 1.1 | 34.9; 39.2 | ||||
| CNSA | 33.7 | 2.0 | 29.8; 37.5 | ||||
| CSA | 39.1 | 1.7 | 35.8; 42.4 | ||||
| JAXA | 37.5 | 1.6 | 34.4; 40.6 | ||||
| Military background | 0.1 | 1 | 0.775 | No | 37.1 | 1.0 | 35.2; 39.0 |
| Yes | 36.9 | 1.0 | 35.0; 38.8 | ||||
For estimated marginal means covariates were evaluated in the model at the following values: Total missions = 2.28, Number of children = 2.1.
df: degrees of freedom; SE: standard error; CI: confidence interval
Results of post-hoc tests of launch decade are given in Table S9. First-time astronauts in the 1960’s were significantly younger than first-time astronauts in all other decades. First-time astronauts in the 1970’s were significantly younger than first-time astronauts in the 1980’s, 2000’s and 2010’s. Astronauts in the 2000’s were significantly older than in all previous decades. Astronauts in the 2010’s were significantly older than astronauts in all previous decades except the 2000’s.
Results of post-hoc tests of agency are given in Table S10. First-time NASA astronauts were significantly older than ROSCOSMOS (+2.2 years) and CNSA (+4.7 years) astronauts. First-time CSA astronauts were significantly older than CNSA astronauts (+5.4 years).
3.3.2. Mission-level
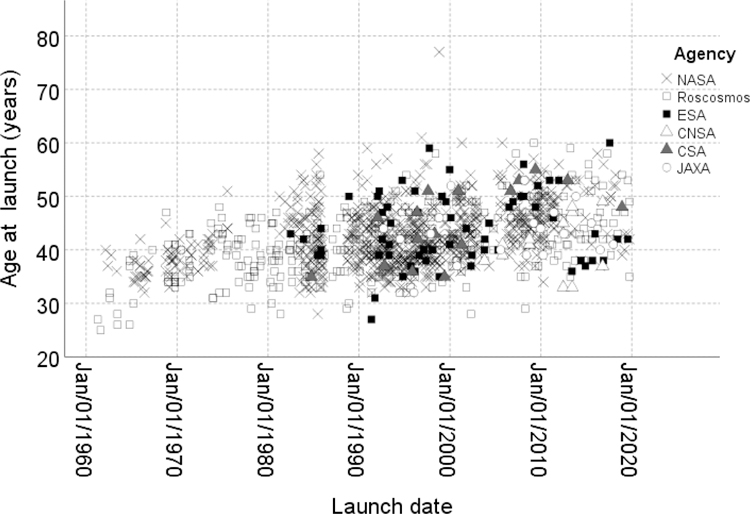
Due to missing data, 29 spaceflights (2.3%) could not be included in regression analysis of astronaut age at mission launch. A total of 1239 spaceflights therefore contributed to the analysis. Raw data of astronaut age at launch are shown in Figure 6, ranging from Gherman Titov at age 25 when he flew Vostok 2 in August 1961, to John Glenn at age 77 when he flew STS-95 in 1998. Astronaut age at mission launch was significantly affected by education, total number of missions, number of children, gender, mission launch decade and agency (Table 5). Female astronauts were an average of 4.2 years younger than male astronauts. For each child that an astronaut had, they were almost a year older at the time of mission launch. For each spaceflight that an astronaut would eventually fly, they were an average of 0.39 years older at the time of mission launch. Post hoc tests indicated that astronauts with a PhD/MD-level education were on average 3.1 years older than astronauts with a Master’s level education (p<0.001) and 1.8 years older than astronauts with a Bachelor’s level education (p=0.014).
Figure 6.
Astronaut age at launch as a function of launch date. Space agency is denoted marker style.
Table 5.
Mission-level effects on age at mission launch. Statistically significant Type III effects highlighted with bold typeface. Parameter estimates are shown as estimated marginal means (EMM) for each level of categorical variables, and as regression coefficients (Beta) for continuous variables.
| Covariate | Type III test | Parameter estimates | ||||||
|---|---|---|---|---|---|---|---|---|
| F | df1 | df2 | p-value | Level | EMM/Beta (years) | SE | 95% CI | |
| Education | 8.8 | 3 | 1218 | <0.001 | No college | 37.1 | 3.3 | 30.7; 43.6 |
| B | 37.7 | 0.9 | 35.8; 39.5 | |||||
| M | 36.5 | 1.0 | 34.6; 38.3 | |||||
| PhD/MD | 39.5 | 0.9 | 37.7; 41.3 | |||||
| Marital status | 0.1 | 2 | 1218 | 0.940 | Unmarried | 37.4 | 1.5 | 34.4; 40.4 |
| Married | 37.7 | 1.1 | 35.6; 39.7 | |||||
| Divorced | 38.0 | 1.6 | 34.8; 41.2 | |||||
| Total missions | 4.6 | 1 | 1218 | 0.032 | Beta | 0.39 | 0.18 | 0.03; 0.75 |
| Children | 24.5 | 1 | 1218 | <0.001 | Beta | 0.98 | 0.20 | 0.59; 1.37 |
| Gender | 28.3 | 1 | 1218 | <0.001 | Women | 35.6 | 1.3 | 33.1; 38.1 |
| Men | 39.8 | 1.2 | 37.5; 42.1 | |||||
| Decade | 126.2 | 5 | 1218 | <0.001 | 1960s | 28.5 | 1.4 | 25.8; 31.2 |
| 1970s | 33.1 | 1.3 | 30.6; 35.7 | |||||
| 1980s | 35.5 | 1.2 | 33.2; 37.9 | |||||
| 1990s | 38.6 | 1.2 | 36.3; 40.8 | |||||
| 2000s | 43.5 | 1.2 | 41.2; 45.8 | |||||
| 2010s | 47.0 | 1.2 | 44.6; 49.3 | |||||
| Agency | 4.3 | 5 | 1218 | <0.001 | NASA | 40.0 | 1.0 | 37.9; 42.0 |
| ROSCOSMOS | 38.7 | 1.1 | 36.5; 41.0 | |||||
| ESA | 37.7 | 1.3 | 35.1; 40.3 | |||||
| CNSA | 32.0 | 2.5 | 27.2; 36.8 | |||||
| CSA | 40.7 | 2.0 | 36.7; 44.7 | |||||
| JAXA | 37.0 | 1.9 | 33.3; 40.8 | |||||
| Military background | 2.0 | 1 | 1218 | 0.159 | No | 37.3 | 1.2 | 34.9; 39.6 |
| Yes | 38.1 | 1.2 | 35.8; 40.4 | |||||
| Mission duration | 3.6 | 1 | 1218 | 0.056 | Beta | 0.004 | 0.002 | −0.000; 0.009 |
For estimated marginal means covariates were evaluated in the model at the following values: Total missions = 3.0, Number of children = 2.1, Mission duration = 40.5
df: degrees of freedom; SE: standard error; CI: confidence interval
Results of post-hoc tests of agency are given in Table S11. NASA astronauts have been significantly older than ROSCOSMOS (+1.2 years), ESA (+2.3 years) and CNSA (+8.0 years) astronauts. CNSA astronauts have been significantly younger than all other agencies except JAXA. There were no other significant differences between agencies for astronaut age.
Results of post-hoc tests of launch decade are given in Table S12. Astronaut age has been significantly longer in each decade than in all earlier decades, and has increased approximately linearly at a rate of 3.7 years per decade.
3.4. Mission duration
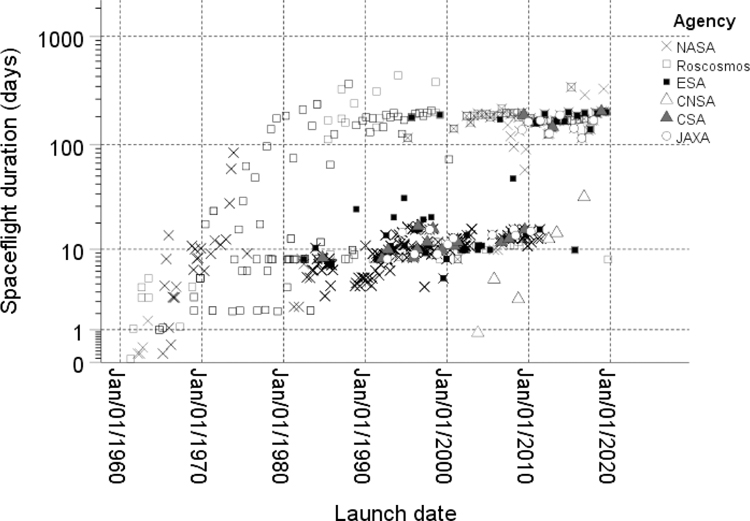
Raw data of historical mission duration are shown in Figure 6. Due to missing data, 29 spaceflights (2.3%) could not be included in regression analysis of mission duration. A total of 1239 spaceflights therefore contributed to the analysis. Mission duration was significantly affected by mission decade, agency, and education and military background of the astronaut (Table 6). Astronauts with no military background had a longer mission duration of +2.6 days. Post hoc tests indicated that astronauts with no college education had significantly shorter duration missions than astronauts with any level of college education (Table S13). Astronauts with a Master’s level education had significantly longer spaceflights than those with a PhD/MD education (+3.0 days, p=0.027).
Table 6.
Mission-level effects on mission duration. Statistically significant Type III effects highlighted with bold typeface. Parameter estimates are shown as estimated marginal means (EMM) for each level of categorical variables, and as regression coefficients (Beta) for continuous variables.
| Covariate | Type III test | Parameter estimates | ||||||
|---|---|---|---|---|---|---|---|---|
| F | df1 | df2 | p-value | Level | EMM/Beta (days) | SE | 95% CI | |
| Education | 3.3 | 3 | 1218 | 0.020 | No college | 5.0 | 2.7 | 1.7; 14.4 |
| B | 13.2 | 2.0 | 9.9; 17.8 | |||||
| M | 14.9 | 2.3 | 11.1; 20.1 | |||||
| PhD/MD | 11.9 | 1.7 | 9.0; 15.9 | |||||
| Marital status | 2.0 | 2 | 1218 | 0.131 | Unmarried | 10.7 | 2.6 | 6.7; 17.2 |
| Married | 12.5 | 2.2 | 8.9; 17.6 | |||||
| Divorced | 8.4 | 2.2 | 5.1; 14.1 | |||||
| Total missions | 0.5 | 1 | 1218 | 0.486 | Beta | 0.019 | 0.027 | −0.035; 0.073 |
| Children | 0.8 | 1 | 1218 | 0.375 | Beta | 0.027 | 0.031 | −0.033; 0.088 |
| Gender | 0.6 | 1 | 1218 | 0.455 | Women | 10.9 | 2.3 | 7.3; 16.4 |
| Men | 10.0 | 1.9 | 6.9; 14.4 | |||||
| Decade | 70.9 | 5 | 1218 | <0.001 | 1960s | 2.7 | 0.6 | 1.7; 4.2 |
| 1970s | 7.5 | 1.7 | 4.8; 11.6 | |||||
| 1980s | 6.6 | 1.3 | 4.5; 9.8 | |||||
| 1990s | 9.9 | 1.9 | 6.9; 14.3 | |||||
| 2000s | 18.1 | 3.4 | 12.5; 26.2 | |||||
| 2010s | 54.2 | 11.0 | 36.5; 80.6 | |||||
| Agency | 58.5 | 5 | 1218 | <0.001 | NASA | 9.1 | 1.5 | 6.6; 12.6 |
| ROSCOSMOS | 38.0 | 6.8 | 26.7; 54.1 | |||||
| ESA | 13.2 | 2.8 | 8.7; 20.2 | |||||
| CNSA | 1.8 | 0.7 | 0.8; 4.0 | |||||
| CSA | 10.7 | 3.4 | 5.7; 20.0 | |||||
| JAXA | 14.6 | 4.5 | 8.0; 26.6 | |||||
| Military background | 7.9 | 1 | 1218 | 0.005 | No | 11.8 | 2.3 | 8.1; 17.3 |
| Yes | 9.2 | 1.8 | 6.3; 13.4 | |||||
| Age at launch | 3.3 | 1 | 1218 | 0.068 | Beta | 0.011 | 0.006 | −0.001; 0.022 |
For estimated marginal means covariates were evaluated in the model at the following values: Total missions = 3.0, Number of children = 2.1, Age at launch = 42.4
df: degrees of freedom; SE: standard error; CI: confidence interval
Results of post-hoc tests of agency are given in Table S14. ROSCOSMOS missions have been significantly longer than missions of all other agencies. CNSA missions have been significantly shorter than missions of all other agencies. Mission durations were not significantly different between other agencies.
Results of post-hoc tests of launch decade are given in Table S15. The average mission duration has increased over time, with the mission duration in all decades significantly longer than in all earlier decades, with the single exception of missions during the 1980’s not being significantly different in duration than missions in the 1970’s.
4. Discussion, limitations and conclusions
We have presented a historical analysis of human spaceflight, examining how the demographics of astronauts has changed over time and how they differ between space agencies. We also examined the changing nature of human spaceflight, in terms of mission duration and the total number of missions that astronauts flew. This is, to our knowledge, the first analysis of astronaut demographic data that has adjusted for potential confounding by astronaut-level covariates of gender, military background, education, age, number of children and marital status; and agency-level covariates of space agency, total number of missions and launch decade.
Female astronauts were younger, had fewer children, and were less likely to come from a military background than their male counterparts. These findings are in agreement with previously reported results for astronaut data up to the early 2010’s [6]. Now, as then, women continue to be underrepresented as astronauts. Although there has been an increase in the proportion of female astronauts over time, from 2.1% in the 1960’s to 20% of astronauts in the 2010’s, this increase was not statistically significant. Furthermore, the fewer number of children among female astronauts could indicate that more so than men, these women have prioritized their occupations over having families, perhaps out of either necessity or desire, in order to succeed professionally. There was no difference in the duration or total number of spaceflights of female astronauts compared to males, perhaps indicating that women, if they were selected as astronauts, performed similar roles within their agency to men.
The early decades of human spaceflight were dominated by astronauts recruited from the military. This is unsurprising, as U.S. astronauts were presidentially mandated to be military test pilots, and U.S.S.R. astronauts were, with few exceptions, selected from the Soviet Air Force. In the U.S., women were not able to become test pilots until the mid-1970’s, which also explains why there were so few (and no American) female astronauts in the 1960’s and 1970’s [7]. Over time, as the requirement for military aviator training was relaxed, the proportion of non-military astronauts increased accordingly, although there were no significant differences between the 1970s and 2010s, indicating that this trend may be reversing.
Astronaut age has increased over time, although this increase was significant only for first-time spaceflights. This is in agreement with findings from Kovacs and Shadden, who reported that the age of NASA astronauts at time of selection, and the age of NASA astronauts at the time of first spaceflight, increased significantly between 1959–2013 [8].
The duration of spaceflights has increased over time. This was made possible by establishing manned orbital space stations, from the Salyut and Skylab stations in the 1970’s, to Mir in the 1980’s and 1990’s, to the ISS from the late 1990’s and still operational today. ROSCOSMOS spaceflights have been significantly longer than all other agencies, largely as a result of their presence aboard Mir. At the opposite end of the spectrum, spaceflights by CNSA astronauts have been significantly shorter than all other agencies, likely because China is not a partner of the ISS program, and because China is still in the early stages of their space program. With planned exploration-class missions to Mars [1], it is probable that spaceflight durations will continue to increase in the future. For long-duration missions such as these, it is critical to understand how the unique environment of space (microgravity, radiation, isolation, confinement and other environmental and psychological stressors) will affect the biology and neurobehavioral function of astronauts, to ensure they continue to perform mission-critical tasks both during the journey to and on the surface of Mars. One year missions have already been conducted to better understand such effects [9], and NASA and ESA recently announced an integrated ISS 1-year mission project (i1YMP), where 10 astronauts will embark on 12-month ISS missions, which will be compared to astronauts on 6- and 2-month ISS missions [10].
The presented analysis is not without limitations. We could not examine astronaut race, ethnicity or social background as these data were not available from the database [5]. Our analyses are limited to astronauts who made spaceflights, and do not include individuals who were selected and trained as astronauts but who never flew missions. Finally, we did not examine mission position (e.g. commander, pilot, mission specialist, flight engineer), since these have changed over time, and analysis of each position would therefore be restrained to the decades in which the position existed.
In summary, female astronauts were younger, had fewer children, and were less likely to come from a military background than their male counterparts. Astronaut age has increased over time, although this increase was significant only for first-time spaceflights. The proportion of astronauts from civilian backgrounds has increased over time, although there is some evidence this trend may be reversing. Spaceflight duration has increased over time, and has been longest for ROSCOSMOS cosmonauts and shortest for CNSA taikonauts. There were also differences between space agencies in terms of astronaut demographics, particularly between NASA and ROSCOSMOS, with first-time NASA astronauts more likely to be women, civilian and older than first-time ROSCOSMOS cosmonauts.
Supplementary Material
Figure 7.
Mission duration as a function of launch date. Space agency is denoted marker style.
Highlights.
Regression analysis of historical spaceflight missions and astronaut demographics
Female astronauts have become more prevalent but remain underrepresented
Astronauts have become older and less likely to have a military background over time
NASA astronauts more likely to be women, civilian and older than ROSCOSMOS cosmonauts
Spaceflight duration has increased and will likely continue to increase in the future
5. Acknowledgments
We thank Joachim Becker and Heinz Janssen for maintaining the public database of historical spaceflight data that made this analysis possible [5]. This research was supported by the National Aeronautics and Space Administration (NASA) through grants NNX14AM81G, 80NSSC19K1046 and NNX16AI53G.
Biographies

Mathias Basner, MD, PhD, MSc is an Associate Professor in Psychiatry at the University of Pennsylvania. During his tenure at the German Aerospace Center (DLR), he headed the Flight Physiology Division at the Institute of Aerospace Medicine in Cologne. Dr. Basner was a Co-Investigator on IBMP’s Mars500 project and on the PVT Self-Test project on ISS. He was PI on a project investigating changes in brain structure and function in three Antarctic research stations, a project that developed and validated a cognitive test battery for spaceflight (Cognition), and one of the 10 PIs for NASA’s TWINS study.

Michael Smith, MSc, PhD is a Postdoctoral Researcher at the University of Pennsylvania. His research interests include how sleep is affected by environmental stressors including noise, vibration, and isolation and confinement, as well as the effects of sleep fragmentation on health, performance and work ability, and the health consequences of environmental noise exposure.
Footnotes
Publisher's Disclaimer: This is a PDF file of an unedited manuscript that has been accepted for publication. As a service to our customers we are providing this early version of the manuscript. The manuscript will undergo copyediting, typesetting, and review of the resulting proof before it is published in its final form. Please note that during the production process errors may be discovered which could affect the content, and all legal disclaimers that apply to the journal pertain.
Declaration of interests
The authors declare that they have no known competing financial interests or personal relationships that could have appeared to influence the work reported in this paper.
6. References
- 1.National Aeronautics and Space Administration. NASA’s Journey to Mars -Pioneering next steps in space exploration. Washington, DC: National Aeronautics and Space Administration, 2015. October Report No.: NP-2015-08-2018-HQ. [Google Scholar]
- 2.Clément G, Bukley AP. Human space exploration - From surviving to performing. Acta Astronaut. 2014;100:101–6. 10.1016/j.actaastro.2014.04.002. [DOI] [Google Scholar]
- 3.Goel N, Bale TL, Epperson CN, Kornstein SG, Leon GR, Palinkas LA, et al. Effects of sex and gender on adaptation to space: behavioral health. J Womens Health (Larchmt). 2014;23(11):975–86. 10.1089/jwh.2014.4911. [DOI] [PMC free article] [PubMed] [Google Scholar]
- 4.Sanz Fernández de Córdoba S 100 km altitude boundary for astronautics: Fédération Aéronautique Internationale; 2004. [cited 2020 April 28th]. Available from: https://www.fai.org/page/icare-boundary.
- 5.Becker J. SPACEFACTS. 2020 [cited 2020 April 28th]. Available from: http://www.spacefacts.de/.
- 6.Mark S, Scott GB, Donoviel DB, Leveton LB, Mahoney E, Charles JB, et al. The impact of sex and gender on adaptation to space: executive summary. J Womens Health (Larchmt). 2014;23(11):941–7. 10.1089/jwh.2014.4914. [DOI] [PMC free article] [PubMed] [Google Scholar]
- 7.Healey D There are no bras in space: How spaceflight adapted to women and how women adapt to spaceflight. Georgetown Journal of Gender and the Law. 2018;19:593+. [Google Scholar]
- 8.Kovacs GTA, Shadden M. Analysis of age as a factor in NASA astronaut selection and career landmarks. PLOS ONE. 2017;12(7):e0181381 10.1371/journal.pone.0181381. [DOI] [PMC free article] [PubMed] [Google Scholar]
- 9.Garrett-Bakelman FE, Darshi M, Green SJ, Gur RC, Lin L, Macias BR, et al. The NASA Twins Study: A multidimensional analysis of a year-long human spaceflight. Science. 2019;364(6436). 10.1126/science.aau8650. [DOI] [PMC free article] [PubMed] [Google Scholar]
- 10.National Aeronautics and Space Administration. NASA selects 25 proposals to support health and performance in astronauts on missions to the Moon and Mars 2018. [cited 2020 April 22nd]. Available from: https://www.nasa.gov/feature/nasa-selects-25-proposals-to-support-health-performance-in-astronauts-missions-to-moon-mars.
Associated Data
This section collects any data citations, data availability statements, or supplementary materials included in this article.


