Abstract
Mixing fluids often involves a periodic action, like stirring one’s tea. But reciprocating motions in fluids at low Reynolds number, in Stokes flows where inertia is negligible, lead to periodic cycles of mixing and unmixing, because the physics, molecular diffusion excepted, is time reversible. So how can fluid be mixed in such circumstances? The answer involves a geometric phase. Geometric phases are found everywhere in physics as anholonomies, where after a closed circuit in the parameters, some system variables do not return to their original values. We discuss the geometric phase in fluid mixing: geometric mixing.
This article is part of the theme issue ‘Stokes at 200 (part 2)’.
Keywords: geometric phase, fluid mixing, journal-bearing flow, belly phase
1. The geometric phase and mixing
How may fluid be mixed at low Reynolds number? Such mixing is normally performed with a stirrer, a rotating device within the container that produces a complex, chaotic flow. Alternatively, in the absence of a stirrer, rotation of the container walls themselves can perform the mixing, as occurs, for instance, in a cement mixer. At the lowest Reynolds numbers, under Stokes or creeping flow conditions [1], fluid inertia is negligible, fluid flow is reversible and a reversal of the direction of rotation leads—up to perturbations owing to molecular diffusion—to unmixing, as Taylor [2] and Heller [3] proved by experiment. This would seem to preclude the use of reciprocating actions to stir fluid at low Reynolds numbers; it would appear to lead to perpetual cycles of mixing and unmixing, in the style of Sisyphus.
The geometric phase [4] is an example of anholonomy: the failure of system variables to return to their original values after a closed circuit in the parameters. The geometric phase was originally described—as Berry’s phase—in quantum mechanics [5]. From there, it was generalized to classical integrable systems as Hannay’s angle [6]. Later it was extended to non-integrable perturbations of Hamiltonian systems [7,8], and thence to dissipative systems [9,10], as well as to discrete systems [11]. Anholonomies with associated geometric phases are involved in such diverse phenomena as the rotation of the plane of oscillation of a Foucault pendulum [12], how a falling cat can manage to reorientate itself in mid-air in order to land on its feet [13], how swimming is performed by microorganisms at low Reynolds number [14] and how one could swim in a similar fashion in space–time [15,16]. Here, we consider the geometric phase as it appears in fluid mixing.
We should note that this paper is concerned with both fluid mechanics and dynamical systems, and we encounter a terminological issue that the reader needs to bear in mind: the word mixing has slightly different, albeit related, meanings in these two fields. We are using the word in its fluid-mechanical sense, where in many applications one wants to reduce as much as possible the time it takes for molecular diffusion to homogenize an initially inhomogeneous distribution of a scalar tracer (e.g. your milk in your tea). If there is no advection, molecular diffusion by itself takes a very long time to achieve homogeneity, even in quite small containers. So we use advection to accelerate this process. That is fluid mixing. Meanwhile, typically in ergodic theory the short form mixing is used as a synonym for strong mixing, which is a property that implies ergodicity of a dynamical system, and is related in a deep sense to fluid mixing [17]. See, for example, Aref et al. [18] for a discussion in more detail.
2. An analytical example: the rotated rotlet
Let us demonstrate the concept with a simple example of geometric mixing that we can analyse completely. The equation of motion of a point particle around a rotlet of strength L(t) is
| 2.1 |
It is straightforward to verify that r = |r| is constant. Therefore, the r3 term in the denominator can be absorbed into L(t):
| 2.2 |
Ω is assumed to be tilted at an angle θ from an axis erot and is allowed to rotate at a constant angular velocity ω = 2π/T, about this erot in a similar manner as precessing spin [19]. When , the trajectories tend to be circular and contained in a plane normal to Ω(t). Let ϕT(t) be the total phase of the particle around one of these quasi-circular orbits at time t, where T is the period of rotation of the rotlet. The dynamic contribution to the phase of the particle can be eliminated subtracting from its total phase, ϕT(T), at time t = T, the same time taken by the rotlet to perform a cycle, for one sense of rotation of the rotlet the corresponding total phase ϕ−T(T) at the same time for the other sense of rotation of the rotlet, in the adiabatic limit |T| → ∞. The geometric phase is hence defined to be
| 2.3 |
An expression for the geometric phase can be derived analytically for our system. First, we set a reference frame {ex, ey, ez} letting the ez axis point in the direction of the axis of rotation of Ω(t), and the ex and ey axes such that L(0) is in the XZ plane:
| 2.4 |
It is convenient to define another reference frame {ex′, ey′, ez′} with ez′ = ez and rotating about the ez′ axis with the same angular velocity ω as the rotlet. In this new reference frame, Ω is constant and equation (2.2) transforms to
or
| 2.5 |
This is the equation of uniform circular motion with an angular velocity vector . Therefore, seen in the rotating reference frame the motion is circular, and on a plane that is not normal to L as in the fixed frame. Obviously, as T approaches ∞ (ω → 0), the plane of motion does become perpendicular to L. The total phase of the particle at time T, for both senses of rotation of the rotlet, is
so the geometric phase is
| 2.6 |
This can be evaluated expanding the norms to first order in powers of T−1
so we have
Finally, since the angle formed by the rotation axis, ez, and the direction of the rotlet, eL, is θ, we have
| 2.7 |
This is a really simple example of a geometric phase in a fluid system. It should be noted that adding 2π to (2.7) from a cycle of the rotating frame yields the solid angle of the rotating rotlet. This holds for any slow cycle and is well known for spin [5]; it is a paradigmatic example of parallel transport.
3. Journal-bearing flow
Both Taylor [2] and Heller [3] chose the Couette flow of a fluid contained between two concentric cylinders to demonstrate fluid unmixing. They showed that after rotating the cylinders through a certain angle, it is possible to arrive back at the initial state—to unmix the flow—by reversing this rotation through the same angle with the opposite sign, even when the angle is large enough that a blob of dye placed in the fluid has been apparently well mixed. Let us consider the positions of the walls of the container as the parameters in this system. We can specify their positions as angles from a given starting point as θ1 and θ2 for the outer and inner cylinders respectively. A geometric phase arises from transporting a system around a loop in parameter space. In general, if one takes a system through a parameter loop, one obtains as a result three phases: a dynamic phase, a non-adiabatic phase, and a geometric phase. If one then traverses the same loop in the opposite direction, the dynamic phase accumulates as before, while the geometric phase is reversed in sign. There is, of course, still the non-adiabatic phase too; to get rid of this one must travel slowly around the loop. Thence the geometric phase may be obtained as
| 3.1 |
where ϕ+ and ϕ− are the total phases accumulated by travel in the two directions. The protocol Heller and Taylor performed is not yet a candidate for a geometric phase, since we do not have a parameter loop. For that we should rotate first one, then the other cylinder, then reverse the first, and finally the other, to obtain a closed loop in the system parameters. However, in this concentric cylinder case, streamlines are concentric circles; if we move one of the cylinders by angle θ, a tracer particle or passive scalar will move through f(θ); a trajectory dependent only on θ. Then it is obvious that the cumulative effect of moving one cylinder θ1, then the other θ2, then the first −θ1 and the second −θ2, is to return the particle to its original position: there is no geometric phase, and unmixing still occurs. But if we modify the Heller–Taylor set-up and offset the inner cylinder, we arrive at what is known as journal-bearing flow. On introducing an eccentricity ε between the cylinders, the flow has a radial component. If we now perform a parameter loop by the sequence of rotations detailed above, we arrive back at our starting point from the point of view of the positions of the two cylinders, as in the Heller–Taylor flow, but, having traversed a closed loop in parameter space, we have incorporated a geometric phase into the system.
In the creeping-flow limit, the Navier–Stokes equations for the journal-bearing flow reduce to a linear biharmonic one
| 3.2 |
and we may model this system using an analytical solution of the stream function in bipolar coordinates [20–22]. Because of the linearity of equation (3.2), the stream function ψ can be expressed as a linear combination of single cylinder flows, that is
| 3.3 |
where Ωinner and Ωouter are the inner and outer cylinder angular velocities, and ψinner and ψouter the corresponding stream functions.
4. Geometric phase in the journal-bearing flow
The geometric phase that appears in (2.3) and (3.1) is the difference between where the particle is at the end of the cycle, and where it would be on the basis of the dynamical phase, as in the definition of the Hannay angle [6]. However, the choice of the angular variable ϕ differs between problems: while for the rotated rotlet it is the azimuthal angle of fluid particles, for the journal-bearing flow it is the angular coordinate in a bipolar coordinate system. To illustrate the presence of a geometric phase in the journal-bearing flow we show in figure 1 examples of the trajectory of a fluid particle—a passive scalar—as the walls are moved in a parameter loop. As the parameters here are the displacements θ1 and θ2 of the two cylinders, so that a closed loop of cylinder displacements brings the cylinder walls back to where they started from, it is, perhaps, surprising that the fluid inside does not return to its initial state. Journal-bearing flow has been studied in the past [23–25], but without a loop in the parameters, this geometric effect was not seen. It should be added that if we consider the parameter space modulo 2π, then the normal protocols of cylinder rotation also have a geometric phase. But if we consider the rotation in a physical sense that one can count the number of rotations of a cylinder if one follows it continuously in time, so that the operation modulo 2π on the parameter space is not possible—if it is not possible to carry on rotating indefinitely in a single direction—and we have to consider parameter space without folding, it is still possible to mix. The reason this mixing is still possible is that there is a loop in the parameters enclosing an area. If one considers things modulo 2π, then there is still a geometric phase from a parameter loop, but it comes from going once around a torus, and so encloses the hole in the torus. In this way, it is qualitatively different from the former loop which does not enclose the hole in the torus. We should note that in this system the dynamic phase is zero, since there is no flow when the boundaries are not moving, and the adiabatic phase is also zero, since this is a Stokes flow, so the phase accumulated by a parameter loop is a naked geometric phase, already visible without performing the procedure of equation (3.1) of traversing the loop in both directions.
Figure 1.
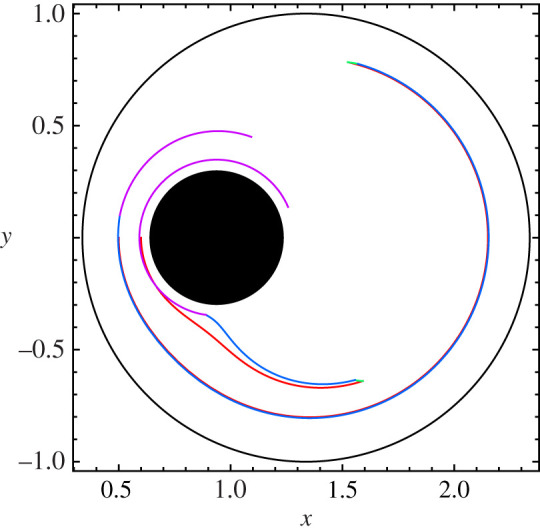
The geometric phase for the journal-bearing flow with cylinder radii R1 = 1.0, R2 = 0.3 and eccentricity ε = 0.4, taken around a closed loop with θ1 = θ2 = 6 radians. The four segments of the loop are plotted in different colours (red, green, blue, magenta) to enable their contributions to the particle motion to be seen. The trajectories of two passive scalars initially at x = 0.5, y = 0.0 and x = 0.6, y = 0.0 are shown. (Online version in colour.)
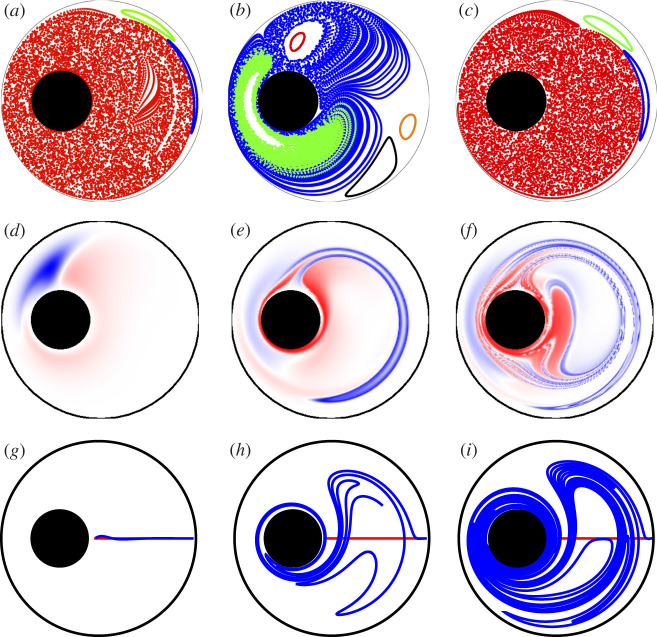
If we compare the two trajectories in figure 1 it is immediately apparent that a small difference in the initial conditions has produced a large change in the particle trajectory, and hence in the resulting geometric phase at the end of the parameter loop. This is because interchanging two different stream functions to produce a protocol of rotations has at the same juncture introduced time dependence into the journal-bearing flow. The ensuing dynamics is that of a one-degree-of-freedom time-dependent Hamiltonian system, which is generically non-integrable, which is what leads to chaos and its associated sensitivity to initial conditions in the flow [18,23]. In the journal-bearing flow, then we have a geometric phase in a chaotic flow. The incorporation of chaos into the flow arises from the sensitive dependence on initial conditions introduced each time the flow is switched. To illustrate this we may repeat the parameter loop of figure 1, and plot the position of the passive scalar after each iteration. This produces a Poincaré map of the flow represented in figures 2a–c, in which the angular change in the position of the particle between iterates is the geometric phase; note that phase space is real space in this system. As we see in figure 2b for θ1 = θ2 = 2π radians, and even more so in 2c, θ1 = θ2 = 4π radians, after 10 000 cycles the passive scalar has covered most of the area available to it between the two cylinders. This is fluid mixing induced entirely by a geometric phase; we may call it geometric mixing. Figure 2b and c demonstrates that geometric mixing can be rather effective in journal-bearing flow. In figure 2a, for θ1 = θ2 = π/2 radians, we plot a case in which we have KAM tori occupying a large part of the domain and mixing is not so effective, as these act as barriers.
Figure 2.
(a–c) Poincaré maps demonstrate geometric mixing for the journal-bearing flow for the same cylinder radii and eccentricity as figure 1. Several initial conditions, marked with different colours, are shown for 10 000 iterations of the parameter loop: (a) θ1 = θ2 = π/2 radians; (b) θ1 = θ2 = 2π radians; (c) θ1 = θ2 = 4π radians. (d–f ) The geometric phase across the domain for the same parameters; the colour scale denoting the phase at a given point is given by the intensity of red, positive and blue, negative. (g–i) The evolution of a line segment across the widest gap between the cylinders after one cycle for the same parameters. (Online version in colour.)
In figure 2d–f , we show the value of the geometric phase over the domain for two different mixing protocols. The value of the geometric phase at a given initial position, obtained in terms of the final angle minus the initial angle in bipolar coordinates after one iteration, ξf − ξi, is plotted on a colour scale of intensities of red (positive) and blue (negative). Note that the phase goes to zero at the walls, as it must, but varies strongly across the domain. In particular, for parameters of θ1 = θ2 = 2π radians (figure 2e), we see the development of a tongue of high values of the geometric phase in one sense interpenetrating a region of high values of the phase in the opposite sense. As may be expected, for smaller parameter values this tongue is absent (figure 2d). At even higher values of θ, on the other hand, (figure 2f ) the tongue wraps twice round in a highly complex fashion. In figure 2g–i, we show by plotting the evolution of a line of initial conditions how the geometric phase is related with the dynamical structures in the flow. Figure 2g, for θ1 = θ2 = π/2 radians, shows that when this tongue is absent, the line segment hardly evolves; the flow is almost reversible. The line segments for figure 2h and figure 2i, for θ1 = θ2 = 2π and 4π radians, on the other hand, shows a great deal of stretching induced by this tongue of large geometric phase. To demonstrate this effect of the geometric phase on the flow in more detail, in figure 3 we plot the length of the line segment after a single cycle against the rotation angle. A notable aspect of this plot is that the plot displays plateaux separated by periods of rapid growth. A comparison with figure 2d–f shows that it is the penetration of the tongue of large values of the geometric phase across this line segment that induces stretching. The tongue penetrates a first time before θ = 2π, and then a second time before θ = 4π, so producing two jumps; between these jumps the evolution of the line segment is much slower.
Figure 3.
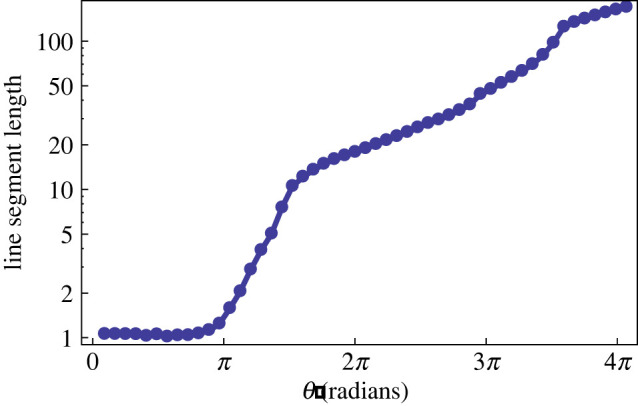
The final length of a line segment as shown in figure 2g–i after one cycle plotted against the rotation angle θ1 = θ2 = θ. (Online version in colour.)
5. The commutator as a measure of the geometric phase
The dynamics of the journal-bearing flow subject to a non-zero area contractible non-reciprocal loop is, for small rotations, a small deviation from the identity map. If we call the maps defined by the finite rotation of the inner and outer cylinders T1 and T2, respectively, a complete loop would be described by the application of these maps and their inverse to every point in the domain: .
The geometric phase in this case is a measure of how much this operation deviates from the identity and, therefore, we may quantify it by taking
| 5.1 |
| 5.2 |
| 5.3 |
| 5.4 |
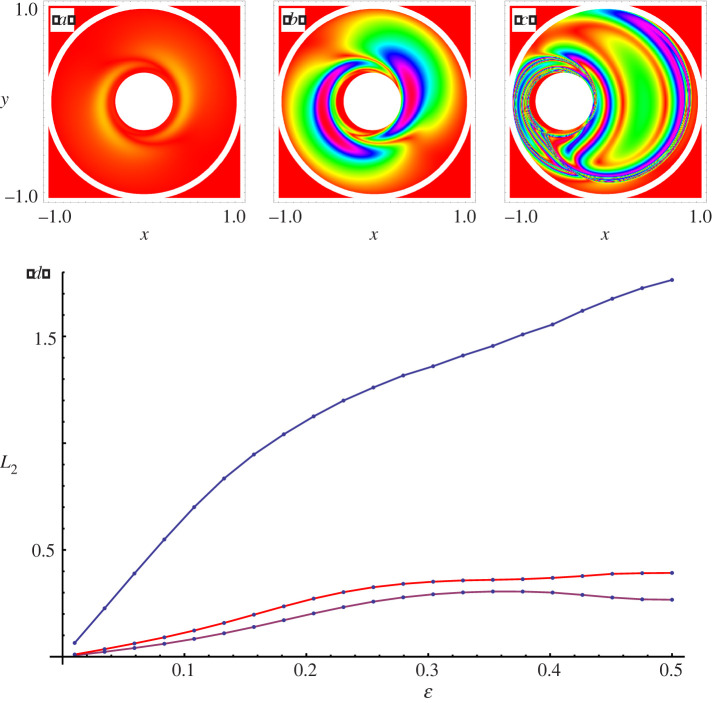
For zero-area loops the commutator of T1 and T2 is zero and, accordingly, the geometric phase vanishes. For non-zero area loops, the value of the commutator gives an estimate for the geometric phase. That is what is depicted in figure 4 for three different values of the eccentricity ε (0.01, 0.1 and 0.5). The lower panel of the same figure shows different global measures of the commutator, the mean over all trajectories of the L2-norm as a function of ε for a prescribed rotation protocol.
Figure 4.
The value of the commutator is shown for three different values of the eccentricity ε, 0.01(a), 0.1(b) and 0.5(c). The lower panel shows different global measures of the commutator, the spatial mean of the L2-norm, as a function of ε for a prescribed rotation protocol. (Online version in colour.)
6. Topological mixing: the topology of Lagrangian trajectories
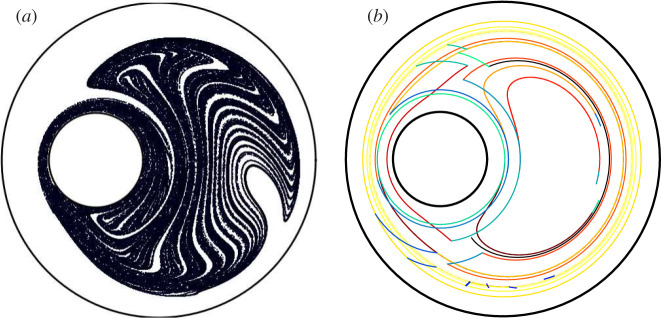
It is possible to describe this process within the framework of topological mixing. Indeed, the reason why chaotic mixing [18] arises in this system is that Lagrangian trajectories loop around the inner cylinder, and a period-1 unstable orbit is located where the effects of the two cylinders balance each other on the right part of the domain. Figure 5 reproduces a typical Lagrangian trajectory to show how it is winding around the inner cylinder and the period-1 orbit is located in the ‘hole’ on the right. Such an orbit is an example of a so-called ghost rod. Lagrangian trajectories therefore braid around this orbit and the inner cylinder on a curve that seems topologically equivalent to a figure-eight winding around two poles. And indeed, when the topological entropy of the flow is computed (for θ = 2π), it is very close to the topological entropy of the braid created by such figure-of-eight motion. Such a topological description might be a simple way to describe the difference with the symmetric case, when the system does not have this special period-1 orbit to ‘hook’ material lines winding around it. One interesting question is the efficiency of such mixing protocols, and for example to compare their mixing efficiency with a protocol with continuous rotation (without going back in θ), as we shall discuss below.
Figure 5.
A typical Lagrangian trajectory shows how it is winding around the inner cylinder and the period-1 orbit is located in the ‘hole’ on the right. Such an orbit is an example of a so-called ghost rod. (Online version in colour.)
Let us consider the limit of a very small angular displacement θ1. In this limit, the net displacement of a fluid particle after one stirring period is very small, but non-zero almost everywhere. This happens because alternatively switching on and off the rotation of the two cylinders allows fluid particles to jump on different streamlines [26–28]. In particular, fluid particles travel on different streamlines during the clockwise and the counterclockwise motions of one cylinder, and therefore they have typically different velocities and do not travel the same distance on the streamline. This results in a net displacement of the particle, or a geometric phase.
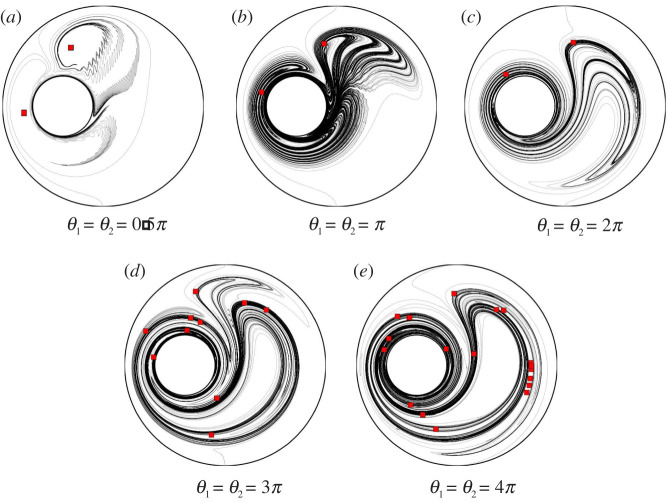
As our protocol cannot create a global rotation of the fluid either around the inner cylinder, or along the outer wall, there must exist curves that separate trajectories flowing around the cylinders clockwise, or counterclockwise. Such separatrices are easily guessed on the Poincaré section shown in figure 6 for θ1 = π/8, as curves separating trajectories in the lower and upper halves of the fluid domain. Let us concentrate on the trajectories on both sides of the inner cylinder, and on the separatrices between both sides. The latter emanate from periodic points of period 1 that appear fixed in the Poincaré section (red squares in figure 6). In the limit of vanishing θ1, there is a heteroclinic connection between the two points, and there is no exchange of fluid between the two halves of the domain. In the Poincaré map, fluid particles loop on closed curves as in figure 6. However, for finite values of θ1, the heteroclinic connexion between the two points is broken (because the trajectory initialized on the unstable manifold of the first point is perturbed by streamline jumping, and hence does not reconnect to the other point), and a heteroclinic tangle arises [29,30]. Lobes delineated by the intersection between the unstable manifold of the first point, and the stable manifold of the other, permit some exchange of fluid between the two halves of the domains that were previously isolated [29,30]. This is visible in figure 7a, where we have plotted a material line initialized on a vertical diameter, and integrated during 36 periods for θ1 = π/2. Some features of the vanishing θ1 limit persist here, such as the looping of trajectories, clockwise in the lower half and anti-clockwise in the upper part of the domain. However, all trajectories do not stay trapped looping forever. There are still two regular regions, as shown on the Poincaré section. The centre of such regions is a period-1 elliptic point that has been represented as a red square in figure 7a. However, outside out these trapped regular regions, trajectories can escape after long periods of looping around one of these two islands, and start looping around the other one, then escape again, etc. The elongated line of figure 7a therefore winds around the two islands, in opposite rotation senses.
Figure 6.
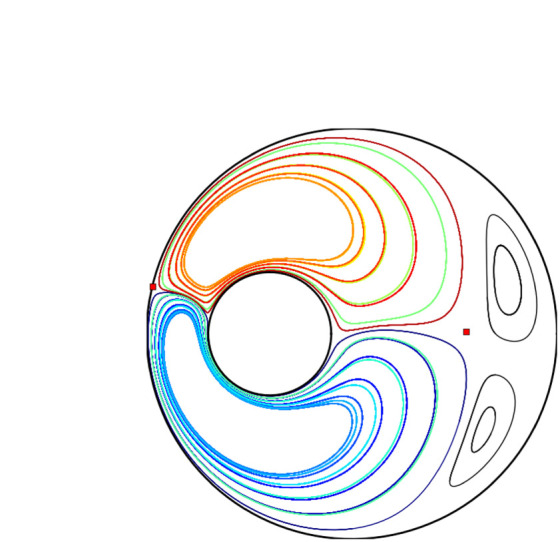
Poincaré section obtained for a small value of θ1 (θ1 = θ2 = π/8), by plotting the positions of 20 trajectories (coloured lines) strobed every period. The fluid domain is divided into two regions separated by the stable and unstable manifolds of two 1-periodic points (red squares). No exchange of fluid is observed between these two regions during the 20 000 periods of the simulation. It is likely that there is a weak heteroclinic tangle resulting from the manifolds of the two periodic points, yet chaos, if present, is very weak. (Online version in colour.)
Figure 7.
Material line advected by the geometric-mixing journal-bearing flow, for different values of θ1 = θ2 (see text). Red squares represent the position of periodic points of period 1. (Online version in colour.)
When θ1 is increased, the heteroclinic tangle becomes more entangled, resulting in more transport across the two sides of the inner cylinder. A first consequence is that no regular islands can subsist inside the chaotic region, because all fluid particles escape to visit the two parts of the bundle of filaments shown in figure 7b. However, there subsist two unstable periodic orbits that stay forever at the same location in the Poincaré map (red squares in figure 7b,c). Such orbits were detected using the method of Schmelcher & Diakonos [31,32], which searches for stable periodic orbits of a modified flow (unstable periodic orbits need particular methods of detection, since all trajectories but a zero-measure set diverge from such orbits). As shown in figure 7b, material lines still wind around the two periodic points.
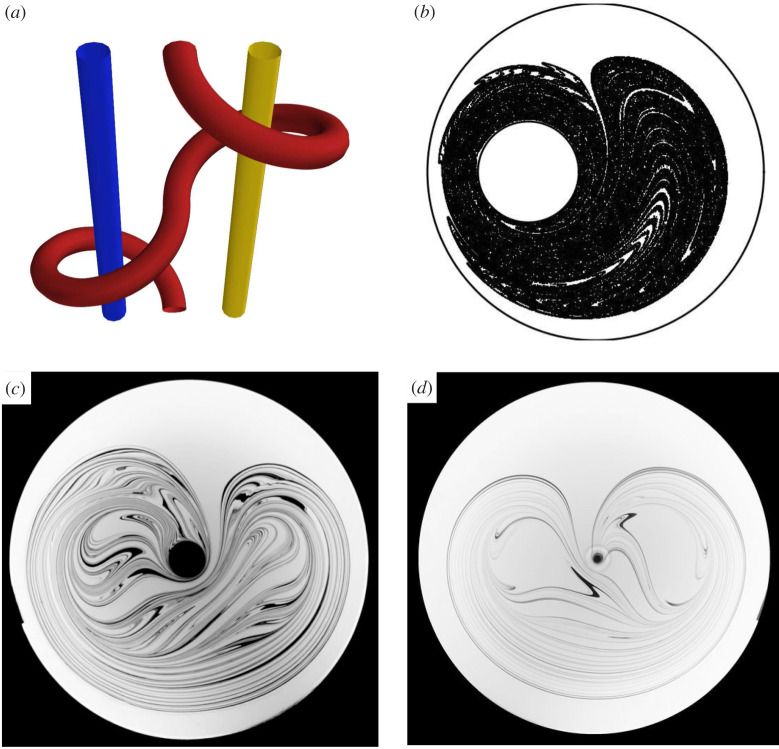
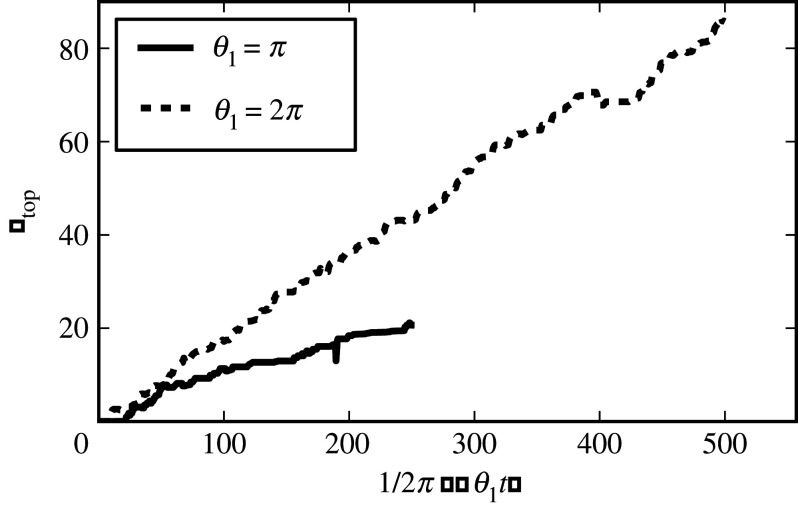
It is possible to quantify transport across the two sides of the cylinder, and the growth of material lines resulting therefrom, within the framework of topological mixing [33]. The theory of topological mixing describes how material lines are stretched along the trajectories of Lagrangian structures that get entangled in a topologically non-trivial way, that is their trajectories form braids that cannot be untangled. An example of such a braid is shown in figure 9a: the braid is formed by the trajectories of a point looping around two fixed points on a figure-eight path. Because material lines cannot cross topological obstacles such as point-like particles, the entanglement of the braid imposes that the length of a material line grows by a multiplicative factor every time the strands of the braid entangle in the same way (e.g. every time the braid in figure 9a is repeated). In other words, as stated in [33], the degree of entanglement of a braid, aka the topological entropy of the braid, gives a lower bound for the exponential growth rate of a material line, aka the topological entropy of the flow. For example, the topological entropy of the braid plotted in figure 9a is equal to 1.77, meaning that the length of a material line in the fluid is multiplied by a factor greater or equal to exp (1.77) every time the braid is formed by Lagrangian structures advected by a stirring flow. For a pedagogical introduction to topological mixing, see [34]. It is particularly interesting to consider the braids formed by periodic structures of the flow (such as rods [33], point vortices [35] or elliptic island and even unstable periodic orbits [36]), because such braids repeat periodically with time, therefore lower bounds on the growth rate of material lines can be computed from a braid computed for a limited time. However, it is also possible to compute the braid formed by an ordinary (non-periodic) trajectory [37] that is winding and braiding around the two 1-periodic orbits displayed in figure 7b and c, for θ1 = π and θ1 = 2π (The computation was not done for θ1 = π/2 because the simulation time would have been too long; transport between the two sides of the inner cylinder is extremely weak.) The entanglement of such a braid gives a measure of the transport between the two sides of the cylinder, and the line stretching that results from the entanglement of the braid. The entanglement of the braid from its sequence of strands crossings has been computed using the method of Moussafir [34,38]. The results are shown in figure 8. The total entanglement of the braid grows roughly linearly with time, as was already observed in [37]; the growth of the entanglement is quite irregular because the Lagrangian particle can spend many periods without braiding in a topologically non-trivial way. We see that the growth of the entanglement rate is much faster for θ1 = 2π than for θ1 = π; this means that transport is more efficient for the former case.
Figure 9.
(a) The trajectory of a rod looping around two elliptic islands on a figure-eight path forms a topologically entangled braid when plotted in a space–time diagram. (b) Mixing pattern created by integrating the trajectories of 160 000 particles located initially in a small square. (c) Dye pattern created by a stirring rod moving on a figure-eight path, for a small rod diameter. (d) Same as (c), for a larger rod. Note the characteristic heart-shaped pattern that resembles the pattern in (b) [39]. (Online version in colour.)
Figure 8.
θ1 = π and 2π: topological entropy of the braid formed by a single Lagrangian trajectory winding around the two 1-periodic points (red squares in figure 7b,c). Much more braiding occurs for θ1 = 2π than for θ1 = π.
For θ1 = 3π and θ1 = 4π, transport becomes even more complex as we could detect a large number of 1-periodic orbits (red squares in figure 7d and e). From the sole trajectories of such 1-periodic orbits, it is possible to construct an untangled braid whose topological entropy approximates well the growth rate of a material line. Note that braids constructed on periodic orbits may have a topological entropy that is much greater than the one of a braid constructed with ordinary non-periodic trajectories, because the intensity of the braiding realized by ordinary trajectories varies greatly with time, as the trajectories visit different parts of the chaotic region.
It is possible to draw an analogy between the geometric-mixing journal-bearing flow and a protocol that produces similar mixing patterns, the figure-eight protocol. For this protocol, a stirring rod is moving on a figure-eight path in a time-periodic way. The line patterns of figure 7 (for θ1 ≥ 2π), or the pattern traced out by a blob of dye (figure 9b), are similar to patterns traced out by the figure-eight protocol (figure 9c and d) This figure-eight protocol has been studied from the perspective of topological mixing in [36]. The rotation of the rod on two loops travelled with opposite rotation senses is similar to the rotation of some Lagrangian trajectories on both sides of the inner cylinder for the journal-bearing flow. In the figure-eight case, transport between the left and right parts of the domain is achieved by the rod, which drags some fluid along in its wake each time it switches from one loop to the other. The efficiency of such left–right transport increases with the size of the rod, as shown in figure 9c,d. For a small rod (figure 9c), a regular island is located inside each loop of the figure of eight and the trajectories braid around the islands by forming exactly the braid of figure 9a; material lines are therefore stretched around the islands. Such islands are equivalent to the islands observed in the journal-bearing flow for small θ1. When the size of the rod is increased (figure 9d), the islands are destroyed because of enhanced transport between the left and right parts. Nevertheless, two unstable 1-periodic orbits (not shown here) replace the islands, and lines braid around the unstable orbits instead.
The similarity between the journal-bearing flow and the figure-eight flow can be further investigated by considering the growth rate of material lines, that is the topological entropy of the flow. We have plotted in figure 10 the evolution of the length of a material line for protocols corresponding to different values of θ1. The length has not been plotted versus the number of stirring periods t, but rather versus θ1 × t, which measures the total angular displacement of one of the cylinders in the positive sense. Indeed, a material line is stretched more for a larger value of θ1. With such a choice, we can compare the line stretching realized by the different protocols for the same energy consumption. The growth of the line is exponential with time, as expected in chaotic advection. We observe that the growth rate increases with θ1, even if we have rescaled the time in order to consider the total wall displacement. Interestingly, the topological entropy measured for θ1 = 2π is 1.78, that is a value very close to the topological entropy of the figure-eight braid. This means that the material line is stretched by the same factor as for the figure-eight protocol every time the inner (and outer) cylinder are rotated by 2π in the same sense. We may, therefore, hypothesize that at each period some filaments make exactly one loop around one of the 1-periodic points, as well as a loop around the other, as with the figure-eight. Of course, the cylinders rotate alternately in opposite senses; however, fluid particles will typically be affected more by one of the rotations of one cylinder, because of the other cylinder that displaces fluid particles on a different streamline. For θ1 = 3π and 4π, the greater value of the topological entropy may be explained by additional topological entanglement that arises from material lines braiding around other periodic structures. A greater number of 1-periodic points is measured for θ1 = 3π and 4π; for θ1 = 4π, there even exists an elliptic crescent-like island inside the chaotic region (see the Poincaré section in the article), around which material lines can braid. For θ1 = π/2, we observe two different stages in the evolution of the length: a first slow exponential growth, and then a much faster growth. The first regime corresponds to the material line looping exclusively around one single elliptic island, with folds pointing to a stagnation point on the inner cylinder responsible for the exponential (instead of algebraic for a simple rotation) growth of the line. The change of slope in figure 10 is due to the material line being ‘caught’ by the other side of the inner cylinder, that is when the material line starts winding around the two islands. This example shows that it may take a large number of periods (here, approx. 30) before the growth rate of a material line converges to the topological entropy of the flow.
Figure 10.
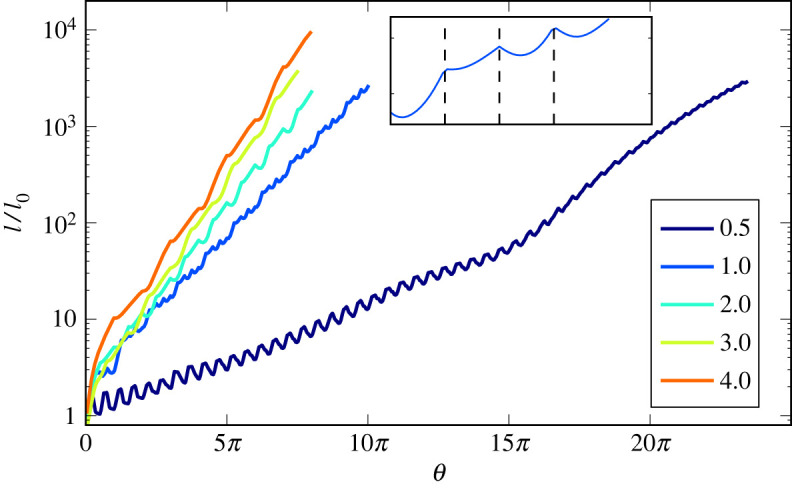
Growth of a material line, plotted versus the positive angular displacement θ = θ1 × t, where t is the number of stirring periods, for different values of the parameter θ1 (θ1 = π/2, π, 2π, 3π, 4π). An exponential growth of the length is observed, as expected for chaotic advection. However, in the case of strong stretching inhomogeneities (θ1 = π/2), it may take a long time before the asymptotic exponential regime is reached, because fluid particles wait a long time before visiting some parts of the domain. The topological entropy, that is the asymptotic rate of length growth, increases with θ1. For θ1 = 2π, the topological entropy corresponds well to the topological entropy of a figure-eight braid (see text). Inset: the length of a line is not growing monotonically during one stirring period. Alternating the sense of rotation of the cylinders leads to the unwinding of filaments that have been sheared by one cylinder, and have hardly been displaced by the rotation of the other cylinder—as for fluid particles located on the right side of fluid domain when the inner cylinder starts moving. Efficient stretching is nevertheless experienced by fluid particles that are displaced significantly by both cylinders successively. (Online version in colour.)
Another feature of interest in figure 10 is the non-monotonic growth of material lines. As shown in the inset of figure 10, during the four legs of the protocol the growth rate is much greater at the end than at the start, and the length of the line may even first decrease when a cylinder starts moving. This is due to the reversal of the rotation sense, which makes a cylinder unwind the filaments it has stretched while rotating in the opposite sense, if the rotation of the other cylinder has not moved the filaments enough. This happens, for example, for fluid particles located on right of the domain when the inner cylinder starts moving. Note that the unwinding is less pronounced for greater values of θ1, because each cylinder can perturb all fluid particles more before the other cylinder reverses its rotation. In fact, the global stretching factor of a line is not affected much by such unmixing/unwinding phases, because the growth rate is controlled by the parts of the line that wind efficiently on the figure-eight braid. Nevertheless, the temporary decrease of the length indicates that the protocol is inefficient for stretching a fraction of fluid particles.
7. Measuring the quality of mixing from stretching factors
The topological entropy of the different flows, that is the asymptotic exponential growth rate of material lines that we have studied above (figure 10), may be considered as a measure of the mixing efficiency of the flow: the longer the interfaces, the more efficient is molecular diffusion, hence mixing. Nevertheless, the topological entropy is a mean quantity, which does not account for the inhomogeneities of stretching. In this section, we examine the efficiency of our different geometric-mixing protocols, as measured by their ability to reduce the fluctuations of a scalar concentration field (such as the concentration of the dye in figure 9).
Let us consider point-like particles located uniformly through the chaotic region. We may estimate the stretching factor λ(x0, t) experienced by a particle x0 at time t; by measuring how a neighbouring particle separates from it:
| 7.1 |
(This may be written more rigorously with the Jacobian of the flow, but the above gives the concept.) Dynamical systems theory provides some results on statistical quantities such as the convergence of to the Lyapunov exponent of the flow, and the convergence of to the topological entropy of the flow [40,41]. However, such average quantities are not relevant to describe how concentration fluctuations, such as in figure 9c,d, are smoothed out by stretching and diffusion. A typical concentration fluctuation such as the blob of dye in the schematic of figure 11 is stretched and folded by chaotic advection; during a first stage, the concentration level of the filament does not change because molecular diffusion is not efficient at large scales. Diffusion starts to be efficient when filaments reach the diffusive cut-off scale at which the effects of stretching and diffusion balance, so that the width of the filament stays constant [42]. Such cut-off scale is called the Batchelor scale given by
| 7.2 |
where κ is the diffusivity and Λ the mean stretching rate [18]. Filaments that reach the Batchelor scale diffuse into the surrounding fluid. Conversely, other filaments with different concentration levels diffuse into them, so that many filaments are merged together inside ‘boxes’ of width, the Batchelor scale [42,43]. As a first-order approximation, we may assume that a filament bearing a concentration fluctuation has been well mixed once it has reached the Batchelor scale (sophisticated theories exist [42–44] to predict how fluctuations decay because of the merging of different filaments, but such refinements are not needed here, as we will see).
Figure 11.
Sketch of the evolution of a blob of dye stretched and folded by chaotic advection. The concentration level of the filaments stays close to the original concentration until filaments are compressed down to the Batchelor scale, at which the effects of stretching and diffusion balance. Afterwards, filaments diffuse and are merged with other fluctuations, resulting in efficient mixing. (Online version in colour.)
Chaotic advection protocols are usually characterized by strong stretching inhomogeneities; therefore, all concentration fluctuations do not reach the Batchelor scale at the same time. We may estimate the critical stretching factor required for a concentration fluctuation to reach the Batchelor scale as
| 7.3 |
where l0 is the typical initial wavelength of concentration fluctuations. We may therefore estimate the fraction of unmixed concentration fluctuations at time t as
| 7.4 |
measures the fraction of fluid particles for which filaments have not yet reached the Batchelor scale and still bear the same concentration level as in the initial concentration pattern. therefore approximates the ratio between the variance of the concentration variance at time t, and the initial concentration variance. This quantity is therefore a measure of mixing quality at time t. In systems where stretching is not very homogeneous, the quality of mixing is indeed determined solely by the particles that have been stretched the least; the majority of particles have been stretched below and have a negligible contribution to the global intensity of fluctuations. By definition,
which simply means that the quality of mixing is greater for a larger diffusion, for example.
In numerical simulations, it is possible to define a ‘concentration’ field by binning a large number of Lagrangian trajectories initialized in a small ‘blob of dye’, inside square boxes whose scale corresponds to the diffusive scale . A measure of mixing quality is then given by the standard deviation of this binned concentration field. Nevertheless, such a measure requires a very large number of trajectories in order to separate the fluctuations due to mixing from the statistical fluctuations due to the finite number of points in the bins. The measure of requires many fewer trajectories.
8. Mixing efficiency of the journal-bearing flow
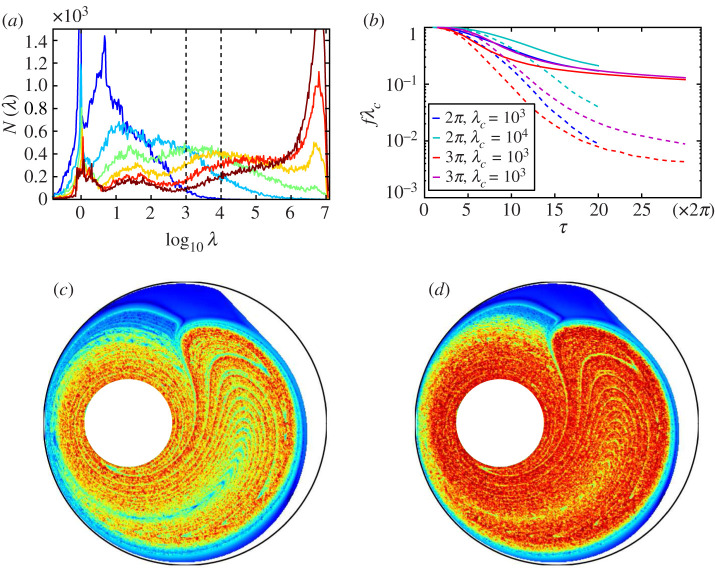
We have plotted in figure 12a the histograms of stretching factors λ(x0, t) at different times for θ1 = 2π. Such histograms were obtained by integrating the trajectories of 105 particles, as well as the trajectories of the same particles translated by a distance ε = 10−7 in order to compute the stretching factor of x0 from equation (7.1) (another solution would consist in placing the particles on a regular grid and keeping only the particles that belong to the chaotic region, but this is not easy to do for a non-convex chaotic region). In order to integrate only the trajectories of particles located inside the chaotic region, our 105 particles are the iterates of a single point by the Poincaré map during 105 periods.
Figure 12.
(a) θ1 = 2π, histograms of total stretching experienced by fluid particles at different times (from blue n = 2 to red n = 17), plotted in semilog coordinates. (b) Evolution of the unmixed fraction for two protocols (θ1 = 2π or 3π), and two values of the critical stretching factor λc. Solid lines correspond to measured inside the whole chaotic region (including the vicinity of the outer cylinder), while for dashed lines only particles inside a central disc of radius 0.6 have been taken into account. (c) and (d) θ1 = 2π, map of stretching values (from blue to red) at t = 10 (c)) and t = 15 periods (d)). (Online version in colour.)
We observe in figure 12a that the mean stretching increases with time. We have represented the histograms of log 10(λ(x0, t)), because stretching is a multiplicative process, hence the logarithm of the stretching is expected to grow linearly with time. For the longer times, the peak at high stretching factor is an artefact coming from the finite distance between neighbouring particles at time t = 0, that limits the maximal stretching factor to the ratio between the domain size and the initial distance ε. Nevertheless, particles that are stretched to such values are extremely well mixed; therefore, the inaccuracy about their stretching is not a problem. At all times, we observe a multimodal shape of the histograms of stretching factors, that indicates a very heterogeneous stretching of fluid particles. The peak at low stretching values does not move much towards greater values of stretching, because particles that experience slow stretching typically stay in the same area for long times, hence they keep being poorly stretched repeatedly. The spatial repartition of stretching intensities can be visualized by plotting a colour map of stretching values as in figure 12(c) (t = 10) and (d) (t = 15). Low stretching values are found for particles located in two regions: (i) the boundary of the outer cylinder; the geometric mixing protocol imposes that fluid close to the boundaries of the cylinders comes back to its initial location at the end of one period, and hence experiences very weak stretching; and (ii) particles that stay a few periods in-between the two cylinders on the right side of the vessel, where the effects of the two cylinders almost compensate.
We now compute the value of the unmixed fraction . The choice for λc is quite arbitrary (or application-dependent): as can be seen from equations (7.3) and (7.2), it depends on the diffusivity of the species to be mixed, the time-period of the stirring protocol (through the stretching rate) and the wavelength of the initial concentration pattern. In dye mixing experiments such as figure 9c,d, the Batchelor scale was of the order of 1/1000 of the vessel size (20 cm), and the scale of initial concentration fluctuations is equal to the vessel size (the initial blob of dye is small, yet all the ‘white’ dye-free fluid also has to be stretched until it diffuses and is merged with dye filaments). From equation (7.3), a critical stretching factor of 103 is relevant for describing the decay of concentration fluctuations in such an experiment. We have therefore computed for λc = 103, and λc = 104 (the latter case corresponds for example to a larger vessel, or a less-diffusive dye). The results are plotted with solid lines in figure 12b for θ1 = 2π and 3π. As for the growth of a line in figure 10, we have plotted versus θ1 × t.
For the two values of λc, we observe that the quality of mixing is better for θ1 = 3π than for θ1 = 2π at all times. This better quality is due to a better homogeneity of stretching for θ1 = 3π, because one allows for more ‘streamline jumping’ when letting the cylinders rotate more. Nevertheless, the decay rate of the fraction of unmixed fluid seems to slow down after a first exponential-like decay for the two protocols. This is due to the fluid close to the outer cylinder, that is very poorly stretched. Of course, one may argue that this slow mixing concerns only fluid at the boundary, and that mixing is good at the centre. This would be too simple a vision, however, because fluid close to the outer wall ends up escaping to the rest of the chaotic region, and therefore contaminates the central region with unmixed fluid. (Mixing can be slowed down by regions of slow stretching such as the vicinity of a solid wall [18,39,45].) Such slow injection of unmixed fluid is visible on the stretching maps in figure 12c,d as filaments of weaker stretching emanating from the cusp of the top of the chaotic region. We have computed the fraction of unmixed fluid inside a central disc of radius 0.6 (that is, far from the boundary); the results are plotted as dashed lines in figure 12b. Although the fraction of unmixed fluid is much weaker than for the whole chaotic region (by an order of magnitude or more), the same trends are observed in the central disc (better mixing for θ = 3π, slower than exponential decay for long times). Regions of slow stretching such as the vicinity of the wall therefore slow down mixing not only because they high concentration fluctuations persist in such regions, but also because fluctuations leak out of these regions and degrade the quality of mixing also in better-stretched regions.
Our aim in these latter Sections has been to describe the process of mixing induced by the geometric phase in the framework of topological mixing tools. We have done so by focusing on characterizing the mixing process for a mixing protocol with a non-zero area loop. However, the relation between the computed topological quantifiers and geometric phases remains to be fully understood. For example, mixing is bound to be slow at long times for time-periodic chaotic-mixing protocols, because of time-coherent regions of slowest stretching (such as the vicinity of the wall, here) that leak into the rest of the chaotic region. A protocol with more ‘randomness’ should mix much better. This is work for the future. We should also acknowledge that all our calculations herein have been two-dimensional, whereas fluids have three dimensions and many fluid flows are three-dimensional. This limitation comes down to the point that most of the work on dynamical systems in fluids has been on two-dimensional flows because these are linked to Hamiltonian dynamical systems, which have been worked on more thoroughly than their three-dimensional counterparts [18]. Three-dimensional mixing studies show many novel phenomena [46–48], and we expect this situation gradually to improve.
9. Applications
Applications are clearly manifold. Mention should be made of a biological instance of cavity flow in which geometric mixing takes place: the stomach. In the stomach, food and drink are mixed to form a homogeneous fluid termed chyme, which is then digested by the intestines. Gastric mixing is produced by what is called peristalsis: by the stomach walls moving in a rhythmic fashion. How then is this peristaltic movement of the stomach walls able to produce mixing, especially in animals in which the stomach dimensions are such that fluid inertia of the stomach contents is negligible? The geometric phase introduced by the deformable boundaries of the container is how peristaltic mixing such as digestion functions. There is a geometric phase of the stomach [49]; this has inevitably been termed the belly phase.
Data accessibility
The individual panels used to generate the figures are available via the following link: https://github.com/jarrietasanagustin/geometric_mixing.
Authors' contributions
All authors designed research; J.A., E.G. and I.T. performed numerical simulations; N.P. and O.P. conducted theoretical analysis; J.H.E.C. and J.A. wrote the first version of the paper and all authors contributed to the final version.
Competing interests
We declare we have no competing interests.
Funding
We acknowledge the support from the Spanish Ministry of Economy and Competitiveness (AEI, FEDER EU) grant nos FIS2016-77692-C2-1-P (I.T., O.P. and J.A.), FIS2016-77692-C2-2-P (J.H.E.C.) and CTM-2017-83774-D (J.A.). J.A thanks the Govern de les Illes Balears for financial support through the Vicenç Mut subprogram partially funded by the European Social Fund.
Reference
- 1.Stokes GG. 1851. On the effect of the internal friction of fluids on the motion of pendulums. Trans. Camb. Phil. Soc. 9, 8–106. [Google Scholar]
- 2.Taylor GI. 1960. Low Reynolds number flow. Scotsdale, AZ: Educational Services Incorporated. (16 mm film).
- 3.Heller JP. 1960. An unmixing demonstration. Am. J. Phys. 28, 348–353. ( 10.1119/1.1935802) [DOI] [Google Scholar]
- 4.Shapere A, Wilczek F eds. 1989. Geometric phases in physics. Singapore: World Scientific. [Google Scholar]
- 5.Berry MV. 1984. Quantal phase factors accompanying adiabatic changes. Proc. R. Soc. Lond. A 392, 45–57. ( 10.1098/rspa.1984.0023) [DOI] [Google Scholar]
- 6.Hannay JH. 1985. Angle variable holonomy in adiabatic excursion of an intregable Hamiltonian. J. Phys. A 18, 221–230. ( 10.1088/0305-4470/18/2/011) [DOI] [Google Scholar]
- 7.Montgomery R. 1988. The connection whose holonomy is the classical adiabatic angles of Hannay and Berry and its generalization to the non-integrable case. Commun. Math. Phys. 120, 269–294. ( 10.1007/BF01217966) [DOI] [Google Scholar]
- 8.Golin S, Knauf A, Marmi S. 1989. The Hannay angles: geometry, adiabaticity, and an example. Commun. Math. Phys. 123, 95–122. ( 10.1007/BF01244019) [DOI] [Google Scholar]
- 9.Kepler TB, Kagan ML. 1991. Geometric phase shift under adiabatic parameter changes in classical dissipative systems. Phys. Rev. Lett. 66, 847–849. ( 10.1103/PhysRevLett.66.847) [DOI] [PubMed] [Google Scholar]
- 10.Kagan ML, Kepler TB, Epstein IR. 1991. Geometric phase shifts in chemical oscillators. Nature 349, 506–508. ( 10.1038/349506a0) [DOI] [PubMed] [Google Scholar]
- 11.Cartwright JHE, Piro N, Piro O, Tuval I. 2016. Geometric phases in discrete dynamical systems. Phys. Lett. A 380, 3485–3489. ( 10.1016/j.physleta.2016.08.050) [DOI] [Google Scholar]
- 12.Khein A, Nelson DF. 1993. Hanny angle study of the Foucault pendulum in action–angle variables. Am. J. Phys. 61, 170–174. ( 10.1119/1.17332) [DOI] [Google Scholar]
- 13.Montgomery R. 1993. Gauge theory of the falling cat. In Dynamics and control of mechanical systems, pp. 193–218, vol. 1. Fields Institute Communications. Providence, RI: American Mathematical Society.
- 14.Shapere A, Wilczek F. 1989. Geometry of self-propulsion at low Reynolds number. J. Fluid Mech. 198, 557–585. ( 10.1017/S002211208900025X) [DOI] [Google Scholar]
- 15.Wisdom J. 2003. Swimming in spacetime: motion by cyclic changes in body shape. Science 299, 1865–1869. ( 10.1126/science.1081406) [DOI] [PubMed] [Google Scholar]
- 16.Guéron E, Maia CAS, Matsas GEA. 2005. ‘Swimming’ versus ‘swinging’ effects in spacetime. Phys. Rev. D 73, 024020 ( 10.1103/PhysRevD.73.024020) [DOI] [Google Scholar]
- 17.Lebowitz JL, Penrose O. 1973. Modern ergodic theory. Phys. Today 26, 23–29. ( 10.1063/1.3127948) [DOI] [Google Scholar]
- 18.Aref H. et al. 2017. Frontiers of chaotic advection. Rev. Mod. Phys. 89, 025007 ( 10.1103/RevModPhys.89.025007) [DOI] [Google Scholar]
- 19.Cina JA. 1986. Classical adiabatic angle and geometrical phase in spin precession. Chem. Phys. Lett. 132, 393–395. ( 10.1016/0009-2614(86)80632-7) [DOI] [Google Scholar]
- 20.Jeffery GB. 1922. The rotation of two circular cylinders in a viscous fluid. Proc. R. Soc. Lond. A 101, 169–174. ( 10.1098/rspa.1922.0035) [DOI] [Google Scholar]
- 21.Ballal BY, Rivlin RS. 1976. Flow of a Newtonian fluid between eccentric rotating cylinders: inertial effects. Arch. Ration. Mech. Anal. 62, 237–294. ( 10.1007/BF00280016) [DOI] [Google Scholar]
- 22.Finn MD, Cox SM. 2001. Stokes flow in a mixer with changing geometry. J. Eng. Math. 41, 75–99. ( 10.1023/A:1011840630170) [DOI] [Google Scholar]
- 23.Aref H, Balachandar S. 1986. Chaotic advection in a Stokes flow. Phys. Fluids 29, 3515–3521. ( 10.1063/1.865828) [DOI] [Google Scholar]
- 24.Ottino JM. 1989. The kinematics of mixing: stretching, chaos, and transport. Cambridge, UK: Cambridge University Press. [Google Scholar]
- 25.Tabor M. 1989. Chaos and integrability in nonlinear dynamics: an introduction. New York, NY: Wiley. [Google Scholar]
- 26.Aref H. 1984. Stirring by chaotic advection. J. Fluid Mech. 143, 1–21. ( 10.1017/S0022112084001233) [DOI] [Google Scholar]
- 27.Wiggins S, Ottino JM. 2004. Foundations of chaotic mixing. Phil. Trans. R. Soc. Lond. A 362, 937–970. ( 10.1098/rsta.2003.1356) [DOI] [PubMed] [Google Scholar]
- 28.Sturman R, Ottino JM, Wiggins S. 2006. The mathematical foundations of mixing: the linked Twist Map as a paradigm in applications, micro to macro, fluids to solids. Cambridge, UK: Cambridge University Press. [Google Scholar]
- 29.Beigie D, Leonard A, Wiggins S. 1991. Chaotic transport in the homoclinic and heteroclinic tangle regions of quasiperiodically forced two-dimensional dynamical systems. Nonlinearity 4, 775–819. ( 10.1088/0951-7715/4/3/008) [DOI] [Google Scholar]
- 30.Beigie D, Leonard A, Wiggins S. 1991. A global study of enhanced stretching and diffusion in chaotic tangles. Phys. Fluids 3, 1039–1050. ( 10.1063/1.858084) [DOI] [Google Scholar]
- 31.Schmelcher P, Diakonos FK. 1998. General approach to the localization of unstable periodic orbits in chaotic dynamical systems. Phys. Rev. E 57, 2739–2746. ( 10.1103/PhysRevE.57.2739) [DOI] [Google Scholar]
- 32.Diakonos FK, Schmelcher P, Biham O. 1998. Systematic computation of the least unstable periodic orbits in chaotic attractors. Phys. Rev. Lett. 81, 4349–4352. ( 10.1103/PhysRevLett.81.4349) [DOI] [Google Scholar]
- 33.Boyland PL, Aref H, Stremler MA. 2000. Topological fluid mechanics of stirring. J. Fluid Mech. 403, 277–304. ( 10.1017/S0022112099007107) [DOI] [Google Scholar]
- 34.Thiffeault J. 2010. Braids of entangled particle trajectories. Chaos 20, 017516 ( 10.1063/1.3262494) [DOI] [PubMed] [Google Scholar]
- 35.Boyland PL, Stremler MA, Aref H. 2003. Topological fluid mechanics of point vortex motions. Physica D 175, 69–95. ( 10.1016/S0167-2789(02)00692-9) [DOI] [Google Scholar]
- 36.Gouillart E, Thiffeault JL, Finn MD. 2006. Topological mixing with ghosts rods. Phys. Rev. E 73, 036311 ( 10.1103/PhysRevE.73.036311) [DOI] [PubMed] [Google Scholar]
- 37.Thiffeault JL. 2005. Measuring topological chaos. Phys. Rev. Lett. 94, 084502 ( 10.1103/PhysRevLett.94.084502) [DOI] [PubMed] [Google Scholar]
- 38.Moussafir JO. 2006. On computing the entropy of braids. Funct. Anal. Other Math. 1, 37–46. ( 10.1007/s11853-007-0004-x) [DOI] [Google Scholar]
- 39.Gouillart E, Kuncio N, Dauchot O, Dubrulle B, Roux S, Thiffeault JL. 2007. Walls inhibit chaotic mixing. Phys. Rev. Lett. 99, 114501 ( 10.1103/PhysRevLett.99.114501) [DOI] [PubMed] [Google Scholar]
- 40.Alvarez MM, Muzzio FJ, Cerbelli S, Adrover A, Giona M. 1998. Self-similar spatiotemporal structure of intermaterial boundaries in chaotic flows. Phys. Rev. Lett. 81, 3395–3398. ( 10.1103/PhysRevLett.81.3395) [DOI] [Google Scholar]
- 41.Muzzio FJ, Alvarez MM, Cerbelli S, Giona M, Adrover A. 2000. The intermaterial area density generated by time- and spatially periodic 2D chaotic flows. Chem. Eng. Sci. 55, 1497–1508. ( 10.1016/S0009-2509(99)00359-0) [DOI] [Google Scholar]
- 42.Villermaux E, Duplat J. 2003. Mixing as an aggregation process. Phys. Rev. Lett. 91, 184501 ( 10.1103/PhysRevLett.91.184501) [DOI] [PubMed] [Google Scholar]
- 43.Duplat J, Villermaux E. 2008. Mixing by random stirring in confined mixtures. J. Fluid Mech. 617, 51–86. ( 10.1017/S0022112008003789) [DOI] [Google Scholar]
- 44.Duplat J, Jouary A, Villermaux E. 2010. Entanglement rules for random mixtures. Phys. Rev. Lett. 105, 034504 ( 10.1103/PhysRevLett.105.034504) [DOI] [PubMed] [Google Scholar]
- 45.Gouillart E, Dauchot O, Dubrulle B, Roux S, Thiffeault JL. 2008. Slow decay of concentration variance due to no-slip walls in chaotic mixing. Phys. Rev. E 78, 026211 ( 10.1103/PhysRevE.78.026211) [DOI] [PubMed] [Google Scholar]
- 46.Cartwright JHE, Feingold M, Piro O. 1995. Global diffusion in a realistic three-dimensional time-dependent nonturbulent fluid flow. Phys. Rev. Lett. 75, 3669–3672. ( 10.1103/PhysRevLett.75.3669) [DOI] [PubMed] [Google Scholar]
- 47.Cartwright JHE, Feingold M, Piro O. 1996. Chaotic advection in three-dimensional unsteady incompressible laminar flow. J. Fluid Mech. 316, 259–284. ( 10.1017/S0022112096000535) [DOI] [Google Scholar]
- 48.Cartwright JHE, Feingold M, Piro O. 1994. Passive scalars and three-dimensional Liouvillian maps. Physica D 76, 22–33. [Google Scholar]
- 49.Arrieta J, Cartwright JHE, Gouillart E, Piro N, Piro O, Tuval I. 2015. Geometric mixing, peristalsis, and the geometric phase of the stomach. PLoS ONE 10, e0130735 ( 10.1371/journal.pone.0130735) [DOI] [PMC free article] [PubMed] [Google Scholar]
Associated Data
This section collects any data citations, data availability statements, or supplementary materials included in this article.
Data Availability Statement
The individual panels used to generate the figures are available via the following link: https://github.com/jarrietasanagustin/geometric_mixing.


