

Abstract
Employing data from a statewide study of sheltered-care residents and facilities in California, combined with archival data describing the census tracts in which these facilities are located, the authors analyze the impact of community reaction on sheltered-care residents in different types of neighborhoods. Findings suggest that conservative middle-class communities are most likely to exhibit extreme negative reactions that can have a deleterious impact on the social integration of residents in community care. Liberal, nontraditional neighborhoods conform most closely to the ideal accepting community. In liberal, nontraditional neighborhoods and conservative working-class neighborhoods a moderate level of community reaction actually facilitates the social integration of sheltered-care residents.
Community reaction to the mentally ill has been an oft discussed and researched phenomenon during the past ten years, and it has been well established that such reaction affects both the ability of the mentally ill to participate in community life and the willingness of local government to provide or permit the provision of services (Segal and Aviram, 1978). In this paper we are concerned with the immediate environment of the community-based sheltered-care facility, a residential setting that is intended to provide supervised living for a handicapped group, in this case, the mentally ill.
The oldest form of sheltered-care facility is the family-care home, which has traditionally aimed to maintain the chronically mentally ill in local areas (Morrissey, 1967). Later, halfway houses with more rehabilitative goals developed as an element of sheltered-care (Apte, 1968). These have been joined by board-and-care facilities that have assumed all three functions of community-based sheltered-care: long-term care, transitional care, and placement of first resort (Segal and Aviram, 1978).
In California there are approximately 1,155 sheltered-care facilities serving nonretarded individuals between 18 and 65 years old who have had some experience in a psychiatric inpatient setting. Family-care homes constitute 26% of these facilities and serve 14% of all sheltered-care residents. Halfway houses, which have received the greatest attention of the mental health professions, account for only 2% of all facilities and serve only 3% of the state’s sheltered-care population. Board-and-care homes, which have developed in an unplanned, ad hoc manner, make up 72% of the state’s facilities and serve 82% of California’s sheltered-care residents (Segal and Aviram, 1978).
The community surrounding the sheltered-care facility may be a place in which ex-mental patients find a comfortable home or an oppressive one; a place in which their safety is threatened or in which they can feel free to be about; a place in which they can establish relationships or in which others are unavailable to them; a place in which their public dependency is resented and their personal disorder feared or a place to which they are welcomed with the same regard accorded any new neighbor. Put simply, there is a phenomenon of community reaction that has consequences. However, there are many important questions about community reaction that research has not addressed. One such question concerns the nature of the reaction and its impact on the mentally ill in various communities. For instance, how can the character of different communities best be described? What is the meaning of “quantity” with respect to community reaction? How much is a lot and how much is a little? Is community reaction a unidimensional phenomenon varying simply from high to low, or is it multidimensional, and perhaps woven so tightly within the social fabric of an area that its expression and meaning vary with the type of community? And, finally, there is the question that emerges from our unexpected findings, the “paradox of intensity” to which we refer in the title: Is it possible that adverse community reaction can, under some circumstances, facilitate rather than hinder the social functioning of former mental patients?
In this paper we consider some of these questions. We identify types of communities housing sheltered-care facilities and determine differential impacts of adverse community reaction within identified types. We also address interpretive problems associated with the meaning of the “intensity” of community reaction.
Community Context and the Problem of Intensity
In the past, studies have focused on the characteristics of those holding more negative attitudes toward the mentally ill—for example, older, less educated, lower socioeconomic-status individuals (Clark and Binks, 1966; Dohrenwend and Chin-Shong, 1967; MacLean, 1969; Rabkin, 1974)—and on specifying the individual characteristics that seem to precipitate negative reaction—for example, lower-class status, evidence of bizarre behavior, disruptive and possibly dangerous behavior (Lemkau and Crocetti, 1962; Phillips, 1964; Yamamoto and Dizney, 1967; Linsky, 1970; Bord, 1971).
More recently, researchers have focused on the relationship between community context and (1) negative attitudes toward the mentally ill, (2) the development of services for the mentally ill, and (3) the social life of the mentally ill. This research has sought to identify accepting and rejecting neighborhoods. Trute and Segal (1976), for instance, found the highest levels of social integration among residents of sheltered-care facilities that were located in neighborhoods with little social cohesion. Hall et al. (1979) found a small but significant relationship between attitudes toward the mentally ill and two community characteristics: location (suburban vs. urban) and socioeconomic status as defined by census indicators. Finally, in considering community opposition to the development of residential services, Piasecki (1975) found that more resistance was encountered in residentially, as opposed to commercially, zoned areas. These are simple, unidimensional descriptions with limited practical utility (Smith, 1976). In specifying the impact of social context on community reaction, we shall employ more comprehensive descriptions of community characteristics.
In addition to better portrayals of a community’s social context, we need more clarity about the concept of intensity, which, generally speaking, refers to the amount of negative community reaction expressed. Theoretically, intensity may not be merely a measurable quantity of adverse reaction, but the gestalt of a complicated process of community interaction that may focus directly upon mentally ill individuals, on their institutional representatives, and on political actors. We might expect the meaning of intensity, as well as its quantifiable degree, to vary with the community processes that produce it.
To date, attempts to understand the intensity of negative community reaction have been concerned with a community’s response to the location of mental health facilities. These studies usually include a simple report of the number of facilities that have had start-up problems (see Raush and Raush, 1968; Glasscote et al., 1971). Piasecki (1971) considers the strength of opposition reported by facility operators, noting that the strongest opposition was directed at facilities serving offenders in residential zones. However, the intensity of negative community reaction has not been related to a. broadly defined community context, nor explained with reference to a process of community interaction. In this paper we present data bearing on the first question: the relationship between intensity, defined as a general degree of negative reaction, and broadly defined community contexts or types. We also look at the impact of negative reaction on the social integration of sheltered-care residents housed in local facilities in different types of communities. The second matter, the relationship between the degree of intensity and community process, is beyond the sensitivity of our data and design. However, our findings suggest important questions in this area.
Method
Data were collected from two sources. Face-to-face, structured interviews were conducted with 499 residents and 211 operators of community-based sheltered-care facilities in 157 census tracts or enumeration districts in California. Sampled residents were between 18 and 65 years of age, were nonretarded, and had a history of mental hospitalization. Operators interviewed were those running sampled facilities. The samples of residents and facilities were self-weighting probability samples representative of all 12,430 ex-patient sheltered-care residents and all 1,155 facilities in the state.
In order to obtain the samples, the state was divided into three master strata: Los Angeles County, the nine-county San Francisco Bay Area, and all other counties of the state. Facilities were stratified by size in both Los Angeles and the Bay Area, and a sample was drawn of facilities with probabilities proportionate to bed capacities. In the third stratum, made up of “all other counties,” a cluster sample was designed, using counties as primary selection units. Two counties from the northern and two from the southern part of the state were selected with probability proportionate to size. From each pair, samples of facilities were selected, also with probability proportionate to size. Residents were sampled within facilities, using systematic random sampling from specially prepared field listings. (Further details of sampling procedures are reported in Segal and Aviram, 1977.)
Community data were abstracted from the 1970 census and from other public records. Aggregate data were garnered on the demographic, housing, criminal justice, voting, and mental health service characteristics of the 157 tracts that contained sampled facilities.
Data were analyzed at three levels: resident, facility, and community.
At the resident level, the primary variable of interest was the level of external social integration of a resident in any given facility in a given community. External integration was defined as the extent to which the resident spent time in, had access to, participated in, and produced or consumed goods and services in the community in a self-initiated manner, i.e., independent of the facility’s effort (Segal and Aviram, 1978). Since we were interested in the impact of community factors on external integration, and sought to control for the placement of more able patients in facilities in certain types of communities, the external integration criterion was adjusted to account for the individual characteristics of each resident. We therefore assessed the impact of community factors on the resident’s level of external social integration after the resident’s level of psychopathology, current participation in treatment, age, and sex had explained what they could of his or her external integration. Psychopathology was measured by the Langner and the Overall and Gorham psychiatric rating scales (Langner, 1962; Overall and Gorham, 1962).
At the facility level, we considered the neighborhood’s impact as it was described both by the facility operator and by the resident. This impact was measured on a scale of neighborhood restrictiveness, a general measure of the extent to which the community did not invite, or even discouraged, the participation of community-care residents, i.e., the degree of community reaction. Items included in the scale asked whether facility residents knew the names of neighbors, whether residents had been invited into neighbors’ homes, whether people in the neighborhood kept to themselves, whether neighbors complained to the facility, whether the facility operator had been threatened or harassed by neighbors, and whether complaints had been made to local authorities. Since there is no absolute zero point on this scale, the degree of intensity of community reaction was interpreted as a function of the impact of this variable on our criterion of external social integration.
Our analysis of community-level data proceeded as follows. Using Tryon’s method of factor analysis (Tryon and Bailey, 1970), we identified five relatively independent dimensions that characterize neighborhoods containing community-based sheltered-care facilities. These dimensions are:
The neighborhood’s degree of political conservatism
The neighborhood’s family orientation
The neighborhood’s socioeconomic status
The amount of criminal activity in the neighborhood
The neighborhood’s degree of nontraditional orientation
The tables in Appendices A through E present the items making up each factor, their factor loadings, the percentage of communality (h2) accounted for by each factor, and its reliability. Intercorrelations between factor scores are also included. The five factorial dimensions are described below.
Political conservatism (I).
Politically conservative neighborhoods have a large proportion of residents who voted for Richard Nixon or John Schmitz (the American Independent Party candidate) for President in 1972, in favor of the California capital punishment initiative, and against mandatory school busing and an initiative allowing union organizers access to farm workers in the fields. Additionally, these neighborhoods have a substantial number of registered Republicans, few non-Caucasians (as categorized by the 1970 census), and few public assistance recipients.
Family orientation (II).
Neighborhoods scoring high on this dimension have a large proportion of single-family structures and owner-occupied units. Consequently, they have few large structures (such as apartment houses) and few triplexes. The ratios of persons per household and dependent children (those under 16) are high.
Socioeconomic status (III).
High-status neighborhoods have many residents with high incomes, high levels of education, and managerial or professional employment. Rents and property values are high, and there are few impoverished families or unemployed heads of households.
Criminal activity (IV).
A high score on this dimension refers principally to high rates of robbery, assault, rape, car theft, murder, and burglary. Associated with these rates are two items characteristic of impoverishment, whether urban or rural: a relatively large proportion of housing without plumbing and a large number of disaffiliated males (neither working nor in school). Even so, the correlation between criminal activity and socioeconomic status is low (−.10).
Nontraditional orientation (V).
Nontraditional neighborhoods are characterized by a high proportion of residents voting for the protection of coastal lands and the legalization of marijuana, and by a greater than usual proportion of residents registered as members of the Peace and Freedom Party. These neighborhoods are also characterized by the substantial presence of group quarters, boarding houses, and households formed of unrelated persons. There is a high proportion of women of child-bearing age and a high proportion of women in the labor force.
In considering the factor scores, we found only one that was a significant single predictor of external social integration, and it explained only 4% of the variance. We concluded that there apparently was not a linear relationship between external integration and the factor scores. A regression of external integration on the five factor scores, the three intervening variables (restrictiveness, use of county mental health services, and use of state mental health services), and the 15 two-way interactions deriving from these predictors inflated the standard error of the coefficients, making it hard to interpret their borderline significance (.10 to .15). Stepwise multiple regression analysis of the factor scores and their interactions produced high intercorrelations among predictors (multicollinearity). As a result of these findings, rather than looking at the separate factor scores and their interactions with the other predictors, we came to believe that it was more important to look at community clusters or types as integral contexts in an analysis of covariance. By this method we hoped not only to achieve parsimony but to describe real communities in which there appeared to be complex interactions between our predictors and external social integration.
Fifty-six neighborhood characteristics were reduced to simple sum factor scores on these five dimensions. Each neighborhood could then be described by a profile of five factor scores over these five dimensions, which accounted for 82% of the initial communality. On the basis of similarities and differences among neighborhood profiles, a further typological analysis was performed by Tryon’s method.
This typological analysis consisted of identifying the fewest, most distinct profile patterns that emerged over the five factorial dimensions. Each neighborhood was “typed” by virtue of its similarity to one or another of the most frequently occurring patterns. The analysis then condensed the most frequent types into the fewest possible types that were still distinctly different to the analyst. The profile of scores for each neighborhood was reduced to a point in five-dimensional factor space. The resulting projection thus contained as many points as neighborhoods. The factor space was next partitioned into arbitrarily defined sectors, and each point was assigned to a sector based on its profile of scores. The sectors that contained significant numbers of points defined what is referred to as a core type. Profiles not originally falling into core types were assigned to the one nearest in factor space.1
The next step in the analysis was to combine core types into even fewer types, based on pattern similarities, through the method of condensation. That is, core types are combined, beginning with the two most similar (again using distance measures as the similarity criterion) and proceeding two at a time (including previous combinations), until all types have been reduced to a single type—that is, until a flat, patternless profile is produced. The more condensation that is accepted, the more similar the resulting profiles become. The trade-off is parsimony for differentiation (and perhaps meaning). The degree of condensation is under the analyst’s control.
In short, a typological analysis seeks to reduce the number of types to the fewest possible while still maintaining interpretable differences among the emergent types. In our analysis, 14 core types condensed to 5 distinguishable neighborhood profiles, describing 96% of the 157 neighborhoods studied.
Results and Discussion
A Community Typology
Figure 1 illustrates the profiles of our five neighborhood or community types when standardized mean factor scores are plotted across the five factor dimensions. Considerations of length and readability prohibit an itemized comparison of these neighborhoods, but some discussion of the salient differences among them and between sheltered-care neighborhoods and other California communities is desirable as background for our further analysis of patterns of community reaction.
FIGURE 1.
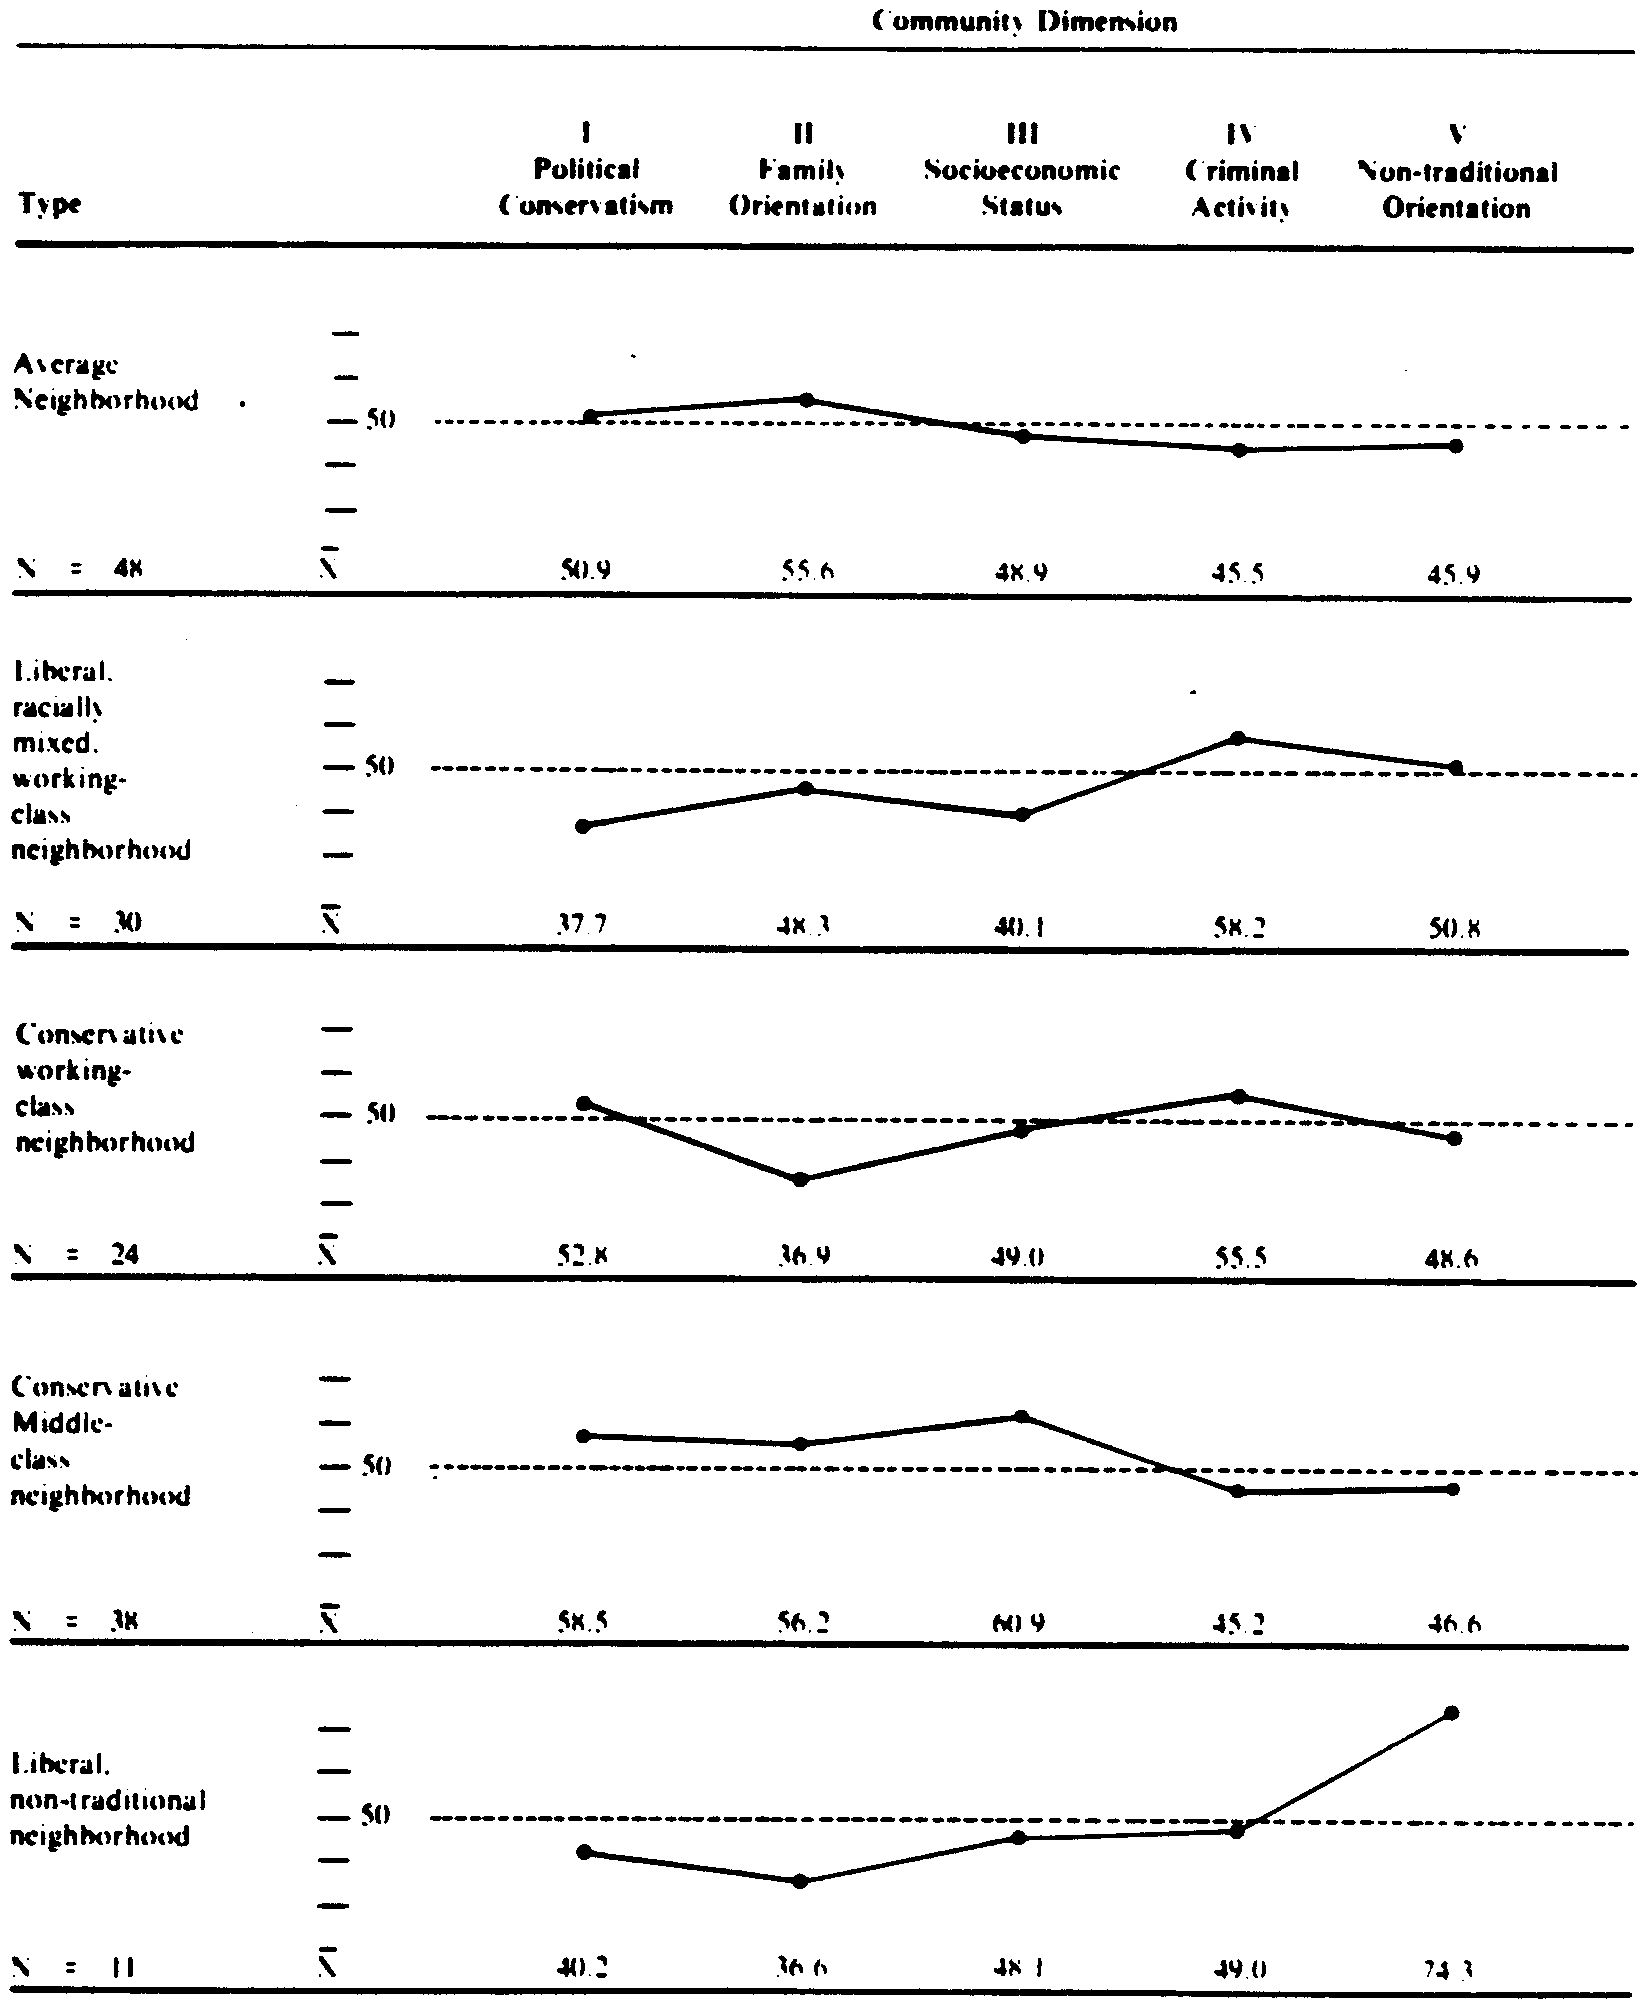
Profiles or community types (profiles plotted In standardized mean factor score units; , SD = 10)
The average sheltered-care neighborhood (which contains 31% of the sampled facilities) is not identical to the average California community, though it bears some resemblance. Compared with statewide figures, the average neighborhood hosting a sheltered-care facility is less conservative, more family-oriented, and less affluent than the state as a whole. Except on family orientation, where it ranks well above all but one other neighborhood type, it ranks in the middle on our descriptive dimensions.
The liberal, racially mixed working-class neighborhood (which contains 19% of the sampled facilities) is only 42% Caucasian (as opposed to 89% of California’s enumerated population in 1970), is extremely liberal in comparison to the state, and is relatively impoverished (the average family income is 25% below the state average). This sheltered-care neighborhood type appears less family-oriented than the state as a whole principally because it has relatively few single-family dwellings and very few owner-occupied units. Crime rates are very high compared with state averages and are higher in this neighborhood type than in any other sheltered-care community. The percentage of disaffiliated males (neither working nor in school) is three times the state level (12% vs. 4%).
The conservative working-class neighborhood (which contains 16% of the sampled facilities) is a preponderantly white (89%), conservative neighborhood in which incomes are low (18% below the state average) and crime rates are high. Residents tend to be apartment dwellers (58% of all units are in large structures, compared with 20% statewide) with few children (the youth dependency rate of 12% is less than half the state’s 28%).
The conservative middle-class neighborhood (which contains 24% of all sampled facilities) is a white (95%), very conservative neighborhood that is relatively well-to-do (family incomes are 28% above the state average). This sheltered-care neighborhood type contains chiefly single-family structures (76%) occupied by families with children. The proportion of eligible residents turning out to vote is higher than in other sheltered-care communities: 44% of all eligible voters cast ballots in the 1972 general election—a figure almost identical to that for the state (43%) but one that is substantially higher than the figures for other sheltered-care neighborhoods, which range from 27% to 30%.
The liberal, nontraditional neighborhood (which contains 8% of all sampled facilities) is a very distinctive sort of neighborhood characterized by its liberality and departure from convention. It is a racially mixed area (only 76% white) where residents have low incomes (17% below the state average) despite levels of educational achievement (12.3 years) and professional employment (26%) that are comparable to state averages. There are some single-family dwellings (27%) and a large number of apartment houses (46%) and triplexes (15%) for which rent is high (11% above the state norm). Some 13% of all residents live in group quarters (3% statewide), and 15% of all households are made up of unrelated persons (compared with 2% in the state). The youth dependency rate is low (18%). Compared with rates for the state as a whole, criminal activity is high, especially for robbery, rape, and car theft. However, crime rates in this neighborhood type are about average for sheltered-care neighborhoods.
The special characteristics of California’s sheltered-care neighborhoods.
On the whole, California’s sheltered-care neighborhoods are less conservative than the remainder of the state. They are more racially mixed than the state as a whole (79% white compared with 89% statewide), and they are of lower than average socioeconomic status. Property values in sheltered-care neighborhoods are 13% below those throughout the state, and owner-occupation is less common (40% vs. 55%). There are fewer single-family dwellings (57% vs. 67%) and more apartment houses (28% vs. 20%) and triplexes (8% vs. 6%). Crime rates in sheltered-care neighborhoods are substantially above state averages, especially those for robbery, assault, rape, and car theft. Significantly, sheltered-care facilities are located in neighborhoods where a large majority of the residents do not vote. Whereas 43% of the state’s eligible voters went to the polls in the 1972 election, only 32% of the eligible voters in sheltered-care neighborhoods cast ballots.
In sum, California’s sheltered-care neighborhoods appear to be among the most liberal, and perhaps the most tolerant in the state, but they also appear to be among the most vulnerable. Seventy-four percent of our sampled facilities are in neighborhoods of relatively low socioeconomic status, with low property values, high crime rates, and, if voting frequencies are any indicator, a pervading political apathy.
It is impossible for us to say how this analysis might have turned out had our data come from another state. We suspect that the general differences between sheltered-care neighborhoods and others would be the same. That is, we would expect the preponderance of facilities to be in liberal, low-status, high-crime, politically inactive or poorly organized areas—neighborhoods that are tolerant and/or relatively ill-defended.
The specific sheltered-care neighborhood types to be found in other states are a different matter. The density of Manhattan, for instance, might preclude the use of the census tract or enumeration district as an adequate surrogate for “neighborhood” or “community.” Further, the concentration of impoverishment in many eastern cities might produce a neighborhood type (i.e., an inner-city slum) with a more homogeneous profile than that of the liberal, racially mixed working-class community type which subsumes both the rural and urban areas of poverty in California. Finally, there is no community type in our analysis that corresponds to the profile of Beverly Hills or Lake Forest, Illinois. In California, at least, such wealthy, well-defended enclaves appear to manage without sheltered-care facilities.
External Integration, Restrictiveness, and Mental Health Services
To consider the impact of community restrictiveness (reaction) on the external social integration of sheltered-care residents, analyses were conducted within community types. In addition, we included as independent factors the numbers of mental health services (standardized by population size) delivered under community and state auspices. The volume of services was included in this manner because of the current emphasis on the provision of local mental health services, and because of widespread assumptions that have been made about the salutary effects of these services on the mentally ill and on community attitudes (Gaylin, 1973).
Our model proposes to predict the sheltered-care resident’s adjusted external integration score (see above) from three correlated inputs: community restrictiveness, and levels of county and state mental health services. These inputs are ecological variables in that they describe characteristics of the resident’s environment. The analysis is therefore “semi-ecological” in that although the individual resident’s adjusted external integration is being predicted, this may not be the same resident who receives a state and/or county service. The resident also may not directly experience the community’s restrictiveness.
Segal and Aviram (1978) established that when restrictiveness is experienced by the sheltered-care resident, it has a general and profound impact on external integration. They also showed that when the facility is subject to a high level of restrictiveness, a resident’s external integration is negatively affected. The present analysis goes one step further to look at the impact of restrictiveness in different community contexts.
Variance within community types.
As can be seen in Table 1, the highest level of external integration is found in the liberal, nontraditional community type (.339), the lowest level in the conservative middle-class neighborhood (−.299). The conservative middle-class neighborhood is also found to be the most restrictive. Thus facility residents in the most restrictive community type have the lowest level of external integration. This finding is expected. Contrary to expectation, however, is the finding that levels of external integration are highest in the liberal, nontraditional and the conservative working-class communities, even though the levels of restrictiveness in these neighborhoods are moderate rather than low.
TABLE 1.
Analysis of Variance of Mean Scores within Community Type
| Average | Liberal, Racially Mixed Working-Class | Conservative Working-Class | Conservative Middle-Class | Liberal, Non-traditional | F | |
|---|---|---|---|---|---|---|
| External integration | .010 | .029 | .152 | −.299 | .339 | 4.14* |
| Adjusted external integrationa | .057 | .078 | .021 | −.275 | .246 | 3.20* |
| Restrictiveness | 6.814 | 6.919 | 7.294 | 8.029 | 7.291 | 9.810* |
| Use of community mental health services | .077 | .072 | .061 | .037 | .107 | .32? |
| Use of state mental health services | .021 | .101 | .094 | .051 | .008 | 4.957* |
| N weightedb, c | 2,570 | 2,000 | 2,080 | 2,970 | 1,540 | |
| N unweightedc | 77 | 79 | 82 | 81 | 42 |
Adjusted for the individual characteristics of each resident (level of psychopathology, age, sex. current participation in treatment).
Weighted by the inverse of a sheltered-care resident’s probability of falling into the sample.
Ns in the table do not total to 12,430 (weighted) and 499 (unweighted) because they reflect the N for which all data are complete.
F value significant at p < .05.
As Table 1 also shows, when external integration scores are adjusted for the individual characteristics of the residents (age, sex, psychopathology, participation in treatment), both the liberal, nontraditional and the conservative working-class community types suffer significant and similar declines in mean scores. The conservative working-class community type is not significantly different from the average and the liberal, racially mixed working-class types on adjusted external integration means, although the liberal, nontraditional type maintains a significantly higher, though reduced, score. In both of these community types, individual resident characteristics contribute heavily to external integration. However, the liberal, nontraditional community type seems to provide a social context that is conducive to higher levels of external integration even after selection is taken into account. The liberal, nontraditional neighborhood may be the “accepting” community that researchers have sought.
The use of state mental health services—primarily inpatient care in a state mental hospital—also differs significantly across community types. Use is lowest in the liberal, nontraditional community and highest in the liberal, racially mixed working-class area. We find that the liberal, nontraditional community, which has the lowest level of use of state-sponsored care and makes the greatest use of county-sponsored services, also has a sheltered-care population with the highest mean external integration score. This finding is consistent with the notion that use of community-sponsored services should enhance social integration.
Predicting adjusted external integration from restrictiveness.
Table 2 shows that the model for predicting adjusted external integration is significant in three of the five community types: the conservative working-class, the conservative middle-class, and the liberal, nontraditional. In the conservative middle-class neighborhood, restrictiveness, as perceived by the facility operator, is the most important influence and acts to reduce the external integration of community-care residents.
TABLE 2.
Predicting Adjusted External Integration from Facility/Community-Level Characteristics within Each Community Type
| Average | Liberal, Racially Mixed Working-Class | Conservative Working-Class | Conservative Middie-Class | Liberal, Nontraditional | |
|---|---|---|---|---|---|
| Restrictiveness (facility experience) | .120* | .068 | .327* | −.349* | .299* |
| Use of community mental health services | −.070 | .197* | .356* | .131* | .228 |
| Use of state mental health services | −.117* | .073 | −.578* | .303* | −.292* |
| R2 | .039 | .052 | .161* | .176* | .150* |
| N weighteda, b | 2,330 | 1,850 | 2,010 | 2,510 | 1,470 |
| N unweightedb | 71 | 76 | 79 | 69 | 41 |
Note: Figures in the table are partial standardized regression coefficients unless otherwise labeled.
Weighted by the inverse of a sheltered-care resident’s probability of falling into the sample.
Ns in the table do not total to 12,430 (weighted) and 499 (unweighted) because they reflect the N for which all data are complete.
p < .05.
Significance assessed on the basis of N obtained in the unweighted sample.
In the liberal, nontraditional and the conservative working-class communities, restrictiveness is positively related to adjusted external integration: The more restrictive such communities, the more externally integrated the residents. However, in these two community types, the variance of restrictiveness is significantly lower than in the conservative middle-class neighborhood type. That is, the variation in restrictiveness in these two types is limited: They are not extremely rejecting or restrictive areas.
To determine whether the impact of community reaction falls directly upon the sheltered-care resident, or rather appears to be mediated in some way, we expanded the model illustrated by Table 2 to include a variable representing restrictiveness as perceived by the resident (see Table 3). In the liberal, nontraditional and the conservative working-class areas, restrictiveness as perceived by the resident has the single most important effect on adjusted external integration. This effect is emphatically negative, even though contextual restrictiveness—as reported by the facility operator—is positively and significantly related to adjusted external integration. In conservative middle-class communities, restrictiveness at the resident level is also negatively related to adjusted external integration, though the contextual effect is even stronger.
TABLE 3.
Predicting Adjusted External Integration from Facility/Community and Individual Characteristics for Three Community Types
| Conservative Working-Class | Conservative Middle-Class | Liberal, Nontraditional | |
|---|---|---|---|
| Restrictiveness (facility experience) | .245* | −.363* | .139** |
| Use of community mental health services | .107 | .108** | .237* |
| Use of state mental health services | −.357* | .337* | −.265* |
| Resident hospitalized within the past year | −.154* | .105** | −.209* |
| Restrictiveness (individual experience) | −.512* | −.309* | −.464* |
| R2 | .422 | .284 | .404 |
| N weighteda, b | 1,980 | 2,420 | 1,470 |
| N unweightedb | 78 | 67 | 41 |
Note: Figures in the main body of the table are partial standardized regression coefficients.
Weighted by the inverse of a sheltered-care resident’s probability of falling into the sample.
Ns in the table do not total to 12,430 (weighted) and 499 (unweighted) because they reflect the N for which all data are complete.
p < .05;
p < .10.
Significance assessed on the basis of N obtained in the unweighted sample.
We believe that the positive relationship between contextual restrictiveness and adjusted external integration in the liberal, nontraditional and the conservative working-class communities is a result of well-intended pressure brought to bear on facility operators and/or other service providers, whereas in conservative middle-class communities, where the relationship between contextual restrictiveness and adjusted external integration is strong and negative, community reaction is obdurate and pernicious, producing no salutary effects.
Predicting adjusted external integration from use of state and county mental health services.
Although the use of county-sponsored mental health services is in each case positively related to adjusted external integration, the relationship between adjusted external integration and the use of state services varies across the three community types in Table 3. In the conservative working-class and the liberal, nontraditional neighborhoods, the more use of state services, the lower the adjusted external integration for sheltered-care residents. In the conservative middle-class communities, though, the use of state services is positively related to adjusted external integration.
We believe that an ecological fallacy—that is, the attribution of a group characteristic to an individual without specific knowledge of the individual experience—underlies this latter finding. Recall that our data concerning the use of state mental health services are of an aggregate nature and do not pertain to the behavior of sampled sheltered-care residents. There is, then, no necessary connection between a resident in our sample and use of state services provided in his/her community. Our data on individual residents history of hospitalization show that sheltered-care residents in conservative working-class and liberal, nontraditional communities were far more likely to have been hospitalized in the previous year than ex-patients in conservative middle-class areas. Although it is possible that hospitalization is used more sparingly and more appropriately in conservative middle-class neighborhoods, we suspect that rehospitalized individuals simply do not return very often, or very soon, to these highly restrictive communities, thus leaving a residual, more acceptable group of ex-patients who account for the positive relationship between the community’s use of state services and the adjusted external integration scores of sheltered-care residents. In effect, we believe that this positive relationship reflects the “creaming” or “housecleaning” demanded of program operators in highly restrictive communities, whereas the negative relationships obtained elsewhere more realistically reflect the relationship between rehospitalization and social integration and are indicative of more tolerant environments.
Conclusion
There does not appear to be any simple, direct relationship between adverse community reaction and the social integration of ex-mental patients in community care. Extreme negative reaction, which we have found to be most common in conservative middle-class neighborhoods, does appear to have a profoundly negative influence on the social integration of community-care residents. However, in some communities, which we have described as liberal, nontraditional and conservative working-class in character, a moderate degree of adverse reaction—as perceived by the facility operator—seems to promote the social integration of ex-patients. In these communities we believe that a moderate amount of negative reaction serves as a stimulus to facility operators or other providers to promote social integration, perhaps because reaction assumes the form of constructive concern rather than outright hostility. We find that when residents perceive the adverse reactions of community members, social integration is inevitably reduced.
In conservative working-class and liberal, nontraditional neighborhoods, the individual characteristics of residents contribute substantially to their social integration. It appears, then, that individual abilities and traits, perhaps combined with placement criteria, produce a beneficial fit between sheltered-care residents and host communities. Still, in the liberal, nontraditional neighborhood, levels of social integration remain high even after adjustments are made for individual characteristics. The liberal, nontraditional neighborhood appears to be the “accepting environment” sought by researchers and mental health professionals.
Studies of this sort, no matter how suggestive, must be hedged with caveats. Although the use of broad, multidimensional community profiles appears to yield important insights on the differential nature of community reaction when related to a criterion variable, the stability of these profiles and the adequacy of the census tract as a surrogate for “neighborhood” or “community” should be demonstrated by replication. Also, future research should reduce the uncertainties of our “semi-ecological” analysis by including more and better data on the individual’s experience of community reaction and his/her utilization of mental health services. It is also important to extend our research to consider the community processes that translate various types of reaction into more or less social integration for ex-patients. Our findings strongly suggest that the intensity of adverse community reaction is not an easily measured, unidimensional phenomenon, but rather that it has various expressions and targets which have differential impacts on the mentally ill in our communities.
Finally, we must point out that the identification of an accepting environment is a mixed blessing. Although our field studies in Berkeley lead us to similar conclusions about the tolerant quality of the liberal, nontraditional community, they also persuade us that there are significant social costs involved in becoming a community that is safe for madness (Segal and Baumohl, 1980). No community, no matter how good-hearted, can long suffer the accumulation of society’s wounded and outcast without exhausting its resources and patience. The aim of research and intervention must still be the understanding and eradication of intolerance rather than the simple identification of likely sanctuaries.
Acknowledgments
This paper was prepared for the conference New Directions for Research on Stigma Toward the Mentally Ill, sponsored by the National Institute of Mental Health, Bethesda, Md., January 24 and 25, 1980. Thanks to Mark Kaplan for his comments and assistance.
This research is supported in part by the National Institute of Mental Health, Center for Epidemiologic Studies, Grant SROI MH25417–06 ESR.
APPENDIX A. Factor I. Political Conservation
Synonyms: Republican party, traditional party affiliation
| Defining Items | Factor Coefficient | Factor Score Interpretation (High scores indicative of) |
|---|---|---|
| Voted Nixon Proportion of those who voted for Richard Nixon for President in the 1972 general election | .98 | Voted for Nixon |
| Anti-busing Proportion voting in favor of California Proposition 21 in the 1972 general election | .96 | Against busing |
| Capital punishment Proportion voting in favor of California Proposition 17 in the 1972 general election | .95 | For capital punishment |
| Anti-Chavez Proportion voting in favor of California Proposition 22 in the 1972 general election | .92 | Against access to farmworkers for organizing |
| Republican registration Proportion of registered Republicans | .88 | Registered Republican |
| Ratio white Proportion of individuals categorized as Caucasian in the 1970 U.S. Census | .85 | Caucasian |
| Voted Schmitz Proportion of those who voted for Schmitz, the American Independent Party candidate, in the 1972 general election | .78 | Voted for Schmitz |
| Public assistance Proportion of families receiving public assistance as indicated by the 1970 U.S. Census | −.55 | Families not on welfare |
Percentage of communality (h2) exhausted by Factor I: 27%
Alpha reliability of eight defining items of Factor I: .97
Intercorrelations between factor scores of five factors with scores based on the simple sum of defining items: I/II .22, I/III .46, I/IV −.32, I/V −.27
APPENDIX B. Factor II. Family Orientation
Synonyms: Single family, traditional family home, suburban neighborhood
| Defining Items | Factor Coefficient | Factor Score Interpretation (High scores indicative of) |
|---|---|---|
| Single structure Proportion of housing structures classed as single structures by the 1970 U.S. Census | .98 | Single structures |
| Owner-occupied Proportion of housing structures classed as owner-occupied by the 1970 U.S. Census | .94 | Occupied by owner |
| Persons per household Average number of persons living in the household as determined by the 1970 U.S. Census | .94 | More living in household |
| Large structures Proportion of housing structures classed as large structures (e.g., apartment houses) by the 1970 U.S. Census | −.87 | Few large structures |
| Youth dependency Proportion of persons 16 years or younger as derived from 1970 U.S. Census data | .86 | Many youngsters |
| Labor force Proportion of those over 16 years in the labor force as determined by the 1970 U.S. Census | .58 | More in labor force |
| Triplexes Proportion of housing structures classed as triplexes by the 1970 U.S. Census | −.50 | Few triplexes |
Percentage of communality (h2) exhausted by Factor II: 22%
Alpha reliability of seven defining items of Factor II: .96
Intercorrelations between factor scores of five factors with scores based on the simple sum of defining items: II/I .22, II/III .26, II/IV −.41, II/V −.37
APPENDIX C. Factor III. Socioeconomic Status
Synonyms: Income and education, status potential
| Defining Items | Factor Coefficient | Factor Score Interpretation (High scores indicative of) |
|---|---|---|
| Income Mean income as determined by the 1970 U.S. Census | .90 | Higher income |
| Managerial or professional Proportion holding managerial or professional positions as determined by the 1970 U.S. Census | .85 | More management or professionals |
| Education Median years of schooling as determined by the 1970 U.S. Census | .81 | More education |
| Poverty Proportion of families with incomes below the defined poverty level as determined by the 1970 U.S. Census | −.74 | Few below poverty |
| House value Median house value as determined by the 1970 U.S. Census | .74 | Higher house values |
| Rent Median rent paid as determined by the 1970 U.S. Census | .65 | Higher rents paid |
| Voters Percentage who voted of all those eligible to vote | .64 | Higher voter turnout |
| Employed Proportion of males in the labor force who are employed as determined by the 1970 U.S. Census | .58 | More employed |
Percentage of communality (h2) exhausted by Factor III: 15%
Alpha reliability of eight defining items of Factor III: .93
Intercorrelations between factor scores of five factors with scores based on the simple sum of defining items: III/I .46, III/II .26, III/IV −.34, III/V −.10
APPENDIX D. Factor IV. Criminal Activity
Synonyms: None
| Defining Items | Factor Coefficient | Factor Score Interpretation (High scores indicative of) |
|---|---|---|
| Robbery Robbery rate based on 1975 California criminal justice data and population figures | .92 | High rates of |
| Assault Assault rate…….as above……. | .88 | High rates of |
| Rape Rape rate…………as above……. | .79 | High rates of |
| Car theft Car theft rate….as above …… | .76 | High rates of |
| Murder Murder rate…….as above…… | .72 | High rates of |
| No plumbing Proportion of housing structures without plumbing as determined by the 1970 U.S. Census | .58 | No plumbing |
| Burglary Burglary rate….as above……. | .47 | High rates of |
| No work or study Proportion of males neither working nor in school as determined by the 1970 U.S. Census | .45 | Not occupied |
Percentage of communality (h2) exhausted by Factor IV: 11%
Alpha reliability of eight defining items of Factor IV: .90
Intercorrelations between factor scores of five factors with scores based on the simple sum of defining items: IV/I −.32, IV/II −.37, IV/III −.10, IV/V .07
APPENDIX E. Factor V. Nontraditional orientation
Synonyms: Radical, non-family, transient
| Defining Items | Factor Coefficient | Factor Score Interpretation (High scores indicative of) |
|---|---|---|
| Coast protection Proportion voting in favor of California Proposition 20 in the 1972 general election | .72 | For coastal authority to preserve |
| Marijuana Proportion voting in favor of California Proposition 19 in the 1972 general election | .71 | For legalizing marijuana |
| Group quarters Proportion of persons living in group quarters as determined by the 1970 U.S. Census | .65 | Living in groups |
| Boarding houses Proportion of persons living in boarding houses as determined by the 1970 U.S. Census | .60 | Living in boarding houses |
| Peace and Freedom Proportion of voters registered with Peace and Freedom Party | .50 | Registered Peace and Freedom |
| Child-bearing Proportion of females of child-bearing age as determined by the 1970 U.S. Census | .39 | Many young women |
| Unrelated persons Proportion of persons in household who are unrelated to the head of household as determined by the 1970 U.S. Census | .37 | Many unconventional households |
| Female labor force Proportion of women over 16 who are in the labor force as determined by the 1970 U.S. Census | .16 | More females in labor force |
Percentage of communality (h2) exhausted by Factor V: 7%
Alpha reliability of eight defining items of Factor V: .82
Intercorrelations between factor scores of five factors with scores based on the simple sum of defining items: V/I −.27, V/II −.37, V/III −.10, V/IV .07
Footnotes
Here the five-dimensional space was partitioned into scores defined in terms of standard deviation units. Each dimension was divided into three parts: > +1 SD, < −1 SD, and between + and −1 SD. The result is three possible sectors. The criterion used to designate a sector as a core type was that it contain at least 2% of the neighborhoods. Distance scores were used to assign profiles to their nearest core type.
REFERENCES
- Apte Roben Z. 1968. Halfway Houses: A New Dilemma in Institutional Care Occasional Papen on Social Administration, No. 27. London: G. Bell. [Google Scholar]
- Bord R 1971. “Rejection of the mentally ill: Continuities and further developments.” Social Problems l8:496–509. [Google Scholar]
- Clark AW, and Binks NM 1966. “Relation of age and education to attitudes toward mental illness.” Psychological Reports 19:649–50. [DOI] [PubMed] [Google Scholar]
- Dohrenwend BP, and Chin-Shong E 1967. “Social status and attitudes toward psychological disorder: The problem of tolerance of deviance.” American Sociological Review 32:417–33. [PubMed] [Google Scholar]
- Gaylin W 1973. “What’s normal?” New York Times, magazine section, April 1, p. 4. [Google Scholar]
- Glasscote Raymond M., Gudeman Jon E., and Elpers Richard 1971. Halfway Houses for the Mentally Ill. Washinaton, D.C.: Joint Information Service. [Google Scholar]
- Hall GB, Dear M, and Taylor SM 1979. “Spatial and social class bias in attitudes toward the mentally ill” Paper presented at the Third Canadian Regional Science Association meetings, University of Victoria, Victoria, B.C. [Google Scholar]
- Langner T 1962. “A twenty-two item screening score of psychiatric: symptoms indicating impairment.” Journal of Health and Human Behavior 3:269–75. [PubMed] [Google Scholar]
- Lemkau P, and Crocetti G 1962. “An urban population’s opinion and knowledge about mental illness.” American Journal of Psychiatry 118:692–700. [Google Scholar]
- Linsky A 1970. “Who shall be excluded: The influence of personal attitudes in community reaction to the mentally ill.” Social Psychiatry .5:166–71. [Google Scholar]
- MacLean U 1969. “Community attitudes toward mental illness in Edinburgh.” British Journal of Preventive and Social Medicine 23:45–52. [DOI] [PMC free article] [PubMed] [Google Scholar]
- Morrissey James R. 1967. The Case for Family Care of the Mentally Ill Community Mental Health Journal Monograph No. 2. New York: Behavioral Publications. [Google Scholar]
- Overall J, and Gorham D 1962. “The brief psychiatric rating scale.” Psychological Reports 10:799–812. [Google Scholar]
- Phillips DL 1964. “Rejection of the mentally ill: The influence of behavior and sex.” American Sociological Review 29:679–87. [Google Scholar]
- Piasecki J 1975. “Community response to residential services for the psycho-socially disabled: Preliminary results of a national survey.” Paper presented at the First Annual Conference of the International Association of Psychosocial Rehabilitation Services. [Google Scholar]
- Rabkin J 1974. “Public attitudes toward mental illness.” Schizophrenia Bulletin 10:9–32. [DOI] [PubMed] [Google Scholar]
- Raush Harold L., and Raush Charlotte L. 1968. The Halfway House Movement: A Search for Sanity. New York: Appleton-Crofts. [Google Scholar]
- Segal Steven P., and Aviram Uri 1977. The Mentally Ill in Community-Based Sheltered-Care: A Technical Supplement on Study Methodology, 1972–1977. Berkeley, Calif.: University of California, School of Social Welfare. [Google Scholar]
- 1978. The Mentally Ill in Community-Based Sheltered-Care. New York: Wiley. [Google Scholar]
- Segal SP, and Baumohl J 1980. “Engaging the disengaged: Recommendations on madness and vagrancy.” Social Work 25 (in press). [DOI] [PMC free article] [PubMed] [Google Scholar]
- Smith CJ 1976. “Residential neighborhoods as humane environments.” Environment and Planning A 8:311–26. [Google Scholar]
- Trute B, and Segal SP 1976. “Census tract predictors and the social integration of sheltered-care residents.” Social Psychiatry 11:153–61. [Google Scholar]
- Tryon Roben C., and Bailey Daniel E. 1970. Cluster Analysis. New York: McGraw-Hill. [Google Scholar]
- Yamamoto K, and Dizney HG 1967. “Rejection of the mentally ill: A study of attitudes of student teachers.” Journal of Counseling Psychology 14:264–68. [Google Scholar]