

Abstract
Background-
Sugar-sweetened beverage (SSB) taxes are a rapidly growing policy tool and can be based on absolute volume, sugar content tiers, or absolute sugar content. Yet, their comparative health and economic impacts have not been quantified, in particular tiered or sugar content taxes that provide industry incentives for sugar reduction.
Methods-
We estimated incremental changes in diabetes and cardiovascular disease (CVD), quality-adjusted life-years (QALYs), costs, and cost-effectiveness of three SSB tax designs in the United States, based on (1) volume ($0.01/oz.), (2) tiers (<5 g of added sugar/8 oz.: no tax; 5–20 g/8 oz.: $0.01/oz.; and >20 g/8 oz.: $0.02/oz.), and (3) absolute sugar content ($0.01/tsp added sugar), each compared to a base case of modest ongoing voluntary industry reformulation. A validated microsimulation model, CVD-PREDICT, incorporated national demographic and dietary data from NHANES; policy effects and SSB-related diseases from meta-analyses; and industry reformulation and health-related costs from established sources.
Results-
Over a lifetime, the volume, tiered, and absolute sugar content taxes would generate $80.4 billion, $142 billion, and $41.7 billion in tax revenue, respectively. From a healthcare perspective, the volume tax would prevent 850,000 CVD (95% CIs: 836,000–864,000) and 269,000 diabetes (265,000–274,000) cases, gain 2.44 million QALYs (2.40–2.48), and save $53.2 billion net costs (52.3–54.1). Health gains and savings were approximately doubled for the tiered and absolute sugar content taxes. Results were robust across for societal and government perspectives, at 10 years follow-up, and with lower (50%) tax pass-through. Health gains were largest in young adults, Blacks and Hispanics, and lower income Americans.
Conclusions-
All SSB tax designs would generate substantial health gains and savings; tiered and absolute sugar content taxes should be considered and evaluated for maximal potential gains.
Keywords: sugar sweetened beverages, taxation, cardiovascular disease, diabetes, cost-effectiveness, prevention, policy
INTRODUCTION
Intake of sugar-sweetened beverage (SSBs) increases weight gain and is strongly linked to type 2 diabetes and cardiovascular disease (CVD).1 Despite some recent declines,2 SSBs remain the largest source of added sugar intake in the United States, with about 60% of children and half of adults consuming SSBs every day.3 In the United States, 52,000 annual cardiometabolic deaths are attributed to SSBs,4 highlighting the need for cost-effective approaches to reduce consumption and improve health outcomes.
SSB taxes are a major policy tool to reduce consumption, and are now being rapidly implemented across U.S. localities and globally. In all 7 US localities as well as Mexico, Belgium, Brunei, Norway, and the Philippines, all such taxes have been based on volume – e.g., a penny per oz. tax on SSBs ($0.01/oz.).5 While volume taxes reduce consumer consumption by increasing product cost,6, 7 this tax design provides little industry incentive to reformulate products to partially reduce added sugar, as tax rates are the same whether a beverage contains 5 g or 25 g of added sugar per oz. To encourage industry reformulation as well as reduced consumer consumption, additional SSB tax designs have been implemented, including tiered taxes in the United Kingdom, Chile, France, Ireland, Portugal, and Catalonia, Spain (with differing volume tax levels per tier of sugar content, in g per oz.); and absolute sugar content taxes in South Africa, Sri Lanka, and Mauritius (with taxes per absolute g of sugar content). These tax designs have been proposed in the United States by major advocacy organizations like the American Heart Association8 and introduced as bills in Congress in the past year (i.e., the Sugar-Sweetened Beverages Tax (SWEET) Act9). However, the potential differing health and economic impacts of these tax designs including volume, tiered, and absolute sugar content taxes have not been quantified, making it difficult to compare and prioritize the optimal tax design for implementation and evaluation.
To address these critical health policy gaps in knowledge, the aim of this research was to estimate and compare the potential cardiometabolic health and economic impacts of volume, tiered, and absolute sugar content SSB taxes in the United States using a validated microsimulation model. This investigation was performed as a part of the Food Policy Review and Intervention Cost-Effectiveness (Food-PRICE) Project (www.food-price.org).
METHODS
Study Overview and Population
We utilized the validated CVD-PREDICT microsimulation model,10 incorporating nationally representative data on US adults aged 35–80 years at baseline across three National Health and Nutrition Examination Survey cycles (NHANES 2009–2014) to derive baseline sociodemographics, cardiometabolic risk factors, and lifestyle habits and the data are publicly available.11 Intake of SSBs including their added sugar contents for each individual was derived from two 24-hour dietary recalls per person and we used two-day means for SSB intake and their added sugar contents. SSBs were defined as soft drinks/sodas, juice drinks, sports drinks, presweetened iced tea or coffee, and electrolyte replacement drinks with ≥5 grams of added sugar per 12 oz. (≥20 kcal per 12 oz.) based on current definitions for SSB taxes in US localities12 (for details of included and excluded beverages, see Table I in the Data Supplement). Incorporating NHANES survey weights to account for the complex survey design and sampling,13 we sampled from NHANES with replacement to create a study population of 1,000,000 individuals from the three most recent cycles of NHANES data (NHANES 2009–2014) that include about 10,000 respondents (n=10,338) with two 24-hour dietary recalls, who were followed until death or age 100, whichever came first. At each stage of the logic pathway (Figure I in the Data Supplement), the best available model inputs, sources, assumptions, and their associated uncertainties incorporated were used to estimate the potential health and economic impacts of varying SSB taxes in the United States as described in more detail below (Table 1, Table II in the Data Supplement). We followed the Consolidated Health Economic Evaluation Reporting Standards (CHEERS) checklist in reporting our results, as recommended for economic evaluations of health interventions (Text I in the Data Supplement). The source code of the model is not publicly available. The modelling investigation was exempt from institutional review board review because it was based on public data and nationally representative, deidentified data sets that included no personally identifiable information.
Table 1.
Key model inputs and sources for cost-effectiveness analysis of volume, tiered, and absolute sugar content sugar-sweetened beverage taxes in US adults using the CVD-PREDICT model*
| Model inputs | Value | Source |
|---|---|---|
| Baseline characteristics† | ||
| Baseline demographics | Table VI | NHANES 2009–1411 |
| Baseline CVD risk factors | ||
| Baseline prevalent cardiometabolic diseases | ||
| Baseline SSB intakes | ||
| Baseline added sugar intakes from SSBs | ||
| Policy effects‡ | Table III | Afshin 201714 |
| Price elasticity for intake of SSB per 1% increase in price, % | 0.67 (0.31–1.04) | |
| Added sugar-disease etiologic effects§ | Table IV | Micha 20174 |
| BMI (baseline BMI<25 kg/m2), per gram of sugar | 0.005 (0.002, 0.007) | |
| BMI (baseline BMI≥25 kg/m2), per gram of sugar | 0.011 (0.007, 0.015) | |
| BMI mediated CHD, per 5 kg/m2 increase in BMI | 1.35 (1.29, 1.41) | |
| BMI mediated stroke, per 5 kg/m2 increase in BMI | 1.19 (1.13, 1.26) | |
| BMI mediated diabetes, per 5 kg/m2 increase in BMI | 2.66 (2.15, 3.30) | |
| CHD, BMI independent, per gram of sugar | 1.011 (1.007, 1.015) | |
| Diabetes, BMI independent, per gram of sugar | 1.011 (1.005, 1.018) | |
| Policy costs‖ | Text III | |
| Policy implementation costs, % of tax revenue | 2 | MUNI15 |
| Government tax collection costs | 1 | |
| Industry compliance costs | 1 | |
| Industry reformulation costs, $ billion | RTI16 | |
| Volume tax | 0.29 (0.29–0.30) | |
| Tiered tax | 0.72 (0.72–0.74) | |
| Sugar content tax | 1.44 (1.42–1.46) | |
| Health-related costs¶ | Table V | |
| Formal healthcare costs | ||
| CVD costs | ||
| Chronic disease states, per year | $2,276 – $3,516 | Lee 201017, Pignone 200618 |
| Acute disease states, per year | $20,741 – $59,460 | O’Sullivan 201119 |
| Procedures and repeat events | $20,741 – $59,460 | O’Sullivan 201119 |
| Screening | $1 – $81 | Pletcher 200920, Lazar 201121 |
| Medications, per year | $8 – $286 | Redbook 201022, Nuckols 201123, Pignone 200618, Shah 201124 |
| Statin-associated adverse events | $189 – $7,431 | Lee 201017 |
| Diabetes costs | ADA 201325, Zhuo 201326 |
|
| Institutional care, per year | $1 – $2,547 | |
| Outpatient care, per year | $7 – $511 | |
| Medications and supplies, per year | $36 – $ 1,065 | |
| Informal care costs | ||
| Time per outpatient visit, per min | Russell 200827 | |
| Travel | 35 | |
| Waiting | 42 | |
| Wage for adults aged >45 y, per hour | $15.50 | Bureau of Labor Statistics 201628 |
| Productivity costs, dollars | Kim 201629 | |
| Labor force participation rates as full-time workers by age group | 0.076 – 0.845 | |
| Average annual earnings by age group, per year | $39,525 – $56,509 |
All costs inflated to constant 2018 dollars using the Bureau of Labor Statistics’ Consumer Price Index.30
Details are presented in Table VI in the Data Supplement.
Details are presented in Table III in the Data Supplement.
Details are presented in Table IV in the Data Supplement. The association of change in BMI with change in SSB consumption was assessed using multivariate linear regression. Separate linear relationships were estimated for BMI <25kg/m2 and BMI ≥25kg/m2 since the rate of increase in BMI due to SSB intake varies based on an individual’s baseline BMI. Values represent RRs for increased consumption of added sugar and cardiometabolic disease risk at age 50 (45–54 years). RRs for other age groups are presented in Table IV in the Data Supplement.
Details are presented in Text III in the Data Supplement.
Details are presented in Table V in the Data Supplement.
CVD, cardiovascular disease; NHANES, National Health and Nutrition Examination Survey; SSB, sugar-sweetened beverage; BMI, body mass index; CHD, coronary heart disease; RTI, Research Triangle Institute; ADA, American Diabetes Association
Policy Description and Scenarios
We modeled three SSB national excise tax scenarios, including based on (1) volume ($0.01/oz.), modeled after existing SSB taxes implemented in several U.S. localities (e.g., Berkeley, Oakland, San Francisco, Albany);12 (2) tiers [<5 g of added sugar/8 oz. (tier 1): no tax; 5–20 g/8 oz. (tier 2): $0.01/oz.; and >20 g/8 oz. (tier 3): $0.02/oz.], modeled after recently implemented taxes in other nations5 as well as the American Heart Association proposed SSB tax;8 and (3) absolute sugar content ($0.01/tsp of added sugar), modeled after recently implemented taxes in other nations5 as well as the recent Congressional Sugar-Sweetened Beverages Tax (SWEET) Act bill.9 Each of these scenarios was compared with a base-case of no additional U.S. SSB taxes, incorporating both consumer and industry responses as described below (Table III in the Data Supplement).
Policy Effects on SSB Intakes
The estimated effects of each SSB tax policy on consumer intakes were derived from a systematic review and meta-analysis of interventional and observational studies of changes in SSB price in relation to SSB consumption, which demonstrated that each 1% increase in price results in a 0.67% decrease in SSB intake (Table III in the Data Supplement).14 Consistent with these interventional studies as well as economic theory, we assumed the time lag between policy implementation and change in SSB intake was less than a year, with intervention effects sustained as long as taxes continued. We modeled a full (100%) pass through to consumers based on empirical evidence from Philadelphia’s SSB tax (pass-through rate 75–115%);31 we also evaluated lower (50%) pass through rate in sensitivity analyses.
Policy Effects on Industry Reformulation
The base-case scenario did not assume no reformulation, but conservatively incorporated a gradual underlying voluntary industry reformulation level (20% of SSB products being reformulated to reduce added sugar content by 25% over 10 years, resulting in overall 5% reduction in added sugars from SSBs) based on expert contacts, public pledges by major beverage companies,32 and observed reformulations33 (Table III in the Data Supplement). The potential industry responses to the tiered and absolute sugar content taxes, which each incentivize the lowering of sugar contents through lower tax rates, were derived from expert contacts and achieved recent significant reformulations of specific major beverage brands.33 For the tiered tax scenario, we assumed that, over 10 years, half of SSBs in the highest tax rate (tier 3) would be reformulated just to the top level of the next lowest tax rate (tier 2), and that half of SSBs in the middle tax tier (tier 2) would be reformulated to the top level of the lowest tier (no tax). For the sugar content tax, we assumed that SSBs would be variably reformulated to reduce overall sugar content, on average, by a total of 25% gradually over 10 years. We assumed that product reformulations would incrementally occur over the first 10 years of tax implementation, with no further reformulations thereafter.
Effects of SSB Intake Changes on Cardiometabolic Risk
Our methods for reviewing and synthesizing the evidence to estimate effect sizes for associations between SSB intake and cardiometabolic endpoints, including extensive validity analyses to assess potential bias, have been reported.4, 34 Briefly, etiologic effects were derived from meta-analyses of prospective cohorts or randomized controlled trials evaluating (1) effects of SSBs on weight gain; (2) effects of changes in BMI on risk of coronary heart disease (CHD), stroke, and type 2 diabetes; and (3) additional direct effects of SSB intake on CHD (adjusted for BMI and diabetes) and type 2 diabetes (adjusted for BMI) (Table IV in the Data Supplement). We did not formally model specific dietary complements or substitutes to SSBs because the risk estimates for SSBs, largely based on long-term prospective studies, implicitly incorporate the health effects of the average complements or substitutes in the population when people consume varying levels of SSBs. Because health effects of SSBs are due to added sugar content, we standardized all observed relative risks per serving (8 oz.) to the mean observed added sugar content (21.0 g) per 8 oz. of SSBs consumed in the U.S. from NHANES 2009–2014. This allowed differences in risk to be incorporated by both changes in intake (servings) and added sugar content (reformulation).
Microsimulation Model Structure and Outputs
CVD-PREDICT, a validated micro-simulation model coded in C++, simulates and quantifies effects of policies on CHD, stroke, and diabetes (Text II in the Data Supplement).35, 36 The model is run at the individual-level, incorporating the annual probability of each person’s transition between health states based on their underlying risk factors including age, sex, systolic blood pressure, total cholesterol, HDL-cholesterol, smoking, and diabetes. Diabetes is treated as 1) one of the risk factors for CVD in the model and 2) a health outcome in response to the SSB taxes. The probability of experiencing diabetes is influenced by the change in relative risks due to added sugar intake changes, which further influences the probability of developing CVD. The model did not estimate direct effects of diabetes on non-CVD deaths. Model parameters include validated CHD and stroke risk equations and case fatality risks based on a calibrated Framingham-based risk function as well as validated empiric historical disease trends.37 CVD risk factors and subsequent estimated CVD incidence and mortality, and diabetes incidence were extrapolated and the survival probability does vary with age and time trends in risk factors, derived from NHANES; systolic blood pressure and total cholesterol increase with age on the individual level and decrease with time based on national trends; HDL cholesterol and risk of developing diabetes increase with both age and time; and sex and smoking status remain unchanged. At any given time point, a simulated individual could be in one health state, with the probability of experiencing subsequent events based on individual cardiometabolic risk factors and changes in relative risks from SSB intake. The microsimulation process across each state and transitions are shown in Figure 1. Model outputs included total CVD events (fatal and non-fatal), CVD deaths, and diabetes cases at 10 years and cohort lifetime. The specific model outcomes included deaths from CHD or stroke; non-fatal events including myocardial infarction, stroke, angina, resuscitated cardiac arrest, and diabetes incidence; quality-adjusted life years (QALYs); and event-associated health-related costs. Outputs were estimated for the overall adult population, and stratified by age (35–44 years, >65 years), race/ethnicity (non-Hispanic white, non-Hispanic black, Hispanic, other), and income (poverty-income ratio (PIR) ≤1.85, PIR >1.85) to investigate consistency of health and economic impacts of each SSB tax scenario across subgroups. Children and young adults below age 35 years were not included in the model due to relatively low absolute rates of CVD and type 2 diabetes as well as insufficient established risk equations at these ages.
Figure 1. The CVD-PREDICT microsimulation model.
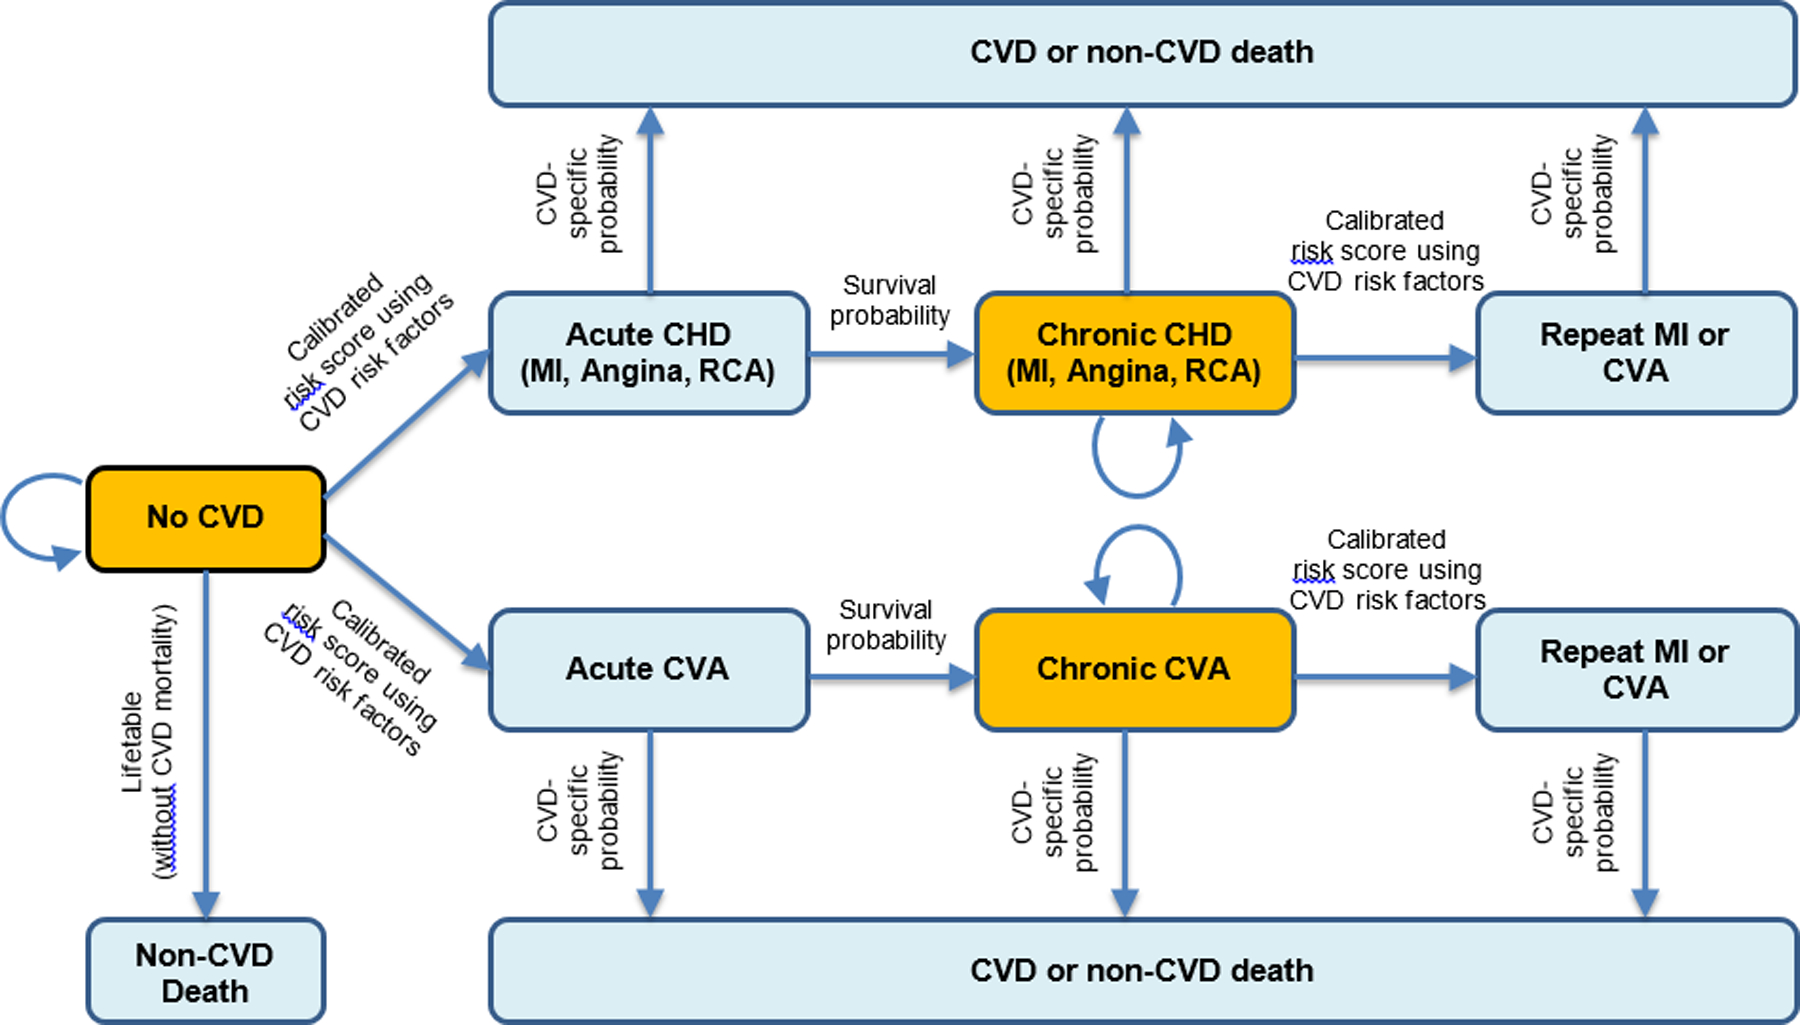
Transitions were based on a calibrated risk score including age, sex, systolic blood pressure, total cholesterol, HDL cholesterol, current smoking, and diabetes status. Baseline risk factors were derived from NHANES 2009–14, with further annual changes in all risk factors incorporating both age and secular trends. Decreased intake of added sugar from SSBs could decrease the probability of transitioning of no CVD to acute CVD, and chronic CVD to recurring CVD or CVD death. The model did not estimate direct effects of diabetes on non-CVD deaths. CVD, Cardiovascular Disease; CHD, Coronary Heart Disease; MI, Myocardial Infarction; RCA, Resuscitated Cardiac Arrest; CVA, Cerebrovascular Accident.
Policy and Health-Related Costs
SSB tax revenue was calculated from the average per-person post-tax intake of SSBs or added sugar from SSBs (depending on the tax design) times the tax rate and the total adult population aged 35+ years (tax revenues from SSB intake among children and young adults were conservatively excluded). Government tax revenues were excluded from healthcare and societal cost-effective perspectives, as these can be considered direct transfers between segments of society. Policy implementation costs included government tax collection and industry compliance costs, estimated at 2% of the generated tax revenue based on a U.S. locality experience15 (we considered that federal implementation costs could be even lower due to scale) (Text III in the Data Supplement). Industry costs to reformulate SSB products in response to each SSB tax were estimated using the Research Triangle Institute (RTI) reformulation model,16 accounting for the percentage of products reformulated, reformulation type, test types, and compliance period.
Health-related costs included formal healthcare, informal care, and productivity costs as previously described (Table V in the Data Supplement).38 Formal healthcare costs for CVD all acute and chronic disease states, surgical procedures, screening, medications and other treatments, and statin associated side effects; and for diabetes, costs for institutional care, outpatient care, outpatient medications, and supplies. Informal care costs included costs for patient’s travel and waiting time as derived from the Bureau of Labor Statistics.28 Productivity costs were calculated using age-specific average annual earnings derived from the Current Population Survey.39
Cost-Effectiveness Analyses
In accordance with recommendations from the Second Panel on Cost-Effectiveness in Health and Medicine,40 analyses were conducted from three perspectives: (1) healthcare perspective, conservatively including policy implementation costs and industry reformulation costs as the “intervention” cost, and formal healthcare costs, (2) government perspective, incorporating government tax collection costs, SSB tax revenue, and formal healthcare costs, and (3) societal perspective, incorporating policy implementation costs, industry reformulation costs, formal healthcare and informal care costs, and productivity costs. We also performed an incremental cost-effectiveness analysis from a healthcare perspective to compare all three policy scenarios to each other. All costs were inflated to 2018 US dollars using the Consumer Price Index,30 with costs and QALYs discounted at 3% annually. Incremental cost-effectiveness ratios (ICERs) were calculated as the net change in costs divided by the net change in QALYs.
Sensitivity and Uncertainty Analyses
Probabilistic sensitivity analyses using second-order Monte Carlo approach were used to incorporate the uncertainty in key model inputs, jointly incorporating the uncertainty distributions of multiple parameters including policy effect sizes, changes in added sugar intake from SSB linked weight gain, CHD, and type 2 diabetes relative risks, changes in BMI linked CHD and diabetes relative risks, individual CVD risk estimated the Framingham-based risk function, policy implementation costs, industry reformulation costs, formal healthcare costs, and utility weights (Table 1). One thousand simulations were run drawing from the uncertainty distributions of each of these inputs over a lifetime. Results are presented as the mean value, with 95% confidence intervals based on the 1,000 simulations. We also conducted deterministic sensitivity analyses to assess the potential impact of differential price elasticity by income (PIR ≤1.85 or >1.85), and a lower (50%) tax pass-through rate.
RESULTS
Population Characteristics and Policy Impacts on SSB Intakes
Among US adults aged 35–80 at baseline, the mean (SD) age was 55 (13) years, about half (53%) were female, about 7 in 10 (72%) were white, and about one-third (29%) were low-income (PIR ≤1.85) (Table VI in the Data Supplement). Mean BMI was 29.3 kg/m2, 16% were current smokers, and 36% were on hypertension treatment. Pre-tax, the baseline mean (SD) SSB intake was 1.0 (1.6) 8-oz servings/day, corresponding to a total added sugar intake from SSBs of 20.5 (32.3) g/day.
Accounting for the average retail price of SSBs in 2018 of $0.065/ounce,41 the average price of SSBs would be increased by 15.5% by the volume tax, 15.5% in tier 2 and 31.0% in tier 3 by the tiered tax, and 9.7% by the absolute sugar content tax. Considering consumer responses (servings/d of SSBs), these price increases would result in 10.4%, 18.7%, and 6.5% reductions in SSB or added sugar intake (depending on the tax design), respectively. In addition, both the tiered and absolute sugar content tax would lead to gradual additional industry reformulation over 10 years. These industry responses would result in 8.8% and 25% average decreases in added sugar content of SSBs at 10 years, respectively. Accounting for both consumer and industry responses, the volume tax would decrease overall SSB servings in US adults by 0.10 serving/day and corresponding overall added sugar intake by 3.06 g/day; the tiered tax, by 0.19 servings/day and 5.42 g/day; and the absolute sugar content tax, by 0.07 servings/day and 6.16 g/day (Table VII in the Data Supplement).
Health Outcomes
Over a lifetime (mean simulated follow-up 28.7 years), compared with a base-case scenario, the volume tax was estimated to prevent 850,000 fatal and nonfatal (total) CVD events (95% CIs: 836,000–864,000) and 269,000 diabetes cases (265,000–274,000), generating 2.44 million QALYs (2.40–2.48) (Table 2). Corresponding health gains for the tiered tax were 1,673,000 total CVD events (1,650,000–1,696,000), 531,000 diabetes cases (524,000–539,000), and 4.85 million QALYs (4.78–4.92); and for the absolute sugar content tax, 1,852,000 (1,831,000–1,874,000) total CVD events, 550,000 (544,000–557,000) diabetes cases, and 5.02 million (4.96–5.09) QALYs (Figure 2). At 10 years (2019–2028), the volume, tiered, and absolute sugar content taxes would be estimated to prevent 238,000, 460,000, and 369,000 total CVD events, and 111,000, 218,000, and 163,000 diabetes cases, respectively (Table VIII in the Data Supplement).
Table 2.
Lifetime health gains, costs and cost-effectiveness of a nationwide volume, tiered and sugar content sugar-sweetened beverage taxes among US adults from a healthcare perspective.*
| Mean Estimate (95% CIs) | |||
|---|---|---|---|
| Volume SSB tax† | Tiered SSB tax‡ | Absolute sugar content SSB tax§ | |
| Tax rate, $ | 0.01/oz. | No tax (Tier 1) | 0.01/tsp (4.2g) of added sugar |
| 0.01/oz. (Tier 2) | |||
| 0.02/oz. (Tier 3) | |||
| Population, million | 160 | 160 | 160 |
| Simulated follow-up years per person | 28.70 | 28.73 | 28.73 |
| Tax revenue, $ billion‖ | 80.4 (80.2, 80.5) | 142 (141, 143) | 41.7 (41.6, 41.8) |
| Cases averted, thousand | |||
| CVD events | 850 (836, 864) | 1,673 (1,650, 1,696) | 1,852 (1,831, 1,874) |
| CVD deaths | 166 (163, 169) | 330 (326, 335) | 371 (367, 376) |
| Diabetes cases | 269 (265, 274) | 531 (524, 539) | 550 (544, 557) |
| QALYs gained, million¶ | 2.44 (2.40, 2.48) | 4.85 (4.78, 4.92) | 5.02 (4.96, 5.09) |
| Change in policy costs, $ billion | |||
| Policy implementation costs# | 1.60 (1.58, 1.62) | 1.60 (1.58, 1.62) | 1.60 (1.58, 1.62) |
| Government tax collection costs | 0.80 (0.79, 0.81) | 0.80 (0.79, 0.81) | 0.80 (0.79, 0.81) |
| Industry compliance costs | 0.80 (0.79, 0.81) | 0.80 (0.79, 0.81) | 0.80 (0.79, 0.81) |
| Industry reformulation costs** | 0.00 | 0.43 (0.43, 0.44) | 1.15 (1.13, 1.16) |
| Change in health-related costs, $ billion | |||
| Formal healthcare costs†† | −54.8 (−55.7, −53.9) | −107 (−108, −105) | −107 (−109, −106) |
| Net costs, $ billion‡‡ | −53.2 (−54.1, −52.3) | −105 (−106, −103) | −105 (−106, −103) |
| ICER, $/QALY | |||
| Healthcare perspective | Cost saving | Cost saving | Cost saving |
Health outcomes were evaluated among US adults aged 35–80 years at baseline (n=160 million), who were followed until death or age 100, whichever came first. All costs were inflated to 2018 dollars. Health and economic outcomes for all tax designs were compared to a base-case scenario (no SSB tax), which included assumptions of continuing trends in voluntary industry reformulation, with 20% of SSB products reducing sugar content by an average of 25% over 10 years. All taxes utilized a price elasticity (0.67% decrease in intake in SSBs in response to each 1% increase in price).
The volume tax assumed no additional industry reformulation beyond the base case, as the tax rate would remain unchanged even with reformulation to reduce sugar content.
The SSB tiered tax included no tax in Tier 1 (<5 g of added sugar per 8 oz.), 1 cent per 1 oz. in Tier 2 (5–20 g of added sugar per 8 oz.), and 2 cents per 1 oz. in Tier 3 (>20 g of added sugar per 8 oz.). The industry response to reformulate SSBs to reduce sugar content in response to the tiered tax was assumed as, over 10 years, 50% of SSBs in Tier 3 would be reformulated to reach to Tier 2, 50% of SSBs in Tier 2 would be reformulated to reach to Tier 1, and no reformulation would occur in Tier 1.
For the absolute sugar content tax, the industry response to reformulate SSBs to reduce sugar content was assumed as, over 10 years, added sugar content in all SSBs would be reduced by 25%.
The tax revenue was calculated from the total intake of SSBs, following expected consumer responses and industry reformulations, multiplied by the tax rate.
Quality-adjusted life years (QALYs) were discounted at 3% annually.
Implementation costs included (a) government tax collection costs and (b) industry tax compliance costs, assumed to be 2% of SSB tax revenue, derived from a report from MUNI Services,15 a private firm contracted by the city of Berkeley to collect SSB tax. We assumed that the implementation costs would not differ by tax schemes.
Industry reformulation costs were estimated using the Research Triangle Institute (RTI) reformulation model,16 accounting for % of products reformulated, reformulation type, test types, and compliance period. Total reformulation costs are the same at 10 years and lifetime because all models assumed no further reformulation after 10 years.
Formal healthcare costs were calculated from the change in total healthcare costs associated with CVD events including chronic/acute disease states, surgical procedures, screening costs, and drug costs; with diabetes cases including institutional care, outpatient care, outpatient medications and supplies, discounted at 3% annually. A negative sign indicates healthcare savings.
Net costs from a healthcare perspective equaled tax implementation costs (government tax collection and industry compliance costs) plus industry reformulation costs minus formal healthcare costs, discounted at 3% annually. A negative sign indicates positive monetary savings.
SSB, Sugar-Sweetened Beverage; CVD, Cardiovascular Disease; QALY, Quality-Adjusted Life-Year; ICER, incremental cost-effectiveness ratio.
Figure 2. Estimated reductions in total CVD events (Panel A) and diabetes cases (Panel B), gains in quality-adjusted life years (QALYs) (Panel C), healthcare savings (Panel D), net savings (Panel E), and tax revenue (Panel F) of volume, tiered, and absolute sugar content sugar sweetened beverage taxes over 10 years and lifetime.
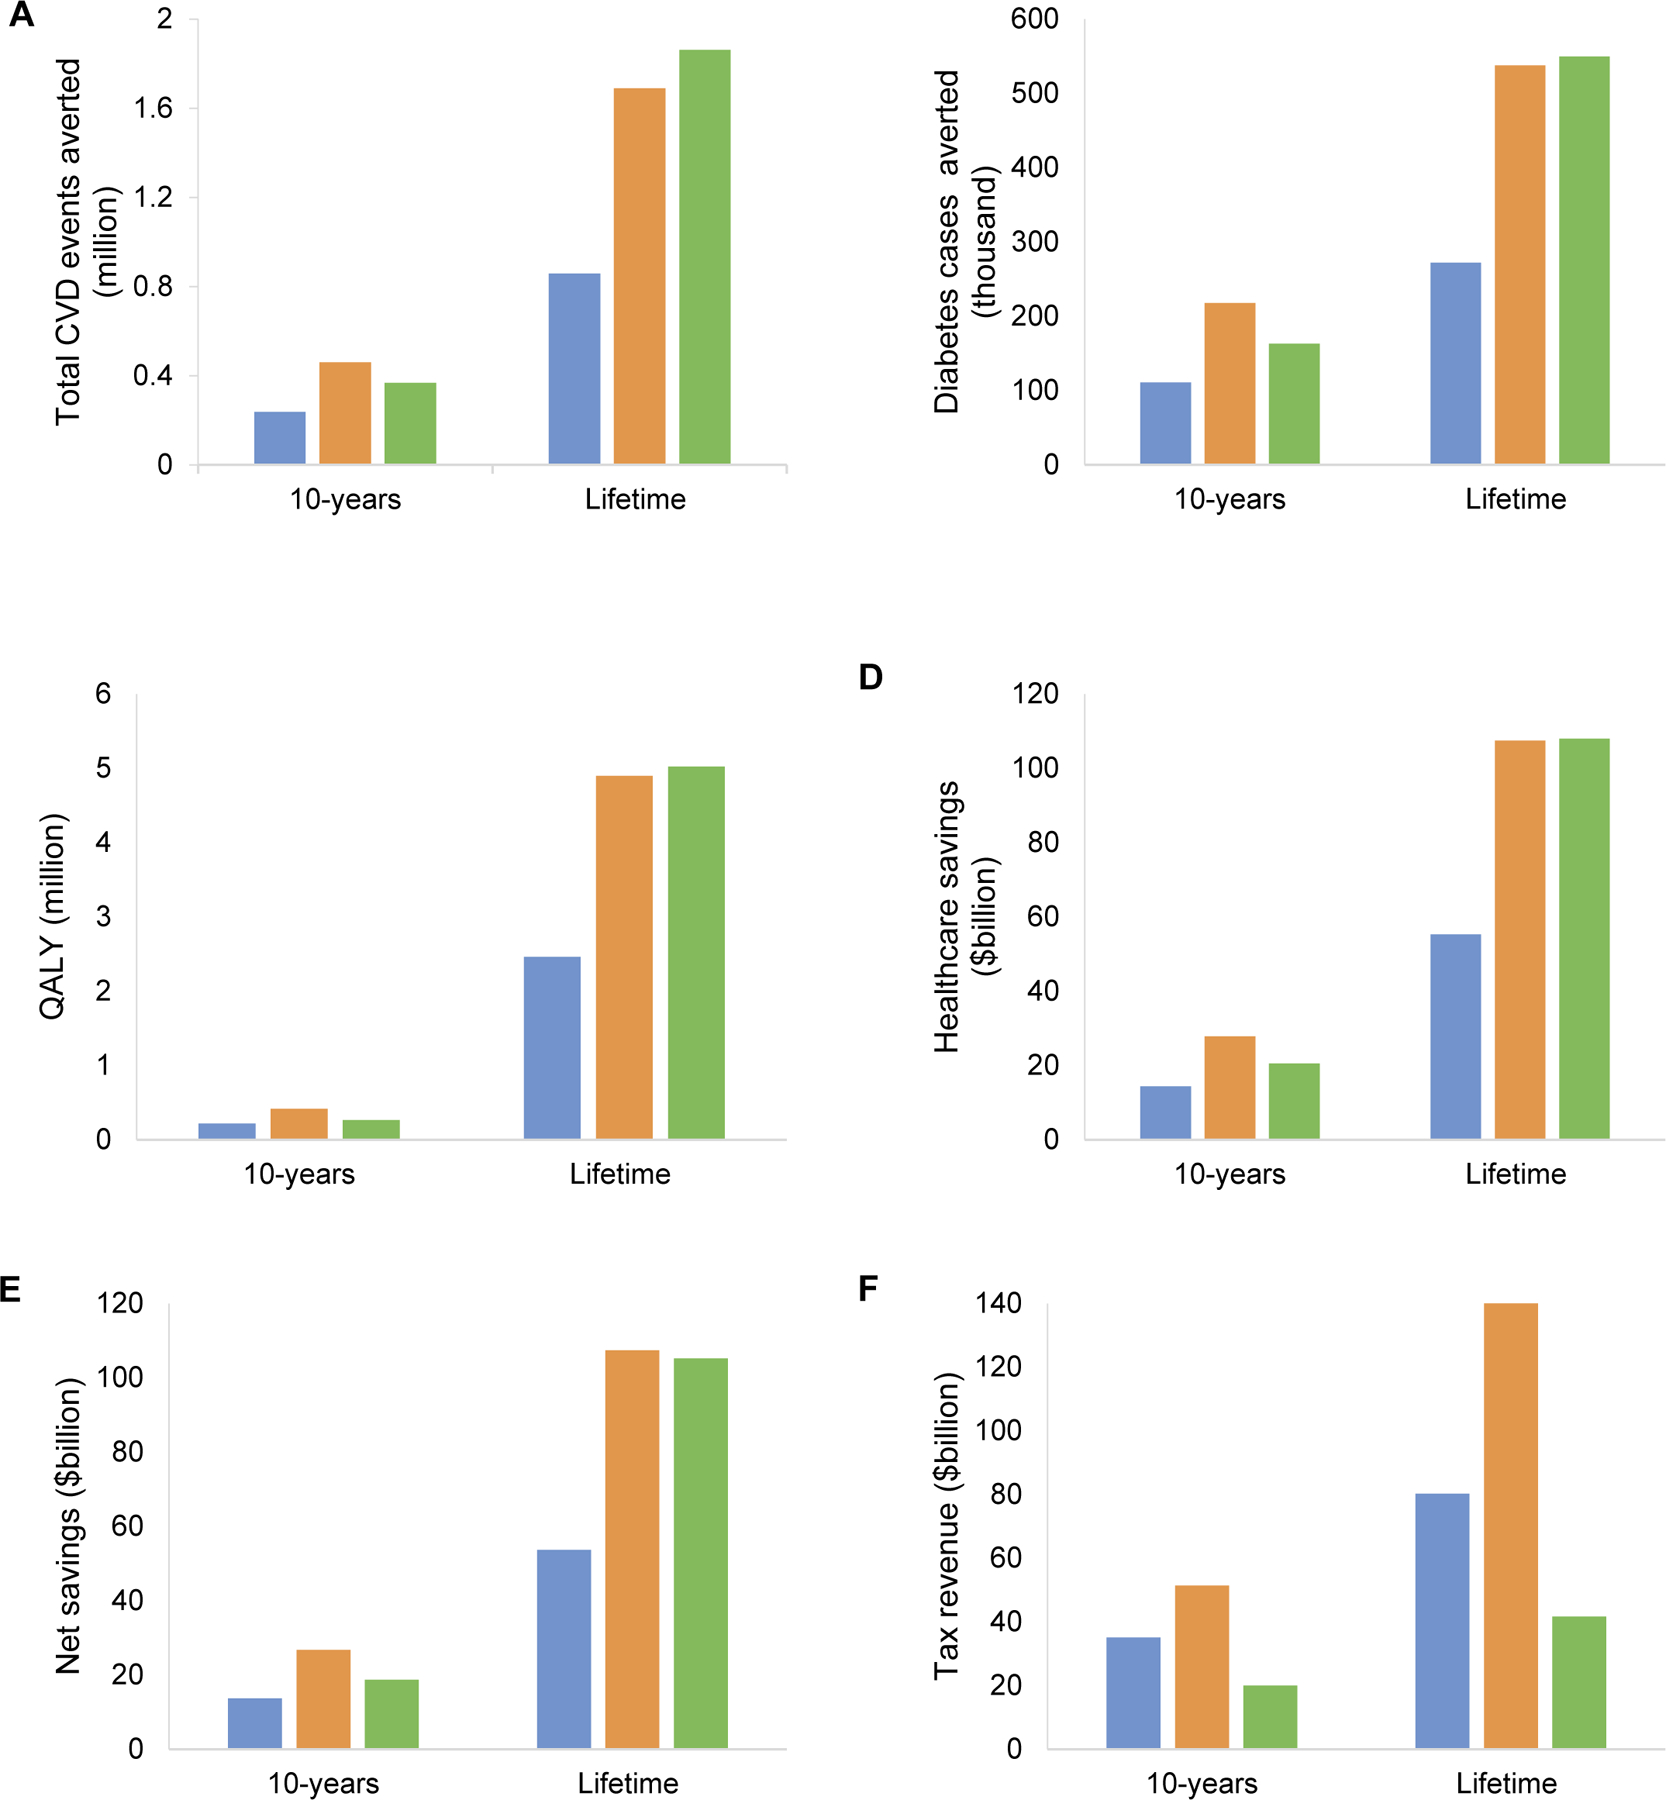
Values for net savings were from a healthcare perspective. The blue bar represents the volume tax; the dark yellow bar represents the tiered tax; and the green bar represents the absolute sugar content tax. CVD, cardiovascular disease; QALY, quality-adjusted life year.
Costs and Cost-Effectiveness
Over a lifetime, the volume, tiered, and absolute sugar content taxes would produce $1.60 billion (1.58–1.62) in policy implementation costs; $80.4 billion (80.2–80.5), $142 billion (141–143), and $41.7 billion (41.6–41.8) in government tax revenue; and $0.29 billion (0.29–0.30), $0.72 billion (0.72–0.74), and $1.44 billion (1.42–1.46) in industry reformulation costs, respectively (Table 2). From a healthcare perspective (excluding tax revenues, informal care, and productivity costs), all three SSB tax scenarios were cost-saving (dominant). The volume tax was estimated to generate net cost savings of $53.2 billion (52.3–54.1); the tiered tax, $105 billion (103–106); and the absolute sugar content tax, $105 billion (103–106). Net cost savings were larger from a societal perspective, incorporating additional informal care and productivity costs, with savings of $70.9 billion for the volume tax, $141.5 billion for the tiered tax, and $140.7 billion for the absolute sugar content tax. Incorporating tax revenues but not industry compliance and reformulation costs, savings from reduced informal care, or gained productivity, net savings from a government perspective were $133.9 billion for the volume tax, $249.4 billion for the tiered tax, and $150.0 billion for the absolute sugar content tax (Table IX in the Data Supplement). When comparing each tax scenario to the other two options, both the tiered and absolute sugar content taxes were dominant strategies compared to the volume tax: i.e., each resulted in significantly greater health gains at significantly less cost (Table 3). Comparing the sugar content tax to the tiered tax, the differences in cost and QALYs were very small, with very similar probabilities of cost-effectiveness.
Table 3.
Incremental cost-effectiveness of a national volume, tiered, and absolute sugar content sugar-sweetened beverage taxes among US adults over a lifetime from a healthcare perspective.
| Mean Estimate (95% CIs) | |||
|---|---|---|---|
| Difference in cost, $ billion* | Difference in QALY, million | Probability of being more cost-effective† | |
| Strategy comparison | |||
| Volume SSB tax compared to base-case | −51.4 (−53.2, −49.6) | 2.41 (2.32, 2.49) | 100% |
| Tiered compared to volume SSB tax | −51.5 (−53.1, −50.0) | 2.58 (2.51, 2.66) | 96.1% |
| Absolute sugar content compared to tiered SSB tax | −0.10 (−2.00, 1.80) | 0.18 (0.09, 0.27) | 51.7% |
Cost was calculated as the sum of healthcare costs, policy implementation costs, and industry reformulation costs.
For a given threshold ($50,000/QALY), the proportion of the policy scenario would be considered more cost-effective.
QALY, Quality-Adjusted Life-Year; SSB, Sugar-Sweetened Beverage.
Demographic Subgroups
Health gains were evident in all population subgroups by age, race, and income (Table X in the Data Supplement). Gains per million individuals were largest among younger adults, Blacks and Hispanics, and lower-income Americans (Table XI in the Data Supplement). For example, the volume tax was estimated to prevent 7,486 CVD events per 1 million black adults, vs. 4,568 CVD events per 1 million white adults. Cost-effectiveness findings were also robust within subgroups. Consistent with the main findings, the net cost savings were larger from the societal and government perspectives.
Uncertainty and Sensitivity Analyses
Over a lifetime, all three SSB tax scenarios had 100% probability of being cost saving (1,000 of 1,000 simulations) (Figure 3). Results were consistent incorporating potential differential price elasticity to changes in SSB price by household income (Table XII in the Data Supplement) and for 50% pass-through (Table XIII in the Data Supplement).
Figure 3. Cost-effectiveness plane for volume, tiered, and absolute sugar content sugar-sweetened beverage taxes over a lifetime.
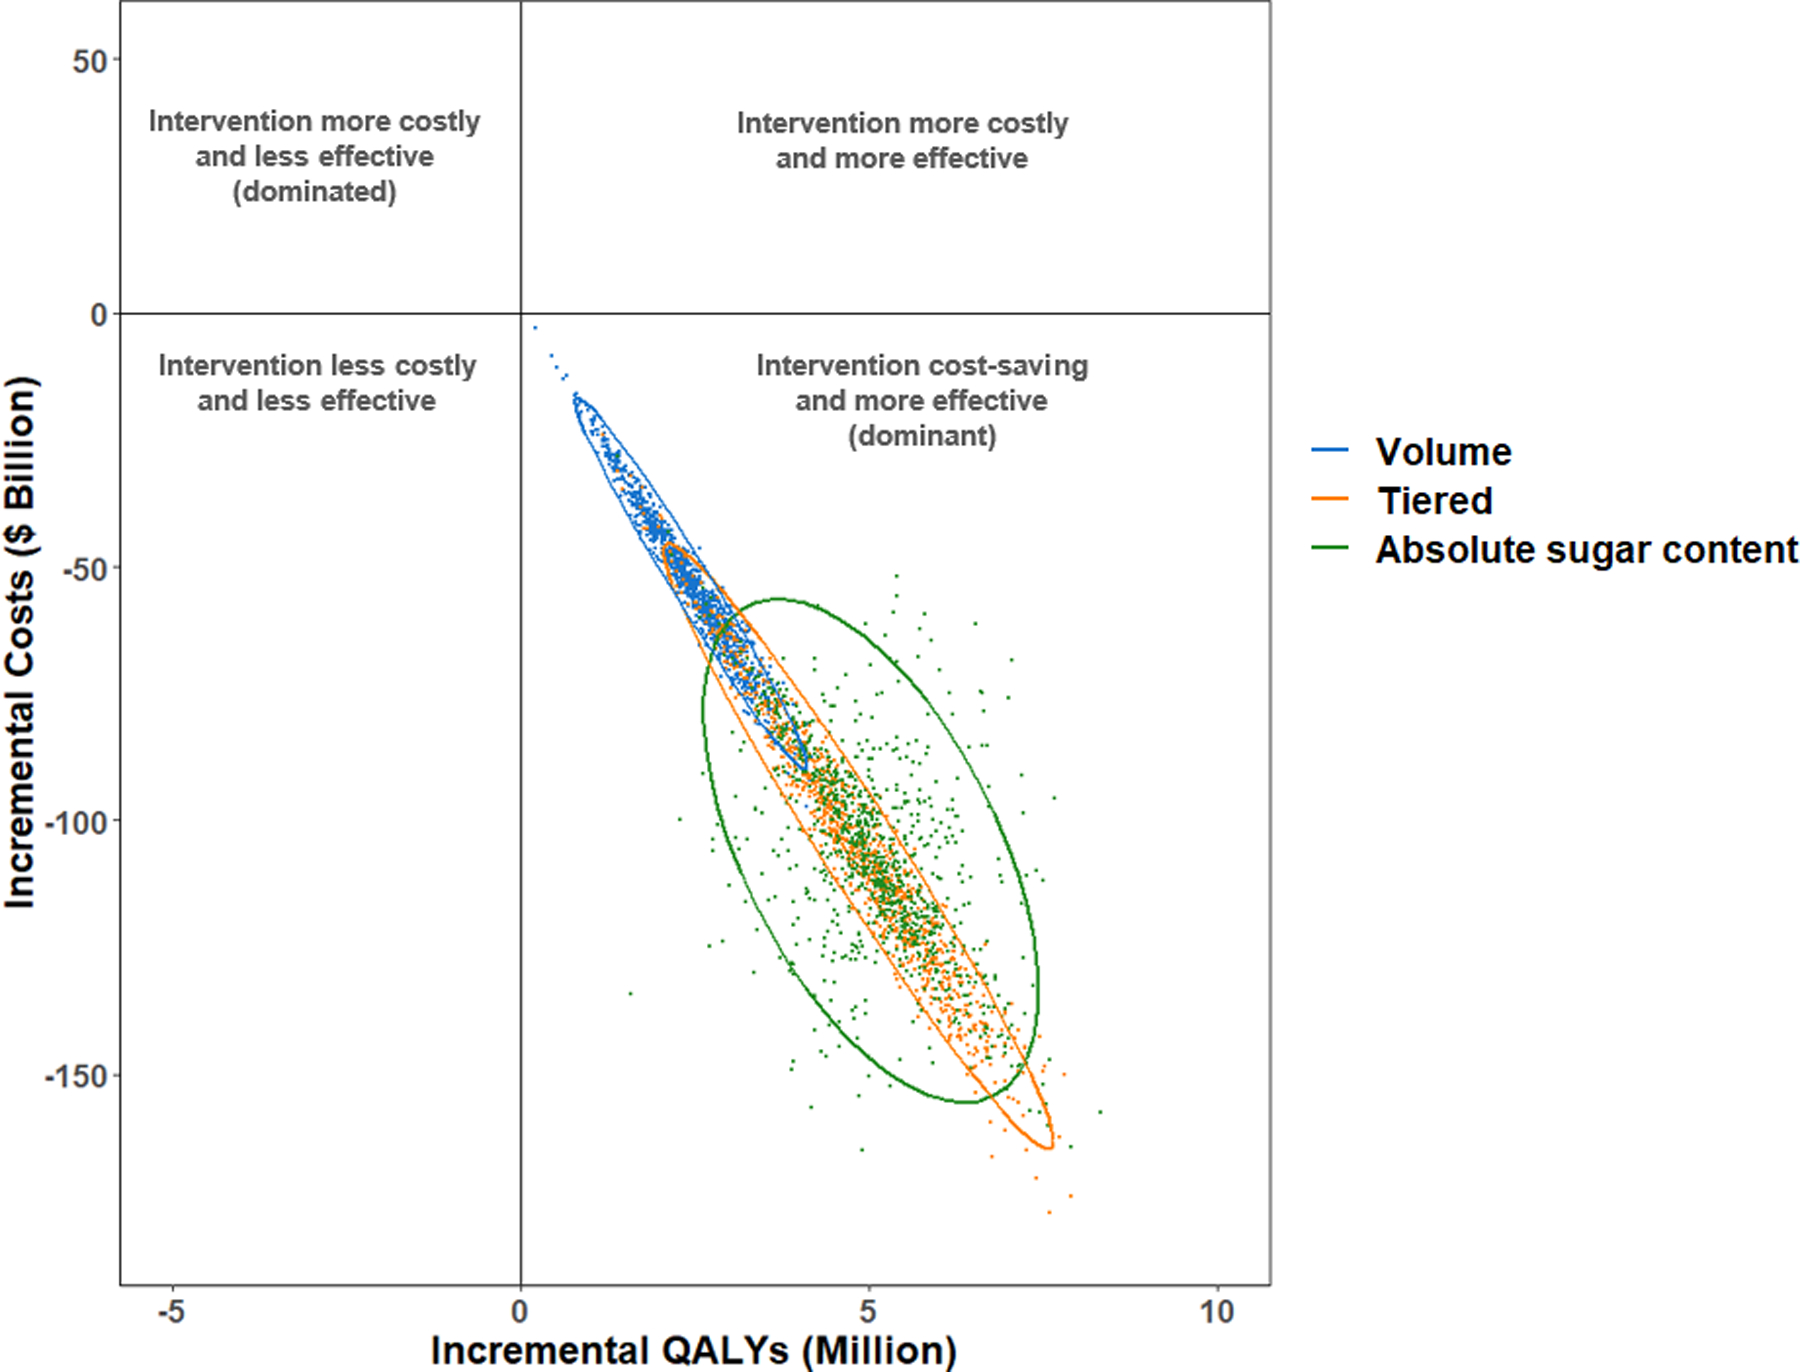
Values are presented from a healthcare perspective in incremental costs ($ billion) versus incremental quality-adjusted life years (QALYs), compared to a base scenario of no SSB tax. Each colored dot is the result of each of 1,000 Monte Carlo iterations, and the ellipse depicts the 95% uncertainty intervals. Results are presented. Interventions that fall into the lower right quadrant of the cost-effective plane indicate that the interventions would be cost saving and improve health outcomes.
DISCUSSION
Based on a validated microsimulation model incorporating nationally representative data, our modeling study estimates that national volume, tiered, and absolute sugar content SSB taxes could each generate significant health gains and cost savings in US adults. Over a lifetime, the volume tax was estimated to prevent 850,000 total CVD events and 269,000 diabetes cases and gain 2.44 million QALYs, while health gains for the tiered and absolute sugar content taxes were approximately twice as high. All three SSB tax designs were cost saving at 10 years and over a lifetime from healthcare, government, and societal perspectives, with about double the cost-savings from healthcare and societal perspectives from either the tiered or absolute sugar content tax, compared to the volume tax. These novel findings inform ongoing health policy discussions on optimal designs of SSB taxes to reduce consumption and improve health in the United States.
Our model suggests that the health and cost implications of varying SSB tax designs are substantially impacted by the combination of consumer and industry responses. For example, we estimated that the health and cost gains of a volume tax were due to an average consumer reduction in SSB servings of 10%, with no additional impact from industry reformulation beyond existing gradual industry efforts. In contrast, the health gains of a tiered tax were due to a much larger average consumer reduction in SSB servings (19%), with some additional modest gains from increased industry reformulation but only to achieve the highest allowable sugar content to achieve a lower tax rate. Finally, the health gains of an absolute sugar content tax were least dependent on the consumer response (7% reduced servings) and benefited most from an industry response to reformulate multiple products incrementally. In addition, the overall initial consumer response would be larger for the tiered tax vs. the absolute sugar content tax, the former resulted in higher initial health gains over 10 years. However, after 10 years, the larger estimated industry reformulation from the absolute sugar content tax offset the earlier larger health gains, resulting in overall similar lifetime health gains for the absolute sugar content vs. tiered tax. These results, using the best available data and incorporating a range of uncertainty and assumptions, provide important benchmarks against which to design and implement specific SSB tax strategies in the United States and potentially other nations. For instance, our findings suggest that any absolute sugar content tax should be accompanied by robust monitoring of SSB added sugar contents in major products to document anticipated reductions, while governments and constituents prioritizing revenue may favor tiered taxes as the best overall approach to gain health and maximize tax revenue.
Our findings suggest that all SSB tax designs may reduce health disparities. Consistent with higher levels of SSB consumption among younger adults, minorities, and adults with lower income,42, 43 we found that SSB taxes would provide greater health and economic benefits to these subgroups. In addition, the large estimated tax revenues should be considered for programs to increase health equity, further reducing disparities and providing an important bulwark against the price-regressive (but health-progressive) nature of SSB taxes. Such programs should consider directly subsidizing healthier foods; for example, the SSB tax revenue in Seattle (King Country, WA) has been earmarked to increase access to and financial incentives for fresh fruits and vegetables for low-income individuals and families.44
A few previous modeling studies from our and other groups have assessed the potential health and economic impacts of SSB taxes in the United States. Each of these evaluated volume based taxes. Our estimated health and cost gains are much more conservative than some of the prior studies. For example, Long and colleagues estimated that a penny per oz. ($0.01/oz.) volume tax on SSBs would generate 0.87 million QALYs and save $23.6 billion in health care costs over 10 years,45 compared to 0.22 million QALYs and $14.5 billion in our analysis for the same tax. Our more conservative findings likely relate to our narrower study population (adults age 35–80 years, vs. all children and adults age 2+ years) and disease outcomes (only CVD and type 2 diabetes, vs. all potential obesity-associated diseases and costs). Thus, while the relative comparisons of differing SSB tax schemes would likely be unchanged, our present findings may underestimate the full health gains and cost savings of a national SSB tax in the United States. We previously evaluated the health impact and cost-effectiveness of a national volume based SSB tax, overall and stratified by 9 distinct stakeholder groups.46 Our investigation builds upon and greatly extends previous analyses by evaluating and comparing the health and economic benefits of volume, tiered, and absolute sugar content SSB taxes, all very real policy options that are now being implemented in different nations globally5 and proposed in new US federal bills.9
In the United States, all currently implemented SSB taxes are volume based, including seven localities (Philadelphia, PA; Berkeley, CA; Albany, CA; Oakland, CA; San Francisco, CA; Boulder, CO; Seattle, WA). Internationally, volume-based taxes have been implemented in (but not limited to) Mexico, Belgium, and the Philippines; sugar content tiered-based taxes in the United Kingdom, Ireland, and Portugal; and absolute sugar content based taxes in South Africa and Mauritius. Taxing SSBs based on sugar content (i.e., tiered or absolute sugar content) has been proposed as a more effective strategy than a volume based approach to stimulate industry reformulation and to provide incentives for consumers to switch to SSBs with less sugar. In the United States, the American Heart Association has proposed a tiered SSB tax; and a bill to impose a tax on SSBs based on a product’s sugar content, known as the Sugar-Sweetened Beverages Tax (SWEET) Act, has been introduced, but has not been made it out of the committee. To date, comparative health and economic impacts of these taxes have not been evaluated. Our findings suggest that each of the three SSB tax designs generated health gains and cost-savings, compared to no tax. When we directly compared the three tax designs, either a tiered tax or an absolute sugar content would lead to larger health gains and cost-savings compared to a volume tax. These findings suggest that a tiered or absolute sugar content tax approach should be considered in any new local, state, or federal efforts to reduce SSB intake and maximize health and economic benefits.
Our study has several strengths. We used a validated microsimulation model and nationally representative data inputs, which increases the validity and generalizability of our estimates. We assessed 10-year and lifetime health effects, costs, and cost-effectiveness from different appropriate perspectives, providing a range of results for different relevant stakeholders and interests. We used the best available evidence on health effects of SSBs and added sugars, including uncertainty in these estimates. We modeled the impact of uncertainty in both one-way and probabilistic sensitivity analyses.
Potential limitations should be considered. Our model cannot prove the health and cost effects of these SSB tax designs in US adults. Rather, the estimates provide evidence that can be considered and incorporated into the design, implementation, and evaluation plans of SSB taxes, including at local, state, or federal levels. Etiologic effects of SSBs, while confirmed for BMI in randomized trials in adolescents, were largely derived from meta-analyses of prospective observational studies,4, 34 which may be overestimated due to residual confounding or underestimated due to measurement error and regression dilution bias. Policy effect sizes for industry reformulation were based on available evidence and reasoned expert assumptions rather than direct responses to SSB taxes, given that reformulation effects of such taxes have not yet been reported. Yet, current experience supports our modeling: for example, in the United Kingdom, beverage industries have reduced the sugar contents of major products like Fanta and Sprite to avoid a SSB tax.47 We did not model direct effects of diabetes on non-CVD death and improved health outcomes or cost savings from reductions in other diseases that may be influenced by reduction in SSBs (e.g., dental caries, other obesity-mediated conditions, gallstones), so our findings may underestimate health benefits and cost savings. Although our study population was derived from NHANES participants using NHANES survey weights to account for the complex survey design and sampling, we appreciate that this sampling approach may still underestimate uncertainty. It could also overestimate uncertainty if the uncertainty of SSB intake in the sampled population is greater than the true general population. Our model population did not include children, adolescents, or young adults <age 35, which could be considered in future research.
In conclusion, our findings suggest that different national SSB tax designs could generate substantial health gains and cost savings in the United States, and that tiered or absolute sugar content taxes could generate largest health and economic benefits. These results have implications for ongoing efforts to implement and evaluate SSB taxes in the United States.
Supplementary Material
CLINICAL PERSPECTIVE.
- What is new?
- Using nationally representative data and a validated microsimulation model, we found that a national U.S. sugar-sweetened beverage tax could generate substantial health gains and cost savings.
- Health and economic benefits were about twice as large for taxes based on sugar content (either tiered or absolute) as for taxes based on volume, as the former stimulated industry reformulations to reduce sugar content; for example, a volume tax would prevent 1.12 million lifetime cardiovascular and diabetes cases and save $53.2 billion, vs. 2.20 million and $105 billion with a tiered tax.
- Younger adults, minorities, and adults with lower income experienced largest health gains.
- What are the clinical implications?
- Current sugar-sweetened beverage taxes in US localities and many other nations are volume-based. Our findings suggest that taxing sugar-sweetened beverages based on sugar content could be even more effective.
- All these sugar-sweetened beverage tax designs may reduce health disparities.
- These novel findings inform ongoing health policy discussions on optimal designs of sugar-sweetened beverage taxes to reduce consumption and improve health in the US.
ACKNOWLEDGEMENTS
The authors thank all of the collaborators and advisory groups in the Food Policy Review and Intervention Cost-Effectiveness (Food-PRICE) project (http://www.food-price.org).
SOURCES OF FUNDING
This research was supported by the NIH, NHLBI R01 HL130735, PI Micha. In addition, Dr. Liu was supported by a postdoctoral fellowship award (17POST33670808) from the American Heart Association. The funding agencies did not contribute to design or conduct of the study; collection, management, analysis, or interpretation of the data; preparation, review, or approval of the manuscript; or decision to submit the manuscript for publication.
DISCLOSURES
All authors report support from NIH grants during the conduct of the study. In addition, Dr. Micha reports research funding from Unilever, Nestle and Danone, and personal fees from the World Bank and Bunge; Dr. Mozaffarian, personal fees from Global Organization for EPA and DHA omega-3, Nutrition Impact, Pollock Communications, Bunge, Indigo Agriculture, Amarin, Acasti Pharma, Cleveland Clinic Foundation, America’s Test Kitchen, Danone, and UpToDate, and scientific advisory boards, Elysium Health (with stock options), Omada Health, and DayTwo; Dr. Gaziano reports research funding from United HealthCare, Teva, Novartis, and consulting from Takeda; all outside the submitted work.
Non-standard Abbreviations and Acronyms
- SSB
Sugar-Sweetened Beverage
- PIR
Poverty-Income Ratio
Footnotes
REFERENCES
- 1.Malik VS, Popkin BM, Bray GA, Despres JP and Hu FB. Sugar-sweetened beverages, obesity, type 2 diabetes mellitus, and cardiovascular disease risk. Circulation. 2010;121:1356–1364. [DOI] [PMC free article] [PubMed] [Google Scholar]
- 2.Rehm CD, Penalvo JL, Afshin A and Mozaffarian D. Dietary Intake Among US Adults, 1999–2012. JAMA. 2016;315:2542–2553. [DOI] [PMC free article] [PubMed] [Google Scholar]
- 3.Bleich SN, Vercammen KA, Koma JW and Li Z. Trends in Beverage Consumption Among Children and Adults, 2003–2014. Obesity (Silver Spring). 2018;26:432–441. [DOI] [PubMed] [Google Scholar]
- 4.Micha R, Penalvo JL, Cudhea F, Imamura F, Rehm CD and Mozaffarian D. Association Between Dietary Factors and Mortality From Heart Disease, Stroke, and Type 2 Diabetes in the United States. JAMA. 2017;317:912–924. [DOI] [PMC free article] [PubMed] [Google Scholar]
- 5.Healthy Food America. Sugary Drink Taxes around the World. 2019. http://www.healthyfoodamerica.org/map. Accessed March 15, 2019.
- 6.Falbe J, Thompson HR, Becker CM, Rojas N, McCulloch CE and Madsen KA. Impact of the Berkeley Excise Tax on Sugar-Sweetened Beverage Consumption. Am J Public Health. 2016;106:1865–1871. [DOI] [PMC free article] [PubMed] [Google Scholar]
- 7.Zhong Y, Auchincloss AH, Lee BK and Kanter GP. The Short-Term Impacts of the Philadelphia Beverage Tax on Beverage Consumption. Am J Prev Med. 2018;55:26–34. [DOI] [PubMed] [Google Scholar]
- 8.American Heart Association. Tiered Taxation for Sugary Drinks. 2018. https://www.heart.org/-/media/files/about-us/policy-research/policy-positions/sugary-beverages/aha-tiered-tax-policy-in-brief-2018.pdf?la=en&hash=BFA6BBF23D50CD017928A2E2BC82A786D0F559F9. Accessed April 5, 2019.
- 9.Sugar-Sweetened Beverages Tax Act of 2018 or the SWEET Act, H.R.7341, 115th Congress (2017–2018). https://www.congress.gov/bill/115th-congress/house-bill/7341. Accessed March 22, 2019.
- 10.Pandya A, Sy S, Cho S, Alam S, Weinstein MC and Gaziano TA. Validation of a Cardiovascular Disease Policy Microsimulation Model Using Both Survival and Receiver Operating Characteristic Curves. Med Decis Making. 2017;37:802–814. [DOI] [PMC free article] [PubMed] [Google Scholar]
- 11.Centers for Disease Control and Prevention. National Health and Nutrition Examination Survey. https://www.cdc.gov/nchs/nhanes/index.htm. Accessed July 2, 2018. [Google Scholar]
- 12.Huang Y, Pomeranz J, Wilde P, Capewell S, Gaziano T, O’Flaherty M, Kersh R, Whitsel L, Mozaffarian D and Micha R. Adoption and Design of Emerging Dietary Policies to Improve Cardiometabolic Health in the US. Curr Atheroscler Rep. 2018;20:25. [DOI] [PMC free article] [PubMed] [Google Scholar]
- 13.Centers for Disease Control and Prevention. National Center for Health Statistics. Overview of NHANES Survey Design and Weights. 2018. https://www.cdc.gov/Nchs/tutorials/environmental/orientation/sample_design/index.htm. Accessed April 2, 2019.
- 14.Afshin A, Penalvo JL, Del Gobbo L, Silva J, Michaelson M, O’Flaherty M, Capewell S, Spiegelman D, Danaei G and Mozaffarian D. The prospective impact of food pricing on improving dietary consumption: A systematic review and meta-analysis. PLoS One. 2017;12:e0172277. [DOI] [PMC free article] [PubMed] [Google Scholar]
- 15.City of Berkeley. Contract with Muniservices, LLC/Soda Tax Implementation. 2014. http://www.ci.berkeley.ca.us/recordsonline/export/16802443.pdf. Accessed March 15, 2018.
- 16.RTI International. Muth M, Bradley S, Brophy J, Capogrossi K, Coglaiti M, Karns S, Viator C. 2014 FDA labeling cost model US Food and Drug Administration. 2015. https://www.rti.org/publication/2014-fda-labeling-cost-model. Accessed September 9, 2019. [Google Scholar]
- 17.Lee KK, Cipriano LE, Owens DK, Go AS and Hlatky MA. Cost-effectiveness of using high-sensitivity C-reactive protein to identify intermediate- and low-cardiovascular-risk individuals for statin therapy. Circulation. 2010;122:1478–1487. [DOI] [PubMed] [Google Scholar]
- 18.Pignone M, Earnshaw S, Tice JA and Pletcher MJ. Aspirin, statins, or both drugs for the primary prevention of coronary heart disease events in men: a cost-utility analysis. Ann Intern Med. 2006;144:326–336. [DOI] [PubMed] [Google Scholar]
- 19.O’Sullivan AK, Rubin J, Nyambose J, Kuznik A, Cohen DJ and Thompson D. Cost estimation of cardiovascular disease events in the US. Pharmacoeconomics. 2011;29:693–704. [DOI] [PubMed] [Google Scholar]
- 20.Pletcher MJ, Lazar L, Bibbins-Domingo K, Moran A, Rodondi N, Coxson P, Lightwood J, Williams L and Goldman L. Comparing impact and cost-effectiveness of primary prevention strategies for lipid-lowering. Ann Intern Med. 2009;150:243–254. [DOI] [PubMed] [Google Scholar]
- 21.Lazar LD, Pletcher MJ, Coxson PG, Bibbins-Domingo K and Goldman L. Cost-effectiveness of statin therapy for primary prevention in a low-cost statin era. Circulation. 2011;124:146–153. [DOI] [PubMed] [Google Scholar]
- 22.Red Book. Pharmacy’s fundamental reference. Montvale, NJ: Thomson Reuters (Healthcare) Inc. 2010. [Google Scholar]
- 23.Nuckols TK, Aledort JE, Adams J, Lai J, Go MH, Keesey J and McGlynn E. Cost implications of improving blood pressure management among U.S. adults. Health Serv Res. 2011;46:1124–1157. [DOI] [PMC free article] [PubMed] [Google Scholar]
- 24.Shah ND, Mason J, Kurt M, Denton BT, Schaefer AJ, Montori VM and Smith SA. Comparative effectiveness of guidelines for the management of hyperlipidemia and hypertension for type 2 diabetes patients. PLoS One. 2011;6:e16170. [DOI] [PMC free article] [PubMed] [Google Scholar]
- 25.American Diabetes Association. Economic costs of diabetes in the U.S. in 2012. Diabetes Care. 2013;36:1033–1046. [DOI] [PMC free article] [PubMed] [Google Scholar]
- 26.Zhuo X, Zhang P and Hoerger TJ. Lifetime direct medical costs of treating type 2 diabetes and diabetic complications. Am J Prev Med. 2013;45:253–261. [DOI] [PubMed] [Google Scholar]
- 27.Russell LB, Ibuka Y and Carr D. How Much Time Do Patients Spend on Outpatient Visits?: The American Time Use Survey. Patient. 2008;1:211–222. [DOI] [PubMed] [Google Scholar]
- 28.Department of Labor Bureau of Labor Statistics. Table 1300. Age of reference person: Annual expenditure means, shares, standard errors, and coefficients of variation, Consumer Expenditure Survey, 2016. https://www.bls.gov/cex/2016/combined/age.pdf. Accessed June 10, 2018.
- 29.Kim DD, Basu A, Duffy SQ and Zarkin GA. Appendix A. Worked Example 1: Cost-effectiveness of treatments for individuals with alcohol use disorders: A reference case analysis In: Neumann P., ed. Cost-effectiveness in Health and Medicine. 2nd Edition New York: Oxford University Press; 2016. [Google Scholar]
- 30.United States Bureau of Labor Statistics. Consumer Price Index Databases. https://www.bls.gov/cpi/data.htm. Accessed August 10, 2018.
- 31.Seiler S, Tuchman A and Yao S. The Impact of Soda Taxes: Pass-through, Tax Avoidance, and Nutritional Effects. 2019. https://carlsonschool.umn.edu/sites/carlsonschool.umn.edu/files/2019-03/soda_paper.pdf. Accessed May 18, 2019.
- 32.Geller M. PepsiCo sets global target for sugar reduction. Reuters. October 17, 2016. https://www.reuters.com/article/us-pepsico-goals/pepsico-sets-global-target-for-sugar-reduction-idUSKBN12H0E1. Accessed February 4, 2019. [Google Scholar]
- 33.Keybridge. 2025 Beverage Calories Initiative: 2015 Progress on the National Initiative. https://www.ameribev.org/files/resources/2025-beverage-calories-initiative_national-initiat-2.pdf. Accessed March 20, 2019.
- 34.Micha R, Shulkin ML, Penalvo JL, Khatibzadeh S, Singh GM, Rao M, Fahimi S, Powles J and Mozaffarian D. Etiologic effects and optimal intakes of foods and nutrients for risk of cardiovascular diseases and diabetes: Systematic reviews and meta-analyses from the Nutrition and Chronic Diseases Expert Group (NutriCoDE). PLoS One. 2017;12:e0175149. [DOI] [PMC free article] [PubMed] [Google Scholar]
- 35.Gaziano TA, Bertram M, Tollman SM and Hofman KJ. Hypertension education and adherence in South Africa: a cost-effectiveness analysis of community health workers. BMC Public Health. 2014;14:240. [DOI] [PMC free article] [PubMed] [Google Scholar]
- 36.Pandya A, Sy S, Cho S, Weinstein MC and Gaziano TA. Cost-effectiveness of 10-Year Risk Thresholds for Initiation of Statin Therapy for Primary Prevention of Cardiovascular Disease. JAMA. 2015;314:142–150. [DOI] [PMC free article] [PubMed] [Google Scholar]
- 37.Pandya A, Weinstein MC, Salomon JA, Cutler D and Gaziano TA. Who needs laboratories and who needs statins?: comparative and cost-effectiveness analyses of non-laboratory-based, laboratory-based, and staged primary cardiovascular disease screening guidelines. Circ Cardiovasc Qual Outcomes. 2014;7:25–32. [DOI] [PMC free article] [PubMed] [Google Scholar]
- 38.Lee Y, Mozaffarian D, Sy S, Huang Y, Liu J, Wilde PE, Abrahams-Gessel S, Jardim TSV, Gaziano TA and Micha R. Cost-effectiveness of financial incentives for improving diet and health through Medicare and Medicaid: A microsimulation study. PLoS Med. 2019;16:e1002761. [DOI] [PMC free article] [PubMed] [Google Scholar]
- 39.United States Census Bureau. Basic Monthly CPS January 1994-Present. https://thedataweb.rm.census.gov/ftp/cps_ftp.html#cpsbasic. Accessed August 10, 2018.
- 40.Neumann PJ, Ganiats TG, Russell LB, Sanders GD and Siegel JE. Cost-effectiveness in health and medicine. 2nd ed. New York: Oxford University Press, 2016. [Google Scholar]
- 41.Powell LM, Isgor Z, Rimkus L, Chaloupka FJ. Sugar-sweetened beverage prices: Estimates from a national sample of food outlets. 2014. http://www.bridgingthegapresearch.org/_asset/ww9rpz/btg_ssb_price_brief_final_jan_2014.pdf Accessed February 17, 2018.
- 42.Park S, Xu F, Town M and Blanck HM. Prevalence of Sugar-Sweetened Beverage Intake Among Adults−-23 States and the District of Columbia, 2013. MMWR Morb Mortal Wkly Rep. 2016;65:169–174. [DOI] [PubMed] [Google Scholar]
- 43.Rehm CD, Matte TD, Van Wye G, Young C and Frieden TR. Demographic and Behavioral Factors Associated with Daily Sugar-sweetened Soda Consumption in New York City Adults. J Urban Health. 2008;85:375–385. [DOI] [PMC free article] [PubMed] [Google Scholar]
- 44.City of Seattle. An ordinance imposing a tax on engaging in the business of distributing sweetened beverages. 2017. https://seattle.legistar.com/LegislationDetail.aspx?ID=3034243&GUID=E03CE985-3AC8-4A3F-81AF-B6E43CEE6C90&Options=&Search=. Accessed February 10, 2019. [Google Scholar]
- 45.Long MW, Gortmaker SL, Ward ZJ, Resch SC, Moodie ML, Sacks G, Swinburn BA, Carter RC and Claire Wang Y. Cost Effectiveness of a Sugar-Sweetened Beverage Excise Tax in the U.S. Am J Prev Med. 2015;49:112–123. [DOI] [PMC free article] [PubMed] [Google Scholar]
- 46.Wilde P, Huang Y, Sy S, Abrahams-Gessel S, Jardim TV, Paarlberg R, Mozaffarian D, Micha R and Gaziano T. Cost-Effectiveness of a US National Sugar-Sweetened Beverage Tax With a Multistakeholder Approach: Who Pays and Who Benefits. Am J Public Health. 2019;109:276–284. [DOI] [PMC free article] [PubMed] [Google Scholar]
- 47.Kottasova I. Soda wars: The UK’s tax on sugary drinks is working. CNN Money. March 9, 2017. https://money.cnn.com/2017/03/09/news/economy/soda-tax-uk-sugar-revenue/index.html. Accessed May 7, 2018. [Google Scholar]
- 48.Sullivan PW and Ghushchyan V. Preference-based EQ-5D index scores for chronic conditions in the United States. Med Decis Making. 2006;26:410–420. [DOI] [PMC free article] [PubMed] [Google Scholar]
- 49.National Vital Statistics Reports. United States Life Table, 2014. https://www.cdc.gov/nchs/data/nvsr/nvsr66/nvsr66_04.pdf. Accessed Jan 15, 2020. [PubMed]
- 50.Organisation for Economic Co-operation and Development. Tax Administration 2015. https://www.oecd-ilibrary.org/docserver/tax_admin-2015-en.pdf?expires=1587779268&id=id&accname=oid006278&checksum=4B2F05FA167C4099554312A8565F59EA. Accessed April 10, 2018.
- 51.Lu Y, Hajifathalian K, Ezzati M, Woodward M, Rimm EB and Danaei G. Metabolic mediators of the effects of body-mass index, overweight, and obesity on coronary heart disease and stroke: a pooled analysis of 97 prospective cohorts with 1.8 million participants. Lancet. 2014;383:970–983. [DOI] [PMC free article] [PubMed] [Google Scholar]
- 52.Singh GM, Danaei G, Farzadfar F, Stevens GA, Woodward M, Wormser D, Kaptoge S, Whitlock G, Qiao Q, Lewington S, Di Angelantonio E, Vander Hoorn S, Lawes CM, Ali MK, Mozaffarian D and Ezzati M. The age-specific quantitative effects of metabolic risk factors on cardiovascular diseases and diabetes: a pooled analysis. PLoS One. 2013;8:e65174. [DOI] [PMC free article] [PubMed] [Google Scholar]
- 53.Wada R, Han E and Powell LM. Associations between soda prices and intake: Evidence from 24-h dietary recall data. Food Policy. 2015;55:54–60. [Google Scholar]
Associated Data
This section collects any data citations, data availability statements, or supplementary materials included in this article.