

Summary
Mechanical cues from the extracellular matrix (ECM) regulate various cellular processes via distinct mechanotransduction pathways. In breast cancer, increased ECM stiffness promotes Epithelial-Mesenchymal Transition (EMT), cell invasion and metastasis. Here we identify a mechanosensitive EPHA2/LYN protein complex regulating EMT and metastasis in response to increasing ECM stiffness during tumor progression. High ECM stiffness leads to ligand-independent phosphorylation of ephrin receptor EPHA2, which recruits and activates the LYN kinase. LYN phosphorylates the EMT transcription factor TWIST1 to release TWIST1 from its cytoplasmic anchor G3BP2 to enter the nucleus, thus triggering EMT and invasion. Genetic and pharmacological inhibition of this pathway prevents breast tumor invasion and metastasis in vivo. In human breast cancer samples, activation of this pathway correlates with collagen fibre alignment, a marker of increasing ECM stiffness. Our findings reveal an EPHA2/LYN/TWIST1 mechanotransduction pathway that responds to mechanical signals from the tumor microenvironment to drive EMT, invasion and metastasis.
Keywords: mammary epithelial organoids, matrix stiffness, epithelial-mesenchymal transition, metastasis, TWIST1, LYN, EPHA2, mechanotransduction
eTOC Blurp
Fattet et al. identified a EPHA2/LYN/TWIST1 signaling cascade activated by mechanical forces from the extracellular matrix to promote Epithelial-Mesenchymal Transition and cell invasion. They demonstrate that activation of this mechanotransduction pathway promotes breast tumor invasion and metastasis and is involved in human breast cancer metastasis.
Introduction
Mechanical forces from extracellular matrix have emerged as critical regulators of embryo morphogenesis, tissue remodelling, and tumor invasion and metastasis. During tumor development, increased deposition, modification and remodelling of the extracellular matrix (ECM), generates a highly fibrotic tumor microenvironment with increased matrix rigidity, which is associated with poor patient prognosis (Wei, et al., 2015; Chang, et al., 2013; Mujtaba, et al., 2013; Lu, et al., 2012; Levental, et al., 2009; Paszek, et al., 2005; Boyd, et al., 2002; Hasebe, et al., 2002; Colpaert, et al., 2001). Mechanical cues have been shown to impact diverse cellular processes including cell proliferation, survival and invasion (Martino, et al., 2018; Paszek, et al., 2005) by activating numerous mechanotransduction pathways, many of which are currently unknown.
Epithelial-to-mesenchymal transition (EMT) is a highly conserved developmental process aberrantly reactivated during tumor progression to provide epithelial tumor cells with the ability to invade and disseminate, while its reversion favours the outgrowth of metastatic lesions (Brabletz, et al., 2018; Tsai, et al., 2012). The plasticity of the EMT program suggests that EMT is dynamically regulated in response to extracellular signals from the microenvironment at the primary tumor site and distant organs. Using a widely used collagen-coated polyacrylamide hydrogel system in a three-dimensional (3D) Matrigel overlay culture system, we previously reported that high ECM stiffness promotes EMT and breast cancer metastasis via nuclear localization of the EMT transcription factor TWIST1, which can potently induce EMT and ECM degradation to promote efficient cell invasion and metastatic dissemination (Eckert, et al., 2011; Yang, et al., 2004). Expression of nuclear TWIST1 protein in tumor cells is significantly correlated with metastasis occurrence and decreased survival in breast cancer patients (Eckert, et al., 2011). Mechanistically, high matrix stiffness releases TWIST1 from its cytoplasmic anchor protein G3BP2 to enter the nucleus and drive EMT-associated transcription (Wei, et al., 2015). Consistent with this, a recent in vivo study shows that high tissue stiffness promotes EMT to trigger neural crest migration (Barriga, et al., 2018). These studies together underscore a highly conserved role of matrix stiffness in driving EMT during both embryo morphogenesis and tumor metastasis.
Currently, the upstream mechanotransduction pathway transmitting mechanical cues from ECM to regulate TWIST1 and EMT is largely unknown. Here, we decipher the molecular links between increasing ECM stiffness and EMT and uncover a previously unknown pathway connecting an EPHA2/LYN mechanoresponsive protein complex with TWIST1 in regulating epithelial-mesenchymal plasticity and breast tumor metastasis.
Results
The LYN kinase is essential for high ECM stiffness-induced EMT and invasion.
To investigate mechanoresponsive regulation of EMT in breast cancer metastasis, we tested the hypothesis that phosphorylation of TWIST1 on tyrosine 103 (Y103) could release it from its cytoplasmic anchor G3BP2 to drive EMT. We immunoprecipitated endogenous TWIST1 from human MCF10A and mouse Eph4Ras mammary epithelial cells (MECs) cultured in the 3D hydrogel Matrigel system with calibrated elastic moduli ranging from the ~150 Pascals (Pa) of normal mammary glands to the ~5700 Pa of breast tumor tissues (Johnson, et al., 2007; Paszek, et al., 2005). Using a phospho-Y103 specific antibody, we found that both endogenous human and mouse TWIST1 proteins are specifically phosphorylated on Y103 at 5700Pa, but not at 150Pa (Fig. 1A and S1A). Y103 phosphorylation is correlated with stiffness-induced TWIST1 dissociation from its cytoplasmic anchor G3BP2 (Fig. S1B) and can disrupt the TWIST1/G3BP2 interaction (Wei, et al., 2015). To identify the kinase responsible for TWIST1 phosphorylation on Y103 in response to high stiffness, we performed a screen of 73 tyrosine kinases for their ability to phosphorylate the Y103 motif (Fig. S1C). Fourteen protein kinases were scored positive based on moderate (>10,000 cpm) to high (>40,000 cpm) levels of phosphorylation of a TWIST1 peptide containing Y103, and on high specificity (>70% higher phosphorylation of the Y103 peptide compared to a Y103F mutant peptide). Interestingly, all five SRC B subfamily kinases (FRK, BLK, HCK, LCK and LYN), but none of the SRC A subfamily kinases (FYN, FGR, SRC, YES), scored positive, suggesting a certain degree of specificity in TWIST1 phosphorylation on Y103 (Fig. 1B).
Figure 1: The LYN kinase is essential for TWIST1 nuclear localization and EMT in response to increasing ECM stiffness.
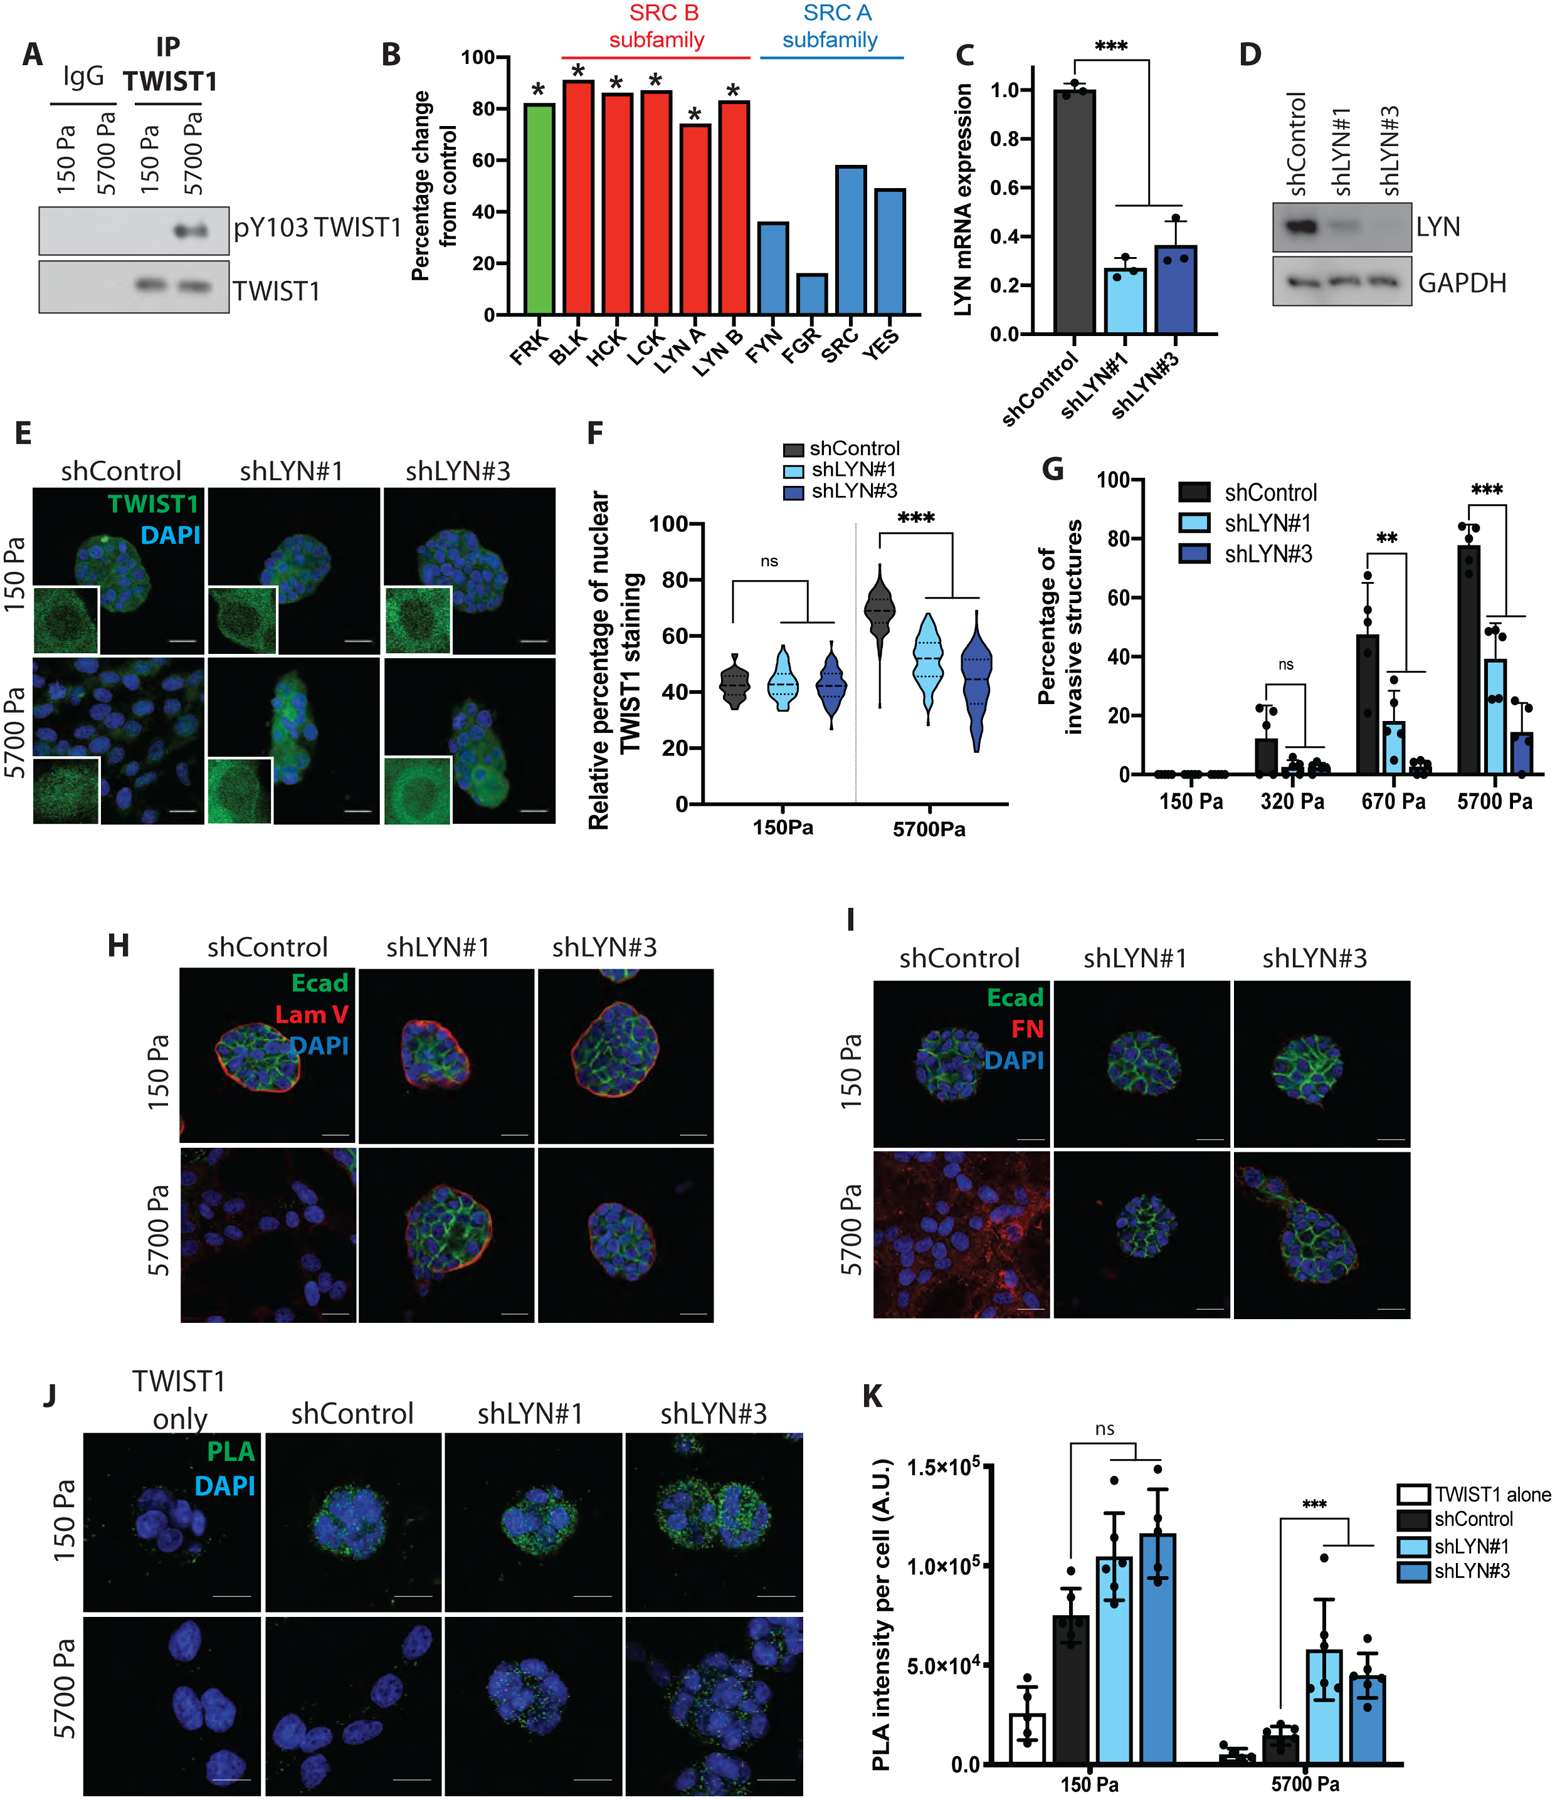
A) MCF10A cells were grown on 3D-PA gels with different rigidities for 5 days. Lysates were subjected to TWIST1 immunoprecipitation and immunoblotted as indicated.
B) Radiometric kinase screening assay.* shows significance (CFC>70%)
C) qPCR analysis in MCF10A cells. Data are presented as mean +/− sd, dots represent technical replicates.
D) WB on lysates from MCF10A cells as indicated.
E) Control or LYN-silenced MCF10A cells were grown on 3D-PA gels for 5 days, fixed and immunostained for TWIST1 (green) and DAPI (blue). Inserts show higher magnification images.
F) TWIST1 nuclear staining in E is presented as percent of total TWIST1 staining on a violin plot showing the distribution of the data with the median (hyphen line) and quartiles (dotted line).
G) Control or LYN-silenced MCF10A cells were grown on 3D-PA gels for 5 days. Invasive structures were quantified and represented as percentages of total structures. Data are presented as mean +/− sd, dots represent individual fields.
H,I) Control or LYN-silenced MCF10A cells were grown on 3D-PA gels for 5 days, fixed and immunostained for E-cadherin (green), DAPI (blue) and (H) Laminin V (LamV, red) or (I) fibronectin (FN, red).
J) Control or LYN-silenced MCF10A cells were grown on 3D-PA gels for 5 days, fixed and PLA (green dots) was performed to detect TWIST1-G3BP2 endogenous interaction, DAPI is in blue.
K) Quantification of the PLA intensity per cell. A.U.: arbitrary units. Data are presented as mean +/− sd, dots represent individual fields.
*** p < 0.001; ** p < 0.01; ns: not significant. Scale bar = 25 μm.
See also Figure S1.
We next determined the requirement of 14 candidates on TWIST1 nuclear localization and TWIST1/G3BP2 interaction. Among the candidate kinases whose expression is detectable in MECs (Fig. S1D), only knockdown of LYN (Fig. 1C–D and S1E–F) inhibited TWIST1 nuclear translocation and tumor cell invasion in both mouse and human organoids grown in the 5700 Pa hydrogels (Fig. 1E–G and S1G–J). Unlike control cells, MCF10A cells with LYN knockdown formed acini-like structures and did not undergo partial EMT nor invade at 5700Pa, as shown by E-cadherin and Fibronectin staining, and retained basement membrane integrity as shown by Laminin V staining (Fig. 1H,I). We observed strong endogenous TWIST1/G3BP2 interaction in the cytoplasm of control cells at 150Pa, which was lost at 5700Pa (Fig. 1J,K and S1J,K). In contrast, MCF10A cells with LYN knockdown maintained cytoplasmic PLA signals at 5700Pa. These results demonstrate an essential role of LYN in disrupting TWIST1 cytoplasmic sequestration by G3BP2, resulting in TWIST1 nuclear localization, EMT, and invasion.
High ECM stiffness activates LYN to directly phosphorylate TWIST1 and drive EMT and invasion.
We next ask whether the LYN kinase is activated to directly phosphorylate Y103 on TWIST1 at high stiffness, thus affecting the G3BP2 binding domain (Fig. 2A). In vitro phosphorylation assays using TWIST1 WT and Y103F mutant with recombinant active LYN showed significant increase of 32P incorporation in TWIST1 WT compared to the Y103F mutant (Fig. 2B and S2A). Both recombinant LYN and endogenous LYN immunoprecipitates from MCF10A cells effectively phosphorylate TWIST1 on Y103 (Fig. 2C). Both LYN WT and the constitutively active Y508F mutant, but not the kinase-deficient Y397F mutant, can phosphorylate Y103 (Fig. S2B). Furthermore, expression of LYN WT, but not the kinase-deficient Y397F mutant or other candidate kinases from the original screen, inhibited the interaction between TWIST1 and G3BP2 in MCF10A, MCF10DCIS and EpH4Ras cells (Fig. 2D and S2C–E). These results show that LYN can directly phosphorylate TWIST1 on Y103.
Figure 2: The LYN kinase is activated and directly phosphorylates TWIST1 on Y103 to drive invasion in response to increasing ECM stiffness.

A) Schematic representation of TWIST1 domain structure. The G3BP2-binding domain is highlighted in red. Amino acid numbers are indicated. NLS: nuclear localization signal; bHLH: basic helix-loop-helix; WR: Tryptophan Arginine.
B) Autoradiograph showing kinase assay.
C) Cold in vitro kinase assay. Reactions were immunoblotted as indicated.
D) MCF10A cells expressing WT or kinase-deficient (Y397F) LYN were subjected to TWIST1 immunoprecipitation and immunoblotted as indicated.
E) Lysates from 3D-cultured MCF10A cells were subjected to LYN immunoprecipitation and immunoblotted as indicated.
F) Protein amounts in E were quantified by densitometry (presented as the ratio of phospho-Y416 to total LYN levels).
G) Lysates from 3D-cultured Eph4Ras cells were subjected to Lyn immunoprecipitation and immunoblotted as indicated.
H) Relative protein levels in G were quantified by densitometry (presented as the ratio of phospho-Y416 to total Lyn levels).
I) LYN immunoprecipitates from 3D-cultured MCF10A cells were used for cold in vitro kinase assay, with WT or Y103F mutant TWIST1 pulled down from 293T cells. Reactions were immunoblotted as indicated.
J) MCF10A cells were treated with 1 μM Bafetinib or vehicle control (DMSO). Lysates were subjected to LYN immunoprecipitation and immunoblotted as indicated.
K) MCF10A cells were grown on 3D-PA gels for 5 days, treated with 1 μM Bafetinib (Bafe) or vehicle control (DMSO). Lysates were subjected to TWIST1 immunoprecipitation and immunoblotted as indicated.
L) LYN immunoprecipitates from 3D-cultured MCF10A cells were used for cold in vitro kinase assays, in presence of 1 μM Bafetinib or vehicle control (DMSO). Reactions were immunoblotted as indicated.
M) Lysates from 3D-cultured MCF10A cells were subjected to LYN or SRC immunoprecipitation and immunoblotted as indicated.
N) Relative Protein levels in M were quantified by densitometry (presented as the ratio of phospho-Y416 to total LYN/SRC levels).
O) LYN or SRC immunoprecipitates from 3D-cultured MCF10A cells were used for cold in vitro kinase assay. Reactions were immunoblotted as indicated.
See also Figure S2.
To determine the activation status of LYN in response to ECM stiffening, we immunoprecipitated endogenous human and mouse LYN from MCF10A, MCF10DCIS and EpH4Ras organoids grown at various rigidities and found that Y397 phosphorylation in the LYN activation loop (corresponding to Y416 in SRC) was significantly higher at 5700Pa than at 150Pa (Fig. 2E–H and S2F,G). Importantly, endogenous LYN immunoprecipitated from MCF10A cells at 5700Pa, but not at 150Pa, effectively phosphorylates TWIST1 on Y103, which indicates that high stiffness activates the LYN kinase to phosphorylate TWIST1 on Y103 (Fig. 2I). Consistent with these data, the dual LYN and Bcr-Abl inhibitor Bafetinib blocked phosphorylation of endogenous TWIST1 on Y103 at 5700Pa and inhibited the ability of immunoprecipitated endogenous LYN to phosphorylate TWIST1 on Y103 in vitro (Fig. 2J–L). The specificity of LYN in phosphorylating Y103 is further demonstrated by our finding that SRC is not activated and does not phosphorylate TWIST1 on Y103 at high stiffness (Fig. 2M–O). Together, these results strongly support the notion that LYN, but not other SRC family kinases, is specifically activated at high stiffness and directly phosphorylates TWIST1 on Y103 to release TWIST1 from its cytoplasmic anchor G3BP2, thus promoting EMT and invasion.
LYN inhibition prevents ECM stiffness-induced cell invasion and metastatic dissemination in vivo.
We next performed pharmacologic inhibition of LYN kinase to determine whether LYN could serve as a therapeutic target to inhibit ECM stiffness-induced tumor invasion and metastasis. Treating MCF10A 3D cultures with the LYN/Bcr-Abl dual inhibitor Bafetinib, but not the Bcr-Abl specific inhibitor Nilotinib, decreased LYN phosphorylation on Y397 and inhibited ECM stiffness-induced cell invasion (Fig. 2J, 3A and S3A). Moreover, Bafetinib, but not Nilotinib treatment, rescued endogenous TWIST1-G3BP2 interaction at 5700Pa (Fig. 3B,C). In addition, Bafetinib treatment inhibited ECM stiffness-induced changes of EMT markers (Fig. 3D). Even short treatment with Bafetinib (24 hours) prevents TWIST1 nuclear translocation in response to ECM stiffness without affecting G3BP2 cytoplasmic localization (Fig. 3E,F). This further supports our model in which LYN-directed TWIST1 phosphorylation allows TWIST1 to enter the nucleus in response to high ECM stiffness.
Figure 3: LYN inhibition prevents ECM stiffness-induced cell invasion and metastatic dissemination in vivo.

A-F) MCF10A cells were grown on 3D-PA gels for 5 days in the presence of 1 μM Bafetinib, Nilotinib or vehicle control.
A) Invasive structures were quantified and represented as percentages of total structures. Data are presented as mean +/− sd, dots represent individual fields.
B) PLA (green dots) was performed to detect TWIST1-G3BP2 endogenous interaction, DAPI is in blue. Scale bar = 25 μm.
C) Quantification of the PLA intensity per cell in B. A.U.: arbitrary units. Data are presented as mean +/− sd, dots represent individual fields.
D) Cells were immunostained for E-cadherin (green), DAPI (blue) and fibronectin (FN, red).
E) Cells were immunostained for TWIST1 (green), G3BP2 (red) and DAPI (blue). Scale bar = 25 μm. Inserts show high magnification images.
F) TWIST1 nuclear signal in (E) is presented as the percentage of total TWIST1 staining on a violin plot showing the distribution of the data with the median (hyphen line) and quartiles (dotted line).
G) Schematic depicting the protocol used for in vivo experiments.
H) Tumor weight (mg) at the end of the experiment are presented as mean +/− sd, dots represent individual animals. N=14 tumors per group.
I) Local (mammary gland, MG) or regional (peritoneum) invasion of the primary tumor. Data are presented as percentage. N=14 mice per group.
J) Representative images of the primary tumor invasion (T: tumor; P: peritoneum). Arrow shows GFP-positive invasive tumor cells. Scale bar = 5 mm.
K) Lung metastatic burden presented as the number of GFP+ nodules in the lungs. Data are presented as mean +/− sd, dots represent individual animals. N=14 mice per group.
L) Representative images. Arrows show metastatic tumor cells. Scale bar = 1 mm.
*** p < 0.001; ns: not significant.
See also Figure S3.
To investigate the role of LYN in tumor progression in vivo, we used the MCF10DCIS human breast tumor orthotopic xenograft model, which recapitulates the progression from ductal carcinoma in situ (DCIS) to invasive ductal carcinoma (IDC) when implanted in mammary fat pads (Miller, et al., 2000). Both rheology and atomic force microscopy analysis showed that MCF10DCIS tumors are significantly stiffer than normal mammary glands (Fig. 7A,B). These tumors at 8 weeks (which have largely progressed to invasive IDC and resulted in lung metastases) showed higher collagen contents than tumors at 4 weeks (which are mostly noninvasive and non-metastatic DCIS), a feature that is correlated to a higher tissue stiffness (Mujtaba, et al., 2013; Hasebe, et al., 2002; Colpaert, et al., 2001) (Fig. S3B–G). We injected GFP-labelled MCF10DCIS cells into the mammary fat pad of SCID mice to allow primary tumor development for 3 weeks and then treated the mice with either vehicle control or Bafetinib for 3 weeks (Fig. 3G). Daily administration of Bafetinib affected neither body weight nor primary tumor weight (Fig. 3H and S3H,I). But LYN inhibition significantly blocked the progression from DCIS to IDC, as shown by a significant decrease in local and regional invasion compared to vehicle or Nilotinib-treated mice (Fig. 3I,J and S3J,K). More importantly, LYN inhibition drastically reduced the presence of GFP+ metastatic nodules in the lung (Fig. 3K,L). These results indicate that LYN kinase activity is critical for ECM stiffness-induced tumor cell invasion and metastatic dissemination.
Figure 7: Activation of EPHA2 non-canonical signalling correlates with matrix stiffening during breast tumor progression and metastasis.
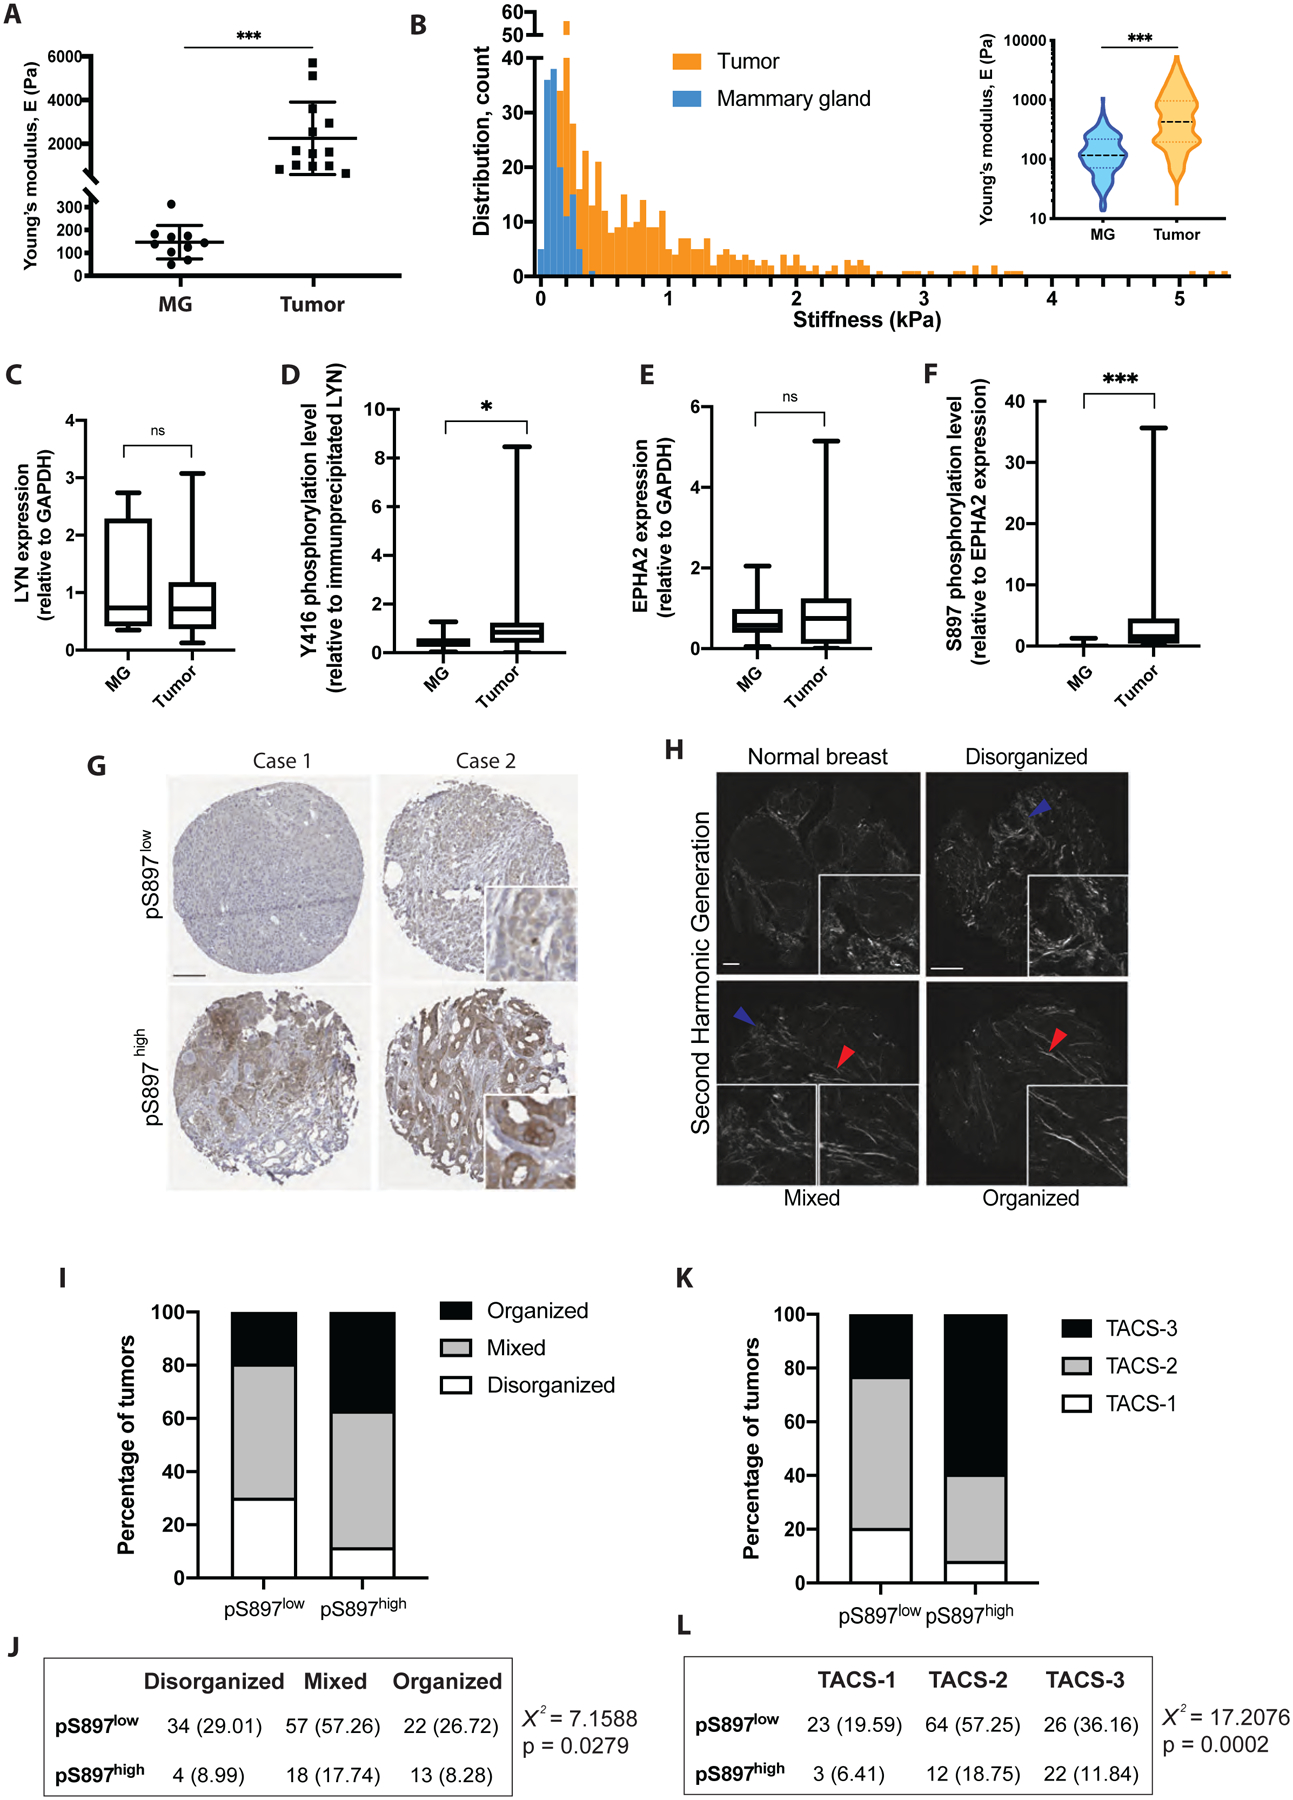
A) Rheology measurements of normal mammary glands (MG) and tumors from MCF10DCIS xenografts. Data are presented as mean +/− sd, dots represent individual samples. N=10 (MG) and 13 (tumors).
B) Atomic force microscopy measurements of normal MG and tumors from MCF10DCIS xenografts. Each bar represents the distribution of samples in a 50Pa-range. Insert: violin plot depicting the mean Young’s modulus E (Pa).
C-F) Normal MG and tumors from MCF10DCIS xenografts were processed for protein extraction. C) Lysates were immunoblotted for LYN and GAPDH, protein amounts were quantified by densitometry (presented as the ratio of LYN to GAPDH expression). D) Lysates were subjected to LYN immunoprecipitation and immunoblotted for phospho-Y416 SFK. Phosphorylation levels were quantified (presented as the ratio of phospho-Y416 to total LYN expression). E) Lysates were immunoblotted for EPHA2 and protein amounts were quantified (presented as the ratio of EPHA2 to GAPDH expression). F) Lysates were immunoblotted for phospho-S897 EPHA2. Phosphorylation levels were quantified by densitometry (presented as the ratio of phospho-S897 to EPHA2 expression).
G) IHC for phospho-S897 EPHA2. Scale bar = 50 μm. Inserts show higher magnification.
H) SHG imaging. Scale bar = 50 μm. Inserts show higher magnification. Red arrows show straight collagen fibres (organised), blue arrows show curved collagen (disorganised).
I,J) Correlation analysis between collagen organization (SHG) and phospho-S897 EPHA2 (IHC) staining. I) Bar graph showing the repartition of breast tumors. J) χ2 analysis showing that collagen organization and phospho-S897 EPHA2 status are correlated.
K,L) Correlation analysis between TACS score (SHG) and phospho-S897 EPHA2 (IHC) staining. K) Bar graph showing the repartition of breast tumors. L) χ 2 analysis showing that TACS score and phospho-S897 EPHA2 status are correlated.
*** p < 0.001; * p < 0.05; ns: not significant.
See also Figure S7.
ECM stiffness-induced LYN kinase activation requires the ephrin receptor EPHA2.
We next aim to uncover the molecular mechanism driving LYN kinase activation in response to high ECM stiffness. We first investigated the known integrin-mediated mechanotransduction pathways in stiffness-driven TWIST1 translocation. While a β1-integrin blocking antibody can prevent stiffness sensing and block TWIST1 nuclear localization at high stiffness (Wei, et al., 2015), its exact action is complex since the blocking antibody also blocks the binding of β1-integrin to its ECM ligands and affects cell attachment (Park, et al., 2006). Surprisingly, inhibition of the integrin-activated Focal Adhesion Kinase (FAK) or the downstream effector kinase SRC, could not block nuclear translocation of TWIST1 observed at 5700Pa (Fig. S4A). In addition, FAK inhibition did not prevent the disruption of endogenous interaction between TWIST1 and G3BP2 observed in MCF10A (Fig. S4B–E) and Eph4Ras (Fig. S4F,G) cells at 5700Pa. Furthermore, MCF10A cells expressing either WT or V737N mutant of β1-integrin, which is reported to mimic stiffness-induced integrin clustering (Laklai, et al., 2016) did not show any effect on TWIST1 translocation or TWIST1/G3BP2 interaction (Fig. S4H–J). These results suggest that while integrins are required for ECM binding to transmit mechanical cues, additional signalling pathways are required to activate the LYN kinase in response to increased stiffness.
To identify mechano-regulators of LYN, we immunoprecipitated LYN from MCF10A 3D cultures on soft and stiff matrices and subjected the samples to LC-MS/MS. Among all the hits, we focused on receptor kinases, given their likely roles in activating LYN in response to extracellular signals. The ephrin receptor EPHA2 was the top candidate that selectively binds to LYN at 5700Pa compared to 150Pa (Fig. S5A,B). Co-immunoprecipitation experiments confirmed stiffness-dependent interaction between LYN and EPHA2 (Fig. 4A,B). The specificity of this interaction is further supported by the fact that closely related EPHA family members EPHA1 and EPHA4 do not bind to LYN (Fig. S5C,D). Like other SFKs, LYN activity is regulated by the phosphorylation status on both Y397 (activating site) and Y508 (inhibitory site), which tightly controls LYN conformation and accessibility to substrates (Thomas and Brugge, 1997). We performed sequential immunoprecipitation of endogenous EPHA2 and then LYN. The results show that the EPHA2-bound fraction of LYN lacks any detectable Y508 phosphorylation, while phosphorylation on the Y397 activation site was readily detected at 5700Pa (Fig. 4C), strongly suggesting that the EPHA2-bound LYN is in an open conformation and enzymatically active at high matrix stiffness. Indeed, we found that the LYN Y397F kinase-deficient mutant binds less to EPHA2 than LYN WT (Fig. S5E). In contrast, the LYN Y508F mutant, which is in an open conformation and constitutively active (Cartwright, et al., 1987; Kmiecik and Shalloway, 1987), binds to EPHA2 better than LYN WT.
Figure 4: ECM stiffness-induced LYN kinase activation requires the ephrin receptor EPHA2.

A,B) Lysates from 3D-cultured MCF10A cells were subjected to LYN (A) or EPHA2 (B) immunoprecipitation and immunoblotted as indicated.
C) Lysates from 3D-cultured MCF10A cells were subjected to sequential immunoprecipitation and immunoblotted as indicated.
D) Upper panel, qPCR analysis in MCF10A cells. Data are presented as mean +/− sd, dots represent technical replicates. Lower panel, WB with lysate from MCF10A cells as indicated.
E) Control or EPHA2-silenced MCF10A cells were grown on 3D-PA gels for 5 days and immunostained for TWIST1 (green) and DAPI (blue). Scale bar = 25 μm. Inserts show high magnification.
F) TWIST1 nuclear signal in E is presented as the percentage of total TWIST1 staining on a violin plot showing the distribution of the data with the median (hyphen line) and quartiles (dotted line).
G) Quantification of the experiment in Fig. S5G, expressed as percentage of invasive structures. Data are presented as mean +/− sd, dots represent individual fields.
H) Control or EPHA2-silenced MCF10A cells were grown on 3D-PA gels for 5 days and immunostained for E-cadherin (green), DAPI (blue) and fibronectin (FN, red).
I-L) GFP-labelled Control or EPHA2-silenced MCF10DCIS cells were injected into the mammary gland of NOD/SCID mice. I) Tumor weight (mg) at the experiment’s endpoint. Data are presented as mean +/− sd, dots represent individual tumors. N=16 tumors per group. J) Regional (peritoneum) invasion of the primary tumor is presented as the percentage of total primary tumors. N=8 mice per group. K) Lung metastatic burden is presented as the ratio of the number of GFP+ nodules in the lungs to tumor weight. A.U.: arbitrary units. Data are presented as mean +/− sd, dots represent individual animals. N=8 mice per group. L) Representative images. Scale bar = 1 mm.
*** p < 0.001; ** p < 0.01; * p < 0.05.
To test the functional significance of EPHA2 in TWIST1 mechanoresponsive signalling, we knocked down EPHA2 in both MCF10A and EpH4Ras cells (Fig. 4D and S5F). Loss of EPHA2 significantly reduced nuclear translocation of TWIST1, EMT induction, and cell invasion (Fig. 4E–H and S5G–J). We next investigated the importance of EPHA2 in metastatic dissemination in the MCF10DCIS xenograft model. Control tumors progress to IDC and present local invasion and lung metastases at 8 weeks post implantation (Fig. 4I–L). Knockdown of EPHA2 drastically inhibited tumor invasion into the peritoneum and more importantly dissemination to the lungs, but only reducing primary tumor weight slightly (Fig. 4I–L and S5K). These results together identify EPHA2 as a key player in the mechanotransduction pathway that leads to LYN activation and TWIST1 nuclear translocation, thus triggering tumor invasion and metastasis in response to ECM stiffening.
High ECM stiffness activates ligand-independent EPHA2 signalling to promote EMT and invasion.
We next sought to understand how ECM stiffness regulates EPHA2 to activate LYN. EPHA2 can exert pro- or anti-tumorigenic activities depending on ligand binding (Pasquale, 2010). Ligand binding to EPHA2 is originally shown to reverse the malignant phenotype observed in EPHA2-overexpressing mammary epithelial cells (Zelinski, et al., 2001). In the absence of ligands, EPHA2 can be phosphorylated on serine 897 (S897), triggering a non-canonical signalling that promotes tumor cell migration and metastasis through an unknown mechanism (Li, et al., 2019; Zhou and Sakurai, 2017; Paraiso, et al., 2015; Zhou, et al., 2015; Miao, et al., 2009). Ligand binding activates EPHA2 tyrosine kinase activity, suppresses S897 phosphorylation and blocks tumorigenesis by inhibiting ERK signalling (Pasquale, 2010; Pasquale, 2008). Interestingly, we found that treatment with the ephrinA1-Fc ligand inhibited TWIST1 nuclear translocation and invasion at high stiffness (Fig. 5A–C and S6A). In 3D cultures, phosphorylation on S897, but not Y588, drastically increased at 5700Pa (Fig. 5D). This drastic activation of EPHA2 non-canonical signalling in response to ECM stiffness could not be explained by mild decrease of the endogenous ephrinA1 ligand level (Fig. S6B,C). Activation of EPHA2 canonical signalling using ephrinA1-Fc reduced EPHA2 S897 phosphorylation and prevented the interaction between LYN and EPHA2 as well as LYN activation (Fig. 5E), further supporting the notion that matrix stiffness activates ligand-independent EPHA2 signalling via S897 phosphorylation.
Figure 5: Ligand-independent EPHA2 signalling promotes LYN activation and cell invasion in response to increasing ECM stiffness.

A-C) MCF10A cells were grown on 3D-PA gels for 5 days in presence of 400 μg/ml recombinant ephrinA1-Fc chimera or IgG control. A) Cells were stained for TWIST1 (green) and DAPI (blue). Scale bar = 25 μm. Inserts show high magnification. B) Organoid phenotypes were quantified as percentage of invasive structures. Data are presented as mean +/− sd, dots represent individual fields. C) TWIST1 nuclear signal in A is presented as percentage of total TWIST1 staining on a violin plot showing the distribution of the data with the median (hyphen line) and quartiles (dotted line).
D) Lysates from 3D-cultured MCF10A cells were immunoblotted as indicated.
E) Lysates from 3D-cultured MCF10A cells, treated with 400 μg/ml recombinant ephrinA1-Fc chimera or IgG control, were subjected to LYN or EPHA2 immunoprecipitation and immunoblotted as indicated.
F) Lysates from 293T cells were subjected to LYN immunoprecipitation and immunoblotted as indicated.
G) Control or EPHA2-silenced MCF10A cells rescued for WT, kinase-dead (KM) or S897 phosphorylation defective mutant (SA) were grown on 3D-PA gels for 5 days. Lysates were subjected to LYN immunoprecipitation and immunoblotted as indicated.
H) Control or EPHA2-silenced MCF10A cells rescued for WT, K646M or S897A mutants of EPHA2 grown on 3D-PA gels for 5 days were stained for TWIST1 (green) and DAPI (blue). Scale bar = 25 μm. Inserts show high magnification images.
I) Quantification of the data presented in Fig. S5L is presented as percentage of invasive structures. Data are presented as mean +/− sd, dots represent individual fields.
J) TWIST1 nuclear signal in H is presented as the percentage of total TWIST1 staining on a violin plot showing the distribution of the data with the median (hyphen line) and quartiles (dotted line).
K) Cells were immunostained for E-cadherin (green), DAPI (blue) and fibronectin (FN, red).
*** p < 0.001; ** p < 0.01; * p < 0.05.
We next analysed the impact of EPHA2 S897 phosphorylation on LYN binding and found that the S897A mutation in EPHA2 inhibits the interaction between EPHA2 and LYN, whereas both EPHA2 wild-type (WT) and the K646M kinase-dead mutant interact with LYN (Fig. 5F). We then knocked down EPHA2 in MCF10A cells to determine the ability of reconstituted EPHA2 WT and S897A (SA) mutant to rescue stiffness-induced cell invasion (Fig. S6D). While EPHA2 WT and the K646M (KM) mutant were both able to restore ECM stiffness-induced LYN activation, TWIST1 nuclear translocation and cell invasion, the S897A mutant completely failed to do so (Fig. 5G–K). These data strongly indicate that EPHA2 phosphorylation on S897 is required for stiffness-activated LYN/TWIST1 mechanotransduction.
EPHA2 was reported to be directly phosphorylated on S897 by the ERK/RSK or AKT signalling in 2D culture (Li, et al., 2019; Zhou, et al., 2015; Miao, et al., 2009). We found that EPHA2 non-canonical signalling triggered by ECM stiffness correlates with activation of the ERK and RSK kinases, but not AKT (Fig. 6A and S6E). Consistent with these data, pharmacologic inhibition of ERK1/2, but not of AKT, inhibits RSK phosphorylation, ECM stiffness-dependent cell invasion and TWIST1 nuclear translocation (Fig. 6B–D). In addition, inhibition of RSK family members inhibited EPHA2 S897 phosphorylation and stiffness-induced cell invasion (Fig. S6F,G). Supporting the role of LYN and RSK in regulating TWIST1 to impact EMT and invasion, knockdown of G3BP2 to allow TWIST1 nuclear translocation could significantly reverse the effect of LYN or RSK inhibition at high matrix stiffness (Fig. S6G). We next knocked down the most abundant RSK family members and found that loss of RSK1, but not RSK2 or RSK3, drastically inhibited EPHA2 S897 phosphorylation, prevented ECM stiffness-induced LYN activation and recruitment to EPHA2, and inhibited cell EMT and invasion induced by increasing rigidities (Fig. 6F–I and S6H–L). Importantly, expression of a dominant-negative kinase dead (KD) mutant of RSK1 (K94/447R) decreased EPHA2 S897 phosphorylation and prevented ECM stiffness-induced invasion and EMT (Fig. S6M–P). In mice, we found that RSK1 knockdown strongly inhibited primary tumor invasion and lung metastasis, despite an increase of primary tumor growth (Fig. 6J–L). These comprehensive analyses indicate that high matrix stiffness activates ERK/RSK1-mediated EPHA2 non-canonical signalling to induce LYN activation, TWIST1 nuclear localization, and cell invasion (Fig. 6M).
Figure 6: ERK/RSK1-dependent EPHA2 phosphorylation on S897 is required for LYN activation and cell invasion in response to ECM stiffness.

A) Lysates from 3D-cultured MCF10A cells were immunoblotted as indicated.
B-D) MCF10A cells were grown on 3D-PA gels for 5 days in presence of 5 μM ERK1/2 inhibitor (FR180204), 100 nM AKT inhibitor (PF-0691502) or vehicle control (DMSO). B) Cell phenotypes were quantified as percentage of invasive structures. Data are presented as mean +/− sd, dots represent individual fields. C) Cells were stained for TWIST1 (green) and DAPI (blue). Scale bar = 25 μm. Inserts show high magnification images. D) TWIST1 nuclear signal in C is presented as percentage of total TWIST1 staining on a violin plot showing the distribution of the data with the median (hyphen line) and quartiles (dotted line).
E) Lysates from 3D-cultured MCF10A cells treated for 2 hours with 5 μM ERK1/2 inhibitor (FR) or vehicle control (DMSO) were immunoblotted as indicated.
F) Upper panel, qPCR analysis in MCF10A cells. Data are presented as mean +/− sd, dots represent technical replicates. Lower panel, WBs in lysate from MCF10A cells as indicated.
G-I) Control or RSK1-silenced MCF10A cells were grown on 3D-PA gels for 5 days. G) Lysates were subjected to LYN immunoprecipitation and immunoblotted as indicated. H) Cells were stained for E-cadherin (green), DAPI (blue) and fibronectin (FN, red). I) Cell phenotypes were quantified as percentage of invasive structures. Data are presented as mean +/− sd, dots represent individual fields.
J) GFP-labelled Control or RSK1-silenced MCF10DCIS cells injected into the mammary gland of NOD/SCID mice. Tumor weight (mg) at the end of the experiment are presented as mean +/− sd, dots represent individual tumors. N=16 tumors per group.
K) Regional (peritoneum) invasion of the primary tumors presented as percentage of total primary tumors. N=8 mice per group.
L) Lung metastatic burden presented as the ratio of the number of GFP+ nodules in the lungs to tumor weight. A.U.: arbitrary units. Data are presented as mean +/− sd, dots represent individual animals. N=8 mice per group.
M) Schematic model of the mechanosensitive activation of EPHA2, LYN and TWIST1.
*** p < 0.001; * p < 0.05; ns: not significant.
See also Figure S6.
Activation of EPHA2 non-canonical signalling correlates with breast tumor progression and metastasis.
To understand whether ECM stiffness regulates EPHA2 and LYN in human breast cancers, shear rheology and force mapping by nanoscale atomic force microscopy (AFM) found a >10-fold increase in Young’s modulus in MCF10DCIS tumors compared to normal mammary gland (Fig. 7A,B). Importantly, DCIS samples showed a higher Y397 phosphorylation level in LYN immunoprecipitates (Fig. 7C,D) and enhanced phosphorylation of EPHA2 on S897, suggesting the activation of LYN kinase and the non-canonical EPHA2 signalling pathway in tumor samples (Fig. 7E,F). We next evaluated EPHA2 S897 phosphorylation by immunohistochemistry (Fig. 7G), and collagen organization as a surrogate marker for tumor tissue stiffness by second harmonic generation (SHG) imaging in a human breast tumor microarray (TMA) containing 197 stage-3 samples. SHG imaging analysis defined more compliant tumor samples with disorganized collagen, comparable to the normal breast tissue stiffness, intermediate tumors harbouring mixed collagen structures, and stiffer tumors with straight and organized collagen fibres (Fig. 7H). Consistent with previous studies, collagen organization in tumor samples correlated with recurrence-free survival, as well as overall survival, (Fig. S7A,B). Interestingly, EPHA2 phosphorylation on S897 is significantly higher in tumors with more organized collagen structures, indicating stiffer breast tumors (Fig. 7I,J). In addition, we analysed the SHG data using previously described tumor-associated collagen signature (TACS1–3), which correlates with breast tumor aggressiveness (Provenzano, et al., 2006). Such collagen signature analysis (Fig. S7C) indicated an enrichment of EPHA2 phosphorylation on S897 in the TACS-3-containing aggressive breast tumors (Fig. 7K,L). These results together show that non-canonical activation of EPHA2 correlates with tissue stiffening in human breast cancer.
Discussion
Recent progress in mechanobiology has led to the identification of new mechanosensors and transmitters that convert mechanical signals from the extracellular compartment to biochemical pathways inside the cell (Broders-Bondon, et al., 2018). We demonstrate here that kinases previously known to regulate axon guidance, cell motility, invasiveness and proliferation are utilized by the mechanotransduction machinery to promote TWIST1-mediated EMT and tumor metastasis in response to increasing matrix stiffness in breast tumors. The finding that LYN kinase specifically regulates this mechanoresponsive pathway led us to successfully inhibit tumor cell invasion in vitro and dissemination and metastasis in vivo in a model of DCIS to IDC tumor progression using the Bcr-Abl/LYN dual inhibitor Bafetinib (INNO-406), previously shown to be safe and well tolerated in patients with chronic myelogenous leukaemia in a phase 1 trial.
Focal adhesions are one of the first characterized molecular platforms that transmit mechanical cues from the ECM to the actin cytoskeleton via integrins and their associated kinases FAK and SRC. More recently, studies have identified additional RTKs, such as AXL and ROR2, in mechanotransduction (Yang, et al., 2016). Our previous study showed that treatment with a β1-integrin blocking antibody could block TWIST1 nuclear translocation and cell invasion in response to high stiffness. However, further mechanistic experiments using the V737N β1-integrin mutant, which mimics mechanoactivation of integrins (Laklai, et al., 2016; Miroshnikova, et al., 2016; Paszek, et al., 2005), did not affect TWIST1 localization (Fig. S4I–K). Inhibition of FAK or SRC did not affect ECM stiffness-dependent regulation of TWIST1 nuclear translocation (Fig. S4A–H). We think that the different results obtained with the β1-integrin blocking antibody vs. FAK/SRC inhibitors is likely due to the fact that treatment with the β1-integrin blocking antibody reduces overall cell-ECM adhesion, thus generally preventing downstream mechanotransduction pathways. Our previous study (Wei, et al., 2015) also revealed that mechanoregulation of TWIST1 is distinct from that of YAP/TAZ, which are responsive to changes in cell shape and actin cytoskeleton to promote cell proliferation (Dupont, et al., 2011; Zhao, et al., 2007). Instead, we identified EPHA2 and LYN as upstream mechanoregulators of TWIST1 and EMT. While we show that ERK and RSK1 are both required for activation of the EPHA2/LYN cascade, oncogenic Ras in both Eph4Ras and MCF10DCIS cells is not sufficient to promote invasion under low rigidities. These results suggest that a number of distinct sensors and transducers, many of which are currently unknown, might cooperate with the conventional integrin mechanotransduction to convert the matrix mechanical cue into TWIST1 phosphorylation and nuclear translocation to promote EMT and invasion. A number of integrins and stretch-activated ion channels are involved in mechanotransduction in various biological context (Majeski and Yang, 2016), future studies are needed to decipher their roles in the LYN/EPHA2/TWIST1 pathway.
Originally characterized as an axon guidance regulator, the EPH-ephrin system mediates cell-cell communication-dependent processes that are critical for embryonic morphogenesis, including germ layer separation (Rohani, et al., 2011), neural crest cell migration (Smith, et al., 1997) or vascular organization (Brantley-Sieders and Chen, 2004). The role of EPHA2 in mechanotransduction upstream of LYN and TWIST1 appears to be specific, since we did not find evidence implicating other EPH receptors expressed in MECs, including EPHA1, EPHA4 and EPHB1. In contrast to the classical response of EPHA2 to its ligands, we demonstrate here that ECM stiffening triggers EPHA2 S897 phosphorylation in a ligand-independent fashion. Interestingly, we show that ligand binding to EPHA2 inhibits stiffness-induced S897 phosphorylation, EMT and invasion. Given the important role of EPH receptors in diverse cell migration processes and axon guidance, we speculate that in the absence of biochemical cues, the signalling status of EPHA2 could be dictated by the mechanical properties of the ECM. Encountering ligands at the target site could switch off the mechanical-competent state of EPHA2 to stop cell migration. Therefore, during diverse cellular processes, extracellular biochemical and mechanical cues could switch on/off the same receptor to dictate distinct intracellular signalling responses and cellular behaviours, thus inserting a new mode of receptor regulation.
While SFKs share high similarities in their protein structures and substrate recognition, our results show that LYN, but not SRC, is uniquely activated in response to matrix stiffness and directly phosphorylates TWIST1 on Y103. LYN is ubiquitously expressed in many human tissues, including the mammary gland. However, to date, most studies on LYN have focused on its role in the hematopoietic system. The role of LYN in breast tumorigenesis is poorly understood and some recent research, in agreement with our data, suggests that LYN expression and/or splicing is important for breast cancer EMT and metastasis (Tornillo, et al., 2018; Tabariès, et al., 2015; Choi, et al., 2010). A recent study reports that LYN regulates EMT and metastasis via the activation of the Vav-Rac1-PAK1 axis leading to SLUG stability (Thaper, et al., 2017). Our current study provides both mechanistic and functional insights on how LYN kinase activity is activated by ECM stiffness to promote EMT and metastasis. The detailed molecular mechanism linking EPHA2 to LYN activation is currently under investigation. Comparing the structures and localization of LYN and SRC might provide clues on how high stiffness selectively activates LYN to promote TWIST1 phosphorylation and cell invasion. Targeting LYN using Bafetinib in patients with collagen-dense breast tumors should be further evaluated as a promising approach to prevent tumor cell dissemination and metastasis using additional in vivo models as well as patient-derived xenografts.
Induction of EMT by matrix stiffness was first observed in human and mouse MECs to promote tumor invasion, and then was shown to be also essential for neural crest migration in Xenopus (Barriga, et al., 2018). Given the conserved roles of EMT and TWIST1 in embryo morphogenesis and tumor metastasis, we speculate that the EPHA2/LYN/TWIST1 mechanotransduction pathway described here is likely to operate not only in tumors, but also during developmental EMT events.
STAR METHODS
RESOURCE AVAILABILITY
Lead Contact
Further information and requests for resources and reagents should be directed to and will be fulfilled by the Lead Contact, Jing Yang (jingyang@ucsd.edu).
Materials availability
All unique/stable reagents generated in this study are available from the Lead Contact with a completed Materials Transfer Agreement.
Data and code availability
This study did not generate/analyse datasets/codes.
EXPERIMENTAL MODEL AND SUBJECT DETAILS
Cell lines
MCF10A and 293T cells were purchased from the ATCC. 293AD cells were purchased from Agilent Technologies. MCF10DCIS cells were obtained from the Miller laboratory (Wayne State University, Detroit). Eph4Ras cells were obtained from the Reichmann laboratory (Zurich, Switzerland).
Mouse strain
For xenograft tumor assay, 6 to 8-week-old female SCID-beige mice CB17.Cg-PrkdcscidLystbg-J/Crl were purchased from Charles River.
METHOD DETAILS
Cell culture
MCF10A and MCF10DCIS cells were grown in DMEM/F12 media supplemented with 5% horse serum, 20 ng/ml human EGF (hEGF), 10 μg/ml insulin, 0.5 μg/ml hydrocortisone, 1% penicillin and streptomycin, and 100ng/ml cholera toxin. Eph4Ras cells were cultured as previously described in MEGM mixed 1:1 with DMEM/F12 media supplemented with 10ng/ml hEGF, 10 μg/ml insulin, 0.5 μg/ml hydrocortisone, 1% penicillin and streptomycin (Eckert, et al., 2011). 293T and 293AD cells were cultured in DMEM media supplemented with 10% foetal bovine serum (FBS) and 1% penicillin and streptomycin. All cell lines were tested negative for mycoplasma contamination.
DNA constructs
For His-tag purification using Ni-NTA beads, TWIST1 was cloned into the pcDNA4B-Myc-His6. pLV-Puro-LYN WT and pLV-Puro-LYN Y508F were custom ordered from Vectorbuilder. pEGFP-C1-G3BP2 construct was kindly provided by C. Dargemont (Institut Curie, Paris, France). We generated pLVX-IRES-Neo (Clontech, # 632181) constructs encoding EPHA2 with the Strep-tag II sequence (WSHPQFEK) at the N-terminus, which in some constructs was preceded by a FLAG tag sequence. As a control, we used a construct encoding EPHA2 wild-type with only an N-terminal FLAG sequence (Barquilla, et al., 2016). In addition, we generated LYN constructs encoding LYN with a C-terminal Myc tag in pLV-Puro (Vectorbuilder) to distinguish introduced LYN from endogenously expressed LYN. The pKH-RSK1 construct was kindly provided by Prof. S. Taylor (UCSD). The RSK1 cDNA was subcloned into the retroviral pWB backbone and the kinase dead (KD) RSK1 was obtained by double mutation of K94R and K447R. Tagged constructs and mutants were obtained by site-directed mutagenesis using the QuikChange II kit (Agilent) or by overlapping PCR.
Generation of stable cell lines
Stable gene knockdown cell lines were generated using lentiviral or retroviral plasmid vectors. Briefly, 293T cells were transfected with pCMVΔ8.2R (for lentivirus) or pUMVC3 (for retrovirus), VSVG and the pLKO.1 construct containing the shRNA of interest, pLV lentiviral construct expressing LYN or EPHA2 or pWB retroviral construct expressing RSK1 (ratio 2:1:10). Viral supernatants were then concentrated using Lenti-X™ concentrator (Takara). Concentrated viral supernatants were applied to target cells with 6 μg/ml protamine sulfate. Infection was repeated the next day. Infected cells were then selected with puromycin (2 μg/ml), G418 (400 μg/ml) or Blasticidin (5 μg/ml).
Polyacrylamide hydrogel preparation
Hydrogels were prepared as previously described on 12 mm and 25 mm coverslips (Chaudhuri, et al., 2010). Briefly, No. 1 glass coverslips were etched using UV/Ozone Procleaner Plus, functionalized using 3-Aminopropyltriethoxysilane, rinsed with dH2O, incubated in 0.5% gluteraldehyde in PBS, dried, and then acrylamide/bis-acrylamide mixtures were polymerized between the functionalized coverslip and a glass slide coated with dichlorodimethylsiloxane. Polyacrylamide coated coverslips were then washed twice with dH2O, incubated with 1mM Sulfo-SANPAH in HEPES buffer under 365nm UV light for 10 minutes, rinsed twice with 50mM HEPES pH 8.5 buffer, incubated at 37°C overnight with rat tail Collagen I (Millipore) in 50mM HEPES pH 8.5 buffer, rinsed twice in PBS, and sterilized. For IP-LC-MS/MS experiments, custom-made easy-coat 100mm Petrisoft dishes were purchased from Matrigen (La Brea, CA, USA).
3-dimensional (3D) cell culture
MCF10A and Eph4Ras cells were grown in 3D cell culture as previously described (Debnath, et al., 2003). Briefly, Eph4Ras cells were seeded on top of collagen-coated hydrogels in 2% Matrigel-MEGM mixed 1:1 with DMEM/F12 and MCF10A cells were seeded similarly in DMEM/F12 medium supplemented with 2% horse serum, 5 ng/ml human EGF, 10 μg/ml insulin, 0.5 μg/ml hydrocortisone, penicillin, streptomycin, and 100 ng/ml cholera toxin.
3D confocal microscopy
Our protocol was adapted from the method described by Debnath et al (Debnath, et al., 2003). Briefly, cells were fixed with 2% paraformaldehyde (PFA) for 20 minutes at room temperature, permeabilized with PBS-0.5% Triton X-100 for 10 minutes, quenched with 3 washes of 100mM PBS-glycine, and then blocked with 20% goat serum in immunofluorescence (IF) buffer. Samples were incubated with primary antibodies overnight in 20% goat serum-IF buffer, washed 3 times with IF buffer, incubated with secondary antibodies (1:200 dilution) for 1 hour at room temperature, and mounted in DAPI-containing mounting medium (Vector Laboratories). Confocal images were acquired using an Olympus FV1000 with 405, 488, 555, and 647 laser lines. Images were linearly analysed and pseudo-coloured using ImageJ analysis software.
Second Harmonic Generation Microscopy
An SP8 resonant laser-scanning confocal system mounted on a DM 6000 upright microscope (Leica Microsystems) with a 10× or 25× air objective, 0.4 NA was used for second-harmonic generation microscopy. A Ti-Sapphire femtosecond pulsed Chameleon Ultra II (Coherent Inc.) laser was tuned to 855 nm and the emitted fluorescent signal was recorded with a non-descanned hybrid detector fitted with a 425/26 nm bandpass filter. To increase the signal to noise ratio, 1248×1248 pixel 8-bit images (0.6 μm/pixel) were acquired with 16× line averaging and 8 frames image accumulation. Images were exported as TIFF files and analysed with CT-FIRE module from the CurveAlign software.
Tumor tissue microarrays
Stage 3 breast cancer progression tumor tissue microarrays (TMAs) from the National Cancer Institute Cancer Diagnosis Program were stained for phospho-Ser897 EPHA2 by immunohistochemistry for retrospective analysis. TMAs were concurrently scanned using the NanoZoomer Slide Scanner with a 10× objective and imaged by SHG.
Immunoprecipitation
Cells were lysed using a 2-step protocol adapted from Klenova et al (Klenova, et al., 2002). Cells were directly lysed with lysis buffer (20mM Tris-HCl, 1% Triton X-100, 10mM MgCl2, 10mM KCl, 2mM EDTA, 1mM NaF, 1mM sodium orthovanadate, 2.5mM beta-glycerophosphate, 10% glycerol, pH 7.5), scraped off the culture dish, sonicated, supplemented to 400mM NaCl, sonicated, and diluted to 200mM NaCl. Lysates were precleared with protein G beads for 1 hour at 4°C. Antibodies were conjugated to protein G beads (Invitrogen), crosslinked using disuccinimidyl suberate (Pierce) as per manufacturer’s protocol, incubated with lysates overnight at 4°C, washed eight times with IP lysis buffer supplemented with 200 mM NaCl, and eluted by incubation LDS sample buffer with 50 mM DTT at 70°C for 15 minutes. 5B7 mouse hybridoma concentrated supernatant was used for endogenous TWIST1 immunoprecipitation. For immunoprecipitation of exogenously transfected Myc-TWIST1, 293T cell lysates were harvested 48 hours after transfection and subjected to the 2-step lysis protocol. Immunoprecipitation was performed using anti-Myc antibody (9E10) crosslinked to protein A agarose beads (Invitrogen).
Mass Spectrometry
After immunoprecipitation and washing, beads were washed 3 times with PBS and snap-frozen before being subjected to on-bead digestion. Trypsin-digested peptides were analysed by ultra-high-pressure liquid chromatography (UPLC) coupled with tandem mass spectroscopy (LCMS/MS) using nanospray ionization. The nanospray ionization experiments were performed using an Orbitrap fusion Lumos hybrid mass spectrometer (Thermo) interfaced with nanoscale reversed-phase UPLC (Thermo Dionex UltiMate™ 3000 RSLC nano System) using a 25 cm, 75-micron ID glass capillary packed with 1.7-μm C18 (130) BEH™ beads (Waters corporation). Peptides were eluted from the C18 column into the mass spectrometer using a linear gradient (5–80%) of ACN (Acetonitrile) at a flow rate of 375 μl/min for 1h. The buffers used to create the ACN gradient were: Buffer A (98% H2O, 2% ACN, 0.1% formic acid) and Buffer B (100% ACN, 0.1% formic acid). Mass spectrometer parameters are as follows; an MS1 survey scan using the orbitrap detector (mass range (m/z): 400–1500 (using quadrupole isolation), 60000 resolution setting, spray voltage of 2400 V, Ion transfer tube temperature of 285 C, AGC target of 400000, and maximum injection time of 50 ms was followed by data dependent scans (top speed for most intense ions, with charge state set to only include +2–5 ions, and 5 second exclusion time, while selecting ions with minimal intensities of 50000 at in which the collision event was carried out in A- high energy collision cell (HCD Collision Energy of 30%), and the fragment masses where analysed in the ion trap mass analyser (with ion trap scan rate of turbo, first mass m/z was 100, AGC Target 5000 and maximum injection time of 35 ms). Data analysis was carried out using Peaks 8.5 (bioinformatics Solutions).
Proximity Ligation Assay
Cells were cultured on 3D-PA gels for 20 hours or 6 days and fixed and processed as described for immunofluorescence before performing Duolink PLA (Sigma Aldrich) as per manufacturer’s protocol. Briefly, mouse anti-TWIST1 and rabbit anti-G3BP2 primary antibodies were used to detect endogenous proteins and subsequently recognized using species specific plus and minus PLA oligonucleotide conjugated probes at 37°C for 60 minutes. Interacting probes were then ligated at 37°C for 30 minutes and detected by polymerase mediated amplification at 37°C for 100 minutes and subsequently analysed by fluorescent confocal microscopy. For analysis of formed 5-day acini, a minimum 50 cells from 5 random fields were quantified per condition. To quantify the PLA signal, images were converted to 8-bit images and thresholded, the area of PLA signal was then quantified and normalized to cell number using ImageJ.
Real-time PCR
RNA was extracted from cells using Tri Reagent (Sigma Aldrich). cDNA was generated using random hexamer primers and cDNA Reverse Transcription Kit (Applied Biosystems). Expression values were generated using ddCt values normalized to murine Gapdh or human HPRT. Experiments were performed in biological and technical triplicate. For data analysis in each comparison (one shRNA vs. the control shRNA), unpaired two-tailed Student’s T-tests with Welch’s correction was used to determine statistical significance.
In vitro Phosphorylation Assay with Radioactive ATP
Myc-His6-Twist1 WT and Y107F were pulled down from transfected 293T cells using Ni-NTA agarose resin. Recombinant active LYN was purchased form Sigma. Phosphorylation reactions were carried out in the presence of 100 mM MOPS (pH 7.2), 4 mM free Mg2+, 2.5 mM Mn2+ and 50 μg/ml BSA at 37°C. All reactions were carried out in a total volume of 10 μl and quenched with 10 μl of SDS/PAGE loading buffer. Phosphorylated proteins were separated from unreacted 32P-ATP by SDS-PAGE (12% gel), cut from the dried gel and quantified on the 32P channel in liquid scintillant.
In vitro Cold Phosphorylation Assay
Myc-His6-Twist1 WT and Y107F were pulled down from transfected 293T cells using Ni-NTA agarose resin. Endogenous LYN or SRC were immunoprecipitated from 3D-cultured MCF10A cells grown on low and high stiffness PA gels for 5 days. Phosphorylation reactions were carried out in the presence of 100 mM MOPS (pH 7.2), 4 mM free Mg2+, 2.5 mM Mn2+, 50 μg/ml BSA and 500 μM ATP at 37°C for 1 hour. Recombinant LYN (Sigma Aldrich) was used as a positive control.
Ni-NTA purification
Myc-His6-Twist1 WT and Y107F were pulled down from transfected 293T using HisPur Ni-NTA agarose resin (ThermoFisher). Briefly, cells were lysed using a 2-step lysis protocol as described in the immunoprecipitation section, supplemented with 5mM imidazole. Ni-NTA resin was washed 3 times with lysis buffer containing 5mM imidazole and then incubated with the lysates overnight at 4°C. The resin was then washed 3 times with lysis buffer supplemented with 250mM NaCl and 15mM imidazole, 3 times with lysis buffer supplemented with 250mM NaCl and 30mM imidazole and then eluted in lysis buffer supplemented with 250mM NaCl and 200mM imidazole for 10 minutes at 4°C. The eluates were used for in vitro kinase assays or western blots.
Tyrosine Kinases Screen
Wild type (GSPQSYEELQTQRR) and Y107F mutant (GSPQSFEELQTQRR) TWIST1 peptides were synthesized to evaluate the activity of 73 protein kinases. The two peptide substrates were profiled against 73 protein kinases (at 500 μM) using the radiometric assay method (Kinexus, Canada). The intra-assay variability was determined to be less than 10%. A comparison of the difference in counts between the WT and Y107F peptides was analysed as the percentage change from control (Y107F peptide used as control).
Strep-Tactin Pulldown
EPHA2 and LYN cDNAs were transiently transfected into 293AD cells with Lipofectamine 2000 (Life Technologies) according to the recommendations of the manufacturer. Cells were incubated with the DNA-Lipofectamine complexes in Opti-MEM for 4 hours and then the medium was replaced with culture medium. Twenty-four hours after transfection, the cells were washed once with cold PBS containing calcium and magnesium and collected in 300 μl 0.5% TX-100 in PBS with Halt protease and phosphatase inhibitor cocktail (Fisher Scientific), centrifuged at 17,000g at 4C for 10 min, and frozen. For pull-down, cell lysates were precleared at 4°C for 15 min with 20 μl Sepharose 4B beads (Sigma Aldrich) and then incubated at 4°C for 2 hours with 20 μl Strep-Tactin XT Superflow beads (IBA GmbH) on a rotating wheel. The beads were then washed 4 times with cold 0.5% TX-100 in PBS and once with cold PBS. Proteins bound to the beads were eluted in 25 μl Bolt LDS sample buffer (Life Technologies) by heating at 95°C for 2 min. Proteins were separated by SDS-PAGE using Bolt 4–12% Bis-Tris Plus gels (Life Technologies) using Bolt MOPS SDS running buffer (Life Technologies) and transferred to PVDF membranes for immunoblotting using a Bio-Rad Trans-Blot Turbo Transfer System.
Rheology measurement of tumor tissue stiffness
Samples (normal mouse mammary gland or tumor) were prepared to an individual diameter where each was cut in half and each portion was measured along with major and minor axis with a set of calipers, and thickness of each portion was measured by contact micrometre. An average thickness was used for sample compression. Samples were placed in pairs on opposite sides of porous platens centred at a defined radius, r, of 30 mm. From the average thickness measurement, 20% compression was applied at 0.1 mm/sec, allowed to relax for 10 sec, and then subjected to dynamic shear (±1°, 1 Hz, 10 cycles) with a rotational actuator attached to an Electroforce ELF 3200 system (Bose, Eden Prairie, MN). After testing, samples were snap frozen in liquid nitrogen and stored at −80°C for protein analysis. Biomechanical data were processed to obtain torque amplitude and phase, which were used to determine shear modulus, G. Data were analysed by ANOVA, with significance set at p < 0.05. Data are mean ± sd.
Masson Trichrome Staining
5um paraffin-embedded sections were deparaffinized, rehydrated and incubated in Bouin’s Solution (Sigma, HT10132) overnight at room temperature. Slides were washed in running tap water, rinsed in distilled water and stain with Weigert’s Iron Hematoxylin set (Sigma, HT1079). Slides were washed in running tap water and then the collagen content was stained using the Accustain Trichrome Satin kit (Sigma, HT15). Slides were then dehydrated and mounted in xylene-based Permount. Slides were scanned NanoZoomer Slide Scanner with a 10× objective and tumor area, as well as collagen area, was determined using Image J software.
Xenograft Tumor Assay
1.0 × 10⁶ GFP-labelled MCF10DCIS cells suspended in 15 μl Matrigel (50%, diluted in DMEM/F12) were injected bilaterally into the inguinal mammary fat pads of 6 to 8-week-old female SCID-beige mice CB17.Cg-PrkdcscidLystbg-J/Crl. Tumors were allowed to grow for 3 weeks until they reached 5 mm in diameter. Mice were then treated for 21 days with daily oral administration of vehicle control (0.5% Methylcellulose, 0.2% Tween 80) or the dual Bcr-Abl/LYN inhibitor Bafetinib (2.5 or 10mg/kg/day) purchased from Selleckchem. As a negative control group, mice were treated with daily oral administration of vehicle control (4% DMSO, 30% PEG300, 5% Tween 80) or Bcr-Abl specific inhibitor Nilotinib (50 mg/kg/day) purchased from Selleckchem. Mouse weight and tumor sizes were monitored for 6 weeks post tumor cell implantation, until mice were sacrificed and tumor burden analysed. Mice were dissected and tumor invasion assessed in situ using a fluorescent dissection scope (Leica Microsystems). All work with animals was performed in accordance with UC San Diego IACUC and AAALAC guidelines.
QUANTIFICATION AND STATISTICAL ANALYSIS
Invasive Acini Quantification
Invasive acini were quantified using brightfield images with at minimum 5 random low-magnification fields being analysed per condition per experiment. Acini were scored as either normally developed acini or acini that adopted a spread and invasive phenotype.
TWIST1 nuclear staining quantification
50–200 individual cells per condition were quantified for TWIST1 nuclear (gated on the DAPI signal) and cytoplasmic mean intensities using ImageJ, and the relative percentage of TWIST1 nuclear staining was calculated. Analysis excluded cells on the edge of the image.
Quantification of IHC signals from TMAs
Missing and damaged cores, and cores without detectable tumor cells, were omitted from analyses. Cores were scored blindly. Phospho-S897 EPHA2 expression was scored 0 for no detectable expression, 1 for very weak expression, 2 for moderate expression, 3 for strong expression in 0–75% of tumor cells, and 4 for strong expression in greater than 75% of tumor cells. Phospho-S897 EPHA2 was then divided into pS897low including scores 0, 1 and 2 and pS897high including scores 3 and 4.
Quantification of SHG signals from TMAs
Images were exported as TIFF files and analysed with CT-FIRE module from the CurveAlign software. The scoring rubric (which was defined prior to blinded scoring) for SHG analysis was defined as “organized collagen” in tumors having prominent linearized collagen fibres or as “disorganized collagen” in tumors having collagen fibres with high degree of circularity (i.e. curved). we analysed the SHG data using previously described tumor-associated collagen signature (TACS), which correlates with breast tumor aggressiveness (Provenzano, et al., 2006): short and curly collagen structures, or TACS-1, are enriched in normal breast tissue or benign tumors; thicker aligned collagen fibres stretch and distribute tangentially to a smooth tumor boundary as tumor grow (TACS-2; 0° angle relative to tumor boundary); in more invasive breast tumors, TACS-3 defines thick collagen fibres, aligned perpendicularly to more irregular tumor boundaries, indicative of areas of local invasion and dissemination (close to 90° angle between collagen fibres and tumor boundary).
Statistical Analysis
Statistical analyses were performed using GraphPad Prism software. All p-values were derived from Student’s t-test using unpaired two-tailed analysis with Welch’s correction. Error bars denote standard deviation. Kaplan-Meier survival curves were analysed by Cox-Mantel Log-rank analysis using GraphPad Prism software. The correlation between collagen organization or TACS signatures and phopsho-S897 EPHA2 signal in human breast cancer patients’ samples (TMA analysis) was analysed using a χ2 test. Statistical significance was defined as *, ** or *** for p < 0.05, p < 0.01 or p < 0.001, respectively, with regard to the null hypothesis. All qualitative representative data shown were repeated in at least 3 independent biological replicates.
Supplementary Material
KEY RESOURCES TABLE
| REAGENT or RESOURCE | SOURCE | IDENTIFIER |
|---|---|---|
| Antibodies | ||
| G3BP2 | Sigma-Aldrich | Cat#HPA018304; RRID: AB_1849350 |
| TWIST1 | Santa Cruz Biotechnology | Cat#81417; RRID: AB_1130910 |
| TWIST1 | Hybridoma | Clone 5b7 |
| pY103 Twist1 | Abgent | Cat#AP22382a |
| EPHA2 | Cell Signaling Technology | Cat#6997; RRID: AB_10827743 |
| EPHA1 | R&D Systems | Cat#AF638; RRID: AB_2098926 |
| EPHA4 | ThermoFisher | Cat#37–1600; RRID: AB_2533301 |
| EphrinA1 | Abcam | Cat# 124911; RRID: AB_10974078 |
| LYN | Cell Signaling Technology | Cat#2796; RRID: AB_2138391 |
| FRK | Assay Biotechnology | Cat#C10609; RRID: AB_10685478 |
| Myc | Hybridoma | Clone 9E10 |
| Myc | Cell Signaling Technology | Cat#2276; RRID: AB_331783 |
| pY416 SFK | Cell Signaling Technology | Cat#2101; RRID: AB_331697 |
| pY527 SFK | Cell Signaling Technology | Cat#2105; RRID: AB_331034 |
| SRC | Cell Signaling Technology | Cat#2109; RRID: AB_2106059 |
| GAPDH | Genetex | Cat#GTX100118; RRID: AB_1080976 |
| GFP | Abcam | Cat#Ab13970; RRID: AB_300798 |
| Flag | Sigma Aldrich | Cat#F3165; RRID: AB_259529 |
| Flag | Cell Signaling Technology | Cat#14793; RRID: AB_2572291 |
| pY397 FAK | Cell Signaling Technology | Cat#8556; RRID: AB_10891442 |
| RSK1 | Cell Signaling Technology | Cat#9333; RRID: AB_2181177 |
| pRSK (pS380) | Cell Signaling Technology | Cat#9335; RRID: AB_561151 |
| AKT | Cell Signaling Technology | Cat#9272; RRID: AB_329827 |
| pAKT (pT308) | Cell Signaling Technology | Cat#9275; RRID: AB_329828 |
| ERK1/2 | Cell Signaling Technology | Cat#4695; RRID: AB_390779 |
| pERK1/2 (pT202/Y204) | Cell Signaling Technology | Cat#4370; RRID: AB_2315112 |
| Integrin β1 | Santa Cruz Biotechnology | Cat#374430; RRID: AB_10991321 |
| Mouse IgG control (IP) | Santa Cruz Biotechnology | Cat#2025; RRID: AB_737182 |
| Rabbit IgG control (IP) | Cell Signaling Technology | Cat#2729; RRID: AB_1031062 |
| pS897 EPHA2 | Cell Signaling Technology | Cat#6347; RRID: AB_11220420 |
| pY588 EPHA2 | Cell Signaling Technology | Cat#12677; RRID: AB_2797989 |
| Goat anti-Mouse-HPR | Jackson Immunoresearch | Cat#115-035-003; RRID: AB_10015289 |
| Goat anti-Rabbit-HPR | Jackson Immunoresearch | Cat#111-035-144; RRID: AB_2307391 |
| Bovine anti-Goat-HPR | Jackson Immunoresearch | Cat#805-035-180; RRID: AB_2340874 |
| Goat anti-Mouse Alexa Fluor 488 | Invitrogen | Cat#A-11001; RRID: AB_2534069 |
| Goat anti-Rabbit Alexa Fluor 546 | Invitrogen | Cat#A-11010; RRID: AB_2534077 |
| Biological Samples | ||
| CDP Breast Cancer Stage III Prognostic TMA | NCI | N/A |
| Chemicals, Peptides, and Recombinant Proteins | ||
| Recombinant active LYN | Sigma Aldrich | Cat#SRP5277 |
| Recombinant ephrinA1-Fc | R&D Systems | Cat#602-A1–200 |
| Bafetinib | Selleckchem | Cat#S1369 |
| Nilotinib | Selleckchem | Cat#S1033 |
| BI-D1870 | Selleckchem | Cat#S2843 |
| PP2 | Selleckchem | Cat#S7008 |
| VS-4718 | Schlaepfer lab (UCSD) | N/A |
| FR180204 | Burgoyne lab (UCSD) | N/A |
| PF-0691502 | Burgoyne lab (UCSD) | N/A |
| Critical Commercial Assays | ||
| Duolink Proximity Ligation Assay | Sigma Aldrich | Cat#DUO92007 |
| Accustain Trichrome Satin kit | Sigma Aldrich | Cat#HT15 |
| Experimental Models: Cell Lines | ||
| MCF10A | ATCC | Cat#CRL-10317; RRID: CVCL_0598 |
| MCF10DCIS | Miller lab |
Miller et al., 2000; RRID: CVCL_5552 |
| EpH4Ras | Reichmann lab (Zurich) | N/A |
| 293T | ATCC | Cat#ACS-4500; RRID: CVCL_0063 |
| 293AD | Agilent Technologies | Cat#240085; RRID: CVCL_KA63 |
| Experimental Models: Organisms/Strains | ||
| Mouse: CB17.Cg-PrkdcscidLystbg-J/Crl | Charles River | Cat#250; RRID: IMSR_CRL:250 |
| Oligonucleotides | ||
| Primers for qPCR | Designed using PrimerBank | See Table S1 |
| shRNA sequences | Sigma Aldrich | See Table S2 |
| Recombinant DNA | ||
| pcDNA4B-Myc-His6-TWIST1 WT and Y107F | This paper | N/A |
| pLV-Puro-LYN WT and Y508F | Vectorbuilder | Custom order |
| pEGFP-C1-G3BP2 | Dargemont lab (Paris) | N/A |
| pLVX-IRES-Neo | Clontech | Cat#632181 |
| pKH-RSK1 | Taylor lab (UCSD) | N/A |
| pWB-RSK1 WT and K94R/K447R | This paper | N/A |
| Software and Algorithms | ||
| ImageJ | NIH | https://imagej.nih.gov/ij/ |
| PRISM | Graphpad | N/A |
| CurveAlign | LOCI | https://loci.wisc.edu/software/curvealign |
Highlights.
High ECM stiffness activates LYN kinase to promote EMT and invasion. LYN directly phosphorylates TWIST1 to promote nuclear localization of TWIST1. High ECM stiffness promotes ligand-independent EPHA2 signaling to activate LYN. EPHA2/LYN axis promotes breast tumor invasion and metastasis.
Acknowledgements
We thank members of the Yang lab, especially H. Majeski and D. Kim, for technical advice and helpful discussions. We thank the La Jolla Institute microscopy core, in particular Z. Mikulski for SHG imaging, M. Ghassemian at the UCSD mass spectrometry core as well as M. Makale for technical support and advice. We thank D. Shlaepfer for the FAK inhibitor, A. Burgoyne for AKT and ERK inhibitors, V. Weaver for the V737N integrin constructs, Y. Zhou for the pS897 EPHA2 IHC protocol, S. Taylor for RSK1 constructs, C. Dargemont for pEGFPC1-G3BP2 construct, and M. Aumailley for anti-laminin V antibody. We thank the UCSD Shared Microscope Facility and UCSD Cancer Center Support Grant P30 CA23100 from NCI. This work was supported by grants from NCI (1RO1CA168689, 1R01CA174869, 1R01CA206880, and 1R01CA236386) to J.Y., a pilot grant from Cancer Center Support grant P30 CA030199 and Sanford Burnham Prebys Institutional funding to E.B.P, and grant PTC2017 from Padres Pedal the Cause to J.Y. and E.P.. L.F. was supported by an AACR Basic Cancer Research fellowship.
Footnotes
Publisher's Disclaimer: This is a PDF file of an unedited manuscript that has been accepted for publication. As a service to our customers we are providing this early version of the manuscript. The manuscript will undergo copyediting, typesetting, and review of the resulting proof before it is published in its final form. Please note that during the production process errors may be discovered which could affect the content, and all legal disclaimers that apply to the journal pertain.
Declaration of interests
The authors declare no competing interests.
References
- Barquilla A, Lamberto I, Noberini R, Heynen-Genel S, Brill LM, and Pasquale EB (2016). Protein kinase A can block EphA2 receptor-mediated cell repulsion by increasing EphA2 S897 phosphorylation. Mol Biol Cell 27, 2757–70. [DOI] [PMC free article] [PubMed] [Google Scholar]
- Barriga EH, Franze K, Charras G, and Mayor R (2018). Tissue stiffening coordinates morphogenesis by triggering collective cell migration in vivo. Nature 554, 523–527. [DOI] [PMC free article] [PubMed] [Google Scholar]
- Boyd NF, Dite GS, Stone J, Gunasekara A, English DR, McCredie MR, Giles GG, Tritchler D, Chiarelli A, Yaffe MJ, et al. (2002). Heritability of mammographic density, a risk factor for breast cancer. N Engl J Med 347, 886–94. [DOI] [PubMed] [Google Scholar]
- Brabletz T, Kalluri R, Nieto MA, and Weinberg RA (2018). EMT in cancer. Nat Rev Cancer 18, 128–134. [DOI] [PubMed] [Google Scholar]
- Brantley-Sieders DM, and Chen J (2004). Eph receptor tyrosine kinases in angiogenesis: from development to disease. Angiogenesis 7, 17–28. [DOI] [PubMed] [Google Scholar]
- Broders-Bondon F, Nguyen Ho-Bouldoires TH, Fernandez-Sanchez ME, and Farge E (2018). Mechanotransduction in tumor progression: The dark side of the force. J Cell Biol 217, 1571–1587. [DOI] [PMC free article] [PubMed] [Google Scholar]
- Cartwright CA, Eckhart W, Simon S, and Kaplan PL (1987). Cell transformation by pp60c-src mutated in the carboxy-terminal regulatory domain. Cell 49, 83–91. [DOI] [PubMed] [Google Scholar]
- Chang JM, Park IA, Lee SH, Kim WH, Bae MS, Koo HR, Yi A, Kim SJ, Cho N, and Moon WK (2013). Stiffness of tumours measured by shear-wave elastography correlated with subtypes of breast cancer. Eur Radiol 23, 2450–8. [DOI] [PubMed] [Google Scholar]
- Chaudhuri T, Rehfeldt F, Sweeney HL, and Discher DE (2010). Preparation of collagen-coated gels that maximize in vitro myogenesis of stem cells by matching the lateral elasticity of in vivo muscle. Methods Mol Biol 621, 185–202. [DOI] [PMC free article] [PubMed] [Google Scholar]
- Choi YL, Bocanegra M, Kwon MJ, Shin YK, Nam SJ, Yang JH, Kao J, Godwin AK, and Pollack JR (2010). LYN is a mediator of epithelial-mesenchymal transition and a target of dasatinib in breast cancer. Cancer Res 70, 2296–306. [DOI] [PMC free article] [PubMed] [Google Scholar]
- Colpaert C, Vermeulen P, Van Marck E, and Dirix L (2001). The presence of a fibrotic focus is an independent predictor of early metastasis in lymph node-negative breast cancer patients. Am J Surg Pathol 25, 1557–8. [DOI] [PubMed] [Google Scholar]
- Debnath J, Muthuswamy SK, and Brugge JS (2003). Morphogenesis and oncogenesis of MCF-10A mammary epithelial acini grown in three-dimensional basement membrane cultures. Methods 30, 256–68. [DOI] [PubMed] [Google Scholar]
- Dupont S, Morsut L, Aragona M, Enzo E, Giulitti S, Cordenonsi M, Zanconato F, Le Digabel J, Forcato M, Bicciato S, et al. (2011). Role of YAP/TAZ in mechanotransduction. Nature 474, 179–83. [DOI] [PubMed] [Google Scholar]
- Eckert MA, Lwin TM, Chang AT, Kim J, Danis E, Ohno-Machado L, and Yang J (2011). Twist1-induced invadopodia formation promotes tumor metastasis. Cancer Cell 19, 372–86. [DOI] [PMC free article] [PubMed] [Google Scholar]
- Hasebe T, Sasaki S, Imoto S, Mukai K, Yokose T, and Ochiai A (2002). Prognostic significance of fibrotic focus in invasive ductal carcinoma of the breast: a prospective observational study. Mod Pathol 15, 502–16. [DOI] [PubMed] [Google Scholar]
- Johnson KR, Leight JL, and Weaver VM (2007). Demystifying the effects of a three-dimensional microenvironment in tissue morphogenesis. Methods Cell Biol 83, 547–83. [DOI] [PMC free article] [PubMed] [Google Scholar]
- Klenova E, Chernukhin I, Inoue T, Shamsuddin S, and Norton J (2002). Immunoprecipitation techniques for the analysis of transcription factor complexes. Methods 26, 254–9. [DOI] [PubMed] [Google Scholar]
- Kmiecik TE, and Shalloway D (1987). Activation and suppression of pp60c-src transforming ability by mutation of its primary sites of tyrosine phosphorylation. Cell 49, 65–73. [DOI] [PubMed] [Google Scholar]
- Laklai H, Miroshnikova YA, Pickup MW, Collisson EA, Kim GE, Barrett AS, Hill RC, Lakins JN, Schlaepfer DD, Mouw JK, et al. (2016). Genotype tunes pancreatic ductal adenocarcinoma tissue tension to induce matricellular fibrosis and tumor progression. Nat Med 22, 497–505. [DOI] [PMC free article] [PubMed] [Google Scholar]
- Levental KR, Yu H, Kass L, Lakins JN, Egeblad M, Erler JT, Fong SF, Csiszar K, Giaccia A, Weninger W, et al. (2009). Matrix crosslinking forces tumor progression by enhancing integrin signaling. Cell 139, 891–906. [DOI] [PMC free article] [PubMed] [Google Scholar]
- Li JY, Xiao T, Yi HM, Yi H, Feng J, Zhu JF, Huang W, Lu SS, Zhou YH, Li XH, et al. (2019). S897 phosphorylation of EphA2 is indispensable for EphA2-dependent nasopharyngeal carcinoma cell invasion, metastasis and stem properties. Cancer Lett 444, 162–174. [DOI] [PubMed] [Google Scholar]
- Lu P, Weaver VM, and Werb Z (2012). The extracellular matrix: a dynamic niche in cancer progression. J Cell Biol 196, 395–406. [DOI] [PMC free article] [PubMed] [Google Scholar]
- Majeski HE, and Yang J (2016). The 2016 John J. Abel Award Lecture: Targeting the Mechanical Microenvironment in Cancer. Mol Pharmacol 90, 744–754. [DOI] [PMC free article] [PubMed] [Google Scholar]
- Martino F, Perestrelo AR, Vinarsky V, Pagliari S, and Forte G (2018). Cellular Mechanotransduction: From Tension to Function. Front Physiol 9, 824. [DOI] [PMC free article] [PubMed] [Google Scholar]
- Miao H, Li DQ, Mukherjee A, Guo H, Petty A, Cutter J, Basilion JP, Sedor J, Wu J, Danielpour D, et al. (2009). EphA2 mediates ligand-dependent inhibition and ligand-independent promotion of cell migration and invasion via a reciprocal regulatory loop with Akt. Cancer Cell 16, 9–20. [DOI] [PMC free article] [PubMed] [Google Scholar]
- Miller FR, Santner SJ, Tait L, and Dawson PJ (2000). MCF10DCIS.com xenograft model of human comedo ductal carcinoma in situ. J Natl Cancer Inst 92, 1185–6. [DOI] [PubMed] [Google Scholar]
- Miroshnikova YA, Mouw JK, Barnes JM, Pickup MW, Lakins JN, Kim Y, Lobo K, Persson AI, Reis GF, McKnight TR, et al. (2016). Tissue mechanics promote IDH1-dependent HIF1alpha-tenascin C feedback to regulate glioblastoma aggression. Nat Cell Biol 18, 1336–1345. [DOI] [PMC free article] [PubMed] [Google Scholar]
- Mujtaba SS, Ni YB, Tsang JY, Chan SK, Yamaguchi R, Tanaka M, Tan PH, and Tse GM (2013). Fibrotic focus in breast carcinomas: relationship with prognostic parameters and biomarkers. Ann Surg Oncol 20, 2842–9. [DOI] [PubMed] [Google Scholar]
- Paraiso KH, Das Thakur M, Fang B, Koomen JM, Fedorenko IV, John JK, Tsao H, Flaherty KT, Sondak VK, Messina JL, et al. (2015). Ligand-independent EPHA2 signaling drives the adoption of a targeted therapy-mediated metastatic melanoma phenotype. Cancer Discov 5, 264–73. [DOI] [PMC free article] [PubMed] [Google Scholar]
- Park CC, Zhang H, Pallavicini M, Gray JW, Baehner F, Park CJ, and Bissell MJ (2006). Beta1 integrin inhibitory antibody induces apoptosis of breast cancer cells, inhibits growth, and distinguishes malignant from normal phenotype in three dimensional cultures and in vivo. Cancer Res 66, 1526–35. [DOI] [PMC free article] [PubMed] [Google Scholar]
- Pasquale EB (2008). Eph-ephrin bidirectional signaling in physiology and disease. Cell 133, 38–52. [DOI] [PubMed] [Google Scholar]
- Pasquale EB (2010). Eph receptors and ephrins in cancer: bidirectional signalling and beyond. Nat Rev Cancer 10, 165–80. [DOI] [PMC free article] [PubMed] [Google Scholar]
- Paszek MJ, Zahir N, Johnson KR, Lakins JN, Rozenberg GI, Gefen A, Reinhart-King CA, Margulies SS, Dembo M, Boettiger D, et al. (2005). Tensional homeostasis and the malignant phenotype. Cancer Cell 8, 241–54. [DOI] [PubMed] [Google Scholar]
- Provenzano PP, Eliceiri KW, Campbell JM, Inman DR, White JG, and Keely PJ (2006). Collagen reorganization at the tumor-stromal interface facilitates local invasion. BMC Med 4, 38. [DOI] [PMC free article] [PubMed] [Google Scholar]
- Rohani N, Canty L, Luu O, Fagotto F, and Winklbauer R (2011). EphrinB/EphB signaling controls embryonic germ layer separation by contact-induced cell detachment. PLoS Biol 9, e1000597. [DOI] [PMC free article] [PubMed] [Google Scholar]
- Smith A, Robinson V, Patel K, and Wilkinson DG (1997). The EphA4 and EphB1 receptor tyrosine kinases and ephrin-B2 ligand regulate targeted migration of branchial neural crest cells. Curr Biol 7, 561–70. [DOI] [PubMed] [Google Scholar]
- Tabariès S, Annis MG, Hsu BE, Tam CE, Savage P, Park M, and Siegel PM (2015). Lyn modulates Claudin-2 expression and is a therapeutic target for breast cancer liver metastasis. Oncotarget 6, 9476–87. [DOI] [PMC free article] [PubMed] [Google Scholar]
- Thaper D, Vahid S, Nip KM, Moskalev I, Shan X, Frees S, Roberts ME, Ketola K, Harder KW, Gregory-Evans C, et al. (2017). Targeting Lyn regulates Snail family shuttling and inhibits metastasis. Oncogene 36, 3964–3975. [DOI] [PubMed] [Google Scholar]
- Thomas SM, and Brugge JS (1997). Cellular functions regulated by Src family kinases. Annu Rev Cell Dev Biol 13, 513–609. [DOI] [PubMed] [Google Scholar]
- Tornillo G, Knowlson C, Kendrick H, Cooke J, Mirza H, Aurrekoetxea-Rodríguez I, Vivanco MDM, Buckley NE, Grigoriadis A, and Smalley MJ (2018). Dual Mechanisms of LYN Kinase Dysregulation Drive Aggressive Behavior in Breast Cancer Cells. Cell Rep 25, 3674–3692.e10. [DOI] [PMC free article] [PubMed] [Google Scholar]
- Tsai JH, Donaher JL, Murphy DA, Chau S, and Yang J (2012). Spatiotemporal regulation of epithelial-mesenchymal transition is essential for squamous cell carcinoma metastasis. Cancer Cell 22, 725–36. [DOI] [PMC free article] [PubMed] [Google Scholar]
- Wei SC, Fattet L, Tsai JH, Guo Y, Pai VH, Majeski HE, Chen AC, Sah RL, Taylor SS, Engler AJ, et al. (2015). Matrix stiffness drives epithelial-mesenchymal transition and tumour metastasis through a TWIST1-G3BP2 mechanotransduction pathway. Nat Cell Biol 17, 678–88. [DOI] [PMC free article] [PubMed] [Google Scholar]
- Yang B, Lieu ZZ, Wolfenson H, Hameed FM, Bershadsky AD, and Sheetz MP (2016). Mechanosensing Controlled Directly by Tyrosine Kinases. Nano Lett 16, 5951–61. [DOI] [PMC free article] [PubMed] [Google Scholar]
- Yang J, Mani SA, Donaher JL, Ramaswamy S, Itzykson RA, Come C, Savagner P, Gitelman I, Richardson A, and Weinberg RA (2004). Twist, a master regulator of morphogenesis, plays an essential role in tumor metastasis. Cell 117, 927–39. [DOI] [PubMed] [Google Scholar]
- Zelinski DP, Zantek ND, Stewart JC, Irizarry AR, and Kinch MS (2001). EphA2 overexpression causes tumorigenesis of mammary epithelial cells. Cancer Res 61, 2301–6. [PubMed] [Google Scholar]
- Zhao B, Wei X, Li W, Udan RS, Yang Q, Kim J, Xie J, Ikenoue T, Yu J, Li L, et al. (2007). Inactivation of YAP oncoprotein by the Hippo pathway is involved in cell contact inhibition and tissue growth control. Genes Dev 21, 2747–61. [DOI] [PMC free article] [PubMed] [Google Scholar]
- Zhou Y, and Sakurai H (2017). Emerging and Diverse Functions of the EphA2 Noncanonical Pathway in Cancer Progression. Biol Pharm Bull 40, 1616–1624. [DOI] [PubMed] [Google Scholar]
- Zhou Y, Yamada N, Tanaka T, Hori T, Yokoyama S, Hayakawa Y, Yano S, Fukuoka J, Koizumi K, Saiki I, et al. (2015). Crucial roles of RSK in cell motility by catalysing serine phosphorylation of EphA2. Nat Commun 6, 7679. [DOI] [PMC free article] [PubMed] [Google Scholar]
Associated Data
This section collects any data citations, data availability statements, or supplementary materials included in this article.
Supplementary Materials
Data Availability Statement
This study did not generate/analyse datasets/codes.