

Summary
Many membrane-less organelles form through liquid-liquid phase separation, but how their size is controlled and whether size is linked to function remain poorly understood. The Histone Locus Body (HLB) is an evolutionarily conserved nuclear body that regulates the transcription and processing of histone mRNAs. Here, we show that Drosophila HLBs form through phase separation. During embryogenesis, the size of HLBs is controlled in a precise and dynamic manner that is dependent on the cell cycle and zygotic histone gene activation. Control of HLB growth is achieved by a mechanism integrating nascent mRNAs at the histone locus, which facilitates phase separation, and the nuclear concentration of the scaffold protein multi-sex combs (Mxc), which is controlled by the activity of cyclin-dependent kinases. Reduced Cdk2 activity results in smaller HLBs and the appearance of nascent, misprocessed histone mRNAs. Thus, our experiments identify a mechanism linking nuclear body growth and size with gene expression.
Keywords: Histone Locus Body, membrane-less organelle, nuclear body, size control, phase separation, multi-sex combs, cell cycle, cyclin-dependent kinase, histone transcription, histone mRNA processing
Graphical Abstract
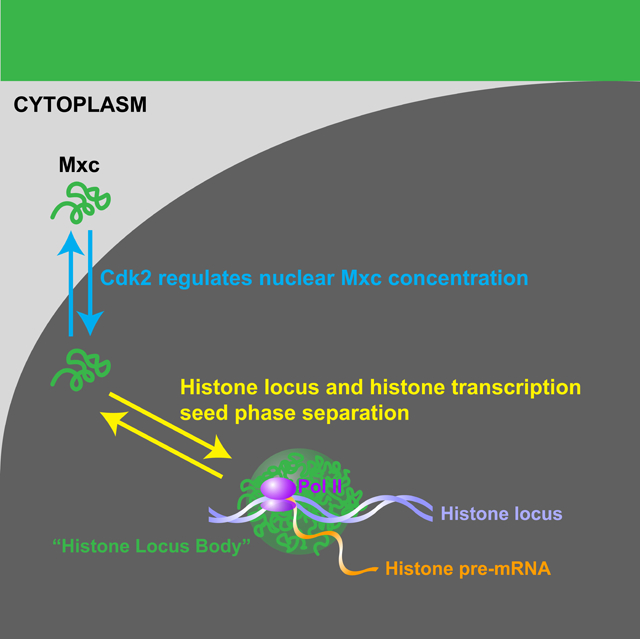
In Brief
The Histone Locus Body (HLB) is a conserved nuclear body responsible for histone biogenesis. Hur et al. show that in Drosophila embryos the HLB forms by a phase separation process seeded by histone genes and regulated by Cdk activity. A theoretical model out-of-equilibrium explains the precise dynamics of HLB growth.
INTRODUCTION
Many nuclear bodies form by liquid-liquid phase separation (Berry et al., 2018; Brangwynne, 2013; Brangwynne et al., 2011; Falahati et al., 2016; Hyman et al., 2014; Li et al., 2012; Mitrea and Kriwacki, 2016), the physical process by which certain fluids spontaneously separate into stable regions of different concentration or chemical composition. A major function of phase separation is to concentrate components to enhance the rate of biochemical reactions (Stroberg and Schnell, 2018). Consequently, the size of nuclear bodies may be related to their overall biochemical activity. Yet, it remains unclear what the molecular and physical mechanisms are that ensure precise regulation of the growth and size of nuclear bodies. Since phase separation is an intrinsically stochastic process, understanding whether the size of nuclear bodies or other types of biomolecular condensates is linked to their function and which mechanisms might ensure accurate size control remain fundamental open questions. Here, we study the formation of the Histone Locus Body (HLB), an evolutionarily conserved nuclear body that plays a fundamental role in the transcription and processing of histone mRNAs (Duronio and Marzluff, 2017). We focus on the syncytial nuclear cycles that lead to the maternal-to-zygotic transition in the Drosophila embryo, a stage of development when we can precisely examine whether HLBs form by phase separation and test whether phase separation is affected by the cell cycle and activation of zygotic gene expression.
HLBs form in animal cells at replication-dependent (RD) histone genes, which encode non-polyadenylated histone mRNAs expressed only during the S phase of the cell cycle (Duronio and Marzluff, 2017; Marzluff and Duronio, 2002). The genes encoding all five RD histone proteins occur in clusters (Kedes, 1979; Marzluff et al., 2002). In Drosophila melanogaster, the RD histone genes reside at a single locus containing a tandem array of about 100 copies (Figure 1A) (Bongartz and Schloissnig, 2019; Lifton et al., 1978; McKay et al., 2015). Nascent RD histone transcripts are processed via a single endonucleolytic cleavage, resulting in mRNAs ending in a conserved stem-loop sequence (Marzluff and Koreski, 2017). The HLB contains components necessary for both the transcription and specialized processing of these mRNAs (Burch et al., 2011; Duronio and Marzluff, 2017; Mao et al., 2011; Matera et al., 2009; Tatomer et al., 2016; White et al., 2011). Failure to localize essential histone pre-mRNA processing factors to the HLB reduces the efficiency of histone pre-mRNA processing, suggesting that concentrating proteins within the HLB is necessary for histone mRNA biogenesis (Tatomer et al., 2016; Wagner et al., 2007). Thus, understanding the processes regulating HLB assembly and organization will provide insight into how biomolecular condensates contribute to critical cellular functions like gene expression (Sawyer et al., 2019).
Figure 1. Cell cycle-dependent regulation of HLB size.

(A) Schematic of the Histone Locus Body and the Drosophila histone locus located on the left arm of the second chromosome (2L). (B) Representative images of HLBs (GFP-Mxc) during S phase of syncytial cycles 11–14. HLBs show homogeneous size distribution dependent on cycle stage. Filled arrowhead, paired HLBs. Empty arrowhead, unpaired HLBs. Scale bars, 10μm. c, cycle. (C) Schematic of HLB size quantification. i) HLBs were visualized by expressing a GFP-Mxc fusion protein in the presence of endogenous Mxc. ii) Multiple z stack images were acquired with confocal microscopy. iii) HLBs were segmented using threshold-based computational segmentation. iv) HLB size was approximated by measuring the trapezoidal cone shaped space occupied by multiple HLB masks. v) Mxc ‘Total Fluorescence’ was quantified by multiplying the approximated size by the average Mxc fluorescence intensity level of the HLB masks. (D) HLB size as a function of time for cycles 11–14. N=9 embryos. Shaded green area, SEM. (E) Fraction of nuclei with paired chromosomes over time. (F) Comparison between the size of fused HLBs (‘paired (fused) HLB’) and that of two HLBs that have not fused (‘unpaired HLBs multiplied by 2’). c, cycle. M, mitosis. A.U., arbitrary units. See also Figure S1 and Video S1.
A key mediator of HLB assembly in Drosophila is the Multi sex combs protein (Mxc). Mxc is the Drosophila orthologue of human NPAT, one of the first identified Cyclin E/Cdk2 substrates (Zhao et al., 1998). Both NPAT and Mxc accumulate only in the HLB and provide the most definitive marker for HLB formation within cells (Ma et al., 2000; White et al., 2011; Zhao et al., 2000). Mxc/NPAT is likely the main scaffolding protein for the HLB, and in its absence the HLB does not form and RD histone genes are not expressed (Wei et al., 2003; White et al., 2011; Ye et al., 2003). Like NPAT, Mxc is a large (1837 amino acids) protein composed mostly of predicted intrinsically disordered regions, with an N-terminal LisH domain that facilitates oligomerization and that is essential for Mxc/NPAT function in vivo (Terzo et al., 2015; Wei et al., 2003). Previous work in cell culture indicates that NPAT can stimulate histone gene transcription (Ma et al., 2000; Miele et al., 2005; Wei et al., 2003; Zhao et al., 2000), although the mechanism is unclear and neither NPAT or Mxc have a sequence specific DNA binding domain. Because Mxc/NPAT are Cyclin E/Cdk2 targets (Ma et al., 2000; White et al., 2011; Zhao et al., 2000), they likely integrate HLB formation and function in the initiation of DNA replication and cell cycle progression, although how this occurs is unknown.
Transcription of RD histone genes contributes in important ways to normal HLB formation (Heyn et al., 2017; Salzler et al., 2013; Shevtsov and Dundr, 2011). In the early embryos of fish and flies, the HLB initially appears coincident with the onset of zygotic RD histone gene transcription (Arias Escayola and Neugebauer, 2018; White et al., 2011; White et al., 2007). Blocking zygotic transcription in the early zebrafish embryo with α-amanitin prevents HLB formation (Heyn et al., 2017). Similarly, a Drosophila transgene containing a histone gene cluster in which the TATA boxes of the H3 and H4 genes were mutated prevents full HLB assembly (Salzler et al., 2013). However, in these flies both Mxc and FLASH, an essential histone pre-mRNA processing factor (Yang et al., 2009), are still recruited to the transgenic histone locus and form small structures termed “proto-HLBs”, although other HLB factors are not recruited (Salzler et al., 2013). Moreover, the conclusion that transcription is required for HLB formation in zebrafish embryos was made without detecting NPAT or FLASH (Heyn et al., 2017). Thus, although transcription is necessary for full HLB assembly, the initial nucleation of key HLB assembly factors like Mxc/NPAT may not require transcription. Consequently, the contribution of RD histone transcription to HLB assembly is complex and not fully understood.
A combination of genetic and cellular imaging approaches suggests that both hierarchical and stochastic recruitment of individual factors contribute to HLB formation (Shevtsov and Dundr, 2011; White et al., 2011). The proto-HLB first assembles at the RD histone locus in early development prior to the recruitment of factors involved in pre-mRNA processing and transcription, consistent with an ordered assembly process (White et al., 2011). In contrast, ectopic tethering experiments in mammalian cells indicate that the recruitment of HLB factors can occur stochastically (Shevtsov and Dundr, 2011). These seemingly disparate observations might be reconciled if HLBs formed via liquid-liquid phase transition, a process that could combine the stochastic recruitment of some factors (e.g. pre-mRNA processing factors) with a specific seeding event at the histone locus (e.g. via proto-HLB formation). However, whether the HLB has liquid-like properties and whether such properties contribute to histone mRNA biosynthesis has not been experimentally determined. By combining live imaging with genetic manipulation and quantitative analyses, here we show that HLBs form through phase separation. In addition, we discovered a role for cyclin dependent kinase activity in HLB size control, and we provide evidence that Cdk2 activity is also important for normal processing of RD histone mRNAs, possibly through regulation of HLB size.
RESULTS
The HLB undergoes precise growth dynamics linked to histone biogenesis
To gain insight into the mechanisms of HLBs assembly and size control, we used confocal microscopy to image the dynamics of HLB formation in living Drosophila embryos expressing a GFP-Mxc fusion protein from a transgene (Figure 1B). The GFP-Mxc transgene provides full Mxc function, as assessed by its ability to rescue the lethality of the mxcG48 null allele (Terzo et al., 2015; White et al., 2011). For most of our experiments, we detected HLBs by expressing GFP-Mxc in females to provide a maternal supply of Mxc from this transgene in the presence of endogenous, unlabeled Mxc. We also engineered a GFP-Mxc allele at the endogenous mxc locus using CRISPR (Figure S1A) to perform some experiments in which all Mxc molecules were GFP-labeled and expressed from the endogenous mxc promoter. The results on HLB size and growth dynamics from these two approaches were very similar (Figure S1B), validating the use of the GFP-Mxc transgene for measurements of HLB growth (see below).
In order to quantify HLB dynamics, we developed a computational method to automatically segment nuclei and GFP-Mxc-labeled HLBs within time lapsed confocal images of the syncytial cycles in early Drosophila embryos that lack gap phases (Figures 1C and 1D; STAR Methods). Beginning with cycle 11, HLBs form during S phase and dissolve during mitosis (when GFP-Mxc appears as globally associated with the chromosomes), confirming cell cycle dependent dynamics (Video S1). Since HLBs form at the histone locus (Liu et al., 2006; White et al., 2007), two HLBs often could be observed on the unpaired homologous chromosomes in early embryos (Figure 1B, empty arrowhead). The two HLBs came together upon homologous chromosome pairing, resulting in a single fused HLB (Figure 1B, filled arrowhead), and the proportion of nuclei with paired homologs increased throughout the syncytial blastoderm stage (Hiraoka et al., 1993) (Figure 1E). We measured the volume and the total HLB-associated GFP-Mxc fluorescence of paired and unpaired HLBs and confirmed that paired HLBs contained twice as much Mxc molecules as unpaired HLBs (Figure 1F and Figure S1C), indicating that chromosome pairing simply merged two HLBs together but did not promote further growth (i.e. further recruitment of GFP-Mxc). This observation also indicates that at this stage of development the size of individual HLBs correlates with the total number of associated RD histone genes. The volume of HLBs and HLB-associated total GFP-Mxc fluorescence in each nucleus were very strongly correlated for all genotypes used in this study (Figure S1G and STAR Methods), indicating that Mxc concentration within the HLB has low variability and demonstrating that both quantities could be used to measure HLB size. Thus, we decided to use volume to describe HLB size during the syncytial blastoderm stage (cycles 11–14). Our analyses of HLB growth revealed highly reproducible HLB dynamics (Figure 1D and Figure S1D). Similar results were obtained when we used the endogenously tagged GFP-Mxc allele (Figure S1B). Immunostaining experiments further confirmed our insights by demonstrating that the levels of GFP-Mxc protein in the HLB are strongly correlated to those of FLASH, another core HLB component (Figures 2E–F).
Figure 2. Precise HLB growth control is correlated with histone mRNA biogenesis.
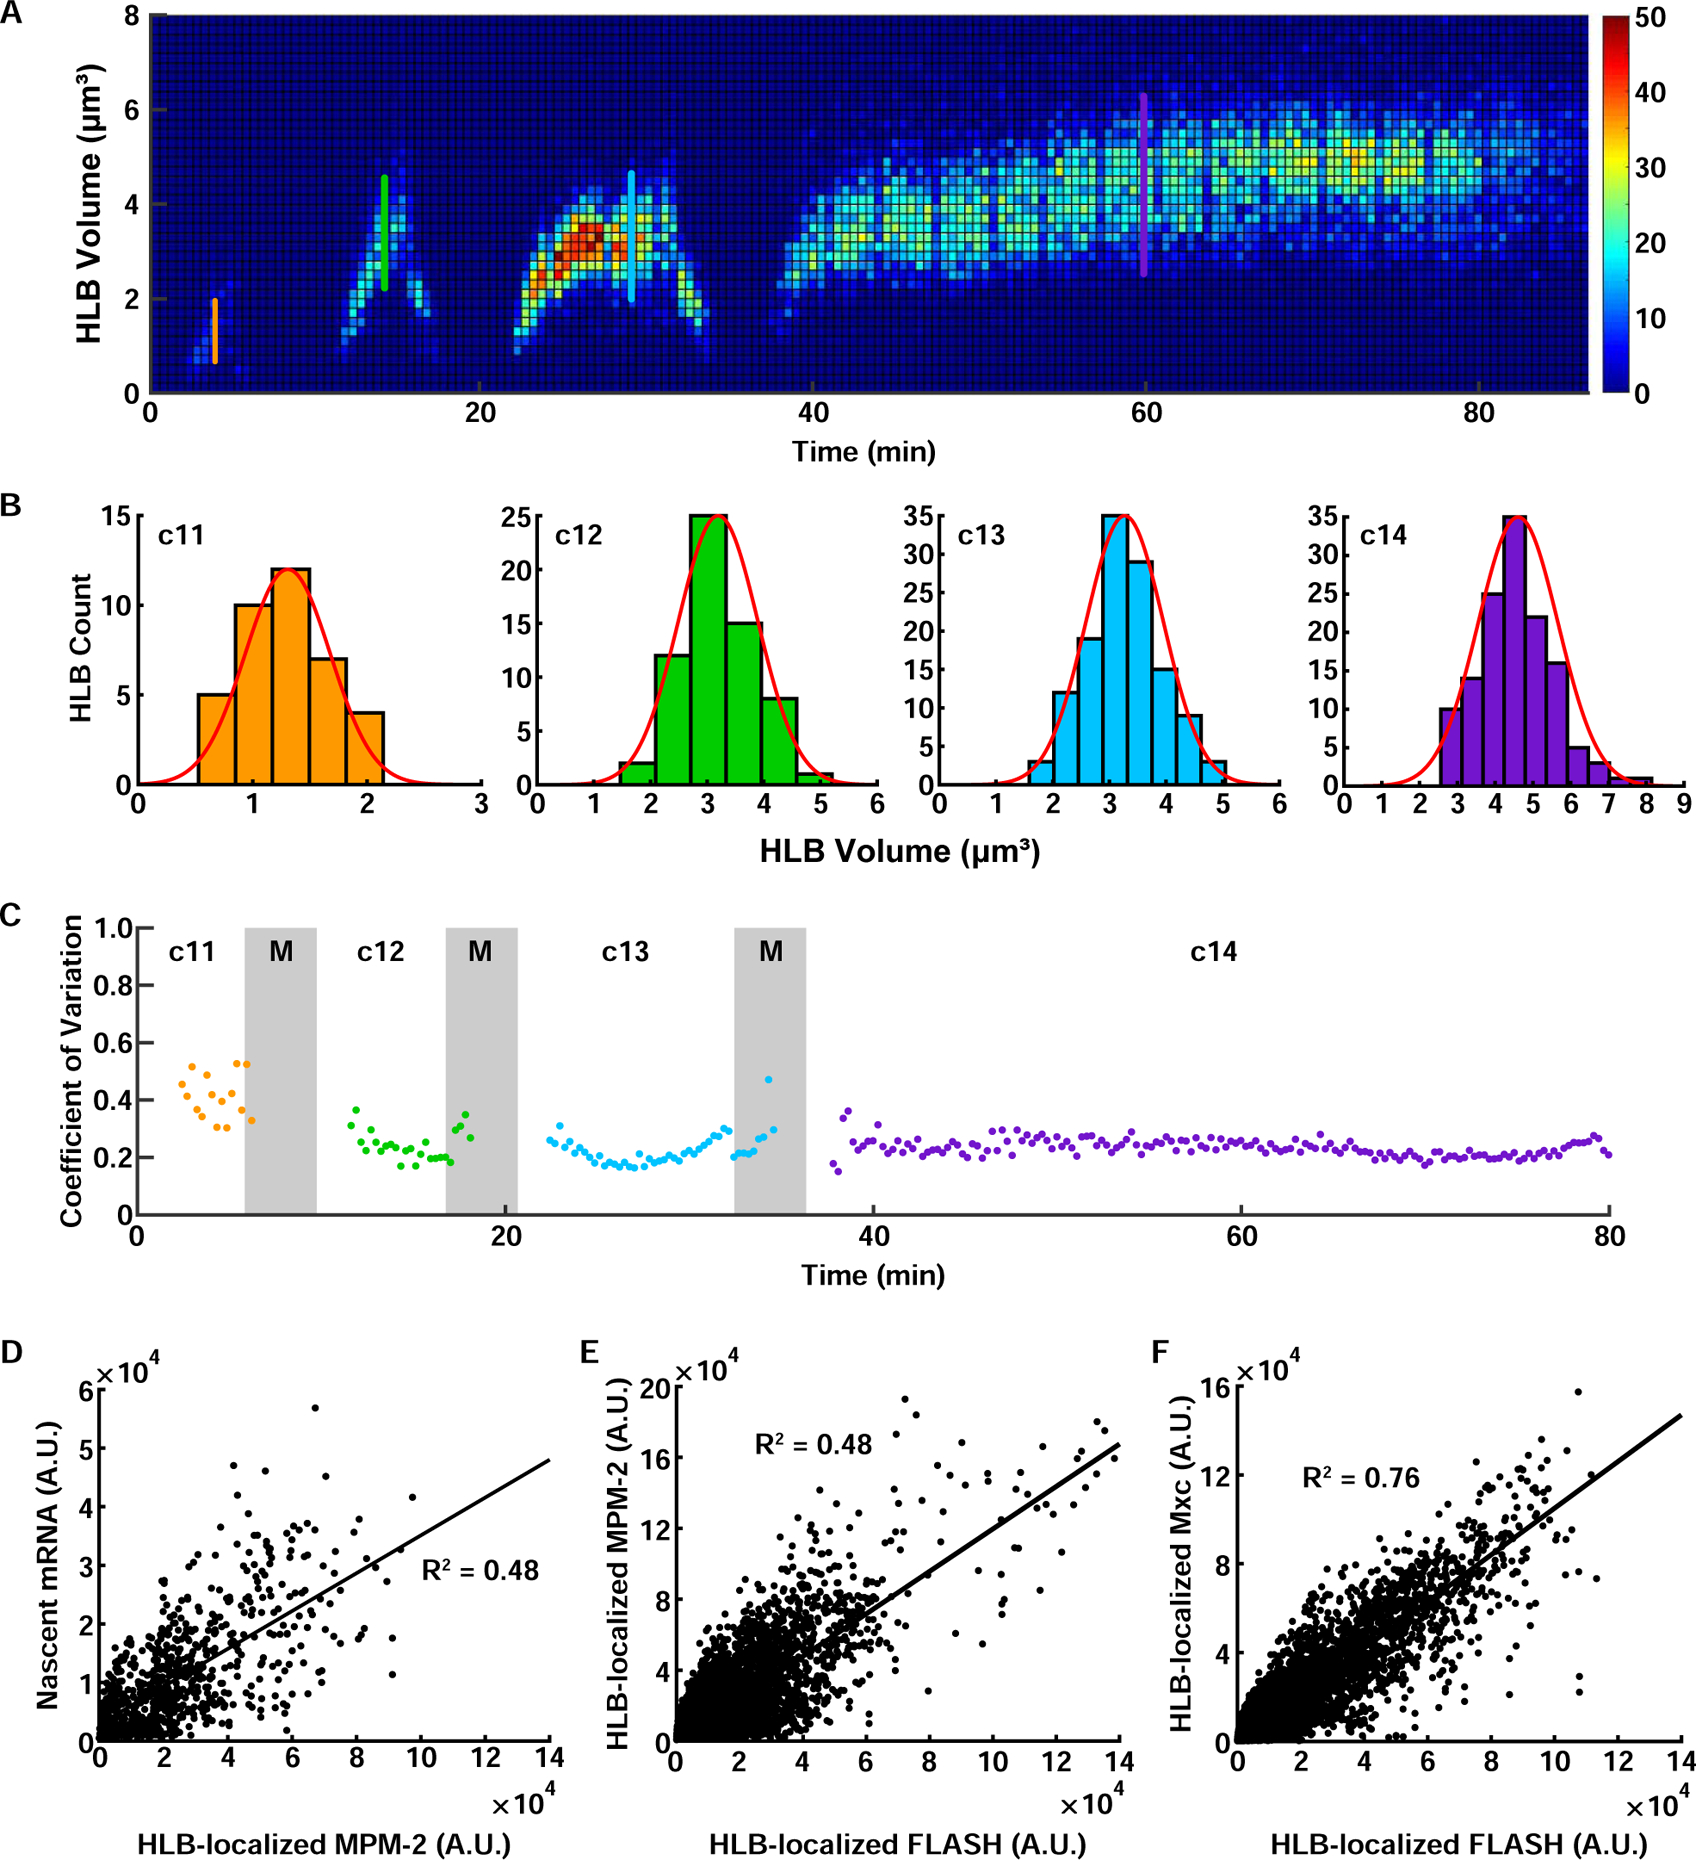
(A) 3D histogram of HLB size distribution from a single embryo. (B) HLB size distribution for each cell cycle during the syncytial blastoderm stage. Each histogram indicates the HLB size distribution at the time points marked with the line with the same color in (A). Red line, fitted normal distribution. (C) Coefficient of variation (CoV) for HLB size over the syncytial blastoderm stage. (D) Correlation of histone H3 nascent mRNA levels and total phosphorylated Mxc in HLBs. N=99 embryos, 4153 HLBs. Correlation of total phosphorylated Mxc (E) (N=76 embryos, 3254 HLBs) and total Mxc (F) (N=93 embryos, 5140 HLBs) with total FLASH in HLBs. A.U., arbitrary units. c, cycle. M, mitosis. Scale bars, 5μm. See also Figure S2.
As previously reported (White et al., 2007), HLBs were first detected during cycle 11 and disassembled during mitosis, with a small but detectable focus of Mxc and FLASH remaining associated with the histone locus (White et al., 2011). During cycles 12–14, S phase becomes longer and HLBs became significantly larger by entry into mitosis (Figure 1D). The larger HLB size observed during cycles 12 and 13 was not simply due to a longer S phase, as the HLBs grow at a faster rate in these cycles (Figures S1E–S1F). The more rapid growth of HLBs during cycles 12–13 than cycle 11 was also observed in embryos mutant for the DNA replication checkpoint kinases Chk1 and Chk2 (grapes, loki), which unlike wild type embryos had roughly the same S phase durations during cycles 11–13 (Figures S1E–S1F). Thus, our results indicate that inputs other than duration of S phase contribute to the rate of growth of HLBs.
In principle, the formation of nuclear bodies by liquid-liquid phase separation could be influenced by an initial stochastic nucleation step, which would result in highly variable HLB size. To determine whether the mechanisms of HLB formation are stochastic or able to ensure consistent growth dynamics across the embryo, we measured HLB size distribution in individual nuclei. We found that the distribution of HLB size was approximately Gaussian with a low coefficient of variation (0.2–0.3) (Figure 2A–2C). Moreover, the variability of HLB sizes was low throughout the syncytial blastoderm stage (Figure 2C), indicating that HLB growth was highly reproducible and uniform across all the nuclei. We hypothesized that such precise HLB growth and size control might play a role in the regulation of histone biogenesis during development. To test the possible functional relationship between HLB size and histone mRNA biosynthesis, we measured levels of nascent H3 histone mRNA and HLB size by immuno-FISH (Figure 2D; STAR Methods), using the monoclonal antibody MPM-2 (White et al., 2007), which specifically binds phosphorylated Mxc (White et al., 2011). Immunofluorescence experiments showed that the levels of total Mxc, phosphorylated Mxc, and another core HLB component FLASH, all closely correlated with each other in interphase (Figures 2E–F and S2A), indicating that these different quantities can be used interchangeably to measure HLB size. We found a significant correlation between the amount of nascent H3 mRNA and phosphorylated Mxc present in the HLB (Figure 2D), suggesting that nascent histone mRNA level and HLB size are coordinated. Thus, we set out to dissect the molecular mechanisms that ensure precise control of HLB growth dynamics during early embryogenesis.
HLBs form by phase separation
We reasoned that, similar to other NBs, the behavior of the HLB might be governed by liquid-liquid phase separation (Brangwynne, 2013; Dundr, 2012; Hyman et al., 2014; Mao et al., 2011; Matera et al., 2009; Mitrea and Kriwacki, 2016). Taking advantage of the fact that homologous chromosomes actively pair during nuclear divisions in early Drosophila embryos (Hiraoka et al., 1993), we imaged individual HLBs as they became closely juxtaposed and then fused (Figure 3A; Video S2). Since phase separated droplets tend to be spherical, we tested whether they recover a spherical shape following fusion. We quantified the circularity index of HLBs before, during, and after fusion to address if they behave as liquid droplets (STAR Methods). The circularity index dropped significantly as HLBs came in contact with each other but quickly recovered within less than a minute from initial contact as the two HLBs fused into one (Figure 3B). This observation indicates that HLBs behave similarly to liquid droplets (Freeman Rosenzweig et al., 2017; Strom et al., 2017). The liquid nature of the HLB was tested by performing Fluorescence Recovery After Photobleaching (FRAP) of individual HLBs (Figure 3C). Quantification of the size of bleached individual HLBs relative to the surrounding unbleached ones demonstrated that GFP-Mxc-labelled HLBs recover fluorescence on timescales of seconds to minutes (Figure 3D and 3F). The time of recovery could be estimated from a linear fit of the logarithm of the difference of fluorescence intensities between the unbleached and the bleached HLBs (Figure 3E). This analysis demonstrates that the dwell-time of Mxc in HLBs increases as a function of the size of the droplet (Figure 3F), which is consistent with a phase separation scenario (Huang et al., 2019). Phase separation is also consistent with the observation that Mxc failed to accumulate at the histone locus when a mutation is introduced in the LisH domain (MxcLisH-AAA), which mediates Mxc oligomerization (Terzo et al., 2015) (Figure S4A).
Figure 3. The HLB forms by phase separation.
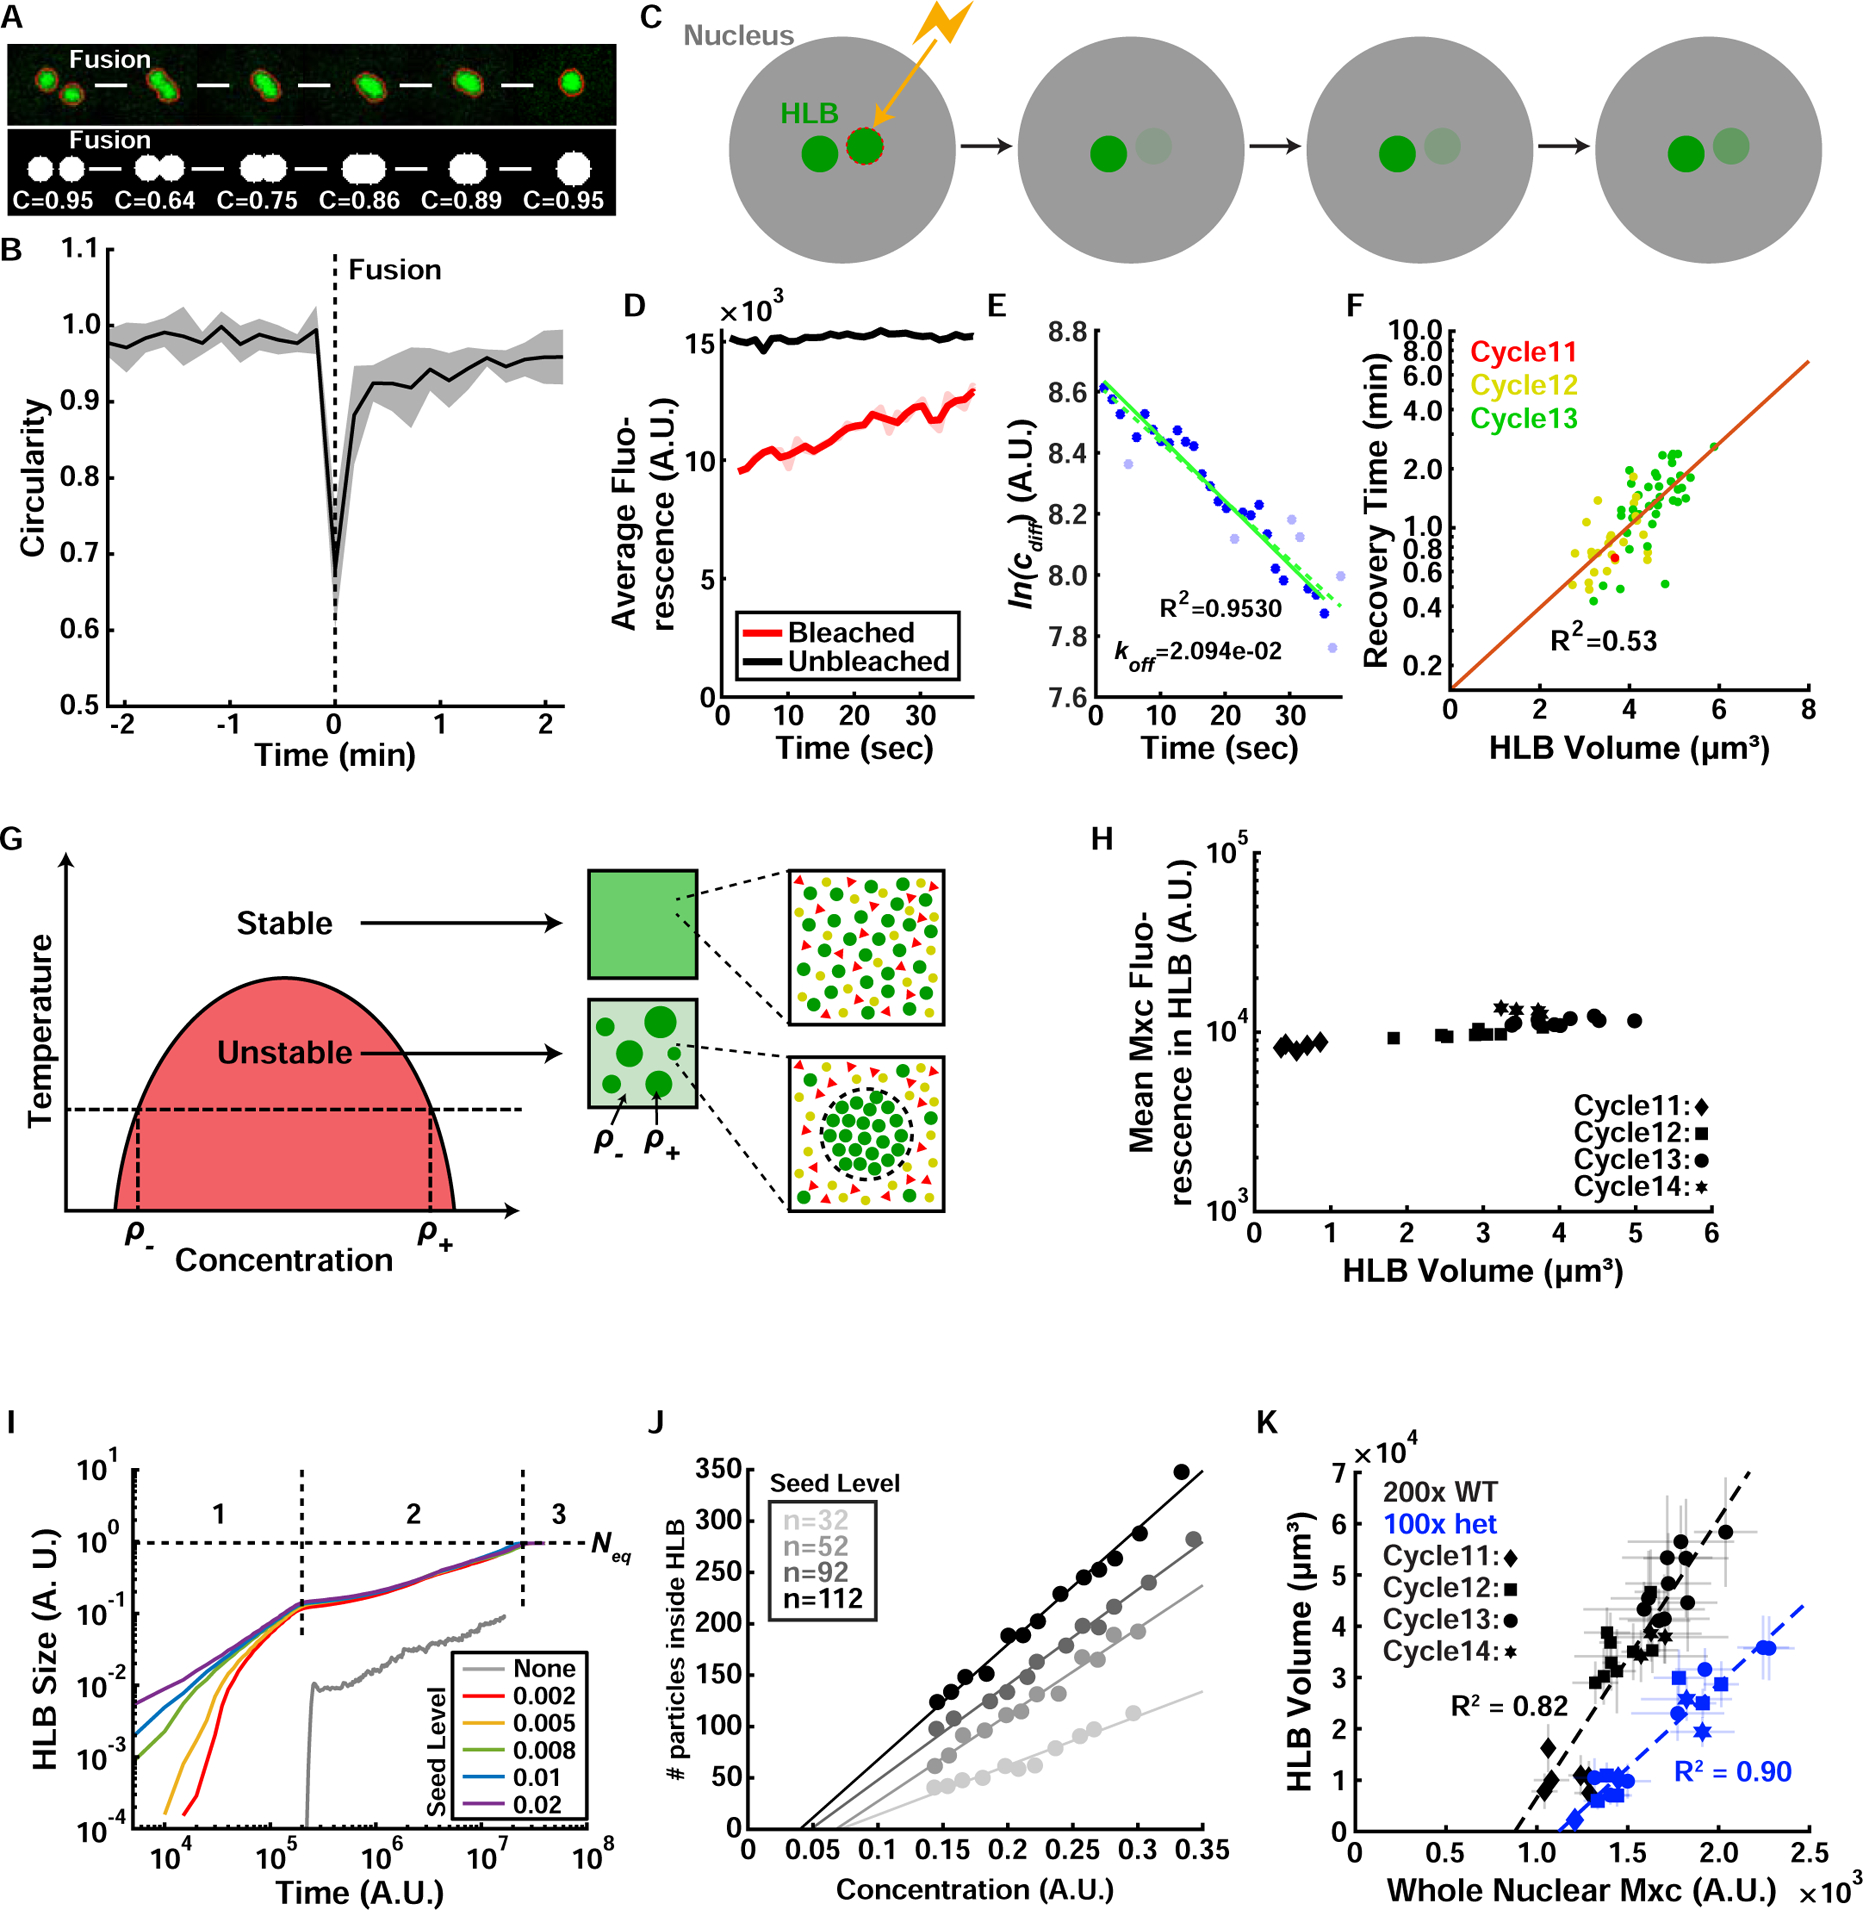
(A) Top: Example of HLB fusion upon chromosome pairing during S phase in Drosophila embryos. Bottom: Simulation of HLB fusion event and quantification of droplet circularity during the fusion. (B) Quantification of HLB circularity index during fusion events. Multiple quantifications were performed, aligned by the fusion timing (t=0), and averaged. Shaded area, SEM. (C) Schematic of HLB FRAP experiment. (D) Example of unbleached (black) versus bleached (red) HLB fluorescence level quantification. Dim red line indicates original data and the solid red line indicates the same data after noise correction, which is used for analysis in panel (E). (E) Logarithm of the difference between bleached (red in (D)) and unbleached (black in (D)) HLB fluorescence from (D) over time. The initial fit (dashed green line) was generated from all data points (blue and light blue points). From this initial fit, points whose residuals were greater than 2 standard deviations were removed from the dataset (light blue points). The best fit line was then computed on the dataset lacking the outliers (solid green line). The export rate koff was measured from the slope of the solid green line. (F) HLB recovery time (on logscale) as a function of HLB size. (G) Phase diagram for a liquid-liquid phase separation. At a given temperature and concentration, a mixture of macromolecules with the potential to undergo liquid-liquid phase separation becomes thermodynamically unstable and separates into two different phases with concentrations of ρ− and ρ+. Red area indicates the portion of the phase diagram in which phase separation occurs. Thus, ρ− and ρ+ can be determined for any given temperature (horizontal dotted line). Red triangles and yellow circles represent other soluble proteins that do not participate in the phase separation; while green circles are the phase-separated component (e.g. GFP-Mxc). Adapted from (Brangwynne, 2013). (H) Quantification of average Mxc concentration inside HLB versus HLB size. (I) Numerical solution of Cahn-Hilliard (CH) equation in 2D lattice reveals that HLB growth proceeds in three stages: 1) seeding level-dependent fast growth, 2) slower growth independent of the seeding level, and 3) equilibrium phase where HLB size is only dependent on nuclear Mxc concentration. (J) A particle-based simulation of HLB growth in the 3D lattice shows that HLB size (y-axis) depends on the seeding level (shades of gray) and Mxc concentration (x-axis) in the first regime indicated as “1” in (I). (K) Experimental data of HLB size and nuclear Mxc concentration, for WT (~200 histone repeats) and histone deficiency heterozygote mutant (~100 histone repeats). Error bars, standard deviation. A.U., arbitrary units. See also Figure S3 and Video S2.
Theoretical analysis reveals a mechanism for the precise control of HLB growth and size
The theory of phase separation indicates that within a particular range of temperatures and concentrations certain mixed liquids are thermodynamically unstable (Brangwynne, 2013). Consequently, these liquids spontaneously separate into two phases of different concentration. For phase separation processes driven by a single component, the two concentrations at given physical conditions (e.g. temperature) are fixed and indicated respectively as ρ− and ρ+ (Figure 3G). We can model the nucleoplasm as a mixed liquid that separates into a phase of high Mxc concentration ρ+ (the HLB), and a phase of low Mxc concentration ρ− Theory predicts that the concentrations ρ+ and ρ− do not depend on the overall nuclear concentration of Mxc or HLB size. This prediction was confirmed experimentally for ρ+ (Figure 3H), arguing that phase separation ensures that the Mxc concentration within the HLB is reproducibly controlled.
For a phase separation process at thermodynamic equilibrium, the size of the HLB should depend solely on the nuclear concentration of Mxc, a theoretical prediction not supported by published observations that the histone locus is required for proper formation of the HLB (Salzler et al., 2013). Thus, we set out to perform a theoretical analysis to determine under which conditions a phase-separation model can explain both the dependency on Mxc concentration and on the number of histone genes (and their transcriptional activity). To this end, we used numerical simulations of a standard theoretical model (Cahn-Hilliard equation) describing phase separation (Bray, 1994), and previously used to describe the formation of nuclear bodies (Berry et al., 2015). We introduced a modification in the model to include the role of the histone locus and nascent histone mRNA in facilitating the formation of HLBs (STAR Methods). To this end, we imposed the constraint that the state of high concentration is the only stable state in the immediate vicinity of the histone locus. Hereafter, we refer to this as seeding. Different levels of seeding were modeled by changing the volume of the region where seeding occurs (i.e. from different numbers of histone genes). Simulations indicated that phase separation initiated by seeding can ensure precise control of HLB growth (Figure S3A) and proceeded in three stages (Figure 3I; STAR Methods). In the first stage, which is far from equilibrium, the growth of the HLB was rapid and strongly influenced by the level of seeding. In the second phase, which still precedes equilibrium, growth slowed down and became largely independent of the seeding level. In the third phase, the system reached thermodynamic equilibrium with the HLB size acquiring an asymptotic value. This equilibrium size was dictated only by the nuclear Mxc concentration and was independent of seeding. Thus, our theoretical analysis argues that an out-of-equilibrium regime is a crucial mechanism that can explain the dependency of HLB growth on both seeding by the histone locus and Mxc concentration. A more realistic particle-based model of phase separation (STAR Methods) confirmed that, in the first regime, the size of the HLB was influenced in a quantitative manner by the level of seeding (Figure 3J). Furthermore, we derived a relationship between HLB size and the concentration of Mxc, delineated as a straight line passing through an x-intercept with the slope controlled by the level of seeding (Figure 3J). Our observational data from embryos confirmed these theoretical predictions (Figure 3K).
Our theoretical model indicates that in a non-equilibrium regime the growth of the HLB is influenced by both seeding provided by the histone locus and the concentration of Mxc. Quantitatively, the dependency on seeding levels was reflected in a different slope in the linear relationship linking HLB size and Mxc concentration (Figure 3J). We demonstrated this dependency by comparing data from wild type embryos to data from embryos heterozygous for a deficiency covering the entire histone locus (i.e. containing half the number of seeding histone genes, Figure 3K). Collectively, these results suggest that there is a non-equilibrium regime in the formation of phase-separated droplets, where both the levels of seeding (e.g. the number of histone genes in the case of the HLB) and concentration play a role in determining droplet size. This regime differs from the behavior at equilibrium when the size of the droplets depends solely on concentration and is independent of seeding.
Nascent histone mRNAs provide a seed for HLB formation and influence HLB growth
To further test the predictions of our physical model, we set out to study the role of seeding in the regulation of HLB growth by quantifying the dynamics of GFP-Mxc foci formation in embryos homozygous for a deletion of the entire histone locus. The maternal supply of histones allows these embryos to develop normally until gastrulation but they lack any seeding activity because of the absence of histone genes. Our simulations predicted that in this scenario a variable number of droplets of much smaller and heterogeneous size should form (Figure 3I; STAR Methods). We found that GFP-Mxc foci that form when the histone locus is absent were significantly smaller (Figure 4A and 4B; Video S3; (Salzler et al., 2013; White et al., 2007)), a behavior that is expected for phase-separated objects whose formation is initiated by a stochastic fluctuation (nucleation) rather than in a regulated manner through seeding. In the absence of seeding, small droplets should spontaneously form by thermal fluctuations. Yet, they are associated with a high energetic cost due to surface tension and should be almost always reabsorbed. Phase separation thus only initiates when a rare droplet, large enough to overcome the energetic barrier, is created. Conversely, in the presence of seeding, the association of HLB components like Mxc with the histone locus should lower this energetic barrier, thereby allowing the formation of HLBs in a much shorter time compared to the time scale over which droplets start to form under spontaneous phase separation. Consistent with this physical interpretation, GFP-Mxc foci formed in embryos lacking the histone locus were variable in number (often more than 2 per nucleus formed; Figure 4A), non-uniformly distributed in size (Figures S4C–S4E), and highly transient. During nuclear cycle 14, when S phase duration is significantly longer, some GFP-Mxc foci grew larger than in the previous cycles, as expected (Figure S4F). Taken together, our data suggest that the small bodies previously named proto-HLBs (Salzler et al., 2013) result from the intrinsic ability of proteins composing the HLB (most prominently Mxc) to phase separate. Therefore, we conclude that HLBs form through a phase separation process and that in wild type embryos the intrinsic stochasticity associated with nucleation is supplanted by seeding from the histone locus to ensure dynamic and reproducible control of HLB size and number.
Figure 4. Proper HLB formation requires seeding from the histone locus.
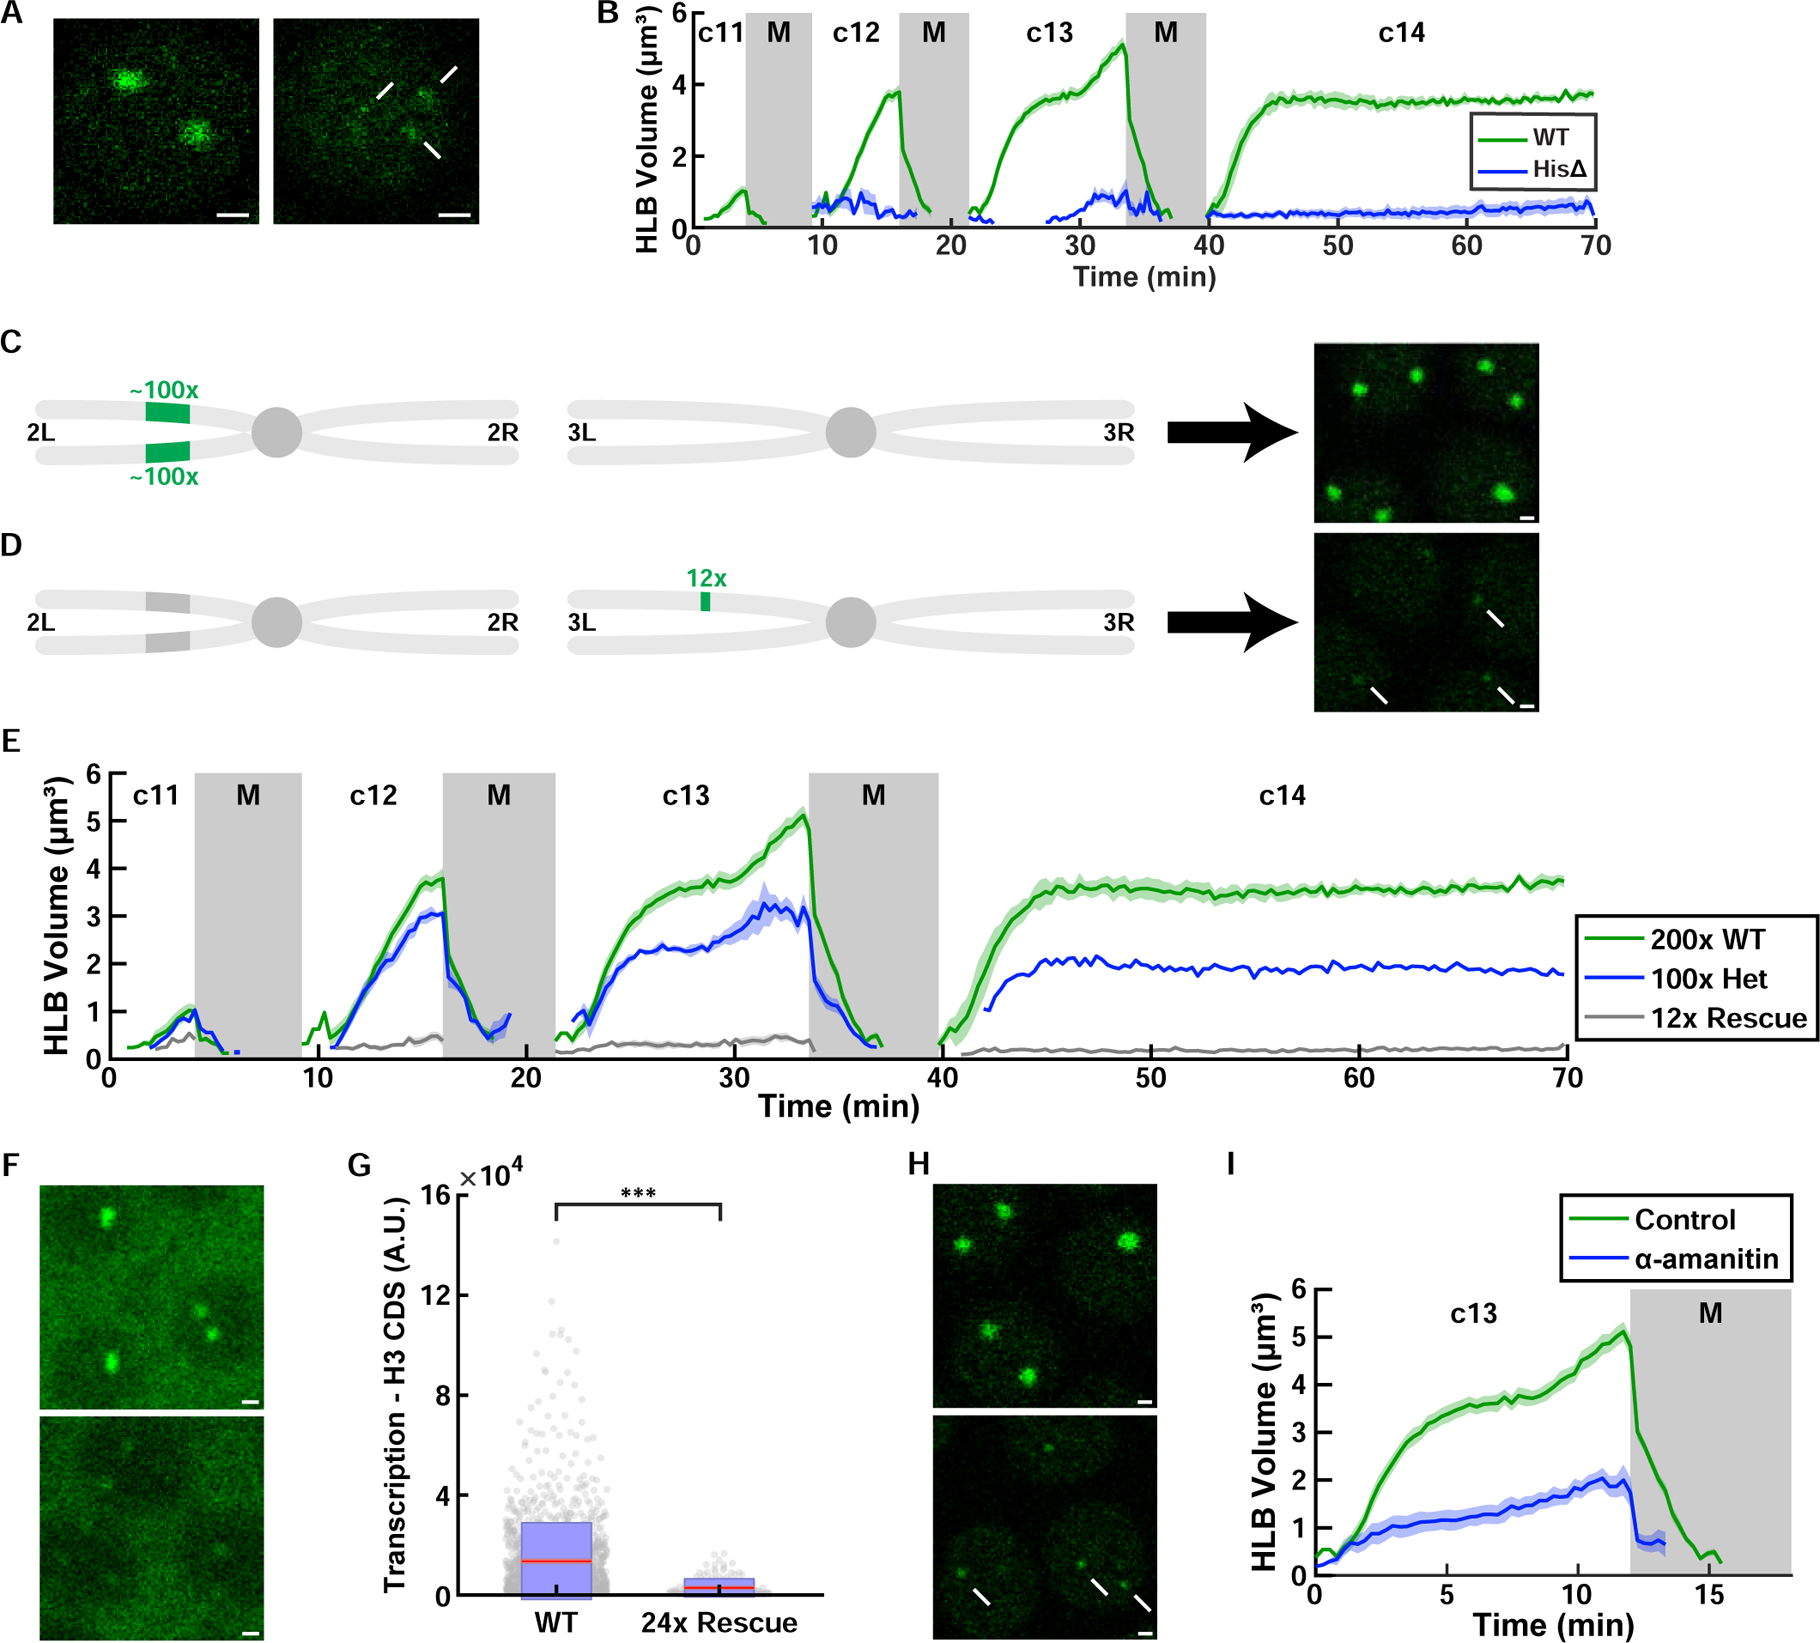
(A) Examples of WT HLB and the transient proto-HLBs observed in homozygous histone deficiency (HisΔ) embryos in cycle 13. Arrows indicate proto-HLBs. (B) Quantification of HLB size for WT and HisΔ (‘histone-null’) embryos. N=10 embryos (WT) and 12 embryos (HisΔ) (C) Schematic of the second and third chromosome for WT flies. Endogenous histone locus is on 2L, and it consists of about 100 copies of tandem repeats of all the canonical histone genes (H3, H4, H2a, H2b, and H1. See Figure 1A). (D) Schematic of the second and third chromosome for 12x histone rescue transgenic flies. 12 copies of histone repeats were inserted into chromosome 3L. Images on the right in (C) and (D) are confocal images of HLBs from each respective genotype in cycle 13. Arrows indicate HLBs. Images were acquired under identical imaging conditions. (E) HLB size for various numbers of histone repeats (200x, 100x, and 12x). N=10 (200x), 9 (100x), 4 (12x) embryos. (F) Histone H3 nascent mRNA visualized by FISH in wild-type (200 copies) and embryos with 24 copies of histone repeats. (G) Quantification of total nascent H3 mRNA in wild-type (N=39 embryos, 1569 HLBs) and embryos with 24 copies of histone repeats (N=7 embryos, 151 HLBs) at cycle 13. p<10−4 (two sample t test). Red, 95% confidence interval for the mean. Blue, 1 standard deviation. (H) HLBs in control and α-amanitin injected embryos. Arrows indicate HLBs. (I) HLB size for DMSO control and α-amanitin injected embryos. N=5 embryos each. Shaded area, SEM. A.U., arbitrary units. c, cycle. M, mitosis. Scale bars, 1μm. See also Figure S4 and Video S3.
To further test the role of the histone locus as a seed facilitating growth of the HLB, we addressed quantitatively how changes in the level of seeding affect HLB size. First, we compared the growth of HLBs in wild type embryos and embryos heterozygous for a deficiency deleting the entire histone locus. Our experiments showed that after cycle 12, the size of the HLB when only one histone locus was present was about half of the sum of two unpaired HLB sizes in wild type (Figure 4E). This observation indicates that HLB growth is influenced quantitatively by seeding at the histone locus and thus favors a model in which HLB formation is in the first regime, far from thermodynamic equilibrium (Figure 3I; Figure S3C; STAR Methods). At equilibrium, the size of the HLB in embryos carrying only one copy of the histone locus would have been predicted to be comparable to the sum of sizes of the two HLBs in wild type (Figure S3C; STAR Methods).
We also used an ectopic transgenic array containing 12 copies of the histone repeat (Figure 4D). This array rescues deletion of the entire endogenous histone locus, which has about 100 histone gene repeats on each homologous chromosome (Figure 4C) (McKay et al., 2015). As predicted by our physical model and as previously reported (McKay et al., 2015), embryos with 12 copies of histone repeats formed much smaller HLBs than wild type (Figure 4C–E), further supporting a role for the level of seeding in the regulation of HLB growth. In order to assess histone gene expression in this genotype and since there is such a large store of maternal histone mRNA deposited in the egg, we detected nascent histone transcripts in early embryos using in situ hybridization with a histone H3 antisense probe (Figure 4F). FISH experiments demonstrated that nascent transcription of H3 was significantly reduced in the strain with reduced number of histone repeats (Figures 4F and 4G). Note that although nascent, zygotic transcription was reduced in the embryos with reduced histone gene number, we previously showed that later-stage embryos (after cell cycle 15), which rely solely on zygotic histone mRNA, accumulate similar amounts of mature histone mRNA as true wild type (McKay et al., 2015), and most developed normally. These observations may reflect a higher rate of transcription in later embryos together with the existence of post-transcriptional mechanisms that control histone mRNA and protein levels. Our model predicts that the longer interphase of the later developmental cycle would facilitate the growth of HLBs (Figure 3I), which could contribute to higher histone gene transcription.
Finally, we tested whether nascent mRNAs contribute to seeding. To this end, we injected embryos prior to the onset of zygotic histone transcription with alpha-amanitin, an inhibitor of Pol II transcription. We observed that alpha-amanitin injected embryos formed significantly smaller HLBs (Figures 4H and 4I), while retaining normal dynamics of the nuclear cycles and Mxc concentration in the nucleoplasm (Figures S4H–S4J). This result is consistent with a model in which nascent mRNAs are an important catalyst of HLB growth (Heyn et al., 2017). The small GFP-Mxc foci that we detected in alpha-amanitin injected embryos might represent proto-HLBs (Figure 4H), whose formation at RD histone genes does not require transcription (Salzler et al., 2013). Since still only one or two HLBs were observed after alpha-amanitin treatment (presumably at the histone locus), and since HLBs form at the histone locus in the G1 phase of the cell cycle when RD histone genes are not transcribed (White et al., 2011), we conclude that DNA at the histone locus can seed phase separation and that HLB growth is strongly enhanced by continuous nascent histone mRNA.
Cdk activity contributes to HLB growth
To gain further insight into the molecular mechanisms of HLB formation, we investigated HLB cell cycle regulation by perturbing maternal Cdk activity. Previous reports have shown that Mxc/NPAT is a substrate of Cyclin E/Cdk2 and that its phosphorylated form was detected in HLBs in S phase (Ma et al., 2000; White et al., 2007; Zhao et al., 1998; Zhao et al., 2000). In addition, Cyclin E/Cdk2 has been shown to stimulate Mxc/NPAT mediated activation of histone gene expression (Ma et al., 2000; White et al., 2011; White et al., 2007; Ye et al., 2003; Zhao et al., 1998; Zhao et al., 2000). Therefore, we hypothesized that Cyclin E/Cdk2 plays an important role in HLB size control. To test this hypothesis, we utilized SNS-032, a small molecule CDK inhibitor with higher specificity towards Cdk2 than other Cdks (Ali et al., 2009; Chen et al., 2009). We injected SNS-032 into embryos entering cycle 13 and visualized HLB dynamics. Since some Cdks are known to regulate transcription, we verified that drug injection did not affect zygotic expression of a gene not associated with the HLB (sloppy paired; Figures S5B–S5C). However, this experiment does not fully exclude an effect of the drug on histone transcription through the activity of Cdks. To infer the efficacy of the drug treatment, we performed these experiments in embryos expressing GFP-Mxc as well as a biosensor that is phosphorylated by several Cyclin/Cdk complexes (Schwarz et al., 2018; Spencer et al., 2013), including Cyclin E/Cdk2 (Figure 5A). The biosensor protein was excluded from the nucleus after phosphorylation by Cdks (Figure 5B and Video S4), and thus the ratio of cytoplasmic-to-nuclear sensor protein provided a readout of Cdk-mediated phosphorylation (Figure 5C). During the syncytial blastoderm cycles, the localization of the biosensor oscillated with nuclear exclusion increasing over each S phase and rapidly decreasing prior to mitotic entry (Figure 5D). Mutating the putative Cdk phosphorylation residues on the biosensor to alanine led to loss of nuclear exclusion (Figure S5D). The phosphorylation of the biosensor and that of Mxc (detected by the MPM-2 antibody) had very similar dynamics, suggesting that the biosensor is an accurate proxy for the phosphorylation status of S-phase Cdk targets (Figure S5F). Treatment with the SNS-032 Cdk inhibitor significantly reduced the activity readout from the sensor and suppressed HLB growth (Figure 5E; Video S5). At low doses the drug did not perturb nuclear cycle timing, and at high doses the nuclear cycle lengthened, likely through inhibition of Cdk1 (Figure S5A). To quantify the relationship between HLB size and the phosphorylation of the sensor, we measured HLB size about 10 minutes into S phase after SNS-032 injection as well as the biosensor activation rate (Figure 5E). We found that lower activation rate resulted in smaller HLB size (Figure 5F), consistent with a Cdk contribution to HLB growth.
Figure 5. Cdk activity controls the size of HLB.
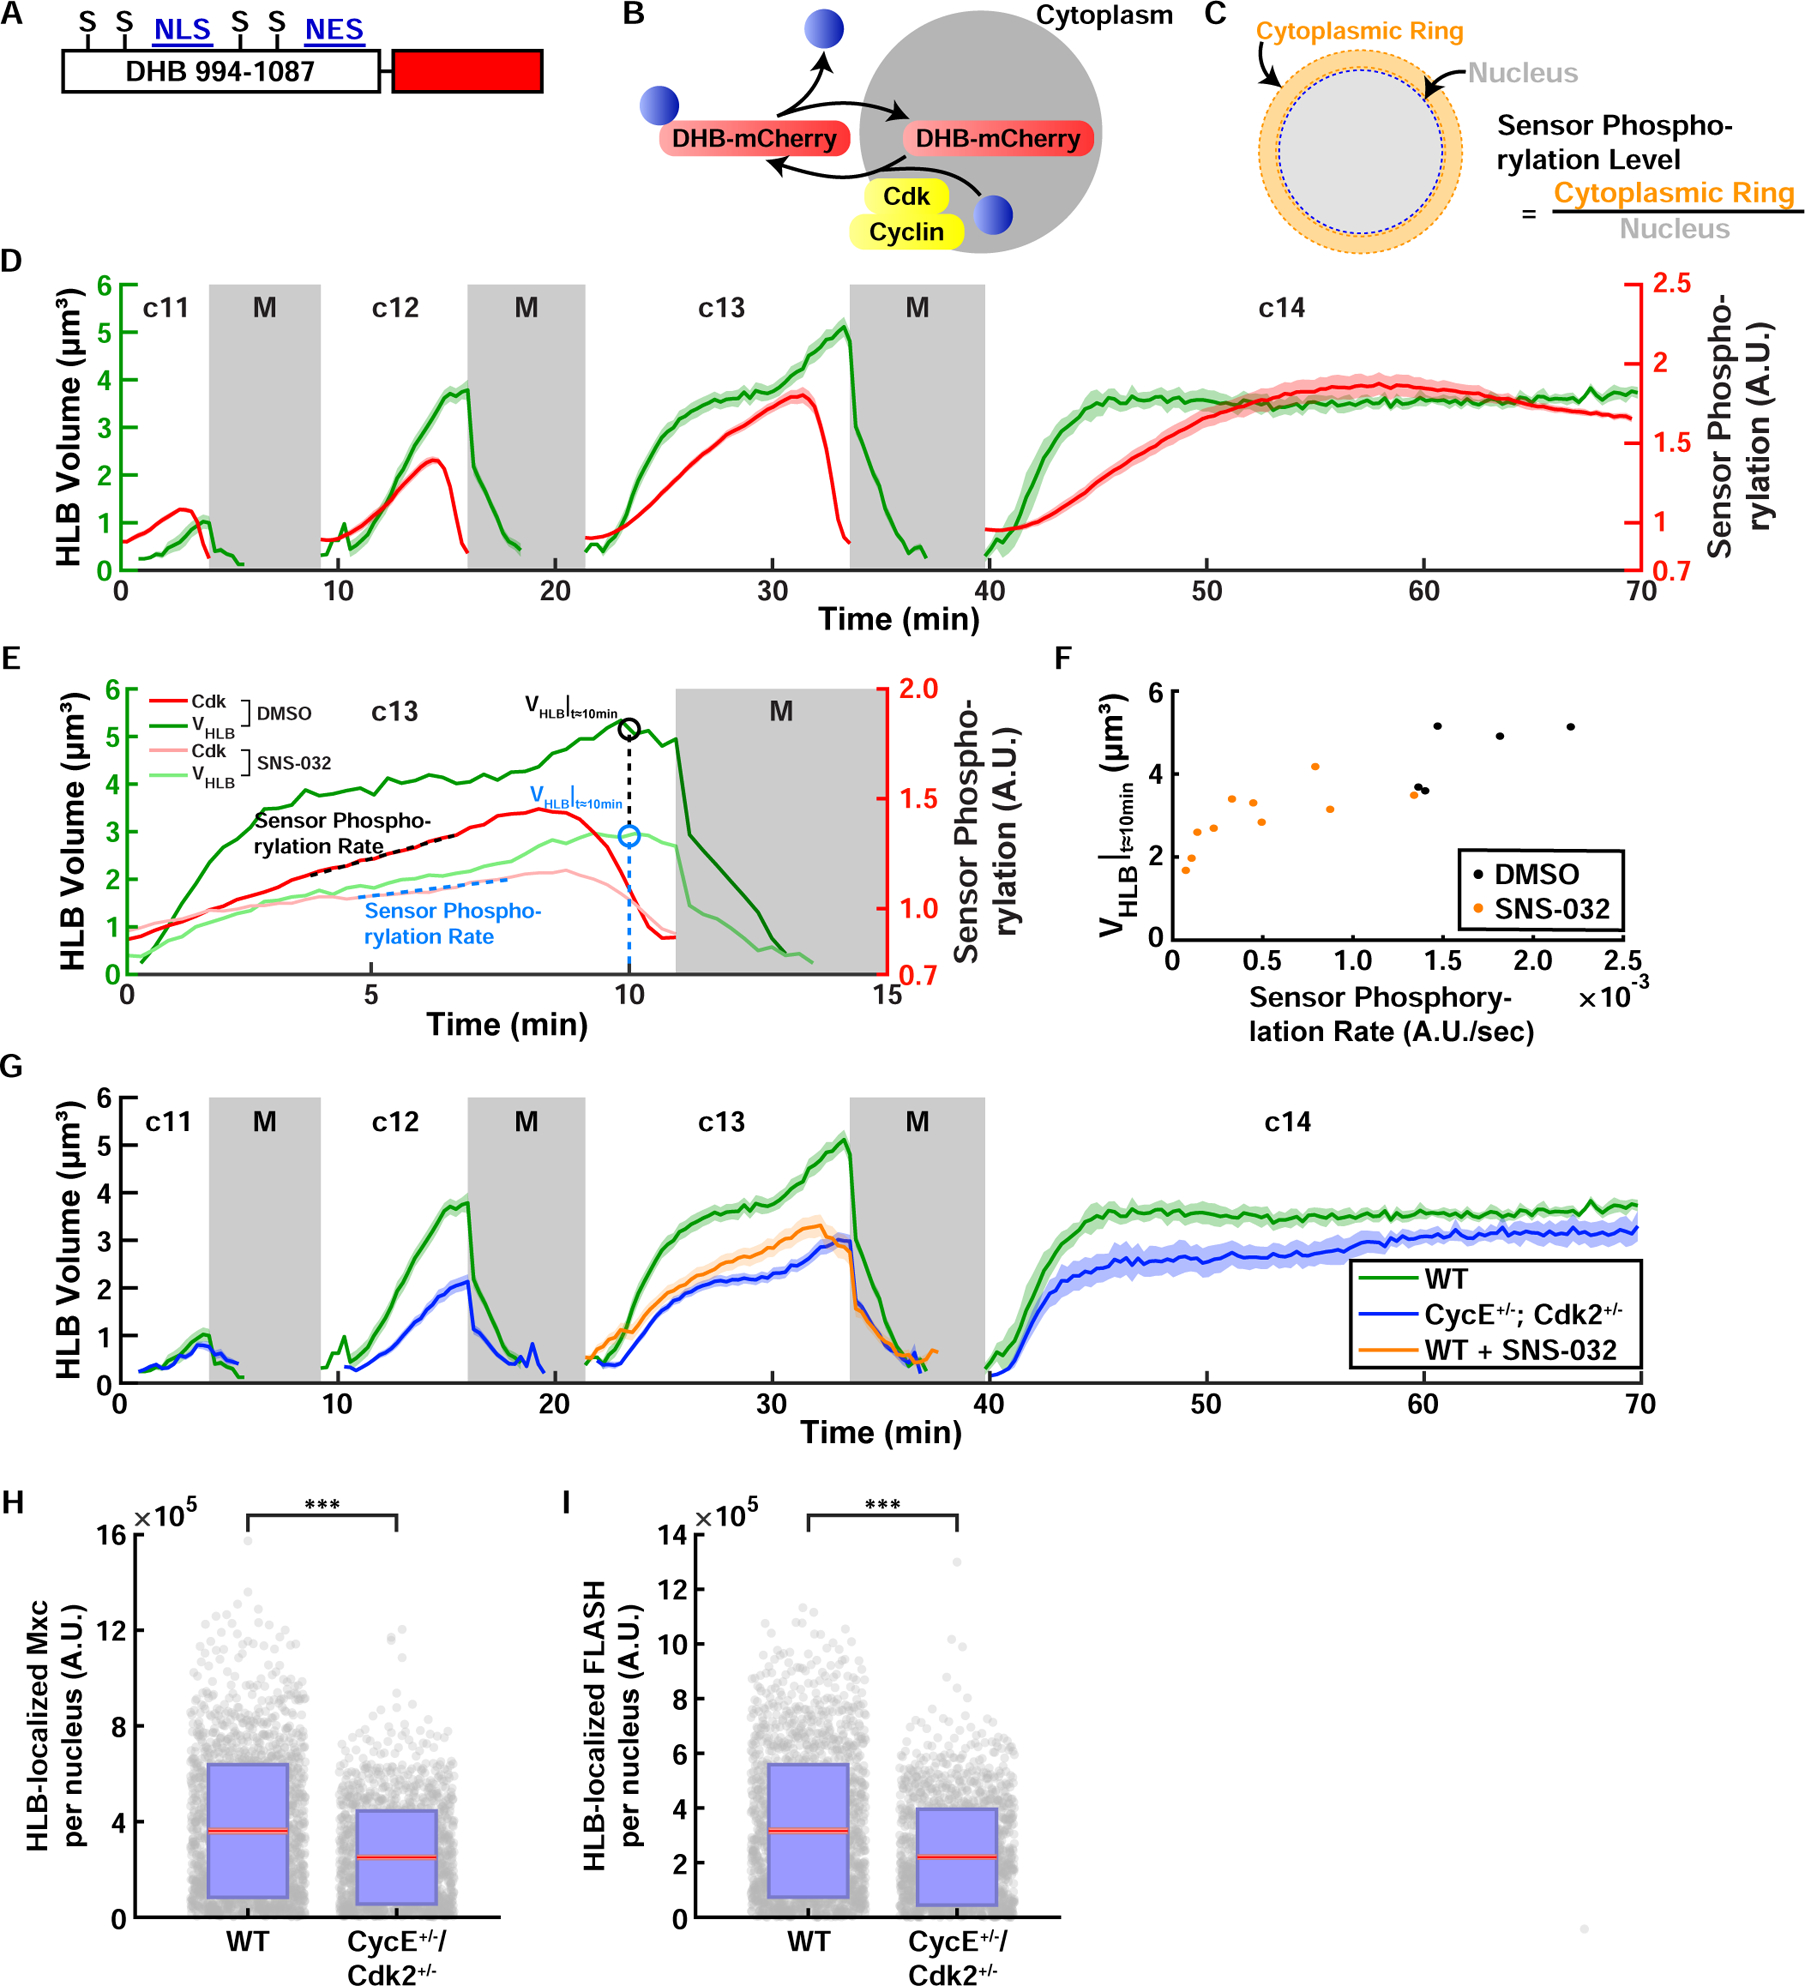
(A) Cdk sensor adapted from Ref (Spencer et al., 2013). Human DNA Helicase B (DHB) amino acids 994–1087 were fused with the fluorescent protein mCherry on the C terminus. S: CDK consensus phosphorylation serine residue, NLS: nuclear localization signal, NES: nuclear export signal. (B) Schematic of Cdk-mediated translocation of the sensor DHB-mCherry. (C) Method used to quantify the sensor phosphorylation level. mCherry fluorescence levels of the cytoplasm surrounding the nucleus (cytoplasmic ring) and the nucleus were measured and the sensor phosphorylation level was estimated by calculating the cytoplasmic-to-nuclear mCherry fluorescence ratio. (D) HLB size (green, left axis) and Cdk sensor (red, right axis) dynamics in cycles 11–14. N=10 embryos. (E) Representative quantifications of HLB size in HLB and Cdk sensor dynamics for DMSO control and SNS-032 (Cdk2 inhibitor) injected embryos during cycle 13. VHLB|t≈10min: HLB size 10 minutes after injection. Sensor Phosphorylation Rate, quantified as the slope of the sensor readout. (F) HLB size plotted against sensor phosphorylation rate. VHLB|t≈10min: HLB size 10 minutes after injection. (G) HLB size from embryos laid by WT mothers (green), CycE and Cdk2 double heterozygous mothers (blue), and Cdk2 inhibitor injected embryos (orange). N=10 embryos (WT), 20 embryos (CycE Cdk2 double het), 13 embryos (Cdk2 inhibitor). Total HLB-associated Mxc (H) and FLASH (I) from wild type embryos and embryos laid by CycE+/− , Cdk2+/− heterozygous mothers. Red, 95% confidence interval for the mean. Blue, 1 standard deviation. N=46 embryos, 1997 nuclei (WT); N= 47 embryos, 1692 nuclei (CycE+/− , Cdk2+/−). p<10−4 (two sample t test) for both panels. A.U., arbitrary units. c, cycle. M, mitosis. See also Figure S5 and Videos S4–S5.
To further elucidate the role of Cyclin E/Cdk2 and other Cyclin/Cdk complexes in HLB formation, we also altered their activities genetically, using heterozygous mutant mothers (STAR Methods). Live imaging of embryos laid by mothers carrying heterozygous mutations for both Cyclin E (Cyc E) and Cdk2 showed that they have smaller GFP-Mxc foci (Figure 5G), which was also confirmed by immunostaining for both Mxc and FLASH (Figures 5H and 5I). These data provide evidence that maternal Cyclin E/Cdk2 activity plays an important role in HLB formation. Dynamics of the Cdk sensor were almost unperturbed in embryos obtained from CycE+/−, Cdk2+/− mothers, supporting the idea that the regulation of the biosensor integrates inputs from multiple Cdk complexes (Schwarz et al., 2018) and from cell cycle regulated phosphatases (Figure S5E). Embryos from mothers heterozygous for Cyclin A also showed reduced HLB size, whereas HLB sizes in embryos from mothers heterozygous for Cyclin B were similar to those in wild type embryos (Figure S5G). Altogether, these results argue that Cyclin E/Cdk2 and Cyclin A/Cdk1 modulate HLB formation and may also be indicative of functional contributions from both of these kinases (Farrell et al., 2012; Sprenger et al., 1997).
Cdk activity contributes to the growth of HLBs by regulating Mxc nuclear concentration
The behavior of HLBs during the nuclear cycles suggested that phosphorylation of Mxc by Cdk complexes may regulate HLB growth (Ma et al., 2000; White et al., 2011; White et al., 2007; Ye et al., 2003; Zhao et al., 1998; Zhao et al., 2000). Based on our theoretical analysis (see Figure 3J), we speculated that regulation of Mxc nuclear concentration could be a candidate mechanism. Reduced recruitment to HLB foci might be due to decreased Mxc nuclear concentration and such concentration might be regulated by Cdks. In support of this hypothesis, we observed a lower nuclear Mxc concentration in embryos injected with the SNS-032 Cdk2 inhibitor and in embryos derived from mothers heterozygous for both Cyclin E and Cdk2 (Figure 6A and 6B). In all genetic conditions altering Cyclin E, Cdk2 and/or Cyclin A, the Mxc concentration within the HLB remained unaltered even when HLBs were smaller (Figure 6C), arguing that changes in Cdk activity did not change the phase diagram of HLB formation. Moreover, the relationship linking HLB size to Mxc nuclear concentration was quantitatively the same for all genetic conditions (Figure 6D). Collectively, these results argue that the main effect of Cdk-dependent phosphorylation is to regulate the nuclear level of Mxc, which in turn controls HLB growth. The importance of Mxc concentration was further strengthened by experiments in embryos laid by mothers hemizygous for the GFP-mxc CRISPR allele (i.e. mxcG48/GFP-mxcendo). These embryos also had significantly smaller HLBs (Figure 6E), which was confirmed by immunofluorescence detection of Mxc and FLASH (Figures 6F and 6G). The smaller HLB size correlated strongly with the reduced Mxc nuclear concentration (Figure S6D), supporting our quantitative model and confirming it for the endogenously tagged GFP-Mxc. Finally, we analyzed HLB dynamics in embryos injected with Roscovitine, a small molecule inhibitor of Cdk1 and Cdk2. Inhibition of Cdk activity resulted in dephosphorylation of the biosensor and arrest of the nuclear cycle, as expected (Figure S6C). However, HLBs persisted if Mxc nuclear levels were high enough for phase separation (Figures S6A and S6B). Thus, we conclude that Mxc can form HLBs even after reduction of Cdk-dependent phosphorylation, as long as its concentration is sufficiently high, an observation also consistent with previous findings showing that HLBs form in G1 when Cdk1 and Cdk2 activities are absent and HLBs contain unphosphorylated Mxc (Liu et al., 2006; White et al., 2011).
Figure 6. Nuclear Mxc concentration is regulated by Cdk activity and determines HLB size.
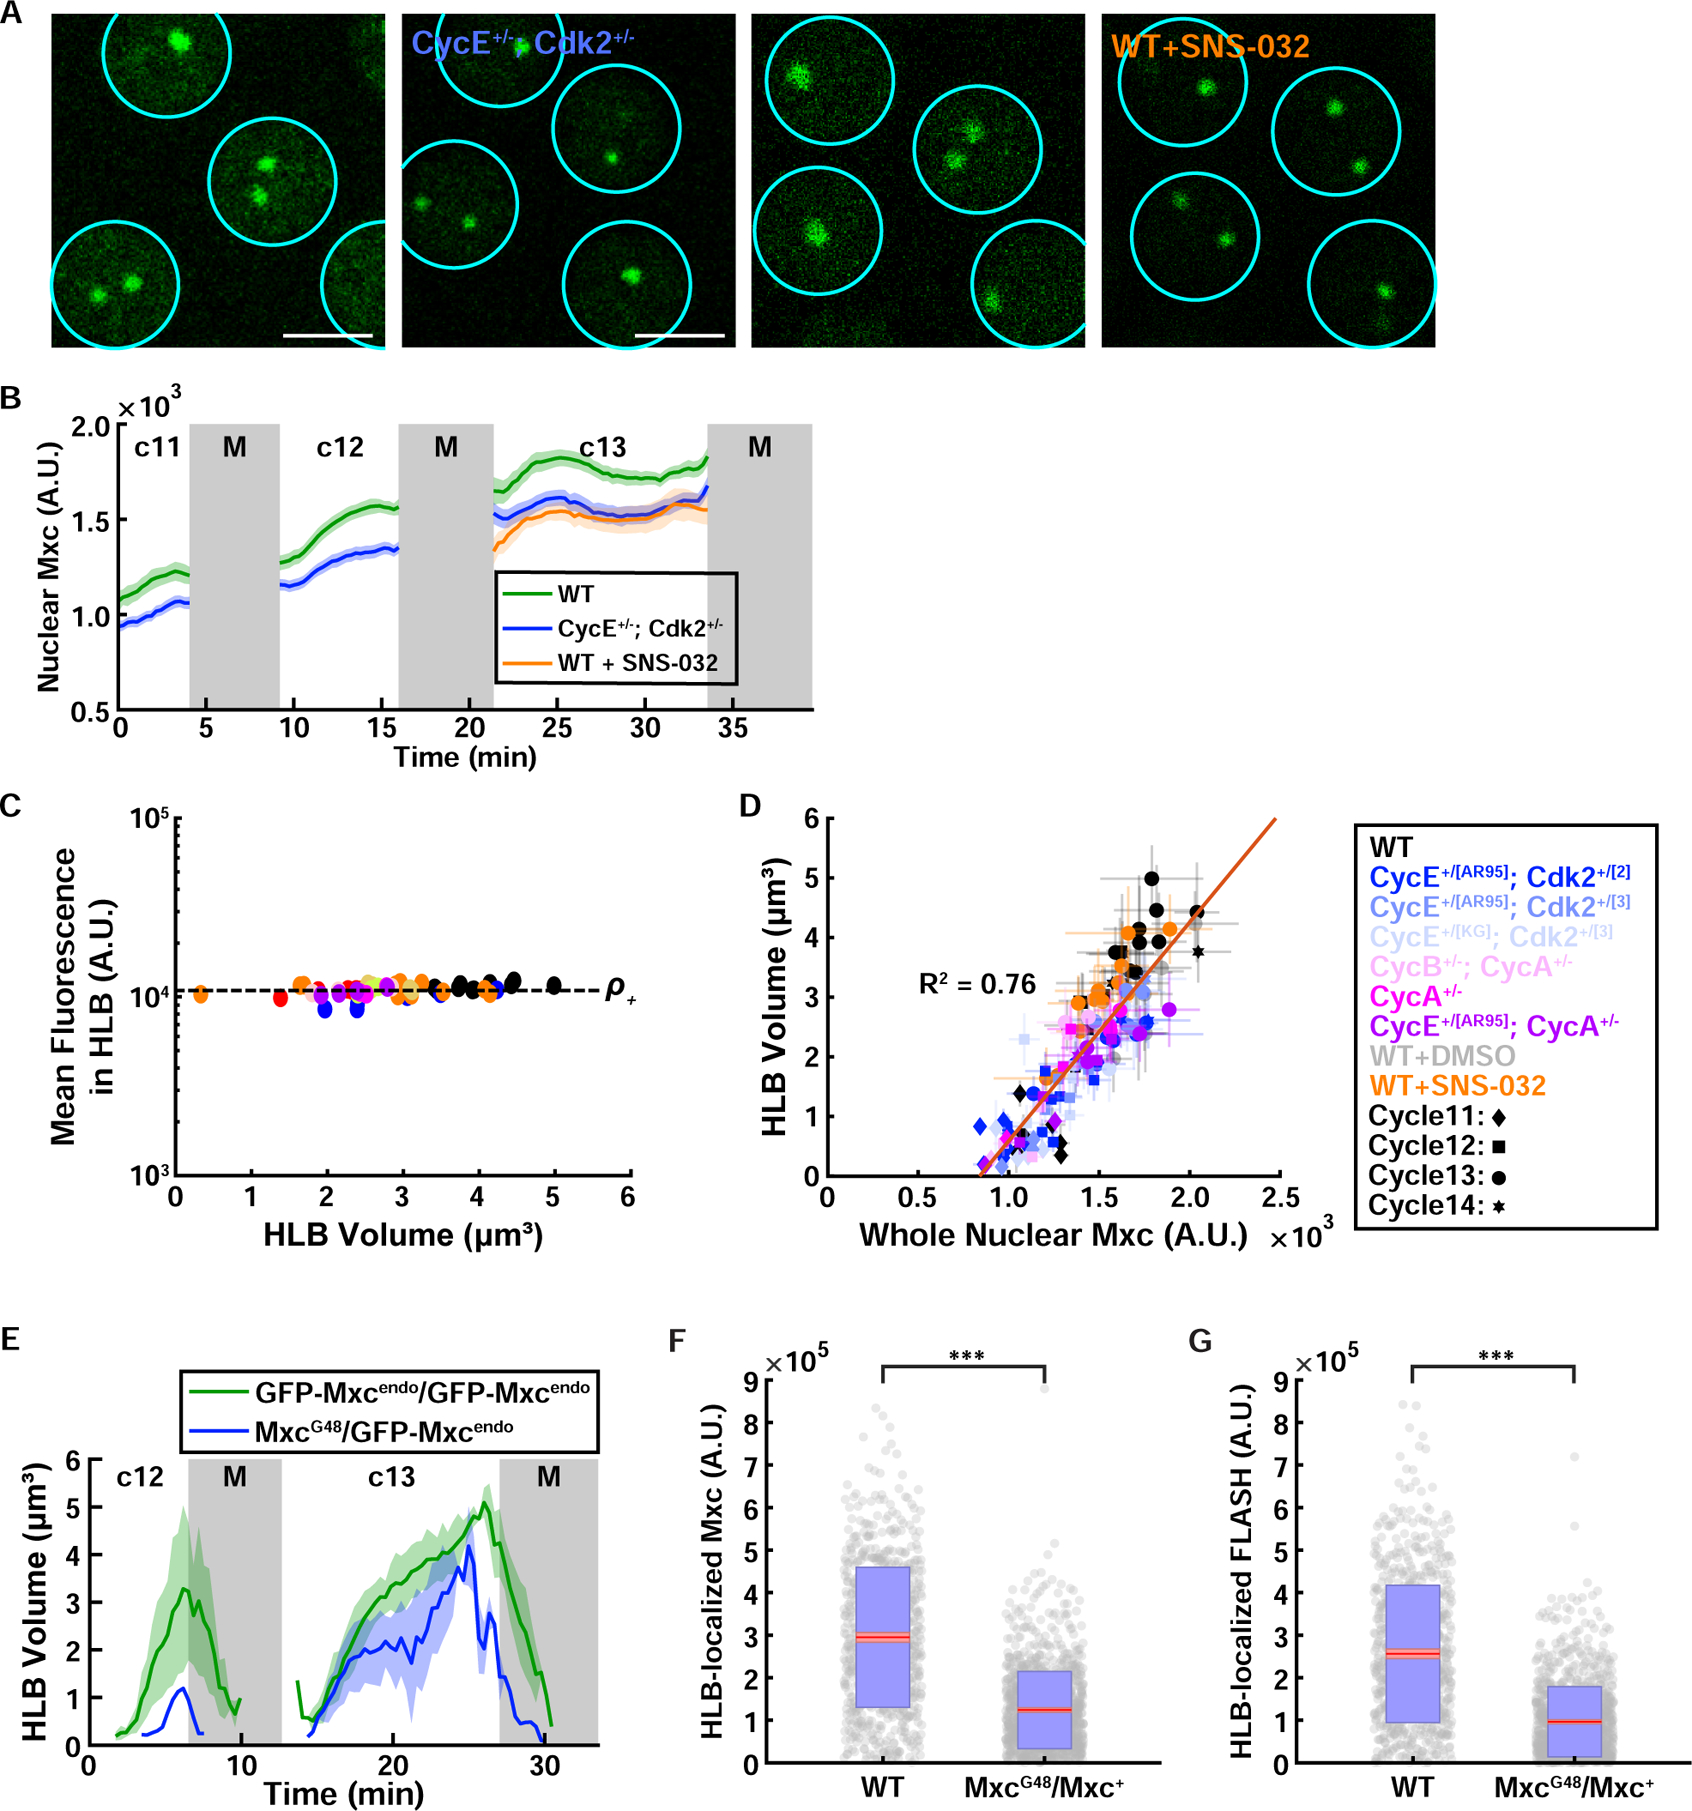
(A) Confocal images of HLBs for embryos laid by WT mothers, CycE+/−; Cdk2+/− mothers, DMSO control injected embryos, and Cdk2 inhibitor injected embryos. (B) Nuclear Mxc concentration for embryos laid by WT (green, N=10 embryos) and CycE+/−; Cdk2+/− mothers (blue, N=17 embryos), and Cdk2 inhibitor injected (orange, N=12 embryos) embryos. (C) Mxc concentration inside HLBs for various genetic conditions altering cell cycle regulators. (D) The simple dependency of HLB size vs Mxc concentration (From Figure 3K) still holds with different genetic conditions. (E) HLB size as a function of time in cell cycles 12 and 13 for wild type embryos and embryos laid by mxc heterozygous mothers, using an endogenously tagged GFP-Mxc line generated with CRISPR. N=3 embryos (homozygote) and 2 embryos (hemizygote). HLB-localized total Mxc (F) and FLASH (G) fluorescence measured from immunofluorescence experiment in WT and Mxc heterozygous (MxcG48/Mxc+) embryos. N=18 embryos, 787 nuclei (WT), 29 embryos, 1140 nuclei (MxcG48/Mxc+). p<10−4 (two sample t test) for both panels. A.U., arbitrary units. c, cycle. M, mitosis. Scale bars, 5μm. Shaded area, SEM.
Reducing Cdk2 activity impairs the efficiency of Histone 3 mRNA 3’ end formation
To test whether the mechanisms controlling HLB growth are functionally linked to histone mRNA biogenesis, we determined whether perturbations of Cdk2 activity affect histone pre-mRNA processing. RD histone mRNAs are not polyadenylated, and instead end in a 3’ stem loop that binds the stem loop binding protein (SLBP) (Marzluff et al., 2008). SLBP is required for the endonucleolytic cleavage resulting in this unique mRNA 3’ end (Sullivan et al., 2001) (Figure 7A, top panel). Because histone mRNA 3’ end processing is tightly coupled to transcription termination (Tatomer et al., 2016), in Drosophila Slbp mutants, processing fails and RNA polymerase continues transcribing downstream of the normal processing site, resulting in longer nascent transcripts as well as cytoplasmic polyadenylated histone mRNA (Sullivan et al., 2001; Lanzotti et al., 2002). Consequently, defects in histone pre-mRNA processing can be measured by in situ hybridization using probes complementary to the region downstream of the histone H3 pre-mRNA processing site (Lanzotti et al., 2002). We designed 3 probes that hybridize to this region. One spanned the intergenic region (Figure S7A), and the other two probes were the 5’ half or 3’ half of the intergenic region between H3 and H1 (Figures 7A and S7A). Detection of focal, nuclear signal with these probes indicated transcripts that went passed the normal transcription termination site and were still associated with the chromatin. These included nascent mRNAs that have not been cleaved at the normal location. In embryos derived from Slbp+/− heterozygous mothers, the level of nascent, uncleaved H3 transcripts was increased compared to wild type (Figures S7B and S7C) while having comparable HLB size (Figure S7E), indicating less efficient pre-mRNA processing. Using this approach, we found that the level of nascent, uncleaved H3 transcripts was elevated in embryos laid by mothers heterozygous for both Cyclin E and Cdk2 (Figures 7C, S7C, and S7E), while the levels of nascent H3 transcript in these embryos were essentially indistinguishable to wild type levels measured in HLBs of similar size (Figure S7D). Using the most 3’ downstream probe, which stringently detects nascent, uncleaved H3 transcript, we never detected hybridization in wild type embryos (0 out of 31), but we detected it in a small fraction of embryos laid by mothers heterozygous for both Cyclin E and Cdk2 (3 out 25 embryos, p-value<0.05). Thus, reducing Cdk2 activity resulted in decreased efficiency of nascent H3 histone mRNA processing.
Figure 7. Reduced Cdk2 activity results in an increase in nascent RNA 3’ of the normal H3 mRNA cleavage/termination site.
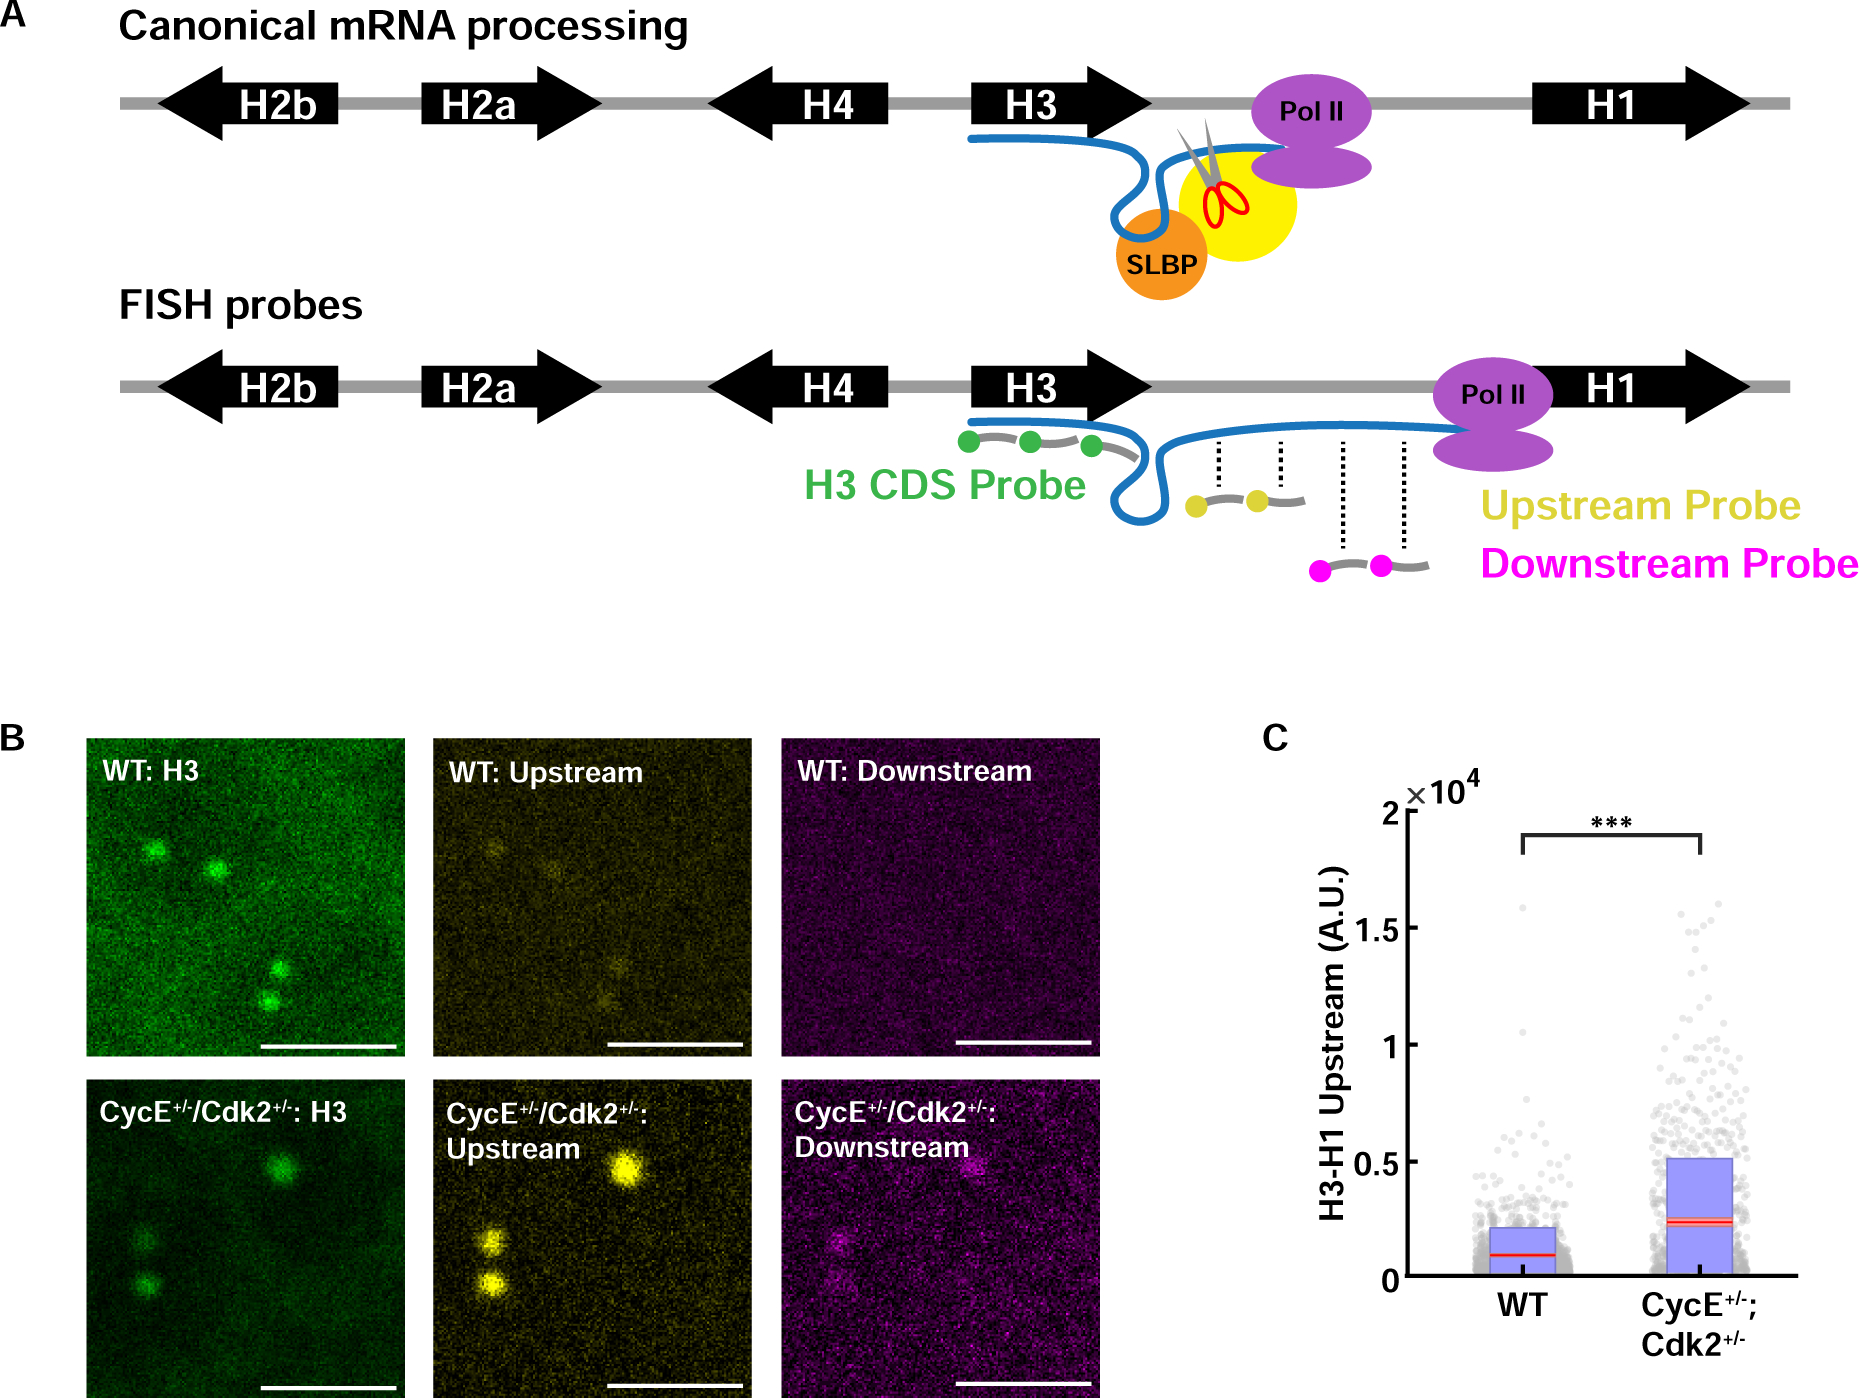
(A) Schematic of canonical mRNA processing (top) and the fluorescence in situ hybridization (FISH) probes for histone H83 coding sequence (CDS) and H3-H1 intergenic sequence (bottom). Probes used to detect misprocessing are indicated as ‘upstream’, and ‘downstream’ probes and target the sequence regions as depicted. Yellow circle on top panel is the U7 snRNP bound to the cleavage complex. (B) Representative images of fixed embryos stained with the H3 CDS probe and H3-H1 intergenic probes, for embryos laid by WT and CycE+/−/Cdk2+/− mothers. Scale bars, 5μm. (C) Quantification of misprocessed mRNA levels detected by ‘upstream’ probe for embryos laid by WT and CycE+/−/Cdk2+/− mothers. Red, 95% confidence interval for the mean. Blue, 1 standard deviation. N=39 embryos, 1569 HLBs (WT); N = 39 embryos, 861 HLBs (CycE+/−/Cdk2+/−). p<10−4 (two sample t test) See also Figure S7.
DISCUSSION
In this study, we investigated the mechanisms of formation of the HLB, an evolutionarily conserved nuclear body that controls the production of RD histone mRNAs. We demonstrated that HLB formation is driven by two mechanisms: 1) seeding from the histone locus, which is enhanced by transcription and initiates liquid-liquid phase separation; and 2) nuclear accumulation of Mxc, which is controlled by Cdks. Collectively, our findings reveal a strategy for the regulation of the growth of nuclear bodies: seeding by genomic loci and transcription overcomes the stochastic step of nucleation and control of nuclear levels of body components by signaling ensures accurate growth dynamics. The importance of seeding by activation of rDNA genes at the maternal to zygotic transition to overcome the stochasticity of nucleation was previously demonstrated for the formation of the nucleolus (Falahati et al., 2016), arguing that seeding represents a general strategy for the control of the formation of nuclear bodies during early development. Our theoretical and experimental work further extends this concept by demonstrating that in an out-of-equilibrium regime the level of seeding contributes to determining the growth rate of nuclear bodies, demonstrating an additional layer of regulation. The concentration of nucleolar components determines the size of the nucleolus (Weber and Brangwynne, 2015), similarly to our observations for the control of the size of the HLB by nuclear Mxc concentration. In the future, it will be interesting to determine which signaling mechanisms control nucleolar component concentration in the nucleus, and whether there is a relationship between size and function similar to the one we have proposed here for the HLB.
The HLB is a phase separated nuclear body
Phase separation is a highly stochastic process when it is initiated by the random formation of droplets by nucleation. In such a scenario, fluctuations must drive the formation of structures bigger than the critical radius needed to overcome the effects of surface tension. As a consequence, the size of phase-separated objects during their growth phase can be quite variable. Mechanisms of seeding can provide a way to accurately control the initial step of phase separation, thus reducing variability and ensuring control of the number of phase-separated objects (Falahati et al., 2016). Indeed, the HLB invariably forms at RD histone loci, as clearly illustrated by the syncytial fly embryo in which all nuclei only have either one or two HLBs depending on whether the homologous RD histone loci are paired or not. In the absence of histone loci, Mxc molecules can still phase separate, but the resulting foci are variable in size and number. Our theoretical analysis also shows that in the initial, non-equilibrium phase of growth the levels of seeding not only overcome the need for nucleation but, together with nuclear concentration, directly impact the rate of growth of phase-separated objects. Thus, our experimental and theoretical analysis argue for a non-equilibrium mechanism that allows the precise control of the size of a nuclear body.
Our data presented here and previously (Salzler et al., 2013) indicate that transcription of RD histone genes plays a crucial role in facilitating complete assembly of the HLB. In addition, tethering an engineered H2b mRNA to a lacO array integrated into the HeLa cell genome drives the recruitment of HLB factors, including NPAT (Shevtsov and Dundr, 2011). These observations suggest that interactions between nascent mRNA and proteins forming the HLB might facilitate phase separation. Consistent with this idea, recent studies have indicated that changes in RNA/RNA-binding protein ratios or mRNA structure can modulate the formation and composition of liquid-liquid phase-separated bodies (Langdon et al., 2018; Maharana et al., 2018).
The specific nature of nascent RD histone RNA/protein interactions and their role in the establishment of the HLB remains to be fully elucidated. Importantly, during later developmental stages, HLBs are present in cells that are not replicating and not expressing histone genes (Liu et al., 2006; White et al., 2007), arguing that the histone locus is also able to seed the formation of HLBs in the absence of transcription. These results are consistent with our alpha-amanitin injections in which HLB size is highly reduced but still only one or two GFP-mxc foci are observed, perhaps representing proto-HLBs that assembled at the histone loci. These observations suggest that HLB components must be able to bind to both DNA and nascent mRNA and that high transcriptional levels increase these binding interactions, thus enhancing the ability of the histone locus to seed the formation of HLBs. How HLB factors recognize the Drosophila RD histone locus is not known, but GAGA-binding, zinc finger protein CLAMP was recently shown to interact with the H3-H4 promoter region (Rieder et al., 2017), which is necessary for HLB formation (Salzler et al., 2013). In the future, it will be important to elucidate which protein-DNA and protein-mRNA interactions are important for the regulation of HLB growth.
Carrying out RD histone mRNA transcription and processing in a phase-separated compartment within the nucleus may facilitate proper histone mRNA biosynthesis. Critical processing factors such as U7 snRNP and FLASH are present in low concentrations within cells. The HLB contains a high local concentration of processing factors, thereby increasing the efficiency of RD histone mRNA biosynthesis (Tatomer et al., 2016; Wagner et al., 2007), and phase transition may drive this process. Several of the factors involved in canonical mRNA polyadenylation, including those that carry out pre-mRNA cleavage (e.g. Symplekin and the CPSF73/CPSF100 endonuclease), are also required for formation of the unique metazoan RD histone mRNA 3’ end (Marzluff and Koreski, 2017). The cleavage complexes involved in polyadenylation and RD histone mRNA processing are distinct (Sullivan et al., 2009), and thus phase transition might also function to exclude the canonical polyadenylation machinery from accessing RD histone genes.
HLB size might contribute to efficient RD histone mRNA biosynthesis
In addition to the biophysical properties afforded by phase transition, the size of nuclear bodies may contribute to their function. Our microscopic and immuno-FISH data reveal that HLB size in the early fly embryo is remarkably consistent. This observation suggests tight control of HLB size, and thus perhaps that HLB size is functionally relevant. We found that HLB size is closely linked to the nuclear concentration of Mxc, which we found depends on the activity of Cdks in rapidly cycling nuclei. In fact, our scaling analysis argues that the effect of Cdks on HLB size can be entirely captured by regulation of Mxc nuclear concentration. This regulation is different from that observed for other phase separated organelles where phosphorylation directly controls their ability to demix (Boeynaems et al., 2018). Since altering Cdk2 activity not only reduces Mxc concentration and HLB size but also results in the appearance of misprocessed nascent H3 mRNA, it is tempting to speculate a link between size and function of HLBs. We propose that the amount of processing enzymes recruited to HLBs is proportional to HLB size and that the tight control of HLB growth ensures the efficient processing of nascent histone mRNAs at the maternal-to-zygotic transition. In this way the control of HLB size via Cdk activity would be an important mechanism by which Drosophila embryos achieve functional control of histone mRNA biogenesis. However, our data cannot exclude the possibility that Cyclin E/Cdk2-mediated phosphorylation contributes directly to histone mRNA biosynthesis in addition to, or independently, of control of HLB size.
In conclusion, our work identifies the molecular and physical mechanisms of formation of the Histone Locus Body, a nuclear membrane-less organelle playing a crucial role in the biosynthesis of RD histone mRNAs. Our results indicate that perturbations of Cdk2 activity reduce HLB size and impair histone mRNA biogenesis, thus suggesting a link between size and function of a nuclear body. Our results with the HLB suggests a general strategy for accurate size control of nuclear bodies forming by phase-separation centered on a mechanism integrating transcription and kinase signaling. We speculate that the coupling of seeding from nascent mRNAs and signaling-dependent regulation of nuclear concentration represents a general mechanism ensuring that nuclear bodies provide accurate control of gene regulatory functions.
STAR METHODS
RESOURCE AVAILABILITY
Lead Contact
Further information and requests for resources and reagents should be directed to and will be fulfilled by the Lead Contact, Stefano Di Talia (stefano.ditalia@duke.edu).
Materials Availability
Newly generated plasmids and fly lines in this study have not been deposited to anywhere but are available without restriction from the lead contact Stefano Di Talia (stefano.ditalia@duke.edu).
Data and Code Availability
The codes generated during this study are available at Github at the following link: https://github.com/woonyunghur/HLB
The imaging data are available upon request from the Lead Contact.
EXPERIMENTAL MODEL AND SUBJECT DETAILS
Fly Lines and Maintenance
All experiments in this study used Drosophila embryos that were at the syncytial blastoderm or early cellular blastoderm stage (nuclear cycles 10–14). Fly stocks were kept in an incubator (without light/dark cycle) set at 25 °C. Embryos were collected on apple juice agar plates with yeast paste from cages containing animals of both sexes kept in an incubator (without light/dark cycle) set at 25 °C. The fly lines used or generated in this study were obtained using standard genetic methods and are listed in the Key Resources Table.
KEY RESOURCES TABLE
| REAGENT or RESOURCE | SOURCE | IDENTIFIER |
|---|---|---|
| Antibodies | ||
| Monoclonal mouse anti-Ser/Thr-Pro MPM-2 | Upstate Biotechnology, Lake Placid, NY | Davis et al., 1983 |
| Affinity-purified rabbit anti-Mxc | Pocono Rabbit Farm & Laboratory, Inc. | White et al., 2011 |
| Affinity-purified guinea pig anti-FLASH | Pocono Rabbit Farm & Laboratory, Inc. | White et al., 2011 |
| Halocarbon Oil 27 | Sigma-Aldrich | CAS Number 9002-83-9 (H8773) |
| Halocarbon Oil 700 | Sigma-Aldrich | CAS Number 9002-83-9 (H8898) |
| Chemicals, Peptides, and Recombinant Proteins | ||
| SNS-032 | Selleck Chemicals | Catalog No S1145 |
| Alpha-amanitin | Sigma-Aldrich | CAS Number 23109-05-9 |
| Roscovitine | Sigma-Aldrich | CAS Number 186692-46-6 |
| Aqua-Poly/Mount | Polysciences, Inc. | Cat #: 18606 |
| Experimental Models: Organisms/Strains | ||
| D. melanogaster; w; DHB-mCherry | This paper | N/A |
| D. melanogaster; w; ubi-gfp::mxc | R. J. Duronio (White et al., 2011) | N/A |
| D. melanogaster; w; ubi-gfp::mxcLisH-AAA | R. J. Duronio (Terzo et al., 2015) | N/A |
| D. melanogaster; w; ΔHisC, twi-GAL4/CyO | R. J. Duronio (McKay et al., 2015) | N/A |
| D. melanogaster; w; ΔHisC/ΔHisC; 12xWT/12xWT | R. J. Duronio (McKay et al., 2015) | N/A |
| D. melanogaster; w; grp209 lok30/grpz5170 lok30 | J. Sekelsky (LaRocque et al., 2007) | University of North Carolina at Chapel Hill |
| D. melanogaster; w; SLBP[12]/TM3, Sb[1] Ser[1] Tw | R. J. Duronio (Sullivan et al., 2001) | N/A |
| D. melanogaster; w[1118] | A. Bejsovec | Duke University |
| D. melanogaster; w[*]; CycA[C8LR1]/TM3, Sb[1] P{w[+mC]=35UZ}2 | Bloomington | BDSC: 6627 FlyBase: FBst0006627 |
| D. melanogaster; w[*]; CycB[2]/CyO, P{ry[+t7.2]=ftz/lacB}E3 | Bloomington | BDSC: 6630 FlyBase: FBst0006630 |
| D. melanogaster; w[*]; Cdk2[2]/TM3, Sb[1] P{w[+mC]=35UZ}2 | Bloomington | BDSC: 6632 FlyBase: FBst0006632 |
| D. melanogaster; w[*]; Cdk2[3]/TM3, Sb[1] P{w[+mC]=35UZ}2 | Bloomington | BDSC: 6636 FlyBase: FBst0006636 |
| D. melanogaster; w[*]; CycE[AR95] cn[1] pr[1] bw[1] wx[wxt]/CyO, P{ry[+t7.2]=ftz/lacB}E3 | Bloomington | BDSC: 6637 FlyBase: FBst0006637 |
| D. melanogaster; y[1] w[67c23]; P{y[+mDint2] w[BR.E.BR]=SUPor-P}CycE[KG00239]/SM6a | Bloomington | BDSC: 13071 FlyBase: FBst0013071 |
| D. melanogaster; w; EGFP-Slp1-BAC | This manuscript | N/A |
| D. melanogaster; w mxcG48/FM7C, twi-gfp | R. J. Duronio (White et al., 2011) | N/A |
| D. melanogaster; w gfp-mxc | R. J. Duronio (This manuscript) | N/A |
| Oligonucleotides | ||
| See Supplementary Table S1 for information on all oligonucleotides used in this study | N/A | N/A |
| Software and Algorithms | ||
| MATLAB R2018a | Mathworks | N/A |
| Adobe Illustrator CC 2018 | Adobe | N/A |
| JMP | https://www.jmp.com | N/A |
METHOD DETAILS
Molecular Biology and Transgenic Flies
The DHB Cdk sensor (human DNA Helicase B amino acids 994–1087 fused with mCherry on the C-terminus) fragment was generated by double stranded oligo synthesis (gBlocks Gene Fragments, Integrated DNA Technologies, Inc.). The plasmid pBabr containing the maternal Tubulin promoter and the spaghetti squash 3’ UTR (a gift of Yu-Chiun Wang and Eric Wieschaus, Princeton University), was digested with BglII and SpeI to be used as the backbone. Using Gibson assembly (NEB), this backbone fragment, mCherry fragment generated from PCR, and the DHB fragment from gBlocks were ligated to yield the final product plasmid. The mutant version of Cdk sensor DHB4A-mCherry (Figure S5) was generated similarly but by introducing mutation of 4 putative phosphorylation serine residues into alanines (S12A, S28A, S55A, S65A) in the sequence of the DHB fragment. The assembled construct was then injected into ϕC31 based fly line zh-86Fb (http://www.flyc31.org), which has the insertion site at 86Fb on the 3rd chromosome.
To generate the endogenously tagged GFP-mxcendo allele via CRISPR genome editing, we injected yw; nos-cas9 (II-attP40) embryos (BestGene, Inc.) with two plasmids, one containing a guide sequence targeting the 5’ end of the mxc gene and one containing a repair template. The guide, including U6 promoter and gRNA scaffold, and repair template were synthesized by Genewiz. The guide sequence was designed using the flycrispr target finder (http://targetfinder.flycrispr.neuro.brown.edu/) and the Drosophila melanogaster reference genome, r_6. The mxc target sequence was GATTGTCCTGCATTCGGACG TGG. The repair template contains a sequence encoding “super folder” GFP (sfGFP) and a linker sequence (CACCGGTATACCAGCTTGTACAAAAAGGCGGGAAGCGCAGCGGCCCCATTTACT) inserted just before the start codon of Mxc, plus homology arms of 1 Kb upstream and downstream of the start codon (Figure S1A). Adult females derived from injected embryos were crossed to FM7c males, and adult males derived from injected embryos were crossed to yw/FM7c virgin females. Single FM7c containing female progeny were backcrossed to FM7c males and then these females were screened for the presence of the sfGFP insertion via PCR using primers to the mxc locus (Figure S1A). Progeny from parents that were positive for sfGFP insertion were again crossed to FM7c flies, and homozygous yw, GFP-mxcendo lines were established.
All live imaging experiments (except the experiment with the CRISPR engineered GFP-Mxcendo lines) were done with embryos expressing transgenic Mxc-GFP in the presence of endogenous Mxc. For convenience, these Mxc-GFP lines were indicated as ‘WT’ in the main text and figures. All immuno-FISH experiments were done with embryos that do not express any transgenic Mxc. The ‘WT’ embryos in these experiments were w1118. Details on all transgenic flies used in this study are listed in the Key Resources Table.
Live imaging of HLBs
Flies of desired genotype were placed in a cage with an apple juice agar plate and yeast paste. Embryos that were 0–2 hours old were collected and dechorionated by bleaching for 1–1.5 minutes in 50% bleach. Dechorionated embryos were then mounted on an air-permeable membrane with halocarbon oil 27 (Sigma-Aldrich, CAS Number 9002-83-9) and covered with a cover slip. Images were acquired through confocal microscope Leica SP8 and its software Leica Application Suite X (LAS X), with 600Hz scan speed, 20x magnification objective with immersion oil (HC PL APO CS2 20x/0.75 IMM), and 10x zoom which gave 0.073μm/pixel resolution. 488nm laser was used to excite GFP-Mxc, and 561nm laser was used to excite the DHB-mCherry Cdk2 sensor. HyD detectors were used for both channels.
Immuno-FISH
FISH Probes:
We designed FISH probes targeted for Drosophila histone H3 coding sequence (see Table S1 for sequence) to measure the amount of nascent histone transcripts (Figure 7A, bottom panel, ‘H3 CDS Probe’). We also designed similar probes for the downstream sequence of H3 (H3-H1 intergenic region, see Table S1 for sequence) to detect the misprocessed mRNAs (Tatomer et al., 2016). To ensure that our probes are sensitive for the read-through mRNAs, we generated probes of different lengths and target site (Figure 7A, bottom panel, ‘Long’, ‘Short Upstream’, ‘Short Downstream’, see Table S1 for sequences). Custom Stellaris® FISH Probes were designed utilizing the Stellaris® RNA FISH Probe Designer (Biosearch Technologies, Inc., Petaluma, CA) available online at www.biosearchtech.com/stellarisdesigner (Version 4.2) by entering the reported sequences as inputs. The histone H3 coding sequence probes were hybridized with the green fluorescent dye Fluorescein, and the histone H3-H1 intergenic sequence probes were hybridized with either the far-red fluorescent dye Quasar® 670 Dye (‘Long’, ‘Short Downstream’) or the red fluorescent duy CAL Fluor Red 590® (‘Short Upstream’).
Fixation:
Dechorionated embryos were suspended in embryo fixation solution (8mL nuclease-free water, 1mL 10x PBS, 1mL 37% formaldehyde concentrate, and 10mL heptane) and were shaken for 20 minutes in a scintillation vial. Bottom aqueous phase was removed, 10mL methanol was added, and the vial was shaken vigorously for 30 seconds. Devitellinized embryos were pipetted out from the bottom of the methanol layer. The embryos were washed in fresh methanol for 3 times, transferred to a new tube, and were stored at −20°C before staining.
Staining:
Fixed embryos were quenched by rocking in PBT (0.1% Tween-20 in 1x PBS) for 10 minutes for 3 times, rocked in 50:50 PBT:wash buffer (2x SSC, 10% formamide) for 10 minutes, and rocked in the wash buffer for 2 times for 5 minutes at room temperature. Wash buffer was removed and 500mL hybridization buffer (1g dextran sulfate in 10mL wash buffer) was added and incubated for 2 hours at 37°C for pre-hybridization to prevent nonspecific binding. FISH probe mixture was made by diluting the probes to 50nM in the hybridization buffer. The pre-hybridization mixture was removed, the probe mixture was added, and was incubated in the dark at 3°C overnight. The probe mixture was then replaced with blank hybridization buffer and incubated at 37°C in the dark for 30 minutes. The embryos were then washed in the wash buffer for 4 times for 15 minutes, 3 times in PBT for 10 minutes in the dark. Primary antibody mixture (1:20000 MPM-2 in PBT) was added and rocked at 4°C in the dark overnight. The embryos were washed in PBT 3 times for 10 minutes in the dark. Secondary antibody mixture (1:500 Goat anti-Mouse IgG (H+L) Cross-Adsorbed Secondary Antibody, Alexa Fluor 568 in PBT) was added and rocked at room temperature for 2 hours. The embryos were washed in PBT 3 times for 10 minutes and were mounted onto the slides with the Aqua-Poly/Mount Coverslipping Medium.
Injection
Following the dechorionation, the embryos were aligned and glued to a cover slip with a double-sided tape. The embryos were desiccated in an airtight glass container filled with the desiccant Drierite (https://secure.drierite.com/) for 6–8 minutes. About 4μl Inhibitor solution was loaded to the needle Femtotip® II. Using Eppendorf® FemtoJet® Microinjector, embryos were then injected. Embryos were immediately covered with halocarbon oil 700 (Sigma-Aldrich, CAS Number 9002-83-9) following the injection and imaged.
Analysis of HLB FRAP experiments
Since HLBs can grow significantly within the time scale of fluorescence recovery after photobleaching, we used a mathematical model to estimate the export rate koff. Our model assumed that the import rate kon is independent of the concentration inside the HLB, an assumption supported by the observation that the concentration of nucleoplasmic Mxc does not vary significantly over an S phase. By denoting Cu(t) and Cb(t) the concentrations of unbleached and bleached HLBs respectively, we obtain:
Subtracting the second from the first equation, we get
where Cdiff(t) = Cu(t) – Cb(t). While koff depends on time (see correlation with HLB size), we assume that on the timescale of the FRAP experiments koff is essentially constant. Thus, it can be expressed as:
This implies that we can estimate koff from the inverse slope of a linear fit ln Cdiff as a function of time.
Mathematical Modeling
Phase separation is the process by which the two components of a binary fluid spontaneously demix and form domains pure in each component. In our case the two components correspond to the Histone Locus Body (Mxc-rich phase) and the nucleoplasm (phase of low Mxc). Below we describe two different standard theoretical approaches to study the kinetic of phase separation. The first more qualitative approach is based on an effective continuum field theory in 2 dimensions, while the second approach is based on a more realistic and quantitative particle-based lattice model in 3 dimensions (see Bray, 1994 for a comprehensive description of the physics of phase separation).
Continuum field theory.
An effective theoretical description of phase separation can be obtained in terms of the dynamics of the coarse-grained concentration of Mxc (droplet-forming molecule). This can be described by a scalar field ρ(r, t), that is Mxc concentration around a point r at time t. The starting point for a continuum equation describing phase separation is the derivation of a free energy functional. A free energy with a double-well structure, that is a functional with two stable states (bistability), can capture the two phases of the systems. These considerations suggest the following free-energy functional:
The first term c > 0 vanishes for homogenous configurations and disfavors phase separation, it represents the energetic cost for interfaces between regions with high and low concentrations. The second term favors phase separation by accounting for self-affinity of the molecules. V(ρ) can be taken as:
with λ > 0. An effective dynamical model for phase ordering kinetics governing the time evolution of the concentration field can be obtained by noticing that the total number of Mxc molecules can be considered fixed in first approximation. Thus, one can derive a continuity equation: ∂tρ = −∇ ∙ j, which essentially describes the diffusive transport of the concentration. A proper choice for the current term is j = −M∇μ, where is the chemical potential of the system and M is a constant mobility or diffusion coefficient. From this, one derives the Cahn-Hilliard (CH) equation:
In order to mimic the formation and the growth of HLB droplets at specific chromosomal locations (and the role of transcription in seeding), we specify those positions by the vector r0. We modify the free-energy by adding a spatial dependent linear term of the form:
where:
Such linear term lowers the free-energy of the high-concentration phase by tilting the potential in the vicinity of r0. The prefactor h0 is chosen in such a way that V(ρ) – h0ρ has a unique minimum very close to ρ+. Hence in a region of size of order σ around r0 the only equilibrium phase is the one rich in Mxc. This modification mimics closely the seeding observed at the histone locus. The parameter σ can be thought as the one controlling the seeding level.
The CH equation can be solved numerically by direct integration by discretizing space and time. Our numerical results were obtained for λ = 1, h0 = 0.01, M = 10−3, c = 10−4, on a 2d box of linear size L = 2 with periodic boundary conditions. Note that ! must be chosen in such a way that the interface thickness is much smaller than the size of the box. Positions were discretized on a square grid of mesh size δx = 10−2 and the integration time step is set to δt = 5 ∙ 10−5 in order to avoid numerical instabilities. The initial conditions are chosen randomly but in a way that preserves the periodicity of the concentration field. We adopted the convention to define the radius of the HLB RHLB as the average distance from the center of the droplet where the concentration field drops below 1.2-fold of the average concentration ρ0. The size of the droplet is thus just defined as the total amount of fluid contained inside it. The numerical results for the average size of the HLB are plotted in Figure 3I for ρ0 = 0.24 and different seeding levels σ. Data were averaged over 20 independent runs with random initial conditions. We also plot the average size of the droplets which spontaneously form in absence of seeding (h0 = 0) at the same average concentration ρ0.
As indicated in Figure 3I, the growth of HLB is characterized by three dynamical regimes. 1. A fast growth at short times, due to the absorption of the fluid close to the absorbing well in r0. In this regime, the growth of the HLB depends strongly of the seeding level and is limited by diffusion. 2. A slower growth is observed at large times. In this regime, other (much smaller) droplets are formed far from r0, outside HLB, due to spontaneous phase separation. The size of HLB keeps increasing with time due to the phenomenon known as Ostwald Ripening (OR), where the minority phase forms spherical droplets, and the smaller droplets are absorbed through diffusion into the larger ones. 3. In the very long time limit, equilibrium is reached, and the size of HLB saturates to an asymptotic value: a unique droplet of high concentration is present in the center of the box, surrounded by the majority phase at low concentration. The equilibrium size of the droplet is thus just given by concentration conservation and is clearly independent on the seeding level.
Phase separation in a particle-based lattice model.
In order to obtain more quantitative comparisons with the experiments, we studied the kinetic of phase separation in a particle-based model, defined on a 3d cubic lattice of linear size L. On each node of the lattice we define the occupation number ni = 0,1 corresponding respectively to sites not-occupied or occupied by a droplet-forming molecule. The self-affinity of Mxc proteins was mimicked by a simple shortrange attractive interaction between molecules occupying neighboring sites on the lattice. The energy function is:
where 〈i, j〉 denotes the sum over all nearest-neighboring sites on the cubic lattice. The total number of particles (N = Σi ni) is assumed constant and the total concentration is thus given by ρ0 = N/L3. Hereafter, we set J = 1 without loss of generality. Below a critical temperature, the model undergoes a phase separation in a phase with high average concentration and a phase with low concentration. Although the model is extremely schematic, the critical properties of the liquid-gas transition, including the critical dynamics and the kinetics of phase separation, are universal and do not depend on the specific microscopic description of the molecular interactions. Most features are therefore well captured by the simple lattice model considered here. However, some quantitative differences occur when more refined and realistic microscopic descriptions are considered. The effects of seeding at the histone locus were modeled by locating Nb particles at specific fixed positions around the center of the box. These particles interact strongly with the other particles via a coupling J′ > J (in practice we set J′ = 4J) and are not allowed to move. The dynamics of phase separation was studied via Monte Carlo (MC) simulations starting from random initial configurations, in which particles were randomly placed on the sites of the lattice. In particular, we use the Metropolis-Hastings algorithm, which is one of the most commonly used MC algorithm. Energy barriers for droplet diffusion on the lattice are much higher compared to the continuum theory. For this reason OR occurs on much longer time scales and is strongly suppressed on the time window explored by the MC simulations. We are thus only able to observe the first regime of the dynamics, in which the HLB droplet is formed and grows relatively fast around the center of the box due to the interplay of absorption and phase separation. At this stage, smaller droplets outside HLB start to be formed in random positions, but they diffuse so slowly that the system remains stuck in out-of-equilibrium configurations where the size of HLB is roughly constant for very long time. This is precisely the dynamical regime relevant for the experiments.
In order to compare with the experimental results, we measure the average size of the HLB droplets reached after 105 MC steps, varying the average concentration ρ0 and the seeding level Nb. The numerical results are shown in Figure 3J, where we plot the number of molecules inside the HLB droplet, defined as a function of the average concentration outside HLB for different seeding levels. For completeness, in Figure S3B we also plot the number of particles inside the HLB as a function of ρ at a slightly higher temperature, but still below the critical temperature. This confirms the fact that, as far as the temperature is kept below the critical one, temperature is an irrelevant parameter, partially supporting the CH approach at T = 0 described in the previous section. The situation is strikingly different, instead, when the temperature is raised slightly above the critical temperature. In this case, phase separation does not take place and the formation and the growth of the HLB droplet is due to absorption only, and the HLB size does not exhibit the linear dependence on concentration. In fact, the size depends only very weakly on the concentration level and seems to saturate for large ρ to a finite value which is roughly 2Nb. The interpretation of these results is as follows: At high temperature, when phase separation does not take place, the size of HLB is proportional to few Nb, since binding becomes ineffective after all the binding sites have absorbed one molecule. On the contrary, at low temperature, in presence of phase separation, binding is self-amplified by the molecular affinity: The molecules at the surface of HLB effectively act as new binding sites for the surrounding molecules, yielding the formation of much larger droplets.
QUANTIFICATION AND STATISTICAL ANALYSIS
Quantitative image analysis
Confocal images were exported as .tif files from LAS AF Lite software and were imported into MATLAB for image analysis. Different custom scripts were written for different analyses performed. HLB masks were generated using threshold-based segmentation and HLB volume was approximated by measuring the space occupied by multiple segmented masks in different z-planes (Figure 1b). The HLB-associated total fluorescence was then calculated by multiplying the approximated volume to the average fluorescence level in the HLB masks. The HLB volume and HLB-associated total fluorescence throughout this study was quantified by summing the total fluorescence per nucleus, as two HLBs on the two different homologous chromosomes sometimes fuse with each other and this fusion resulted in simple addition of the two droplets as opposed to promoting further growth (Figure 1F). We also observe that the diffraction limited voxel for our imaging conditions is about 0.1 0μm3, which implies that HLBs contain several such voxels and our ability to measure size is not limited by microscopy. Finally, since most of our conclusions are based on tracking HLBs across time and averaging data across hundreds of HLBs, our measurements of average HLB volume were very robust. Mxc nuclear concentration was estimated as the average GFP-Mxc fluorescence intensity in the nucleus.
The Cdk sensor phosphorylation level was quantified by measuring the average DHB-mCherry fluorescence levels in the nucleus and the surrounding cytoplasm respectively, and then calculating the cytoplasmic-to-nuclear ratio. The circularity index of HLB during fusion was calculated by 4πA/C2 where A is the area of the HLB mask and C is the perimeter of the HLB mask. All statistical analyses were performed by running a one-way ANOVA followed by a Turkey’s Pair test to compare two sets of data.
Quantification of Immuno-FISH results
The number of total histone transcripts and the number of total phospho-Mxc were estimated by measuring the total fluorescence from each staining. Total fluorescence was acquired with similar methods used for live imaging of HLB from the previous section. Normalized misprocessed mRNAs level in HLBs was calculated by total fluorescence of H3-H1 intergenic probe divided by that of H3 CDS probe.
Statistical analysis
All statistical analyses were performed using JMP Pro. Statistical comparison between two experiments was performed by two-sample t-test. Statistical comparisons between multiple experiments were performed by one-way ANOVA followed by Tukey’s test to compare all pairs. For all measurements, at least three biological replicates were used unless otherwise noted.
Supplementary Material
Video S1. Imaging of GFP-Mxc reveals HLB dynamics during the syncytial blastoderm cycles. Related to Figure 1. Time-lapse video of an embryo expressing GFP-Mxc during nuclear cycles 11–13. Images were acquired with 1/16.24s.
Video S2. Fusion of two HLBs. Related to Figure 3. Time-lapse video showing a single nucleus in which the two HLBs undergo fusion. The embryo expresses GFP-Mxc and was imaged during nuclear cycle 14. Images were acquired with 1/16.24s.
Video S3. GFP-Mxc foci in histone deficiency embryos. Related to Figure 4. Time-lapse video of homozygous histone deficiency embryo expressing GFP-Mxc during nuclear cycles 12–13. Images were acquired with 1/16.24s.
Video S4. Visualization of the Cdk biosensor. Related to Figure 5. Time-lapse video of an embryo expressing the DHB-mCherry sensor during nuclear cycles 11–13. Images were acquired with 1/16.24s.
Video S5. Visualization of HLB dynamics upon Cdk2 inhibition. Related to Figure 5. Time-lapse video of an embryo expressing expressing GFP-Mxc and the DHB-mCherry sensor during nuclear cycle 13 following injection of the SNS-032 drug. Images were acquired with 1/16.24s.
Highlights.
The Histone Locus Body (HLB) forms by phase separation
HLB formation is seeded by the histone locus and zygotic histone gene activation
HLB growth is captured by a theoretical model in non-equilibrium regime
Cdk activity regulates HLB growth and its processing capacity
Acknowledgments
We thank the Bloomington Drosophila Stock Center, the Kyoto Drosophila Stock Center for providing stocks. We thank the Drosophila Genomics Resource Center for constructs. We thank Anna Chao for help with experiments. We thank Mia Hoover for help with CRISPR engineering. We acknowledge discussions with Daniel Lew. We thank Michel Bagnat, Sharyn Endow, Brigid Hogan, Bernard Mathey-Prevot, Chris Nicchitta and members of the Di Talia lab for comments on the manuscript. This work was supported by the E. Bayard Halsted Fellowship (to W.H.), Schlumberger Faculty for the Future Fellowship and an HHMI International Student Research Fellowship (to V.E.D.), and NIH (R01-GM058921 to W.F.M. and R.J.D. and R01-GM122936 to S.D.T.).
Footnotes
Publisher's Disclaimer: This is a PDF file of an unedited manuscript that has been accepted for publication. As a service to our customers we are providing this early version of the manuscript. The manuscript will undergo copyediting, typesetting, and review of the resulting proof before it is published in its final form. Please note that during the production process errors may be discovered which could affect the content, and all legal disclaimers that apply to the journal pertain.
Declaration of Interests
The authors declare no competing interests.
References
- Ali MA, Reis A, Ding LH, Story MD, Habib AA, Chattopadhyay A, and Saha D (2009). SNS-032 prevents hypoxia-mediated glioblastoma cell invasion by inhibiting hypoxia inducible factor-1alpha expression. Int J Oncol 34, 1051–1060. [DOI] [PubMed] [Google Scholar]
- Arias Escayola D, and Neugebauer KM (2018). Dynamics and Function of Nuclear Bodies during Embryogenesis. Biochemistry 57, 2462–2469. [DOI] [PubMed] [Google Scholar]
- Berry J, Brangwynne CP, and Haataja M (2018). Physical principles of intracellular organization via active and passive phase transitions. Rep Prog Phys 81, 046601. [DOI] [PubMed] [Google Scholar]
- Berry J, Weber SC, Vaidya N, Haataja M, and Brangwynne CP (2015). RNA transcription modulates phase transition-driven nuclear body assembly. Proc Natl Acad Sci U S A 112, E5237–5245. [DOI] [PMC free article] [PubMed] [Google Scholar]
- Boeynaems S, Alberti S, Fawzi NL, Mittag T, Polymenidou M, Rousseau F, Schymkowitz J, Shorter J, Wolozin B, Van Den Bosch L, et al. (2018). Protein Phase Separation: A New Phase in Cell Biology. Trends Cell Biol 28, 420–435. [DOI] [PMC free article] [PubMed] [Google Scholar]
- Bongartz P, and Schloissnig S (2019). Deep repeat resolution-the assembly of the Drosophila Histone Complex. Nucleic Acids Res 47, e18. [DOI] [PMC free article] [PubMed] [Google Scholar]
- Brangwynne CP (2013). Phase transitions and size scaling of membrane-less organelles. J Cell Biol 203, 875–881. [DOI] [PMC free article] [PubMed] [Google Scholar]
- Brangwynne CP, Mitchison TJ, and Hyman AA (2011). Active liquid-like behavior of nucleoli determines their size and shape in Xenopus laevis oocytes. Proc Natl Acad Sci U S A 108, 4334–4339. [DOI] [PMC free article] [PubMed] [Google Scholar]
- Bray AJ (1994). Theory of phase-ordering kinetics. Advances in Physics 43, 357–459. [Google Scholar]
- Burch BD, Godfrey AC, Gasdaska PY, Salzler HR, Duronio RJ, Marzluff WF, and Dominski Z (2011). Interaction between FLASH and Lsm11 is essential for histone pre-mRNA processing in vivo in Drosophila. RNA 17, 1132–1147. [DOI] [PMC free article] [PubMed] [Google Scholar]
- Chen R, Wierda WG, Chubb S, Hawtin RE, Fox JA, Keating MJ, Gandhi V, and Plunkett W (2009). Mechanism of action of SNS-032, a novel cyclin-dependent kinase inhibitor, in chronic lymphocytic leukemia. Blood 113, 4637–4645. [DOI] [PMC free article] [PubMed] [Google Scholar]
- Dundr M (2012). Nuclear bodies: multifunctional companions of the genome. Curr Opin Cell Biol 24, 415–422. [DOI] [PMC free article] [PubMed] [Google Scholar]
- Duronio RJ, and Marzluff WF (2017). Coordinating cell cycle-regulated histone gene expression through assembly and function of the Histone Locus Body. RNA Biol 14, 726–738. [DOI] [PMC free article] [PubMed] [Google Scholar]
- Falahati H, Pelham-Webb B, Blythe S, and Wieschaus E (2016). Nucleation by rRNA Dictates the Precision of Nucleolus Assembly. Curr Biol 26, 277–285. [DOI] [PMC free article] [PubMed] [Google Scholar]
- Farrell JA, Shermoen AW, Yuan K, and O’Farrell PH (2012). Embryonic onset of late replication requires Cdc25 down-regulation. Genes Dev 26, 714–725. [DOI] [PMC free article] [PubMed] [Google Scholar]
- Freeman Rosenzweig ES, Xu B, Kuhn Cuellar L, Martinez-Sanchez A, Schaffer M, Strauss M, Cartwright HN, Ronceray P, Plitzko JM, Forster F, et al. (2017). The Eukaryotic CO2-Concentrating Organelle Is Liquid-like and Exhibits Dynamic Reorganization. Cell 171, 148–162 e119. [DOI] [PMC free article] [PubMed] [Google Scholar]
- Heyn P, Salmonowicz H, Rodenfels J, and Neugebauer KM (2017). Activation of transcription enforces the formation of distinct nuclear bodies in zebrafish embryos. RNA Biol 14, 752–760. [DOI] [PMC free article] [PubMed] [Google Scholar]
- Hiraoka Y, Dernburg AF, Parmelee SJ, Rykowski MC, Agard DA, and Sedat JW (1993). The onset of homologous chromosome pairing during Drosophila melanogaster embryogenesis. J Cell Biol 120, 591–600. [DOI] [PMC free article] [PubMed] [Google Scholar]
- Huang WYC, Alvarez S, Kondo Y, Lee YK, Chung JK, Lam HYM, Biswas KH, Kuriyan J, and Groves JT (2019). A molecular assembly phase transition and kinetic proofreading modulate Ras activation by SOS. Science 363, 1098–1103. [DOI] [PMC free article] [PubMed] [Google Scholar]
- Hyman AA, Weber CA, and Julicher F (2014). Liquid-liquid phase separation in biology. Annu Rev Cell Dev Biol 30, 39–58. [DOI] [PubMed] [Google Scholar]
- Kedes LH (1979). Histone genes and histone messengers. Annu Rev Biochem 48, 837–870. [DOI] [PubMed] [Google Scholar]
- Langdon EM, Qiu Y, Ghanbari Niaki A, McLaughlin GA, Weidmann CA, Gerbich TM, Smith JA, Crutchley JM, Termini CM, Weeks KM, et al. (2018). mRNA structure determines specificity of a polyQ-driven phase separation. Science 360, 922–927. [DOI] [PMC free article] [PubMed] [Google Scholar]
- Lanzotti DJ, Kaygun H, Yang X, Duronio RJ, and Marzluff WF (2002). Developmental control of histone mRNA and dSLBP synthesis during Drosophila embryogenesis and the role of dSLBP in histone mRNA 3’ end processing in vivo. Mol Cell Biol 22, 2267–2282. [DOI] [PMC free article] [PubMed] [Google Scholar]
- Li P, Banjade S, Cheng HC, Kim S, Chen B, Guo L, Llaguno M, Hollingsworth JV, King DS, Banani SF, et al. (2012). Phase transitions in the assembly of multivalent signalling proteins. Nature 483, 336–340. [DOI] [PMC free article] [PubMed] [Google Scholar]
- Lifton RP, Goldberg ML, Karp RW, and Hogness DS (1978). The organization of the histone genes in Drosophila melanogaster: functional and evolutionary implications. Cold Spring Harb Symp Quant Biol 42 Pt 2, 1047–1051. [DOI] [PubMed] [Google Scholar]
- Liu JL, Murphy C, Buszczak M, Clatterbuck S, Goodman R, and Gall JG (2006). The Drosophila melanogaster Cajal body. J Cell Biol 172, 875–884. [DOI] [PMC free article] [PubMed] [Google Scholar]
- Ma T, Van Tine BA, Wei Y, Garrett MD, Nelson D, Adams PD, Wang J, Qin J, Chow LT, and Harper JW (2000). Cell cycle-regulated phosphorylation of p220(NPAT) by cyclin E/Cdk2 in Cajal bodies promotes histone gene transcription. Genes Dev 14, 2298–2313. [DOI] [PMC free article] [PubMed] [Google Scholar]
- Maharana S, Wang J, Papadopoulos DK, Richter D, Pozniakovsky A, Poser I, Bickle M, Rizk S, Guillen-Boixet J, Franzmann TM, et al. (2018). RNA buffers the phase separation behavior of prion-like RNA binding proteins. Science 360, 918–921. [DOI] [PMC free article] [PubMed] [Google Scholar]
- Mao YS, Zhang B, and Spector DL (2011). Biogenesis and function of nuclear bodies. Trends Genet 27, 295–306. [DOI] [PMC free article] [PubMed] [Google Scholar]
- Marzluff WF, and Duronio RJ (2002). Histone mRNA expression: multiple levels of cell cycle regulation and important developmental consequences. Curr Opin Cell Biol 14, 692–699. [DOI] [PubMed] [Google Scholar]
- Marzluff WF, Gongidi P, Woods KR, Jin J, and Maltais LJ (2002). The human and mouse replication-dependent histone genes. Genomics 80, 487–498. [PubMed] [Google Scholar]
- Marzluff WF, and Koreski KP (2017). Birth and Death of Histone mRNAs. Trends Genet 33, 745–759. [DOI] [PMC free article] [PubMed] [Google Scholar]
- Marzluff WF, Wagner EJ, and Duronio RJ (2008). Metabolism and regulation of canonical histone mRNAs: life without a poly(A) tail. Nat Rev Genet 9, 843–854. [DOI] [PMC free article] [PubMed] [Google Scholar]
- Matera AG, Izaguire-Sierra M, Praveen K, and Rajendra TK (2009). Nuclear bodies: random aggregates of sticky proteins or crucibles of macromolecular assembly? Dev Cell 17, 639–647. [DOI] [PMC free article] [PubMed] [Google Scholar]
- McKay DJ, Klusza S, Penke TJ, Meers MP, Curry KP, McDaniel SL, Malek PY, Cooper SW, Tatomer DC, Lieb JD, et al. (2015). Interrogating the function of metazoan histones using engineered gene clusters. Dev Cell 32, 373–386. [DOI] [PMC free article] [PubMed] [Google Scholar]
- Miele A, Braastad CD, Holmes WF, Mitra P, Medina R, Xie R, Zaidi SK, Ye X, Wei Y, Harper JW, et al. (2005). HiNF-P directly links the cyclin E/CDK2/p220NPAT pathway to histone H4 gene regulation at the G1/S phase cell cycle transition. Mol Cell Biol 25, 6140–6153. [DOI] [PMC free article] [PubMed] [Google Scholar]
- Mitrea DM, and Kriwacki RW (2016). Phase separation in biology; functional organization of a higher order. Cell Commun Signal 14, 1. [DOI] [PMC free article] [PubMed] [Google Scholar]
- Rieder LE, Koreski KP, Boltz KA, Kuzu G, Urban JA, Bowman SK, Zeidman A, Jordan WT 3rd, Tolstorukov MY, Marzluff WF, et al. (2017). Histone locus regulation by the Drosophila dosage compensation adaptor protein CLAMP. Genes Dev 31, 1494–1508. [DOI] [PMC free article] [PubMed] [Google Scholar]
- Salzler HR, Tatomer DC, Malek PY, McDaniel SL, Orlando AN, Marzluff WF, and Duronio RJ (2013). A sequence in the Drosophila H3-H4 Promoter triggers histone locus body assembly and biosynthesis of replication-coupled histone mRNAs. Dev Cell 24, 623–634. [DOI] [PMC free article] [PubMed] [Google Scholar]
- Sawyer IA, Bartek J, and Dundr M (2019). Phase separated microenvironments inside the cell nucleus are linked to disease and regulate epigenetic state, transcription and RNA processing. Semin Cell Dev Biol 90, 94–103. [DOI] [PubMed] [Google Scholar]
- Schwarz C, Johnson A, Koivomagi M, Zatulovskiy E, Kravitz CJ, Doncic A, and Skotheim JM (2018). A Precise Cdk Activity Threshold Determines Passage through the Restriction Point. Mol Cell 69, 253–264 e255. [DOI] [PMC free article] [PubMed] [Google Scholar]
- Shevtsov SP, and Dundr M (2011). Nucleation of nuclear bodies by RNA. Nat Cell Biol 13, 167–173. [DOI] [PubMed] [Google Scholar]
- Spencer SL, Cappell SD, Tsai FC, Overton KW, Wang CL, and Meyer T (2013). The proliferation-quiescence decision is controlled by a bifurcation in CDK2 activity at mitotic exit. Cell 155, 369–383. [DOI] [PMC free article] [PubMed] [Google Scholar]
- Sprenger F, Yakubovich N, and O’Farrell PH (1997). S-phase function of Drosophila cyclin A and its downregulation in G1 phase. Curr Biol 7, 488–499. [DOI] [PMC free article] [PubMed] [Google Scholar]
- Stroberg W, and Schnell S (2018). Do Cellular Condensates Accelerate Biochemical Reactions? Lessons from Microdroplet Chemistry. Biophys J 115, 3–8. [DOI] [PMC free article] [PubMed] [Google Scholar]
- Strom AR, Emelyanov AV, Mir M, Fyodorov DV, Darzacq X, and Karpen GH (2017). Phase separation drives heterochromatin domain formation. Nature 547, 241–245. [DOI] [PMC free article] [PubMed] [Google Scholar]
- Sullivan E, Santiago C, Parker ED, Dominski Z, Yang X, Lanzotti DJ, Ingledue TC, Marzluff WF, and Duronio RJ (2001). Drosophila stem loop binding protein coordinates accumulation of mature histone mRNA with cell cycle progression. Genes Dev 15, 173–187. [DOI] [PMC free article] [PubMed] [Google Scholar]
- Sullivan KD, Steiniger M, and Marzluff WF (2009). A core complex of CPSF73, CPSF100, and Symplekin may form two different cleavage factors for processing of poly(A) and histone mRNAs. Mol Cell 34, 322–332. [DOI] [PMC free article] [PubMed] [Google Scholar]
- Tatomer DC, Terzo E, Curry KP, Salzler H, Sabath I, Zapotoczny G, McKay DJ, Dominski Z, Marzluff WF, and Duronio RJ (2016). Concentrating pre-mRNA processing factors in the histone locus body facilitates efficient histone mRNA biogenesis. J Cell Biol 213, 557–570. [DOI] [PMC free article] [PubMed] [Google Scholar]
- Terzo EA, Lyons SM, Poulton JS, Temple BR, Marzluff WF, and Duronio RJ (2015). Distinct self-interaction domains promote Multi Sex Combs accumulation in and formation of the Drosophila histone locus body. Mol Biol Cell 26, 1559–1574. [DOI] [PMC free article] [PubMed] [Google Scholar]
- Wagner EJ, Burch BD, Godfrey AC, Salzler HR, Duronio RJ, and Marzluff WF (2007). A genome-wide RNA interference screen reveals that variant histones are necessary for replication-dependent histone pre-mRNA processing. Mol Cell 28, 692–699. [DOI] [PubMed] [Google Scholar]
- Weber SC, and Brangwynne CP (2015). Inverse size scaling of the nucleolus by a concentration-dependent phase transition. Curr Biol 25, 641–646. [DOI] [PMC free article] [PubMed] [Google Scholar]
- Wei Y, Jin J, and Harper JW (2003). The cyclin E/Cdk2 substrate and Cajal body component p220(NPAT) activates histone transcription through a novel LisH-like domain. Mol Cell Biol 23, 3669–3680. [DOI] [PMC free article] [PubMed] [Google Scholar]
- White AE, Burch BD, Yang XC, Gasdaska PY, Dominski Z, Marzluff WF, and Duronio RJ (2011). Drosophila histone locus bodies form by hierarchical recruitment of components. J Cell Biol 193, 677–694. [DOI] [PMC free article] [PubMed] [Google Scholar]
- White AE, Leslie ME, Calvi BR, Marzluff WF, and Duronio RJ (2007). Developmental and cell cycle regulation of the Drosophila histone locus body. Mol Biol Cell 18, 2491–2502. [DOI] [PMC free article] [PubMed] [Google Scholar]
- Yang XC, Burch BD, Yan Y, Marzluff WF, and Dominski Z (2009). FLASH, a proapoptotic protein involved in activation of caspase-8, is essential for 3’ end processing of histone pre-mRNAs. Mol Cell 36, 267–278. [DOI] [PMC free article] [PubMed] [Google Scholar]
- Ye X, Wei Y, Nalepa G, and Harper JW (2003). The cyclin E/Cdk2 substrate p220(NPAT) is required for S-phase entry, histone gene expression, and Cajal body maintenance in human somatic cells. Mol Cell Biol 23, 8586–8600. [DOI] [PMC free article] [PubMed] [Google Scholar]
- Zhao J, Dynlacht B, Imai T, Hori T, and Harlow E (1998). Expression of NPAT, a novel substrate of cyclin E-CDK2, promotes S-phase entry. Genes Dev 12, 456–461. [DOI] [PMC free article] [PubMed] [Google Scholar]
- Zhao J, Kennedy BK, Lawrence BD, Barbie DA, Matera AG, Fletcher JA, and Harlow E (2000). NPAT links cyclin E-Cdk2 to the regulation of replication-dependent histone gene transcription. Genes Dev 14, 2283–2297. [PMC free article] [PubMed] [Google Scholar]
Associated Data
This section collects any data citations, data availability statements, or supplementary materials included in this article.
Supplementary Materials
Video S1. Imaging of GFP-Mxc reveals HLB dynamics during the syncytial blastoderm cycles. Related to Figure 1. Time-lapse video of an embryo expressing GFP-Mxc during nuclear cycles 11–13. Images were acquired with 1/16.24s.
Video S2. Fusion of two HLBs. Related to Figure 3. Time-lapse video showing a single nucleus in which the two HLBs undergo fusion. The embryo expresses GFP-Mxc and was imaged during nuclear cycle 14. Images were acquired with 1/16.24s.
Video S3. GFP-Mxc foci in histone deficiency embryos. Related to Figure 4. Time-lapse video of homozygous histone deficiency embryo expressing GFP-Mxc during nuclear cycles 12–13. Images were acquired with 1/16.24s.
Video S4. Visualization of the Cdk biosensor. Related to Figure 5. Time-lapse video of an embryo expressing the DHB-mCherry sensor during nuclear cycles 11–13. Images were acquired with 1/16.24s.
Video S5. Visualization of HLB dynamics upon Cdk2 inhibition. Related to Figure 5. Time-lapse video of an embryo expressing expressing GFP-Mxc and the DHB-mCherry sensor during nuclear cycle 13 following injection of the SNS-032 drug. Images were acquired with 1/16.24s.
Data Availability Statement
The codes generated during this study are available at Github at the following link: https://github.com/woonyunghur/HLB
The imaging data are available upon request from the Lead Contact.