

Abstract
Purpose:
A phase I clinical trial was designed to test the feasibility and toxicity of administering high-dose spatially-fractionated radiotherapy to MRI-defined prostate tumor volumes, in addition to standard treatment.
Methods and Materials:
We enrolled 25 men with favorable to high-risk prostate cancer and 1–3 suspicious multiparametric MRI (mpMRI) gross tumor volumes (GTVs). The mpMRI-GTVs were treated on day 1 with 12–14 Gy via dose cylinders using a Lattice Extreme Ablative Dose (LEAD) technique. The entire prostate, along with the proximal seminal vesicles (SVs), was then treated to 76 Gy at 2 Gy/fraction. For some high-risk patients, the distal SVs and pelvic lymph nodes received 56 Gy at 1.47 Gy/fraction concurrently in 38 fractions. The total dose to the LEAD dose cylinder volume(s) was 88–90 Gy (112–123 Gy in 2.0 Gy equivalents, assuming an α/β ratio of 3).
Results:
Dosimetric parameters were satisfactorily met. Median follow-up is 66 months. There were no grade 3 acute/subacute genitourinary (GU) or gastrointestinal (GI) adverse events. Maximum late GU toxicity was Grade 1 in 15 (60%), Grade 2 in 4 (16%), and Grade 4 in 1 (4%; sepsis after a post-treatment transurethral resection). Maximum late GI toxicity was Grade 1 in 11 (44%) and Grade 2 in 4 (16%). Two patients experienced biochemical failure.
Conclusions:
External beam radiotherapy delivered with an upfront spatially-fractionated, stereotactic high dose mpMRI-GTV boost is feasible and was not associated with any unexpected events. The technique is now part of a follow-up Phase II randomized trial.
INTRODUCTION
Radiotherapy (RT) has been shown to be an effective treatment for prostate cancer (PCa) using contemporary doses of external beam radiotherapy (EBRT) in the 76–80 Gy range.1,2 Such “escalated doses” have been supported by a series of randomized trials that have established the current standard of care. However, for intermediate and high-risk patients, there is evidence that doses equivalent to greater than 80 Gy in 2 Gy fractions (EQD2Gy >80 Gy) result in additional gains,3–5 with less need for the use of androgen deprivation therapy (ADT).2,4,6 These findings, and that there is a late increase in metastatic disease at about 10 years after radiotherapy.7 indicate that local persistence is a significant issue at whole prostate EDG2Gy doses of 76–80 Gy.
Prostate cancer is hypothesized to respond to greater than 2 Gy fractional doses of radiation to a greater degree than surrounding normal tissue, which is partially explained by radiobiological data consistent with a low α/β ratio.8,9 With extreme doses of 10 Gy and above, other mechanisms, such as endothelial cell death, appear to further enhance cell death.10–12 For many years, extreme RT doses have been achieved using high-dose rate implants, typically given in combination with standard fractionation BRT.13 The basis for the described Phase I clinical trial was the hypothesis that stereotactic delivery techniques targeting smaller multiparametric (mp) MRI-defined dominant tumor volumes are feasible and would not significantly add toxicity. A dominant mpMRI tumor targeted approach is supported by some findings of local persistence mainly in the dominant tumor lesion(s) seen on mpMRI.14 The use of single fraction high dose targeted boosts is distinguished from simultaneous integrated boost methods15–17 for boosting mpMRI- and/or PET-defined volumes that are becoming increasingly popular.
The Lattice Extreme Ablative Dose (LEAD) boost technique described herein is modeled after spatially-fractionated GRID EBRT (SPGRT),18,19 as a conceptualized stereotactic at depth extension of the technique. SPGRT was initially developed to minimize skin and subcutaneous tissue reactions from orthovoltage treatment, with high doses of radiation (typically 10–20 Gy), given in a single fraction interspersed with blocked regions. Used as a standalone palliative treatment or as an adjunct to standard EBRT treatments, SPGRT is hypothesized to increase bystander and abscopal effects effects.4 SPGRT has been adapted to IMRT20 and more recently proton therapy.21
We report on the feasibility and toxicity results of treating 1–3 spatially separated high dose cylinders of 12–14 Gy into each mpMRI-defined GTV, followed by standard fractionated radiotherapy to the prostate and proximal seminal vesicles.
METHODS AND MATERIALS
Protocol design
The feasibility and safety of the LEAD approach was tested in a phase I clinical trial of men with prostate cancer who had at least one DCE-MRI identifiable lesion (Figure S1). The LEAD technique involved placing 1–3 dose cylinder(s) in mpMRI-defined GTVs, wherein each dose cylinder was treated to 12–14 Gy on day 1. Standard fractionation of the planning target volumes (PTVs) was started on day 2 with treatment of the prostate and proximal seminal vesicles (SVs) at 2.0 Gy per day for 38 fractions to 76 Gy. The pelvic lymph nodes were treated in two patients. The total absolute dose for all treatments was 88–90 Gy to the LEAD dose cylinders or an EQD2Gy of 112–123 Gy, assuming an α/β ratio of 3.0, which was used as a conservative estimate. The dose cylinders were limited initially to 7 mm diameter; however, an amendment allowing for up to 12 mm was active for the last 17 patients to allow for greater GTV coverage.
The trial was approved by the Institutional Review Board at the University of Miami (ClinicalTrials.gov: NCT01411319). All patients were provided with written informed consent.
Classification of risk, eligibility, and stratification
Men with Stage T1-T3a adenocarcinoma of the prostate and Gleason score 6–10 with favorable to high-risk features (Table 1) were eligible. Patients were able to refuse or accept up to 6 months of ADT that was not started more than 2 months prior to signing consent. High-risk patients who refused long term ADT were eligible (see Supplementary Methods for protocol risk classification).
Table 1.
Patient characteristics for study cohort organized by whether androgen deprivation therapy (ADT) was administered.
| TOTAL | ADTa | NO ADT | ||
|---|---|---|---|---|
| Variable | N (%) | N (%) | N (%) | p-valueb |
| No of Patients | 25 (100) | 14 (56) | 11 (44) | |
| Age years, median (range) | 67 (44–85) | 67 (44–78) | 71 (52–85) | 0.026 |
| Race/ethnicity | 0.504 | |||
| Non-Hispanic White | 17 (68.0) | 8 (57.1) | 9 (81.8) | |
| Non-Hispanic Black | 1 (4.0) | 1 (7.1) | 0 (0.0) | |
| Hispanic/Latino | 7 (7.0) | 5 (35.7) | 2 (18.2) | |
| Gleason score: Grade Group | 0.125 | |||
| 6: 1 | 3 (12.0) | 0 (0.0) | 3 (27.3) | |
| 7 (3+4): 2 | 12 (48.0) | 7 (50.0) | 5 (45.5) | |
| 7 (4+3): 3 | 7 (28.0) | 4 (28.6) | 3 (27.3) | |
| 8–9:4–5 | 3 (12.0) | 3 (21.4) | 0 (0.0) | |
| T stage | 1.000 | |||
| T1 | 17 (68.0) | 10 (71.4) | 7 (63.6) | |
| T2 | 8 (32.0) | 4 (28.6) | 4 (36.4) | |
| PSA, ng/mL, median (range) | 5.8 (3.1–18.9) | 6.2 (3.1–12.8) | 5.7 (3.8–18.9) | 0.515 |
| PSA groups, ng/mL | 1.000 | |||
| <10 | 17 (68.0) | 10 (71.4) | 7 (63.6) | |
| 10–20 | 8 (32.0) | 4 (28.6) | 4 (36.4) | |
| Follow-up months, median (range) | 66.2 (20.8, 71.1) | 63.1 (20.8, 66.9) | 66.7 (53.7, 71.1) | 0.246 |
| AJCC prognostic groupc | 0.203 | |||
| I | 2 (8.7) | 0 (0.0) | 2 (20.0) | |
| IIA | 17 (73.9) | 10 (76.9) | 7 (70.0) | |
| IIB | 4 (17.4) | 3 (23.1) | 1 (10.0) | |
| Biochemical failured | 1.000 | |||
| Yes | 2 (8.0) | 1 (7.1) | 1 (9.1) | |
| No | 23(92.0) | 13 (92.9) | 10 (90.9) | |
| Endpoint biopsy | 1.000 | |||
| Negative | 11 | 6 | 5 | |
| Positivee | 1 | 1 | 0 | |
| Not performed | 13 | 7 | 6 | |
Abbreviations: AJCC = American Joint Commission on Cancer; SD = standard deviation
ADT was for a median of 6 months (range: 4 to 9 months);
p-values from t-test for continuous variables or Fisher’s exact test for categorical variables;
AJCC 7th edition, Group I = favorable, Group IIA, intermediate, and Group IIB, high risk;
Positive biochemical failure was determined by PSA > nadir plus 2 ng/mL;
Adenocarcinoma with treatment effect.
Pre-enrollment multiparametric MRI:
All patients in the study received a diagnostic mpMRI at 2.5 mm slice thickness consisting of: T2, T1 non-contrast, T1 dynamic contrast-enhanced (DCE) MRI, and diffusion weighted imaging (DWI) with the generation of an Apparent Diffusion Coefficient (ADC) map (see Supplementary Methods). Patients were asked to have a moderately full bladder and empty rectum (bowel preparation procedure). The DCE-MRI scans were obtained pre-contrast and at ~30 sec intervals post-contrast, for a minimum of 10 scans, as described previously.22,23 The GTVs were estimated using DCE-MRI with consideration of the volume of pixels on the ADC map with values of <1000. About a week prior to simulation, four fiducial markers placed in the prostate, with two at the base and two near the apex.
MRI and CT-Simulation
After fiducial marker placement and typically on the same day as CT-simulation, a second limited non-contrast prostate simulation MRI study that included T2w and T2* sequences was done to visualize the fiducial markers (see Supplementary Methods). Using rigid fusion based on the fiducial markers, the simulation MRI was fused to the simulation CT. The diagnostic mpMRI was then fused to the simulation MRI. The GTVs and LEAD dose cylinders were referenced to the fiducial markers.
LEAD planning and acceptance
The LEAD RT dose plan involved the placement of 1–3 cylinders of ~7–−12 mm diameter spaced approximately 1.5 – 2.0 cm apart and extending for the length of the mpMRI GTV volume plus up to 6 mm above and below the GTV. The desired placement of the cylinders was through the center of the GTVs, although off center placement was used to respect OAR constraints. The GTV included the mpMRI-defined suspicious lesions recognized by early phase contrast enhancement on DCE-MRI or by water restriction on the Apparent Diffusion Coefficient (ADC) maps, along with abnormalities on T2-weighted imaging. For anterior lesions in the transition zone, an abnormality based solely on DCE-MRI was insufficient and had to be associated with ADC point value clusters of <1000. The LEAD dose cylinder volume(s) were planned to receive >90% (exact percentage not specified in the protocol) of a planned 12 Gy (14 Gy was allowed, but never prescribed), with a maximum dose of <20 Gy. A variation was considered to be maximum doses ≥20 Gy to 23 Gy, with a protocol violation defined as above this limit.
The organ at risk (OAR) contour definitions are similar to those described in the control arm of the Fox Chase hypofractionation trial24 and are described in the Supplementary Methods. For the LEAD RT day 1 plan, the V3Gy for the anorectum, bladder, and penile bulb were <8% (4.0 Gy Dmax). Protocol variations were V3Gy of 8–10% with a Dmax of 4.5 Gy and a protocol violation being any value above these limits. For the urethra, the V3Gy was <10% with a protocol primary variation 10–20% with a Dmax of 6.0 Gy and a secondary variation for any dose above these limits; there were no specified protocol deviations for the urethral dose. The LEAD dose distribution was delivered by Cyberknife® (Accuray Inc, Sunnyvale, CA) for all patients. The rest of the treatment was carried out either on Cyberknife (n=2) or a standard linear accelerator-based machine (Varian, Palo Alto, CA) (n=23).
Prostate, SV and pelvic lymph node IMRT planning and acceptance
The CTV1 included the prostate and the proximal seminal vesicles (about 10 mm), with an extra 1–2 mm beyond known bulky disease and/or suspected extracapsular extension. The primary planning target volume (PTV1) was 3–5 mm around the CTV1 in all dimensions. For tumors at the base, a margin of 5 mm on the proximal seminal vesicles was recommended. Pelvic lymph node treatment was allowed and was done in two high risk patients. The pelvic lymph nodes (CTV2) were contoured per standard published guidelines;25 however, there was no expansion for the secondary planning target volume (CTV2=PTVnodes) to keep bladder toxicity at a minimum.26
The plans were evaluated by dose-volume histogram analysis based on prior established criteria.27 The PTV1 was planned to receive ≥95% of the prescription dose of 76 Gy in 38 fractions (V100% of ≥95% of the prescription dose); a minor variation was <95% to ≥90% and a violation was <90% of the prescription dose. Assuming an α/β ratio of 3.0, the cumulative EQD2Gy to the LEAD RT dose cylinder with a prescription of 12 Gy would be 112 Gy. PTVnodes, when given, received 56 Gy in the same 38 planned fractions. The objective was that the plan sum of the LEAD stereotactic and standard fractionation treated PTVs would meet the OAR dose limits used previously for a standard fractionation 76 Gy in 38 fraction plan described previously24 (see Supplementary Methods).
Endpoint and statistics
The primary endpoint of the study is to determine the feasibility and toxicity in a Phase I clinical trial. The early and late side effects using the Common Terminology Criteria for Adverse Events (CTCAE) version 4 (NCI, Bethesda, MD) are described. Secondary endpoints include the Phoenix nadir+2 definition of biochemical failure28 and prostate biopsy results 2.0–2.5 years after completion of all treatment.29,30 Continuous variables and categorical variables were compared by using Student’s t-test and Fisher’s exact test, respectively. All tests were two-sided and P<0.05 was considered statistically significant. All analyses were conducted using the SAS software (version 9.4).
RESULTS
Patient enrollment and characteristics
Figure S2 shows a CONSORT diagram outlining patient eligibility, enrollment, and follow-up. The trial was initially planned for 20 patients, but with 19 patients accrued and low toxicity, the trial was expanded to 25 patients on 10/16/2013. One patient was noncompliant and lost to follow-up. Table 1 shows the baseline patient characteristics and disease characteristics for the 25 men enrolled. Mean age was 66.8 years. There were 14 (56%) patients who received short term ADT via an LHRH agonist (leuprolide). Bicalutamide was started a median of 7 days prior to the start of leuprolide injection and was given for a median of 4 months. Of note, one patient received only bicalutamide, and one patient, because of cirrhosis, was treated only with leuprolide. When given, leuprolide was administered for a median of 6 months. Median follow-up time was 66 months (range 21 – 71 months). All patients completed treatment without interruption. Men treated with ADT were significantly older than those who did not receive ADT (Table 1).
Feasibility
Table 2 summarizes the number of GTVs, the GTV volumes, and dose cylinder volumes, and maximum diameters. The mean GTV1 (n=25) volume was 2.5 cc, GTV2 (n=13) − 0.96 cc, and GTV3 (n=4) − 0.82 cc.
Table 2.
Gross tumor volume (GTV) and dose cylinder size
| Parameter | GTV1 (n=25) Mean ± SEM (range) |
GTV2 (n=13) Mean ± SEM (range) |
GTV3 (n=4) Mean ± SEM (range) |
Total Mean (range) |
|---|---|---|---|---|
| GTV Volume (cc) | 2.5 ± 0.37 (0.60 – 8.06) | 0.96 ± 0.19 (0.19 – 2.21) | 0.82 ± 0.33 (0.22 – 1.58) | 3.26 (0.66 – 8.06) |
| Dose Cylinder Volume (cc) | 1.44 ± 0.19 (0.49 – 4.59) | 0.54 ± 0.07 (0.23 – 0.97) | 0.46 ± 0.19 (0.21 – 1.01) | 1.79 (0.66 – 4.59) |
| Dose Cylinder Diameter (cm) | 0.95 ± 0.04 (0.60 – 1.40) | 0.8 ± 0.05 (0.60 – 1.20) | 0.8 ± 0.14 (0.60 – 1.20) | 0.92 (0.60 – 1.40) |
Abbreviations: SEM = standard error of the mean.
A summary of dosimetric parameters for the LEAD boost administered on day 1 is displayed in Table 3. There were no coverage specifications for the dose cylinder targets in the protocol, but, a prescription dose to 90% of the cylinders (D90%) was attempted. The mean cylinder D90% was 11.1 Gy (range 7.7–13.4Gy). In terms of maximum doses to the cylinders (Dmax of <115%), there were no protocol deviations. There were no OAR violations.
Table 3.
Dosimetric parameters for the LEAD boost (12 Gy in 1 Fraction)
| Parameter (unit) | Mean ± SEM (Range) | Goal Constraints |
|---|---|---|
| Cylinder(s) V95 (%) | 82.65 ± 2.84 (26.62 – 100) | NS* |
| Cylinder(s) V90 (%)* | 88.83 ± 2.18 (42.91 – 100) | NS |
| Cylinder(s) D95 (Gy) | 10.45 ± 0.24 (6.75 – 12.94) | NS |
| Cylinder(s) D90 (Gy) | 11.10 ± 0.22 (7.68 – 13.42) | NS |
| Cylinder(s) Mean Dose (Gy) | 13.42 ± 0.20 (10.40 – 15.79) | NS |
| GTV V95 (%) | 58.69 ± 3.98 (6.56 – 99.83) | NS |
| GTV D95 (Gy) | 7.62 ± 0.38 (1.69 – 12.58) | NS |
| Anorectum V3Gy (%) | 0.68 ± 0.21 (0 – 4.07) | <8% |
| Anorectum max dose (Gy) | 3.86 ± 0.55 (3.86 – 4.70) | 4.0 Gy╫ |
| Bladder V3Gy (%) | 0.22 ± 0.08 (0 – 1.58) | <8% |
| Bladder max dose (Gy) | 3.10 ± 0.18 (1.06 – 4.44) | 4.0 Gy╫ |
| Urethra V3Gy (%)§ | 27.11 ± 4.63 (0 – 76.93) | <10% |
| Urethra max dose (Gy) | 5.74 ± 0.51 (2.16–11.60) | 6 Gy |
Abbreviations: SEM = standard error of mean; GTV = gross tumor volume.
NS = Not specified in the protocol, but D90 was used as the main measure;
There was no defined protocol violation for urethral doses higher than the dose goal shown. There were 18 variations, 4 primary (10–20%) and 14 secondary (>20%);
A variation was considered if the max dose was >4.0 Gy and ≤4.5 Gy. A violation was for >4.5 Gy. While there was no protocol violation in the max point dose on the treatment planning station in which the plans were generated, the calculated max point dose to the anorectum in MIM (used to generate the table) in one patient was 4.7 Gy, due to differences in contour interpolations on the two systems.
Table 4 displays a summary of the dosimetry for the 38 fraction conventional plans alone and with the LEAD cylinder plans added. There were no target or OAR dosimetric protocol violations. Table 4 lists the variations.
Table 4.
Dosimetric parameters for the conventional 38 fraction plans, with and without LEAD cylinder day 1 treatments included (Sum Plans).
| PTVs | Prostate+ProxSVs Mean ± SEM (range) | Sum Plan Mean ± SEM (range) | Goal Constraints |
|---|---|---|---|
| PTV1 V100 (%)* | 95.49 ± 0.20 (92.96 – 98.85) | 97.20 ± 0.37 (91.43 – 99.01) | ≥95%* |
| PTV1 D95 (Gy) | 76.20 ± 0.05 (75.81 – 76.92) | 77.28 ± 0.13 (74.95 – 78.62) | 76 Gy |
| PTV1 Mean (Gy) | 79.29 ± 0.21 (78.06 – 81.75) | 81.73 ± 0.23 (80.35 – 84.29) | |
| PTVnodes V100 (%)** | 93.87 ± 0.09 (93.54 – 94.19) | 93.99 ± 0.06 (93.99 – 94.19) | ≥95% |
| PTVnodes D95 (Gy) | 55.73 ± 0.02 (55.70 – 55.75) | 55.80 ± 0.00 (55.79 – 55.80) | 56 Gy |
| OARs | |||
| Anorectum V40Gy (%) | 19.87 ± 1.47 (6.42 – 31.70) | 20.94 ± 1.57 (6.76 – 34.96) | ≤35% |
| Anorectum V65Gy (%) | 6.59 ± 0.75 (2.23 – 17.00) | 7.37 ± 0.83 (2.45 – 18.68) | ≤17% |
| Bladder V40Gy (%) | 19.83 ± 1.85 (3.56 – 37.27) | 20.33 ± 1.88 (3.73 – 38.33) | ≤50% |
| Bladder V65Gy (%) | 7.62 ± 0.77 (1.28 – 13.72) | 8.01 ± 0.83 (1.36 – 16.00) | ≤25% |
| Bowel V45Gy (cc)† | 5.21 ± 3.81 (0.00 – 78.34) | 5.50 ± 3.93 (0.00–79.07) | ≤150 cc ≥45 Gy |
Abbreviations: PTVs = planning target volumes; OARs = organs at risk; ProxSVs = proximal seminal vesicles; SEM = standard error pf the mean; GTV = gross tumor volume; Fx = fraction; NS = not specified in the protocol.
Minor variation for PTV1 was for any V100% value between 90–95%; there was 1 patient at 92.96% with a minor variation that was related in part to treating for 9 fractions with a rectal balloon and then fusing to a plan for the remainder without a rectal balloon; this patient also had bilateral hip replacements.
PTVnodes is the same as the pelvic lymph node CTV2, for which there was no expansion. Two high risk patients had the pelvic lymph nodes treated.
The potential space was contoured.
Genitourinary (GU) adverse events (AEs)
The details of maximum GU toxicity at baseline and at various times after the completion of RT are summarized in Table 5. Toxicity details are subdivided by attribution code. Only toxicity events with attribution codes of “definite,” “probable,” and “possible” were included; events likely unrelated to treatment are not shown. Any prescribed use of a medication, such as tamsulosin 0.4 mg (most frequent alpha blocker used) was coded as a grade 2 reaction when symptoms of frequency/nocturia were present, as per CTCAEv4.0 guidelines. Table 5 shows that all but one patient had preexisting urinary symptoms and this was reflected in the baseline International Prostate Symptom Score (IPSS)31 summarized in Supplementary Table 1. Only one patient had a greater than grade 2 event, which was related to a transurethral resection for urinary obstructive symptoms post-RT that was complicated by sepsis.
Table 5.
Maximum CTCAE V4.0 Genitourinary Toxicity
| BASELINE* SYMPTOMS | TOTAL AEs | CUTE/SUBACUTEa AEs | LATEb AEs | |||||||||||||||||||
|---|---|---|---|---|---|---|---|---|---|---|---|---|---|---|---|---|---|---|---|---|---|---|
| Grade | Grade | Grade 1 | Grade 2 | Grade 1 | Grade 2+ | |||||||||||||||||
| Symptoms/Adverse events | All | 1 | 2 | All | 1 | 2 | All | Definite | Probable | Possible | All | Definite | Probable | Possible | All | Definite | Probable | Possible | All | Definite | Probable | Possible |
| No of patients | 24 | 20 | 4 | 25 | 9 | 16 | 12 | 13 | 15 | 5 | ||||||||||||
| All events | 40 | 35 | 5 | 159 | 109 | 50 | 70 | 18 | 39 | 13 | 29 | 12 | 14 | 3 | 39 | 2 | 24 | 13 | 21 | 0 | 20 | 1 |
| Cystitis non-infective | 0 | 0 | 0 | 22 | 17 | 5 | 15 | 3 | 9 | 3 | 2 | 0 | 2 | 0 | 2 | 0 | 2 | 0 | 3 | 0 | 3 | 0 |
| Hematuria | 0 | 0 | 0 | 6 | 6 | 0 | 2 | 0 | 2 | 0 | 0 | 0 | 0 | 0 | 4 | 0 | 3 | 1 | 0 | 0 | 0 | 0 |
| Renal & urinary disorders, NOS | 0 | 0 | 0 | 10 | 9 | 1 | 5 | 3 | 1 | 1 | 1 | 1 | 0 | 0 | 4 | 2 | 2 | 0 | 0 | 0 | 0 | 0 |
| Urinary frequency | 22 | 20 | 2 | 46 | 28 | 18 | 17 | 5 | 8 | 4 | 11 | 5 | 4 | 2 | 11 | 0 | 7 | 4 | 7 | 0 | 7 | 0 |
| Urinary incontinence | 1 | 0 | 1 | 6 | 4 | 2 | 3 | 1 | 1 | 1 | 1 | 0 | 1 | 0 | 1 | 0 | 0 | 1 | 1 | 0 | 1 | 0 |
| Urinary retention | 9 | 9 | 0 | 19 | 13 | 6 | 7 | 2 | 3 | 2 | 3 | 1 | 2 | 0 | 6 | 0 | 3 | 3 | 3 | 0 | 2 | 1 |
| Urinary tract obstruction | 1 | 0 | 1 | 6 | 3 | 3 | 3 | 0 | 3 | 0 | 2 | 1 | 1 | 0 | 0 | 0 | 0 | 0 | 1 | 0 | 1** | 0 |
| Urinary tract pain | 0 | 0 | 0 | 1 | 1 | 0 | 1 | 1 | 0 | 0 | 0 | 0 | 0 | 0 | 0 | 0 | 0 | 0 | 0 | 0 | 0 | 0 |
| Urinary urgency | 7 | 6 | 1 | 43 | 28 | 15 | 17 | 3 | 12 | 2 | 9 | 4 | 4 | 1 | 11 | 0 | 7 | 4 | 6 | 0 | 6 | 0 |
≤90 days after RT;
>90 days after RT;
The baseline (before treatment on the protocol) symptoms were coded and are contrasted with the attribution of adverse events to protocol treatment (above the baseline);
Includes a single grade 4 adverse event (only event above grade 2), related to sepsis after a transurethral resection post-RT for urinary obstructive symptoms.
Prevalence for GU toxicity (Figure 1A) revealed that many of the grade 2+ events were transient. The prevalence plot displays the possibly, probably, and definitely related adverse events, as well as any symptoms not considered related (e.g., no change from baseline). Distinguishing treatment related from pre-existing symptoms was not always clear; the bias was to code as treatment related when uncertain. For example, all patients at 3 months were coded as having treatment related increased symptoms, even if the grade was the same as baseline. There was a maximal increase in grade 2 GU symptoms at 3 mo and a trend for a gradual reduction and stabilization after 27 months. Cumulative incidence rates of grade 2+ toxicities for GU and GI after RT are presented in Figure S3.
Figure 1.
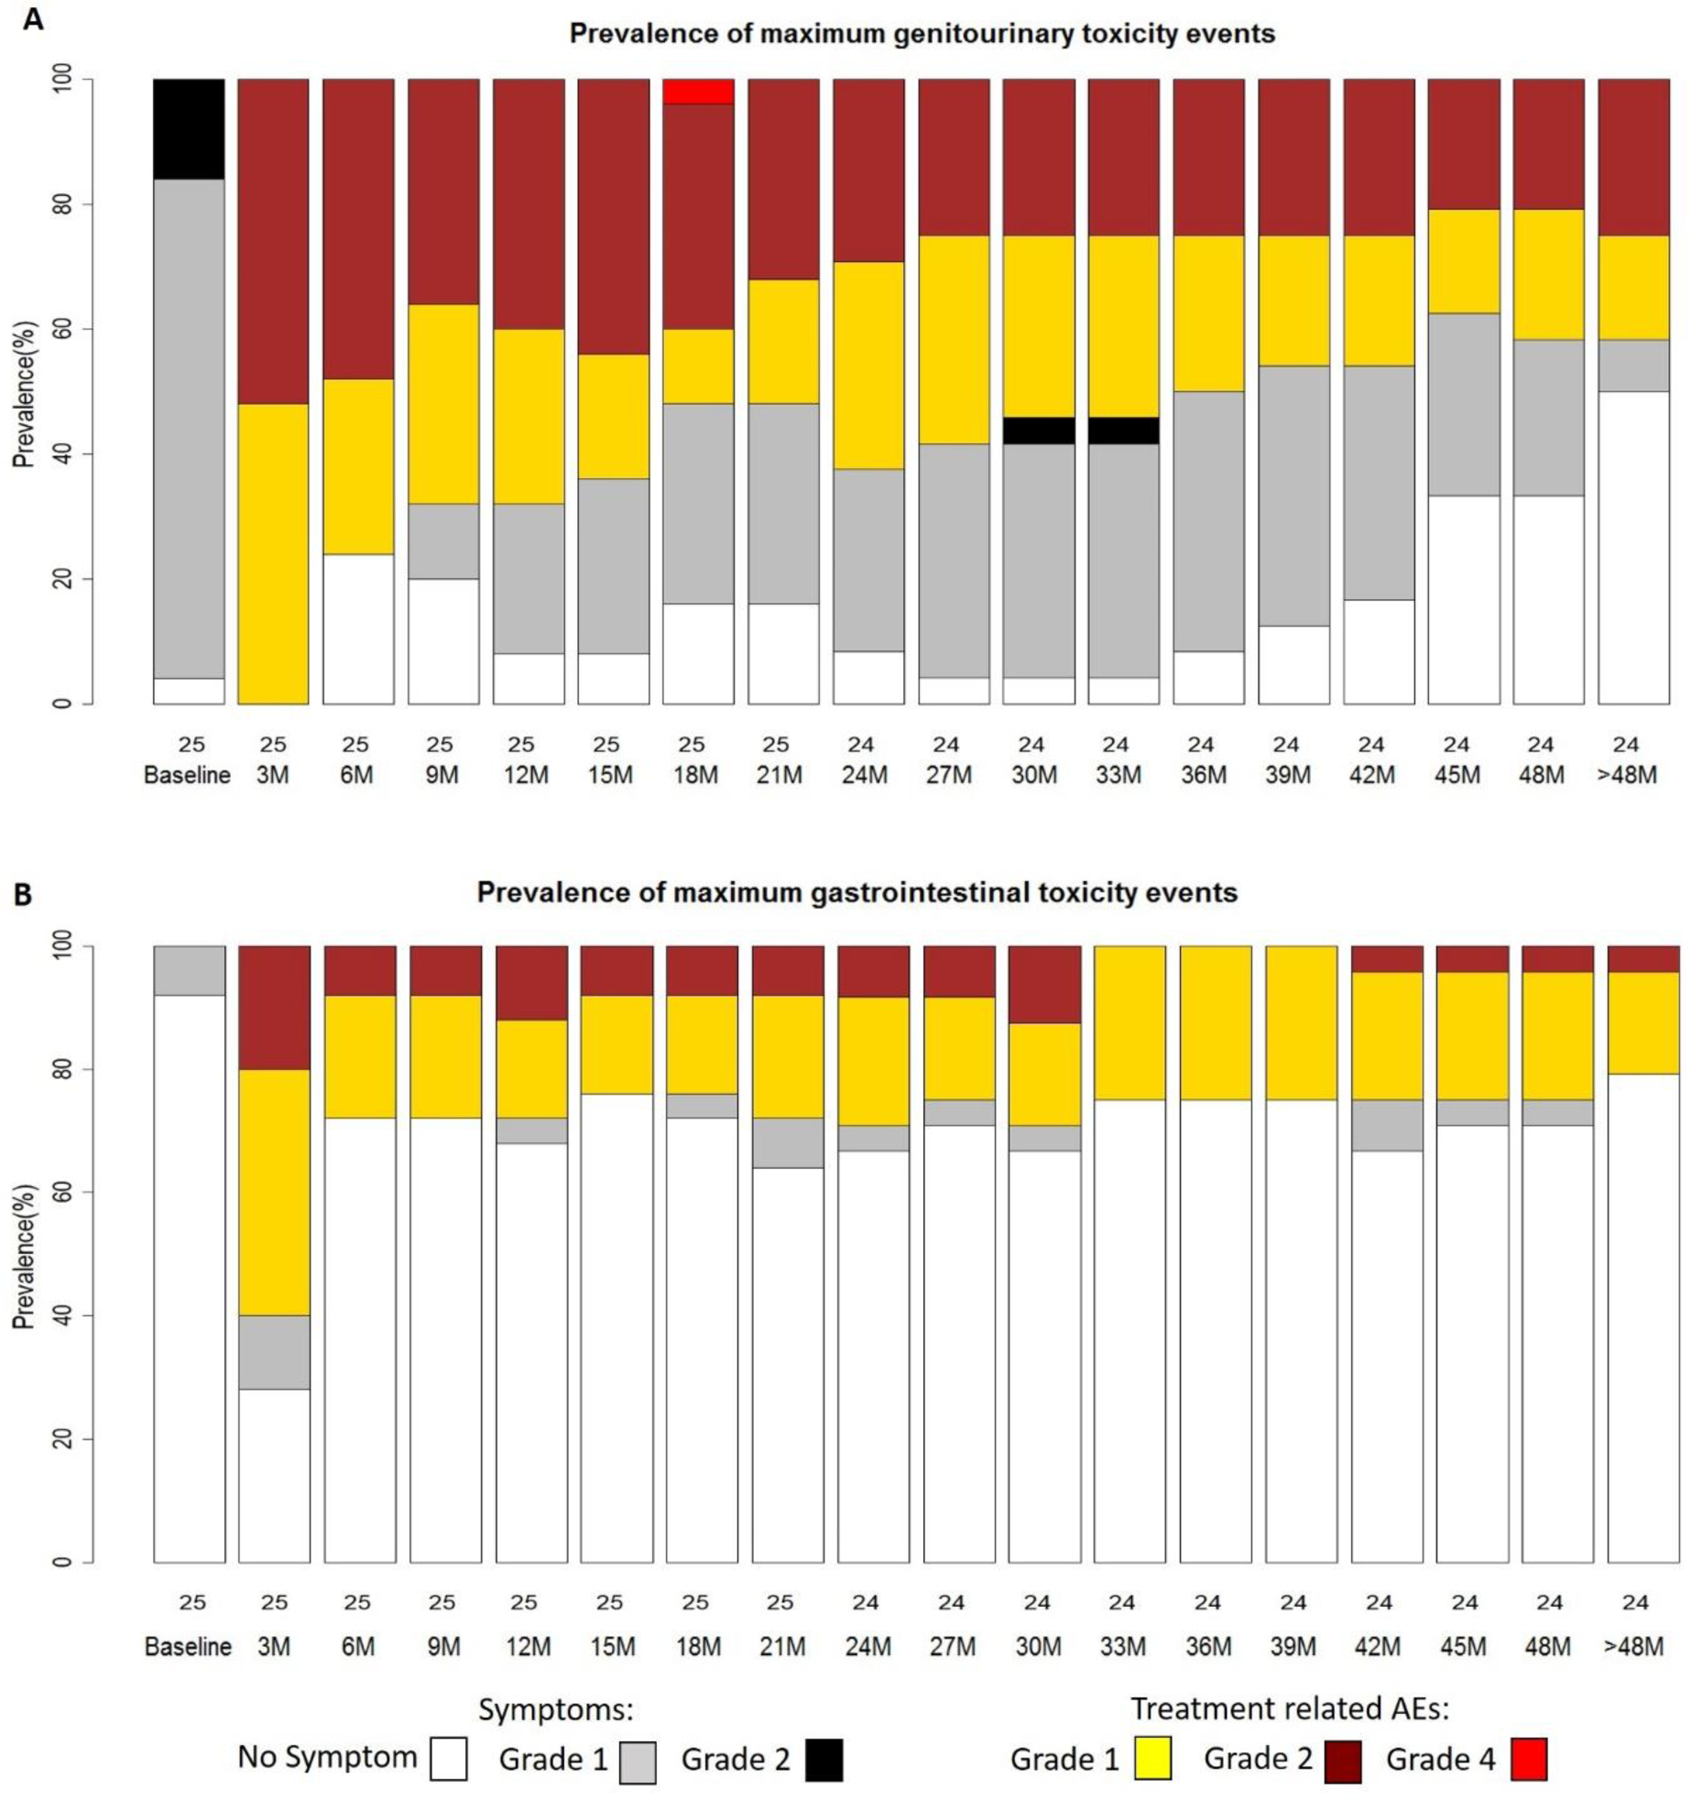
Prevalence of maximum (A) genitourinary (GU) and (B) gastrointestinal (GI) toxicity events (adverse effects). Prevalence plots display baseline, acute (≤3 months), and late reactions (> 3 months).
Gastrointestinal AEs
The grade and attributions of maximum CTCAEv4.0 GI toxicities are displayed in Table 6. Baseline symptoms were minimal. There were 4 patients with maximal late grade 2 events. No adverse events above grade 2 were seen. The prevalence plot for GI events (Figure 1B) reveals a maximal increase in events at 3 months with some increased above baseline grade 1 and grade 2 AEs thereafter. Two grade 2 events for rectal bleeding/proctitis continued after 30 months post-RT; of these, one resolved to a grade 1 after successful minor cauterization and one did so spontaneously.
Table 6.
Maximum CTCAE V4.0 Gastrointestinal Toxicity
| BASELINE* SYMPTOMS | TOTAL AEs | ACUTE/SUBACUTEa AEs | LATEb AEs | |||||||||||||||||||
|---|---|---|---|---|---|---|---|---|---|---|---|---|---|---|---|---|---|---|---|---|---|---|
| Grade | Grade | Grade 1 | Grade 2 | Grade 1 | Grade 2 | |||||||||||||||||
| Symptoms/Adverse events | All | 1 | 2 | All | 1 | 2 | All | Definite | Probable | Possible | All | Definite | Probable | Possible | All | Definite | Probable | Possible | All | Definite | Probable | Possible |
| No. of patients | 1 | 1 | 0 | 18 | 10 | 8 | 12 | 5 | 11 | 4 | ||||||||||||
| All events | 1 | 1 | 0 | 47 | 37 | 10 | 26 | 2 | 13 | 11 | 6 | 0 | 4 | 2 | 11 | 2 | 5 | 4 | 4 | 2 | 0 | 2 |
| Abdominal pain | 1 | 1 | 0 | 2 | 2 | 0 | 1 | 0 | 0 | 1 | 0 | 0 | 0 | 0 | 1 | 0 | 0 | 1 | 0 | 0 | 0 | 0 |
| Anorexia | 0 | 0 | 0 | 1 | 1 | 0 | 1 | 0 | 0 | 1 | 0 | 0 | 0 | 0 | 0 | 0 | 0 | 0 | 0 | 0 | 0 | 0 |
| Bloating | 0 | 0 | 0 | 2 | 2 | 0 | 2 | 0 | 2 | 0 | 0 | 0 | 0 | 0 | 0 | 0 | 0 | 0 | 0 | 0 | 0 | 0 |
| Constipation | 0 | 0 | 0 | 6 | 2 | 4 | 1 | 0 | 0 | 1 | 3 | 0 | 1 | 2 | 1 | 0 | 0 | 1 | 1 | 0 | 0 | 1 |
| Dehydration | 0 | 0 | 0 | 3 | 3 | 0 | 1 | 0 | 1 | 0 | 0 | 0 | 0 | 0 | 2 | 0 | 2 | 0 | 0 | 0 | 0 | 0 |
| Diarrhea | 0 | 0 | 0 | 17 | 16 | 1 | 14 | 1 | 8 | 5 | 1 | 0 | 1 | 0 | 2 | 0 | 1 | 1 | 0 | 0 | 0 | 0 |
| Fecal incontinence | 0 | 0 | 0 | 1 | 1 | 0 | 0 | 0 | 0 | 0 | 0 | 0 | 0 | 0 | 1 | 0 | 1 | 0 | 0 | 0 | 0 | 0 |
| Flatulence | 0 | 0 | 0 | 1 | 1 | 0 | 1 | 0 | 1 | 0 | 0 | 0 | 0 | 0 | 0 | 0 | 0 | 0 | 0 | 0 | 0 | 0 |
| Hemorrhoids | 0 | 0 | 0 | 2 | 0 | 1 | 0 | 0 | 0 | 0 | 1 | 0 | 1 | 0 | 0 | 0 | 0 | 0 | 0 | 0 | 0 | 0 |
| Nausea | 0 | 0 | 0 | 1 | 1 | 0 | 1 | 0 | 0 | 1 | 0 | 0 | 0 | 0 | 0 | 0 | 0 | 0 | 0 | 0 | 0 | 0 |
| Proctitis | 0 | 0 | 0 | 3 | 2 | 1 | 1 | 0 | 1 | 0 | 0 | 0 | 0 | 0 | 1 | 1 | 0 | 0 | 1 | 1 | 0 | 0 |
| Rectal bleeding | 0 | 0 | 0 | 5 | 3 | 2 | 0 | 0 | 0 | 0 | 0 | 0 | 0 | 0 | 3 | 1 | 1 | 1 | 2 | 1 | 0 | 1 |
| Rectal pain | 0 | 0 | 0 | 4 | 3 | 1 | 3 | 1 | 0 | 2 | 1 | 0 | 1 | 0 | 0 | 0 | 0 | 0 | 0 | 0 | 0 | 0 |
≤90 days after RT;
>90 days after RT;
The baseline (before treatment on the protocol) symptoms were coded and are contrasted with the attribution of adverse events to protocol treatment (above the baseline)
DISCUSSION
The LEAD technique was designed based on supportive evidence that (i) dose escalation beyond 80 Gy in 2 Gy fractions results in improved freedom from failure and lessens the impact of androgen deprivation therapy; (ii) extreme hypofractionation doses to tumor region(s) improve tumor cell killing through additional cell death mechanisms, bystander effects, and abscopal effects; and (iii) limiting the extreme doses to tumor areas with strict OAR constraints will keep grade 3 side effects lower than previously reported rates from whole prostate dose escalation above 80 Gy.
Contemporary prostate EBRT doses of 76–80 Gy have been considered radiotherapy “dose escalation.” However, there is a dose-response above 80 Gy3,5,32,33 and local persistence of disease is a strong predictor of eventual failure and distant metastasis.34,35 Prostate biopsies at 2–3 yr after ≤80 Gy EBRT doses reveal that 30–40% of cases have suspicious atypical cells or adenocarcinoma with or without treatment effect;30,36–38 about 50% of such cases experience biochemical failure over the next 10 years.38 Levagrun et al37 have described a dose response using prostate biopsy positivity as an endpoint, showing that the TCD50 for high risk patients is approximately 77 Gy. These results are an underestimate because ultrasound sextant template biopsies were used, and, based on MRI-guided biopsy data,39 over 30% of tumors would be missed. Likewise, defining prostate cancer dose response using biochemical failure at a specific point in time, say 5 years, have been underestimates because failures typically continue to occur.3,32
The best tumor control rates in intermediate and high risk patients have been achieved using a combination of EBRT and brachytherapy that have included whole prostate high dose rate and low dose rate methods.32 Along the lines of several retrospective series, the randomized ASCENDE-RT trial reported by Morris et al5 is a clear illustration of the benefit of dose escalation, achieved using EBRT plus brachytherapy, in terms of reducing biochemical failure, the primary endpoint. Biochemical failure at 7 years was 25.0% in the EBRT alone arm and 14% in the EBRT plus brachytherapy arm.
The LEAD approach directs dose escalation to the dominant tumor lesion(s) using mpMRI and biopsy information, instead of treating the entire prostate to very high doses. Rodda et al40 reported that grade 3 toxicity in the ASCENDE-RT patients who received EBRT plus brachytherapy was substantially higher than those who received EBRT alone. In contrast, only 1 grade 3+ complication attributable to radiotherapy was identified in the LEAD cohort. Our findings are in line with the reported results from the randomized FLAME trial in which the experimental arm used an MRI-guided simultaneous integrated boost technique, although only one dominant GTV was boosted in the FLAME trial.17
Large single radiation doses, such as that used on day 1 of treatment (12 Gy) is hypothesized to cause intratumoral bystander and abscopal effects,41–43 induce more tumor endothelial cell death (doses above 8–11 Gy),10 increase host T-cell priming,44 and enhance treatment response in heterogeneous tumors containing cells with varying radiosensitivity.45 We chose to administer the stereotactic boost up front for several reasons, including that the MRI boost target(s) is well-defined at this point, that biological data have historically shown that high-dose RT prior to standard RT doses results in significantly greater tumor regression overall,46,47 and that giving a boost at the end of treatment could add to the uncertainty of focused targeting. An open question is whether a stereotactic boost timed after the conventional fractionation portion and the consequent reduced hypoxia at that point, would outweigh the hypothesized benefits from the other mechanisms at play from an upfront boost.
Higher prostate doses are associated with greater risks of significant late side effects; however, the LEAD technique limits toxicity risk in several ways. In the LEAD trial, the MRI-defined GTV(s) were not covered completely by the LEAD boost on day 1 using dose cylinders of 0.6–1.2 cm diameter (mean diameter 0.9). Attention was paid to the dose to the anorectum, positioning the dose cylinder such that point doses were kept below 4.5 Gy and the V3 Gy below 8% in all cases. We were more concerned with rectal doses because bladder constraints were easier to obtain. The doses to the OARs were, therefore, similar to that from our current standard course of 80 Gy in 40 fractions to the prostate and proximal seminal vesicles.
In summary, the integration of an upfront extreme single RT fraction dose to mpMRI-defined tumor volumes, with subsequent standard fractionation doses, is feasible and without untoward toxicity. The biochemical failure rate of 8% at a median follow-up of 66 months is encouraging. To facilitate broader use eventually, an automated workflow has been developed for prostate segmentation and pixel by pixel risk assignment (habitat risk score) based on quantitative mpMRI features.48 The resultant workflow has been incorporated into a randomized phase II trial (NCT02307058; The BLaStM trial)47; the LEAD treatments in the BLaStM trial are administered on a standard linear accelerator, making the workflow more generalizable.
Supplementary Material
Acknowledgments:
The authors thank Pavel Noa Hechavarria, MD, for contributions related to the clinical coordination of the study, and Ofelia Santana, for contributions in maintaining the database records.
Funding: This work was supported by the National Cancer Institute at the National Institutes of Health (grant number R21CA153826 to A.P., 2009)
Role of funding source: The funding source had no involvement in the study design; in the collection, analysis, and interpretation of data; in the writing of the report; or in the decision to submit the article for publication.
Footnotes
Publisher's Disclaimer: This is a PDF file of an unedited manuscript that has been accepted for publication. As a service to our customers we are providing this early version of the manuscript. The manuscript will undergo copyediting, typesetting, and review of the resulting proof before it is published in its final form. Please note that during the production process errors may be discovered which could affect the content, and all legal disclaimers that apply to the journal pertain.
Conflict of Interest: The authors declare no potential conflicts of interest.
Clinical Trial Information: ClinicalTrials.gov: NCT01411319
REFERENCES
- 1.Kuban DA, Levy LB, Cheung MR, et al. : Long-term failure patterns and survival in a randomized dose-escalation trial for prostate cancer. Who dies of disease? Int J Radiat Oncol Biol Phys 79:1310–7, 2011 [DOI] [PubMed] [Google Scholar]
- 2.Pollack A, Abramowitz MC: Weighing the Addition of Androgen Suppression Therapy to Radiotherapy Dose Escalation for Intermediate-Risk Prostate Cancer. J Clin Oncol 34:1715–7, 2016 [DOI] [PubMed] [Google Scholar]
- 3.Eade TN, Hanlon AL, Horwitz EM, et al. : What dose of external-beam radiation is high enough for prostate cancer? Int J Radiat Oncol Biol Phys 68:682–9, 2007 [DOI] [PMC free article] [PubMed] [Google Scholar]
- 4.Pouget JP, Georgakilas AG, Ravanat JL: Targeted and Off-Target (Bystander and Abscopal) Effects of Radiation Therapy: Redox Mechanisms and Risk/Benefit Analysis. Antioxid Redox Signal, 2018 [DOI] [PMC free article] [PubMed]
- 5.Morris WJ, Tyldesley S, Rodda S, et al. : Androgen Suppression Combined with Elective Nodal and Dose Escalated Radiation Therapy (the ASCENDE-RT Trial): An Analysis of Survival Endpoints for a Randomized Trial Comparing a Low-Dose-Rate Brachytherapy Boost to a Dose-Escalated External Beam Boost for High- and Intermediate-risk Prostate Cancer. Int J Radiat Oncol Biol Phys 98:275–285, 2017 [DOI] [PubMed] [Google Scholar]
- 6.Yang DD, Muralidhar V, Mahal BA, et al. : Lack of Apparent Survival Benefit With Use of Androgen Deprivation Therapy in Patients With High-risk Prostate Cancer Receiving Combined External Beam Radiation Therapy and Brachytherapy. Int J Radiat Oncol Biol Phys 100:53–58, 2018 [DOI] [PubMed] [Google Scholar]
- 7.Morgan PB, Hanlon AL, Horwitz EM, et al. : Timing of biochemical failure and distant metastatic disease for low-, intermediate-, and high-risk prostate cancer after radiotherapy. Cancer 110:68–80, 2007 [DOI] [PMC free article] [PubMed] [Google Scholar]
- 8.Brenner DJ, Martinez AA, Edmundson GK, et al. : Direct evidence that prostate tumors show high sensitivity to fractionation (low alpha/beta ratio), similar to late-responding normal tissue. Int J Radiat Oncol Biol Phys 52:6–13, 2002 [DOI] [PubMed] [Google Scholar]
- 9.Vogelius IR, Bentzen SM: Meta-analysis of the alpha/beta ratio for prostate cancer in the presence of an overall time factor: bad news, good news, or no news? Int J Radiat Oncol Biol Phys 85:89–94, 2013 [DOI] [PMC free article] [PubMed] [Google Scholar]
- 10.Garcia-Barros M, Paris F, Cordon-Cardo C, et al. : Tumor response to radiotherapy regulated by endothelial cell apoptosis. Science 300:1155–9, 2003 [DOI] [PubMed] [Google Scholar]
- 11.Hellevik T, Martinez-Zubiaurre I: Radiotherapy and the tumor stroma: the importance of dose and fractionation. Front Oncol 4:1, 2014 [DOI] [PMC free article] [PubMed] [Google Scholar]
- 12.Jani A, Shaikh F, Barton S, et al. : High-Dose, Single-Fraction Irradiation Rapidly Reduces Tumor Vasculature and Perfusion in a Xenograft Model of Neuroblastoma. Int J Radiat Oncol Biol Phys 94:1173–80, 2016 [DOI] [PubMed] [Google Scholar]
- 13.Martinez AA, Gonzalez J, Ye H, et al. : Dose escalation improves cancer-related events at 10 years for intermediate- and high-risk prostate cancer patients treated with hypofractionated high-dose-rate boost and external beam radiotherapy. International journal of radiation oncology, biology, physics 79:363–70, 2011 [DOI] [PubMed] [Google Scholar]
- 14.Pucar D, Hricak H, Shukla-Dave A, et al. : Clinically significant prostate cancer local recurrence after radiation therapy occurs at the site of primary tumor: magnetic resonance imaging and step-section pathology evidence. Int J Radiat Oncol Biol Phys 69:62–9, 2007 [DOI] [PubMed] [Google Scholar]
- 15.Bauman G, Haider M, Van der Heide UA, et al. : Boosting imaging defined dominant prostatic tumors: a systematic review. Radiother Oncol 107:274–81, 2013 [DOI] [PubMed] [Google Scholar]
- 16.Onjukka E, Uzan J, Baker C, et al. : Twenty Fraction Prostate Radiotherapy with Intra-prostatic Boost: Results of a Pilot Study. Clin Oncol (R Coll Radiol) 29:6–14, 2017 [DOI] [PubMed] [Google Scholar]
- 17.Monninkhof EM, van Loon JWL, van Vulpen M, et al. : Standard whole prostate gland radiotherapy with and without lesion boost in prostate cancer: Toxicity in the FLAME randomized controlled trial. Radiother Oncol 127:74–80, 2018 [DOI] [PubMed] [Google Scholar]
- 18.Mohiuddin M, Fujita M, Regine WF, et al. : High-dose spatially-fractionated radiation (GRID): a new paradigm in the management of advanced cancers. Int J Radiat Oncol Biol Phys 45:721–7, 1999 [DOI] [PubMed] [Google Scholar]
- 19.Kanagavelu S, Gupta S, Wu X, et al. : In vivo effects of lattice radiation therapy on local and distant lung cancer: potential role of immunomodulation. Radiat Res 182:149–62, 2014 [DOI] [PMC free article] [PubMed] [Google Scholar]
- 20.Penagaricano JA, Moros EG, Ratanatharathorn V, et al. : Evaluation of spatially fractionated radiotherapy (GRID) and definitive chemoradiotherapy with curative intent for locally advanced squamous cell carcinoma of the head and neck: initial response rates and toxicity. Int J Radiat Oncol Biol Phys 76:1369–75, 2010 [DOI] [PubMed] [Google Scholar]
- 21.Gao M, Mohiuddin MM, Hartsell WF, et al. : Spatially fractionated (GRID) radiation therapy using proton pencil beam scanning (PBS): Feasibility study and clinical implementation. Med Phys 45:1645–1653, 2018 [DOI] [PubMed] [Google Scholar]
- 22.Chang YC, Ackerstaff E, Tschudi Y, et al. : Delineation of Tumor Habitats based on Dynamic Contrast Enhanced MRI. Sci Rep 7:9746, 2017 [DOI] [PMC free article] [PubMed] [Google Scholar]
- 23.Parra NA, Pollack A, Chinea FM, et al. : Automatic Detection and Quantitative DCE-MRI Scoring of Prostate Cancer Aggressiveness. Front Oncol 7:259, 2017 [DOI] [PMC free article] [PubMed] [Google Scholar]
- 24.Pollack A, Walker G, Horwitz EM, et al. : Randomized Trial of Hypofractionated External-Beam Radiotherapy for Prostate Cancer. Journal of Clinical Oncology 31:3860-+, 2013 [DOI] [PMC free article] [PubMed] [Google Scholar]
- 25.Lawton CA, Michalski J, El-Naqa I, et al. : RTOG GU Radiation oncology specialists reach consensus on pelvic lymph node volumes for high-risk prostate cancer. Int J Radiat Oncol Biol Phys 74:383–7, 2009 [DOI] [PMC free article] [PubMed] [Google Scholar]
- 26.Pollack A, Walker G, Horwitz EM, et al. : Randomized trial of hypofractionated external-beam radiotherapy for prostate cancer. J Clin Oncol 31:3860–8, 2013 [DOI] [PMC free article] [PubMed] [Google Scholar]
- 27.Pollack A, Hanlon AL, Horwitz EM, et al. : Dosimetry and preliminary acute toxicity in the first 100 men treated for prostate cancer on a randomized hypofractionation dose escalation trial. International journal of radiation oncology, biology, physics 64:518–26, 2006 [DOI] [PMC free article] [PubMed] [Google Scholar]
- 28.Roach M 3rd, Hanks G, Thames H Jr., et al. : Defining biochemical failure following radiotherapy with or without hormonal therapy in men with clinically localized prostate cancer: recommendations of the RTOG-ASTRO Phoenix Consensus Conference. Int J Radiat Oncol Biol Phys 65:965–74, 2006 [DOI] [PubMed] [Google Scholar]
- 29.Crook JM, Malone S, Perry G, et al. : Twenty-four-month postradiation prostate biopsies are strongly predictive of 7-year disease-free survival: results from a Canadian randomized trial. Cancer 115:673–9, 2009 [DOI] [PubMed] [Google Scholar]
- 30.Huang KT, Stoyanova R, Walker G, et al. : Post-radiotherapy prostate biopsies reveal heightened apex positivity relative to other prostate regions sampled. Radiotherapy and Oncology 115:101–106, 2015 [DOI] [PMC free article] [PubMed] [Google Scholar]
- 31.Barry MJ, Fowler FJ Jr., O’Leary MP, et al. : The American Urological Association symptom index for benign prostatic hyperplasia. The Measurement Committee of the American Urological Association. J Urol 148:1549–57; discussion 1564, 1992 [DOI] [PubMed] [Google Scholar]
- 32.Zaorsky NG, Palmer JD, Hurwitz MD, et al. : What is the ideal radiotherapy dose to treat prostate cancer? A meta-analysis of biologically equivalent dose escalation. Radiother Oncol 115:295–300, 2015 [DOI] [PubMed] [Google Scholar]
- 33.Kishan AU, Cook RR, Ciezki JP, et al. : Radical Prostatectomy, External Beam Radiotherapy, or External Beam Radiotherapy With Brachytherapy Boost and Disease Progression and Mortality in Patients With Gleason Score 9–10 Prostate Cancer. JAMA 319:896–905, 2018 [DOI] [PMC free article] [PubMed] [Google Scholar]
- 34.Zelefsky MJ, Reuter VE, Fuks Z, et al. : Influence of local tumor control on distant metastases and cancer related mortality after external beam radiotherapy for prostate cancer. J Urol 179:1368–73; discussion 1373, 2008 [DOI] [PMC free article] [PubMed] [Google Scholar]
- 35.Krauss DJ, Hu C, Bahary JP, et al. : Importance of Local Control in Early-Stage Prostate Cancer: Outcomes of Patients With Positive Post-Radiation Therapy Biopsy Results Treated in RTOG 9408. Int J Radiat Oncol Biol Phys 92:863–73, 2015 [DOI] [PMC free article] [PubMed] [Google Scholar]
- 36.Crook J, Malone S, Perry G, et al. : Postradiotherapy prostate biopsies: what do they really mean? Results for 498 patients. Int J Radiat Oncol Biol Phys 48:355–67, 2000 [DOI] [PubMed] [Google Scholar]
- 37.Levegrun S, Jackson A, Zelefsky MJ, et al. : Risk group dependence of dose-response for biopsy outcome after three-dimensional conformal radiation therapy of prostate cancer. Radiother Oncol 63:11–26, 2002 [DOI] [PubMed] [Google Scholar]
- 38.Vance W, Tucker SL, de Crevoisier R, et al. : The predictive value of 2-year posttreatment biopsy after prostate cancer radiotherapy for eventual biochemical outcome. Int J Radiat Oncol Biol Phys 67:828–33, 2007 [DOI] [PubMed] [Google Scholar]
- 39.Siddiqui MM, Rais-Bahrami S, Turkbey B, et al. : Comparison of MR/ultrasound fusion-guided biopsy with ultrasound-guided biopsy for the diagnosis of prostate cancer. JAMA 313:390–7, 2015 [DOI] [PMC free article] [PubMed] [Google Scholar]
- 40.Rodda S, Tyldesley S, Morris WJ, et al. : ASCENDE-RT: An Analysis of Treatment-Related Morbidity for a Randomized Trial Comparing a Low-Dose-Rate Brachytherapy Boost with a Dose-Escalated External Beam Boost for High- and Intermediate-Risk Prostate Cancer. Int J Radiat Oncol Biol Phys 98:286–295, 2017 [DOI] [PubMed] [Google Scholar]
- 41.Shareef MM, Cui N, Burikhanov R, et al. : Role of tumor necrosis factor-alpha and TRAIL in high-dose radiation-induced bystander signaling in lung adenocarcinoma. Cancer Res 67:11811–20, 2007 [DOI] [PubMed] [Google Scholar]
- 42.Prise KM, O’Sullivan JM: Radiation-induced bystander signalling in cancer therapy. Nat Rev Cancer 9:351–60, 2009 [DOI] [PMC free article] [PubMed] [Google Scholar]
- 43.Reynders K, Illidge T, Siva S, et al. : The abscopal effect of local radiotherapy: using immunotherapy to make a rare event clinically relevant. Cancer Treat Rev 41:503–10, 2015 [DOI] [PMC free article] [PubMed] [Google Scholar]
- 44.Lee Y, Auh SL, Wang Y, et al. : Therapeutic effects of ablative radiation on local tumor require CD8+ T cells: changing strategies for cancer treatment. Blood 114:589–95, 2009 [DOI] [PMC free article] [PubMed] [Google Scholar]
- 45.Bao S, Wu Q, McLendon RE, et al. : Glioma stem cells promote radioresistance by preferential activation of the DNA damage response. Nature 444:756–60, 2006 [DOI] [PubMed] [Google Scholar]
- 46.Schenken LL, Poulakos L, Hagemann RF: Responses of an experimental solid tumour to irradiation: A comparison of modes of fractionation. Br J Cancer 31:228–36, 1975 [DOI] [PMC free article] [PubMed] [Google Scholar]
- 47.Sakamoto K: Priming dose in radiotherapy used based upon survival of murine tumor cells irradiated in-vivo under three conditions: in air, oxygen and carbon-di-oxide or hyperbaric oxygen, in Sugihara T (ed): Fraction size in radiobiology and radiotherapy, 1974
- 48.Stoyanova R, Chinea F, Kwon D, et al. : An Automated Multiparametric MRI Quantitative Imaging Prostate Habitat Risk Scoring System for Defining External Beam Radiation Therapy Boost Volumes. Int J Radiat Oncol Biol Phys 102:821–829, 2018 [DOI] [PMC free article] [PubMed] [Google Scholar]
Associated Data
This section collects any data citations, data availability statements, or supplementary materials included in this article.