

Abstract
Objective
To describe trends in the burden of mortality due to subtypes of heart disease from 1999 to 2018 to inform targeted prevention strategies and reduce disparities.
Design
Serial cross sectional analysis of cause specific heart disease mortality rates using national death certificate data in the overall population as well as stratified by race-sex, age, and geography.
Setting
United States, 1999-2018.
Participants
12.9 million decedents from total heart disease (49% women, 12% black, and 19% <65 years old).
Main outcome measures
Age adjusted mortality rates (AAMR) and years of potential life lost (YPLL) for each heart disease subtype, and respective mean annual percentage change.
Results
Deaths from total heart disease fell from 752 192 to 596 577 between 1999 and 2011, and then increased to 655 381 in 2018. From 1999 to 2018, the proportion of total deaths from heart disease attributed to ischemic heart disease decreased from 73% to 56%, while the proportion attributed to heart failure increased from 8% to 13% and the proportion attributed to hypertensive heart disease increased from 4% to 9%. Among heart disease subtypes, AAMR was consistently highest for ischemic heart disease in all subgroups (race-sex, age, and region). After 2011, AAMR for heart failure and hypertensive heart disease increased at a faster rate than for other subtypes. The fastest increases in heart failure mortality were in black men (mean annual percentage change 4.9%, 95% confidence interval 4.0% to 5.8%), whereas the fastest increases in hypertensive heart disease occurred in white men (6.3%, 4.9% to 9.4%). The burden of years of potential life lost was greatest from ischemic heart disease, but black-white disparities were driven by heart failure and hypertensive heart disease. Deaths from heart disease in 2018 resulted in approximately 3.8 million potential years of life lost.
Conclusions
Trends in AAMR and years of potential life lost for ischemic heart disease have decelerated since 2011. For almost all other subtypes of heart disease, AAMR and years of potential life lost became stagnant or increased. Heart failure and hypertensive heart disease account for the greatest increases in premature deaths and the largest black-white disparities and have offset declines in ischemic heart disease. Early and targeted primary and secondary prevention and control of risk factors for heart disease, with a focus on groups at high risk, are needed to avoid these suboptimal trends beginning earlier in life.
Introduction
The age adjusted mortality rate (AAMR) for heart diseases in the US declined by more than 50% in the second half of the 20th century from a peak of 307 per 100 000 in 1950.1 This fall was predominantly driven by rapid declines in mortality from ischemic heart disease, as a result of progress in prevention (for example, decline in smoking rates) and evidence based treatments (for example, statins, antiplatelet agents, and antihypertensives).1 2 3 Although mortality rates continued to decline after 2000,4 recent data showed that the AAMR for heart disease plateaued in 2011.2 5 6 Furthermore, some indicators now suggest a reversal in the trend, with increasing rates of death from heart disease in certain population subgroups such as middle aged Americans,7 8 as well as by region in the US,9 thus undoing decades of progress in prevention and treatment of heart disease and contributing to decreases in overall life expectancy in the US.10 Similar trends have also been observed in other high income countries.11
However, subtypes of heart disease are heterogeneous in their pathophysiology and contribution to preventable deaths. Recent analysis indicates that the stagnation in total heart disease mortality rates in 2011 was driven by a slowing in the decline of deaths from ischemic heart disease and increases in heart failure mortality rates.12 13 Further detailed characterization of patterns in deaths for each subtype of heart disease across subgroups that are responsible for the observed changes in heart disease mortality rates would inform targeted prevention and treatment efforts. We therefore investigated trends across race-sex, age, and geographic groups in cause specific deaths from heart disease (ischemic heart disease, heart failure, hypertensive heart disease, valvular heart disease, arrhythmia, pulmonary heart disease, and other heart diseases) using national death certificate data from 1999 to 2018. We calculated complementary metrics to quantify deaths due to subtypes of heart disease, including age adjusted mortality rates (AAMR), years of potential life lost (YPLL), and mean annual percentage changes in these metrics, for heart disease subtypes to better evaluate the burden of avoidable heart disease mortality.
Methods
Using mortality data from the Wide-Ranging Online Data for Epidemiologic Research (WONDER) database of death certificates from the Centers for Disease Control and Prevention (CDC), we identified all decedents from 1999 to 2018 by ICD-10 (international classification of diseases, 10th revision) code with an underlying (main) cause of death of total heart disease, which comprised heart disease subtypes classified as ischemic heart disease (ICD-10 code I20-I25), heart failure (I50), hypertensive heart disease (I11, I13), valvular heart disease (I34-I38), arrhythmia (I47-I49), pulmonary heart disease (I26-I28), and other heart diseases (I00-I09, I30-I33, I40-I46, I51, which includes acute and chronic rheumatic heart disease, pericardial diseases, acute myocarditis, and unspecified cardiomyopathy and cardiac arrest not otherwise defined). The CDC internally recoded deaths classified using ICD-9 codes before local implementation of ICD-10 by using ICD-10 codes for the WONDER database. The database includes all death certificates filed in the US, and less than 0.01% of death certificates are missing data on age of decedent. No data were suppressed owing to low counts in subgroup analyses. We calculated the percentage of each heart disease subtype’s overall contribution to total heart disease.
We examined trends in the overall population (all race groups), separately by race-sex groups (black women, white women, black men, white men), and stratified by age at death (<45 years, 45-64 years, ≥65 years) for the main analysis. We categorized decedents by “race” in accordance with standard death certificate designations and categorizations of decedents in vital statistics in the US during the study period. The “black” categorization is used on death certificates in the US and designates only race and not ethnicity. The race-sex analysis was limited to black and white people because other race/ethnic groups (Asian Americans, Native Americans, Hispanic Americans) were either too small (Native Americans) or less reliably identified (Hispanic American, Asian Americans) in CDC WONDER.14 15 In supplemental analyses, we evaluated trends in heart disease subtypes by census region (North east, Midwest, South, and West) and county level urbanization (rural: micropolitan, non-core regions; urban: large central metro, large fringe metro, medium metro, small metro regions).16
We calculated AAMR per 100 000 population adjusted using the 2000 US standard population overall and stratified by race-sex, age, and geographic subgroups.15 We calculated YPLL by using standard methods previously used, with average life expectancy as the reference age for the main analysis.17 18 YPLL captures the burden of premature mortality by placing a greater weight on deaths that occur at younger ages. Specifically, we obtained average life expectancy between 1999 and 2018 for the overall US population (78 years) from US vital statistics reports and applied it as the reference age to calculate YPLL overall and in race-sex subgroups.19 20 We obtained life expectancies in race-sex subgroups (77 years for black women, 81 years for white women, 71 years for black men, and 76 years for white men) and used them in YPLL calculations to quantify the absolute number of years of potential life lost by decedents in the US during the study period in the context of current life expectancy estimates. As using race-sex specific life expectancies to calculate YPLL may not adequately account for underlying disparities in life expectancy between groups, a secondary analysis calculated YPLL with a reference age of 85 years applied to all groups, for a standardized assessment of YPLL. For each year of analysis, we calculated YPLL by multiplying the number of deaths from heart disease subtypes by the difference between the reference age and the midpoint age at death within each 5 year age group in each of a series of 5 year age group decrements from the reference age. We divided this result by the total 5 year age group population and then multiplied by 100 000 to obtain YPLL per 100 000 population. After age standardizing YPLL with the 2000 US standard population, the sum of YPLL in each 5 year age group provided cause specific YPLL per 100 000 in the total population and race-sex subgroups, for each year of analysis. We calculated YPLL for total heart disease, ischemic heart disease, heart failure, and hypertensive heart disease. Because of relatively few deaths due to other heart diseases subtypes, we also calculated YPLL for a category of “remainder heart disease subtypes” that comprised the remainder of the underlying heart disease cause of death codes. We also calculated YPLL for total heart disease from a reference age of 85 years for the overall population and all race-sex subgroups, to provide a comparison of the burden of YPLL that is not dependent on underlying differences in life expectancy by race or sex.
We characterized temporal trends in AAMR and YPLL by fitting log-linear regression models using Joinpoint Regression Program (National Cancer Institute). We used log transformed data, as certain subtypes of heart disease had relatively few deaths. On the basis of previously published methodological guidelines,21 we applied Joinpoint Regression to identify inflection points in the trend of AAMR for total heart disease across the study period from 1999 to 2018. These guidelines recommend that for trends data containing 17-21 time points, the analysis should be allowed to identify up to three inflection points in trends across time.21 Therefore, we allowed the Joinpoint Regression statistical software to identify up to three trend inflections where significant temporal variation existed in the trend (P<0.05), given the inclusion of 20 years of data in the current analysis. Fewer than the maximum allowed number of inflection points could be identified if the magnitude of variation between trends was greatest with fewer inflection points. In our analysis, one inflection point was identified in the trend of AAMR for total heart disease at the year 2011 (consistent with previously published trends identified with Joinpoint Regression5). We therefore subsequently evaluated the temporal intervals between 1999 and 2011 and between 2011 to 2018 in all heart disease subtype analyses (age, race-sex, regional, and urbanization subgroups) to provide a standard comparison.
We then used these temporal intervals for AAMR and YPLL in each subgroup analysis to calculate mean annual percentage change, weighted to account for differences in number and time point of trend inflection points in subgroup models. We used the Joinpoint Regression statistical software to calculate mean annual percentage change from 1999 to 2011 and from 2011 to 2018 by determining the weighted average of the annual percentage change between each time point, with weights equal to the length of each individual model’s inter-inflection point trend. In other words, mean annual percentage changes based on the linear trend segments identified are dependent on each subgroup model’s number of identified inflection points (that is, if a subgroup trend is optimized with no inflection points, indicating one linear trend across the entire study period from 1999 to 2018, mean annual percentage change before and after 2011 would be the same).
As a supplemental analysis, we evaluated AAMR and YPLL for heart failure as a contributing cause of cardiovascular deaths by using the CDC WONDER multiple cause of death files, to more broadly characterize and quantify the burden of heart failure related mortality. These metrics were calculated as previously described, for deaths defined as any mention of heart failure (ICD-10 code I50) on death certificates with cardiovascular disease (ICD-10 code I00-I78) listed as underlying cause of death.22
Patient and public involvement
No patients were involved in setting the research question or the outcome measures, nor were they involved in developing plans for design or execution of the study. No patients were asked to advise on interpretation or writing up of results. There are no plans to disseminate the results of the research to study participants or the relevant patient community as this study analyzed deidentified national vital statistics data.
Results
Study population
Between 1999 and 2018, 12.9 million deaths from total heart disease occurred in the overall US population in all race groups, of which 49.1% (6.3 million) were in women, 11.6% (1.5 million) were in black people, and 86.2% (11.1 million) were in white people. In total, 752 192 deaths from total heart disease occurred in 1999, 596 577 in 2011, and 655 381 in 2018. From 1999 to 2018, ischemic heart disease accounted for a declining proportion of total heart disease deaths (from 73.0% to 55.8%), alongside increasing proportions of total heart disease deaths from heart failure (from 7.6% to 12.8%), hypertensive heart disease (3.6% to 9.2%), valvular heart disease (2.7% to 3.7%), arrhythmia (2.5% to 5.6%), pulmonary heart disease (1.8% to 2.8%), and other heart disease (8.7% to 10.3%) (fig 1 and supplementary table A). Overall, 2.6% of decedents were under 45 years old, 16.3% were 45-64 years old, and 81.2% were aged 65 years or older. The proportion of deaths among middle aged decedents (45-64 years) increased from 13.7% in 1999 to 17.3% in 2018.
Fig 1.
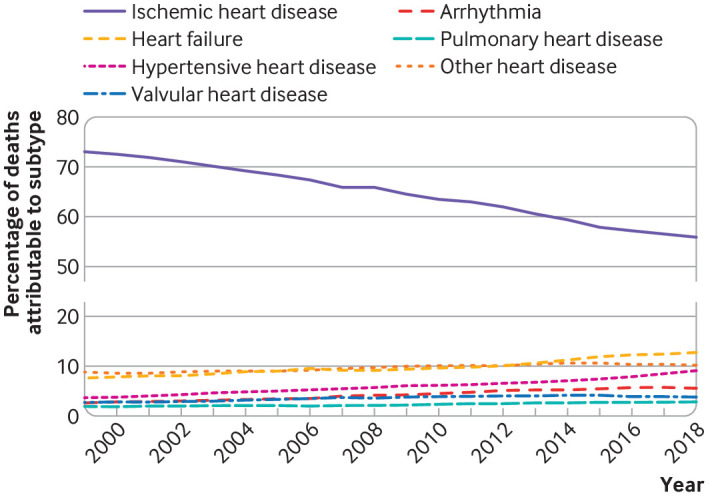
Proportion of total heart disease deaths attributable to each heart disease subtype in US, 1999-2018. Proportion of heart disease deaths due to ischemic heart disease decreased, whereas proportion of heart disease deaths due to all other causes increased; these were predominantly from heart failure and hypertensive heart disease, which were the second and third leading causes of heart disease death. Actual number of deaths are shown in supplementary table A
Trends in heart disease mortality rates in overall US population
AAMR for total heart disease declined from 266.5 (95% confidence interval 265.8 to 267.1) per 100 000 in 1999 to 163.6 (163.2 to 164.0) per 100 000 in 2018 (table 1). Trends in declines in AAMR (that is, mean annual percentage change) for total heart disease decelerated, from −3.7% (95% confidence interval −3.8% to −3.5%) per year before 2011 to −0.7% (−1.1% to −0.3%) per year after 2011 for all decedents. AAMR for ischemic heart disease declined from 194.6 (194.1 to 195.1) per 100 000 in 1999 to 109.2 (108.8 to 109.5) per 100 000 in 2011, but further declined only to 90.9 (90.6 to 91.2) per 100 000 in 2018. Mean annual percentage change in ischemic heart disease mortality slowed from −4.7% (−5.1% to −4.2%) per year before 2011 to −2.6% (−3.3% to −2.0%) per year after 2011. Trends in heart failure mortality rates reversed and increased (overall mean annual percentage change −1.7% (–2.5% to −0.8%) per year before 2011 compared with 3.5% (2.6% to 4.5%) per year after 2011), reflecting a decline in AAMR from 20.3 (20.1 to 20.4) per 100 000 in 1999 to 16.9 (16.8 to 17.1) per 100 000 in 2011, which was followed by a rise to 20.8 (20.7 to 20.9) per 100 000 again by 2018. Overall, the mean annual percentage change in hypertensive heart disease mortality rates accelerated from 1.2% (0.7% to 1.7%) per year before 2011 to 4.8% (3.3% to 6.3%) per year after 2011. The absolute numbers of deaths from and AAMR for valvular heart disease, arrhythmia, and pulmonary heart disease were relatively low compared with ischemic heart disease, heart failure, and hypertensive heart disease. Whereas AAMR for valvular heart disease decreased from 2011 to 2018 (from 6.7 (6.6 to 6.8) to 6.1 (6.0 to 6.2) per 100 000; mean annual percentage change −1.6% (–2.8% to −0.4%) per year), AAMR for arrhythmia and pulmonary heart disease increased to 9.1 (9.0 to 9.2) per 100 000 and 4.6 (4.6 to 4.7) per 100 000, respectively.
Table 1.
Trends in age adjusted mortality rates attributed to total heart disease and each subtype of heart disease in overall US population, 1999-2018
| Heart disease subtype | Age adjusted mortality rate per 100 000 (95% CI) | Mean annual percentage change (95% CI)* | ||||
|---|---|---|---|---|---|---|
| 1999 (n=725 192) | 2011 (n=596 577) | 2018 (n=655 381) | 1999-2011 | 2011-18 | ||
| Total heart disease | 266.5 (265.8 to 267.1) | 173.7 (173.3 to 174.2) | 163.6 (163.2 to 164.0) | −3.7 (−3.8 to −3.5)† | −0.7 (−1.1 to −0.3)† | |
| Ischemic heart disease | 194.6 (194.1 to 195.1) | 109.2 (108.8 to 109.5) | 90.9 (90.6 to 91.2) | −4.7 (−5.1 to −4.2)† | −2.6 (−3.3 to −2.0)† | |
| Heart failure | 20.3 (20.1 to 20.4) | 16.9 (16.8 to 17.1) | 20.8 (20.7 to 20.9) | −1.7 (−2.5 to −0.8)† | 3.5 (2.6 to 4.5)† | |
| Hypertensive heart disease | 9.6 (9.5 to 9.7) | 10.8 (10.7 to 10.9) | 15.1 (15.0 to 15.2) | 1.2 (0.7 to 1.7)† | 4.8 (3.3 to 6.3)† | |
| Valvular heart disease | 7.2 (7.1 to 7.3) | 6.7 (6.6 to 6.8) | 6.1 (6.0 to 6.2) | −0.4 (−0.6 to −0.1)† | −1.6 (−2.8 to −0.4)† | |
| Arrhythmia | 6.7 (6.6 to 6.8) | 8.2 (8.1 to 8.3) | 9.1 (9.0 to 9.2) | 1.7 (1.4 to 2.0)† | 1.7 (1.4 to 2.0)† | |
| Pulmonary heart disease | 4.8 (4.8 to 4.9) | 4.2 (4.1 to 4.3) | 4.6 (4.6 to 4.7) | −0.9 (−2.1 to 0.2) | 1.5 (1.0 to 1.9)† | |
| Other heart disease | 23.2 (23.0 to 23.4) | 17.8 (17.6 to 17.9) | 17.1 (16.9 to 17.2) | −2.0 (−2.3 to −1.6)† | −0.7 (−1.0 to −0.4)† | |
Mean annual percentage change shown for age adjusted mortality rates for specified time range.
Indicates that mean annual percentage change is significantly different from zero (P<0.05).
In secondary analyses, trends in AAMR for heart disease subtypes were similar by census region in the US, although AAMRs for total and heart disease subtypes were highest in the American South compared with other US census regions and generally higher in rural counties compared with urban counties (supplementary figures A and B, respectively).
Trends in heart disease mortality rates by race and sex
Black men had the highest AAMR for total heart disease (260.3 (205.6 to 207.1) per 100 000 in 2018), which was reflected primarily in high AAMR for ischemic heart disease (138.1 (136.2 to 139.9) per 100 000 in 2018), heart failure (28.9 (28.0 to 29.8) per 100 000), and hypertensive heart disease (35.3 (34.4 to 36.3) per 100 000). Trends in AAMR for total heart disease and ischemic heart disease slowed similarly after 2011 in black and white men and women (fig 2; supplementary table B). All race-sex groups showed a reversal of heart failure mortality trends after 2011. Notably, after 2011 mean annual percentage change in heart failure mortality rates was higher in black men (4.9% (4.0% to 5.8%) per year) than in black women, white men, and white women. Acceleration of hypertensive heart disease mortality rates was highest in white women (mean annual percentage change 5.6% (4.3% to 7.0%) per year) and white men (6.3% (4.9% to 9.4%) per year) after 2011. Although mean annual percentage change in hypertensive heart disease mortality rates was lower in black women and black men, absolute AAMR was higher in black than in white decedents.
Fig 2.

Age adjusted mortality rates for total heart disease and leading heart disease subtypes in black and white women and men in US, 1999-2018. Age adjusted mortality rates shown for total heart disease, ischemic heart disease, heart failure, and hypertensive heart disease in black and white women and men. Dashed line represents temporal inflection point in total heart disease identified by Joinpoint regression. Average annual percentage changes in age adjusted mortality rates before and after 2011 are listed in supplementary table B
Trends in heart disease mortality rates by age
AAMR was lowest for decedents under 45 years old at time of death across the study period (table 2). In this youngest age stratum, AAMR for total heart disease was 8.7 (8.6 to 8.9) per 100 000 in 2018, predominantly attributable to ischemic heart disease (AAMR 3.2 (3.1 to 3.3) per 100 000 in 2018) and hypertensive heart disease (1.4 (1.4 to 1.5) per 100 000). AAMR for hypertensive heart disease continued to worsen but decelerated from a mean annual percentage change of 4.8% (3.7% to 5.9%) per year before 2011 to 2.3% (1.9% to 2.8%) per year after 2011. However, mean annual percentage change in heart failure mortality rates accelerated after 2011, and mean annual percentage change in valvular heart disease indicated a reversal from decreasing AAMR to increasing AAMR. Secondary analysis of AAMR patterns in race-sex groups in decedents age under 45 years is shown in supplementary table C.
Table 2.
Trends in age adjusted mortality rates attributed to total heart disease and each subtype of heart disease by age at death in overall US population, 1999-2018
| Heart disease subtype and age at death | Age adjusted mortality rates per 100 000 (95% CI) | Mean annual percentage change (95% CI)* | ||||
|---|---|---|---|---|---|---|
| 1999 | 2011 | 2018 | 1999-2011 | 2011-18 | ||
| Total heart disease | ||||||
| <45 years | 10.3 (10.1 to 10.4) | 9.0 (8.9 to 9.2) | 8.7 (8.6 to 8.9) | −1.0 (−1.5 to −0.5)† | −0.3 (−0.7 to 0.1) | |
| 45-64 years | 164.1 (163.1 to 165.2) | 121.0 (120.2 to 121.7) | 122.3 (121.6 to 123.0) | −2.5 (−2.8 to −2.2)† | 0.2 (−0.1 to 0.4) | |
| ≥65 years | 1767.0 (1762.5 to 1771.4) | 1115.6 (1112.4 to 1118.8) | 1034.6 (1031.7 to 1037.4) | −3.7 (−4.3 to −3.1)† | −1.1 (−1.6 to −0.6)† | |
| Ischemic heart disease | ||||||
| <45 years | 4.9 (4.8 to 5.0) | 3.8 (3.7 to 3.9) | 3.2 (3.1 to 3.3) | −1.9 (−2.6 to −1.3)† | −2.3 (−2.7 to −1.9)† | |
| 45-64 years | 121.1 (120.2 to 121.9) | 79.3 (78.7 to 79.9) | 73.1 (72.6 to 73.7) | −3.4 (−3.6 to −3.3)† | −1.4 (−1.6 to −1.2)† | |
| ≥65 years | 1301.6 (1297.7 to 1305.4) | 704.7 (702.2 to 707.3) | 573.8 (571.7 to 575.9) | −4.9 (−5.4 to −4.4)† | −3.0 (−3.4 to −2.3)† | |
| Heart failure | ||||||
| <45 years | 0.2 (0.2 to 0.3) | 0.3 (0.3 to 0.3) | 0.4 (0.4 to 0.5) | 2.8 (0.5 to 5.0)† | 5.1 (2.7 to 7.6)† | |
| 45-64 years | 4.8 (4.6 to 4.9) | 4.5 (4.4 to 4.7) | 6.8 (6.7 to 7.0) | −0.6 (−1.2 to −0.1)† | 5.7 (4.4 to 7.0)† | |
| ≥65 years | 150.8 (149.5 to 152.2) | 124.5 (123.5 to 125.6) | 150.4 (149.3 to 151.5) | −1.7 (−2.6 to −0.9)† | 3.3 (2.4 to 4.3)† | |
| Hypertensive heart disease | ||||||
| <45 years | 0.7 (0.7 to 0.8) | 1.2 (1.1 to 1.2) | 1.4 (1.4 to 1.5) | 4.8 (3.7 to 5.9)† | 2.3 (1.9 to 2.8)† | |
| 45-64 years | 8.1 (7.9 to 8.3) | 12.1 (11.8 to 12.3) | 15.2 (15.0 to 15.5) | 3.9 (2.1 to 5.6)† | 3.0 (2.6 to 3.5)† | |
| ≥65 years | 57.6 (56.8 to 58.4) | 58.0 (57.3 to 58.7) | 85.5 (84.7 to 86.3) | 0.3 (−0.2 to 0.8) | 5.4 (3.6 to 7.2)† | |
| Valvular heart disease | ||||||
| <45 years | 0.3 (0.3 to 0.4) | 0.2 (0.2 to 0.2) | 0.3 (0.3 to 0.3) | −3.9 (−6.0 to −1.8)† | 7.1 (1.4 to 13.2)† | |
| 45-64 years | 2.5 (2.4 to 2.6) | 2.1 (2.0 to 2.2) | 2.2 (2.1 to 2.3) | −1.6 (−3.2 to 0.1) | 1.0 (−2.0 to 4.0) | |
| ≥65 years | 51.0 (50.2 to 51.7) | 48.1 (47.4 to 48.8) | 42.7 (42.1 to 43.3) | −0.3 (−0.5 to 0.0)† | −1.9 (−3.2 to −0.6)† | |
| Arrhythmia | ||||||
| <45 years | 0.4 (0.4 to 0.4) | 0.4 (0.4 to 0.4) | 0.4 (0.3 to 0.4) | −0.3 (−1.0 to 0.4) | −0.3 (−1.0 to 0.4) | |
| 45-64 years | 3.2 (3.0 to 3.3) | 3.4 (3.3 to 3.5) | 3.9 (3.8 to 4.1) | 0.5 (−0.9 to 2.0) | 2.2 (1.0 to 3.4)† | |
| ≥65 years | 45.7 (45.0 to 46.4) | 56.6 (55.9 to 57.3) | 63.1 (62.4 to 63.8) | 1.8 (1.5 to 2.1)† | 1.8 (1.5 to 2.1)† | |
| Pulmonary heart disease | ||||||
| <45 years | 0.9 (0.8 to 0.9) | 0.7 (0.6 to 0.7) | 0.7 (0.7 to 0.8) | −1.8 (−3.0 to −0.6)† | 0.3 (−0.9 to 1.5) | |
| 45-64 years | 4.6 (4.5 to 4.8) | 4.0 (3.8 to 4.1) | 4.3 (4.2 to 4.5) | −1.8 (−2.5 to −1.0)† | 1.4 (0.4 to 2.4)† | |
| ≥65 years | 25.7 (25.2 to 26.2) | 23.0 (22.5 to 23.4) | 25.3 (24.8 to 25.7) | −0.7 (−2.1 to 0.7) | 1.7 (1.1 to 2.2)† | |
| Other heart disease | ||||||
| <45 | 2.8 (2.7 to 2.9) | 2.4 (2.3 to 2.5) | 2.4 (2.3 to 2.4) | −1.3 (−1.7 to −1.0)† | −0.1 (−1.0 to 0.8) | |
| 45-64 | 19.8 (19.4 to 20.2) | 15.6 (15.3 to 15.8) | 16.6 (16.4 to 16.9) | −1.9 (−2.6 to −1.2)† | 0.9 (0.5 to 1.4)† | |
| ≥65 | 134.5 (133.3 to 135.8) | 100.7 (99.7 to 101.7) | 93.8 (92.9 to 94.6) | −2.2 (−2.6 to −1.7)† | −1.0 (−1.3 to −0.6)† | |
Mean annual percentage change shown for age adjusted mortality rates for specified time range.
Indicates that mean annual percentage change is significantly different from zero (P<0.05).
For decedents aged 45-64 years at time of death (table 2), AAMR for total heart disease declined between 1999 and 2011 (from 164.1 (163.2 to 165.2) to 121.0 (120.2 to 121.7) per 100 000; mean annual percentage change −2.5% (–2.8% to −2.2%) per year) but remained generally unchanged between 2011 and 2018 (to 122.3 (121.6 to 123.0) per 100 000; mean annual percentage change 0.2% (–0.1 to 0.4%) per year). AAMR was highest for ischemic heart disease (73.1 (72.6 to 73.7) per 100 000 in 2018), hypertensive heart disease (15.2 (15.0 to 15.5) per 100 000 in 2018), and heart failure (6.8 (6.7 to 7.0) per 100 000 in 2018). Mean annual percentage change in ischemic heart disease mortality rates decelerated after 2011 but accelerated for hypertensive heart disease mortality rates (mean annual percentage change 3.0% (2.6% to 3.5%) per year) and heart failure mortality rates (5.7% (4.4% to 7.0%) per year). Secondary analysis of AAMR patterns in race-sex groups in decedents aged 45-64 years is shown in supplementary table D.
Decedents aged 65 years or over had the highest AAMR for all types of heart disease compared with younger decedents (table 2). AAMR for total heart disease declined from 1767.0 (1762.5 to 1771.4) per 100 000 in 1999 to 1115.6 (1112.4 to 1118.8) per 100 000 in 2011 (mean annual percentage change −3.7% (–4.3 to −3.1%) per year), but further declined only to 1034.6 (1031.7 to 1037.4) per 100 000 between 2011 to 2018 (mean annual percentage change −1.1% (–1.6% to −0.6%) per year). Similarly to mortality patterns at younger ages, mortality rate trends for hypertensive heart disease accelerated after 2011, and heart failure trends reversed from decreasing to increasing AAMR. Secondary analysis of AAMR patterns in race-sex groups in decedents age 65 years or over is shown in supplementary table E. In the subset of deaths between age 65 and 84 years, similar mortality patterns were observed (supplementary table F).
Trends in years of potential life lost due to subtypes of heart disease
Estimated YPLL per 100 000 population is shown in table 3 and supplementary figure C. YPLL due to total heart disease in the overall US population was estimated to be 1068 years per 100 000 population in 2018. Of all the heart disease subtypes, YPLL in 2018 was highest for ischemic heart disease (578 years per 100 000), followed by hypertensive heart disease (132 years per 100 000) and then heart failure (64 years per 100 000). YPLL due to ischemic heart disease was similar in white and black men but 1.3-fold higher in black women than in white women. For ischemic heart disease, mean annual percentage change in YPLL decelerated from −3.8% (−3.9% to −3.7%) per year overall before 2011 to −1.6% (−1.8% to −1.4%) per year after 2011, with similar trends in all race-sex groups. YPLL due to hypertensive heart disease was 2.9-fold higher in black women (219 years per 100 000) and 2.3-fold higher in black men (305 per 100 000) compared with white women and men in 2018, respectively. However, faster increases in YPLL over the study period were observed in white women (mean annual percentage change 4.2% (0.9% to 7.7%) per year after 2011) and white men (3.3% (3.0% to 3.5%) per year after 2011). For heart failure, YPLL changed from either decreasing or stagnant before 2011 to increasing after 2011. Black women and men had a twofold higher YPLL due to heart failure compared with white women and men, with highest mean annual percentage change in YPLL in black women (5.8% (4.5% to 7.2%) per year) and black men (6.6% (5.0% to 8.3%) per year).
Table 3.
Trends in age standardized years of potential life lost per 100 000 population due to total heart disease and each subtype of heart disease in overall population and race-sex subgroups in the US, 1999-2018
| Heart disease subtype and subgroup | Years of potential life lost (per 100 000 population) | Mean annual percentage change (95% CI)* | ||||
|---|---|---|---|---|---|---|
| 1999 | 2011 | 2018 | 1999-2011 | 2011-18 | ||
| Total heart disease | ||||||
| Overall | 1494 | 1080 | 1068 | −2.7 (−2.9 to −2.6)† | 0.1 (−0.2 to 0.4) | |
| Black women | 1824 | 1215 | 1210 | −3.5 (−3.8 to −3.3)† | −0.1 (−0.7 to 0.6) | |
| White women | 1064 | 754 | 744 | −2.8 (−3.0 to −2.7)† | 0.1 (−0.3 to 0.4) | |
| Black men | 2183 | 1549 | 1602 | −2.7 (−3.3 to −2.2)† | 0.3 (−0.3 to 0.9) | |
| White men | 1677 | 1244 | 1205 | −2.5 (−2.6 to −2.3)† | −0.5 (−0.7 to −0.2)† | |
| Ischemic heart disease | ||||||
| Overall | 1025 | 645 | 578 | −3.8 (−3.9 to −3.7)† | −1.6 (−1.8 to −1.4)† | |
| Black women | 983 | 543 | 479 | −5.0 (−5.5 to −4.4)† | −1.6 (−2.0 to −1.1)† | |
| White women | 696 | 418 | 373 | −4.1 (−4.3 to −3.9)† | −1.5 (−1.9 to −1.1)† | |
| Black men | 1254 | 770 | 716 | −3.8 (−4.3 to −3.3)† | −1.1 (−1.7 to −0.5)† | |
| White men | 1247 | 816 | 723 | −3.5 (−3.7 to −3.4)† | −1.7 (−2.0 to −1.5)† | |
| Heart failure | ||||||
| Overall | 49 | 45 | 64 | −1.0 (−1.7 to −0.3)† | 5.5 (4.8 to 6.1)† | |
| Black women | 79 | 70 | 103 | −1.2 (−2.4 to 0.1) | 5.8 (4.5 to 7.2)† | |
| White women | 50 | 43 | 53 | −1.4 (−2.9 to 0.1) | 3.9 (2.6 to 5.2)† | |
| Black men | 71 | 74 | 116 | 0.8 (−0.8 to 2.5) | 6.6 (5.0 to 8.3)† | |
| White men | 43 | 39 | 57 | −0.9 (−1.4 to −0.5)† | 5.5 (4.5 to 6.6)† | |
| Hypertensive heart disease | ||||||
| Overall | 73 | 107 | 132 | 3.4 (2.6 to 4.2)† | 3.2 (2.4 to 4.1)† | |
| Black women | 210 | 207 | 219 | 0.0 (−0.4 to 0.3) | 0.0 (−0.4 to 0.3) | |
| White women | 39 | 57 | 76 | 3.4 (2.5 to 4.3)† | 4.2 (0.9 to 7.7)† | |
| Black men | 237 | 271 | 305 | 1.6 (0.7 to 2.5)† | 0.6 (0.2 to 0.9)† | |
| White men | 57 | 105 | 134 | 5.4 (4.7 to 6.0)† | 3.3 (3.0 to 3.5)† | |
| Remainder heart disease subtypes | ||||||
| Overall | 346 | 283 | 293 | −1.6 (−2.0 to −1.3)† | 0.5 (−0.7 to 1.7) | |
| Black women | 551 | 394 | 409 | −2.7 (−3.1 to −2.4)† | 0.4 (−0.4 to 1.2) | |
| White women | 279 | 236 | 241 | −1.5 (−1.8 to −1.1)† | 0.8 (0.2 to 1.3)† | |
| Black men | 620 | 435 | 465 | −2.7 (−3.9 to −1.5)† | 0.7 (0.1 to 1.4)† | |
| White men | 331 | 284 | 291 | −1.1 (−1.4 to −0.8)† | 0.3 (0.0 to 0.7) | |
Mean annual percentage change shown for years of potential life lost for specified time range.
Indicates that mean annual percentage change is significantly different from zero (P<0.05).
We also calculated YPLL due to total heart disease from the average US life expectancy and from age 85 as the reference age applied to all race-sex subgroups (supplementary tables G and H). We observed similar patterns in both of these analyses compared with YPLL from race-sex specific life expectancies, in which black women and men had higher YPLL than white women and men. Declining trends in YPLL from 1999 to 2011 were statistically significant. Trends in all subgroups slowed or stagnated from 2011 to 2018.
Finally, in secondary analysis, we assessed AAMR and YPLL from heart failure as a contributing cause of cardiovascular death (supplementary table I). We observed similar patterns compared with heart failure as an underlying cause of death: AAMR and YPLL trends reversed from decreasing between 1999 to 2011 to increasing after 2011 through 2018 for all race-sex and age groups.
Supplementary table J provides a summary of contemporary heart disease mortality statistics in the overall population by each of the metrics (total number of decedents by subtype, percentage contribution of each subtype to total heart disease deaths, AAMR by subtype, and YPLL by subtype) for 2018.
Discussion
Changing patterns in mortality due to heart disease subtypes in the US are reflected overall by a plateau in age adjusted mortality rate for total heart disease since 2011, within which deceleration of mortality rates for ischemic heart disease are coupled with increases in mortality rates for heart failure and hypertensive heart disease in all race-sex groups. In particular, black men had both the highest AAMR and the fastest increase in mortality rates for heart failure compared with other groups. Although mortality rates for hypertensive heart disease increased for all race-sex groups, the fastest increases in AAMR for hypertensive heart disease were observed in white women and men between 2011 and 2018. However, AAMR for hypertensive heart disease remained about twice as high in black as in white populations by 2018.
Our estimates of the burden of heart disease expressed as YPLL translate into approximately 3.5 million potential years of life lost due to total heart disease in 2018, but this burden was borne disproportionately in different race-sex groups and attributed to different heart disease subtypes. Although overall YPLL due to total heart disease declined across the study period, premature mortality evaluated by YPLL increased for two of the top three subtypes of heart disease deaths: hypertensive heart disease and heart failure, reflected by an 80% and a 31% increase in YPLL from hypertensive heart disease and heart failure, respectively, between 1999 and 2018. Whereas AAMR was higher for heart failure than for hypertensive heart disease, YPLL due to hypertensive heart disease was higher, indicating that hypertensive heart disease related deaths are occurring at younger ages. AAMR for less common causes of heart disease (arrhythmia, pulmonary heart disease, and other heart disease) was either stagnant or increased from 2011 to 2018. Valvular heart disease was the only subtype for which declines in mortality rates accelerated after 2011, although the relative burden of deaths from valvular heart disease remained low.
Comparison with other studies
These findings align with recent data showing contemporaneous slowing in the decline of mortality rates for cardiometabolic disease and recent surveillance of heart disease mortality showing that the growth in the population of older Americans aged 65 years or over during this time was associated with an increase in the number of deaths from heart disease, despite a stagnant or slowly declining AAMR.6 13 Our results build on these reports by providing broader and more detailed mortality patterns for the range of heart disease subtypes as underlying cause of death, particularly highlighting the rapid growth and high burden of death overall from hypertensive heart disease, increasing mortality rates for heart failure and hypertensive heart disease at younger ages reflected in a high magnitude of YPLL from these causes, and worrisome patterns in mortality from arrhythmia and pulmonary heart disease. These findings likely represent a combination of changing patterns of incidence and survival for heart disease over the past two decades.
Although overall declines in total heart disease mortality may be attributed to improved diagnosis and management over the past decades, the observed recent patterns of heart disease mortality overall may be due to the growing burden of cardiometabolic risk factors for heart disease. Obesity, diabetes, and hypertension likely play a sizeable role in the observed changes in recent mortality rates for heart disease in the US, where the prevalence of obesity now exceeds 42%,23 the prevalence of both prediabetes and diabetes approaches 50%,24 and the prevalence of hypertension is approximately 30%.25 Recent trends in assessment of cardiovascular health in the US project continued worsening in prevalences of poor quality of diet, physical inactivity, obesity, and diabetes in the coming decades.26 27 28 29 Furthermore, regional differences in prevalence of these modifiable risk factors likely account for a substantial portion of regional differences in the burden of heart disease in the US.30 Such trends will likely result in continued increases in mortality from heart disease subtypes such as heart failure and hypertensive heart disease if current trends continue without intervention, given the direct association of these subtypes with cardiometabolic risk factors.31 32 33
The observed differences in heart disease mortality by race may partly reflect underlying and pervasive disparities in cardiovascular health and burden of heart disease.26 Specifically, obesity, diabetes, and hypertension in the US remain most prevalent in black Americans, and rates of control remain lower in black than in white Americans.34 Differences in patterns of guideline recommended drug treatment, including drug prescription, optimization, and adherence, especially for hypertension, likely contribute to racial disparities in heart disease morbidity and mortality.35 36 37 38 Race is used in this analysis according to categorization from death certificates and is commonly reported in research studies in the US, but it is important to recognize that race is a social construct that incorporates more than biological differences resulting from ancestral origin and is used variably throughout the world.39 A growing body of evidence suggests that racial differences in cardiovascular health and heart disease mortality are in large part representative of avoidable differences in many other factors, including a range of social determinants of health, socioeconomic status and access to care,40 burden of the drug misuse epidemic in the US,41 and structural and systemic racism that require individual and policy level changes to target and reduce persistent health inequities.42 43 We also observed differences in heart disease mortality rates between men and women, wherein men have higher rates of heart disease mortality, and the burden of mortality is highest in black men. Sex differences may be due to a range of factors, from differences in prevalence of risk factors (such as tobacco use44) to social determinants such as healthcare use.45
Strengths and limitations of study
The principal strength of our analysis is the investigation of contemporary nationwide data on mortality attributed to leading subtypes of heart disease and differences among race-sex, age, and geographic subgroups. These data allow for evaluation of changes and disparities in patterns of cause specific cardiovascular mortality, which contribute to the observed increases in total heart disease deaths in the past decade and disproportionally burden black Americans. Limitations of our analysis include incomplete race/ethnicity data. Our investigation focuses on the most reliable data available, to evaluate trends in white and black subgroups who represent approximately 90% of the US population.14 Given evidence that reporting methods for Hispanic, Asian, and Native American ethnicity may lead to misclassification and underestimation of mortality rates in these groups,46 and that data for disaggregated Asian American and Hispanic Americans subgroups were not available, these groups were not reported. Additionally, death certificate data are subject to potential miscoding and misclassification.47 48 However, these data provide the most comprehensive assessment of cause specific heart disease mortality rates at a national level. Importantly, these data may not reflect the clinical progression of heart diseases, such as from ischemic heart disease to heart failure. Specifically, as the clinical syndrome of heart failure represents a mode of death often attributable to hypertension, ischemic heart disease, valvular heart disease, or diabetes as the underlying cause,49 our primary analysis may underestimate the burden of heart failure related mortality and does not identify patients with heart failure who had preceding non-fatal ischemic heart disease or hypertensive heart disease. Notably, similar patterns were seen in our secondary analysis evaluating trends in mortality rates for heart failure as a contributing cause of cardiovascular death. Finally, the “other heart disease” category reflects a heterogenous mix of heart diseases that may have dissimilar pathophysiology.
Conclusions and policy implications
Future research and public health strategies should focus on dissemination and implementation of interventions that focus on prevention and management of heart disease in the populations at highest risk to promote equity, clinical quality improvement to optimize primary and secondary prevention, and policies to improve diet quality and facilitate physical activity. For primary prevention, simulation modeling for prevention of heart disease in high income settings has been conducted in the UK and suggests that a strategy of enhanced screening for heart disease targeted toward the highest risk groups, combined with adoption of population-wide structural policies for smoking cessation, reduction in sugar sweetened drink consumption, and salt reduction in foods, could maximize reductions in heart disease mortality and inequalities.50 51 Additionally, community level interventions tailored to tackle risk factors in disproportionately burdened race-sex groups have also proven effective in the US, such as a barber and pharmacist led intervention targeting control of hypertension in black male patrons of black owned barbershops.52 Targeting such strategies toward younger adults, in particular, would likely lead to greater reductions in YPLL through the number of premature cardiovascular deaths prevented or postponed. Enhanced secondary prevention strategies across the life course may additionally mitigate mortality across the spectrum of heart disease subtypes. Increasing prescription of and adherence to guideline recommended medical treatment, as applicable for lipids, for blood pressure, for diabetes, with antiplatelet agents,53 or for heart failure with reduced ejection fraction,54 may also help to change the worrisome observed trends in mortality rates. Ultimately, a comprehensive multilevel, multi-stakeholder approach focused on prevention of modifiable risk factors, adherence to evidence based secondary prevention strategies, and targeting of disproportionately burdened groups is urgently needed to curb worrisome trends in deaths from heart disease in the US.
What is already known on this topic
Surveillance data from national death certificates show that declines in total heart disease mortality in the US have slowed since 2011
Advances in medical and surgical therapies may have led to heterogeneous patterns in death rates for specific subtypes of heart disease
Detailed understanding of how mortality due to subtypes of heart disease contributes to total heart disease mortality patterns will inform implementation of multilevel prevention interventions
What this study adds
Increases in heart failure and hypertensive heart disease mortality occurred parallel to declines in ischemic heart disease mortality, resulting in 3.5 million years of potential life lost from total heart disease in 2018
Black men had the highest burden of mortality from leading subtypes of heart disease
However, the greatest increases midlife mortality due to heart disease subtypes were observed in black women (heart failure) and white women (hypertensive heart disease)
Web extra.
Extra material supplied by authors
Web appendix: Supplementary material
Contributors: NSS, SC, MOF, MC, DMLJ, and SSK designed the study. NSS, RM, and SSK did the statistical analysis. NSS, SC, MOF, MC, DMLJ, and SSK interpreted the data. NSS and SSK drafted the manuscript, and NSS, JSR, SS, SC, MOF, MC, DMLJ, and SSK revised it for critical content. SSK provided supervision and technical assistance. NSS and SSK acquired funding. The corresponding author attests that all listed authors meet authorship criteria and that no others meeting the criteria have been omitted. NSS and SSK are the guarantors.
Funding: Research reported in this publication was supported by National Institutes of Health (NIH) National Heart, Lung, and Blood Institute grant number 1F32HL149187 (NSS), NIH National Center for Advancing Translational Sciences grant number KL2TR001424 (SSK), and the American Heart Association #19TPA34890060 (SSK). The funding sponsors did not contribute to design and conduct of the study; collection, management, analysis, or interpretation of the data; or preparation, review, approval, or decision to submit the manuscript. The content is solely the responsibility of the authors and does not necessarily represent the official views of the NIH.
Competing interests: All authors have completed the ICMJE uniform disclosure form at www.icmje.org/coi_disclosure.pdf and declare: support from the NIH National Heart, Lung, and Blood Institute, the NIH National Center for Advancing Translational Sciences, and the American Heart Association for the submitted work; no financial relationships with any organizations that might have an interest in the submitted work in the previous three years; no other relationships or activities that could appear to have influenced the submitted work.
Ethical approval: This study was determined to be exempt from review by the North western University institutional review board.
Data sharing: The data used for the analyses are available at https://wonder.cdc.gov.
The lead authors affirm that the manuscript is an honest, accurate, and transparent account of the study being reported; that no important aspects of the study have been omitted; and that any discrepancies from the study as planned (and, if relevant, registered) have been explained.
Dissemination to participants and related patient and public communities: There are no plans to directly disseminate the results of the research to study participants or the relevant patient community as this study analyzed deidentified national vital statistics data.
References
- 1. Centers for Disease Control and Prevention (CDC) Decline in deaths from heart disease and stroke--United States, 1900-1999. MMWR Morb Mortal Wkly Rep 1999;48:649-56. [PubMed] [Google Scholar]
- 2. Ma J, Ward EM, Siegel RL, Jemal A. Temporal trends in mortality in the United States, 1969-2013. JAMA 2015;314:1731-9. 10.1001/jama.2015.12319. [DOI] [PubMed] [Google Scholar]
- 3. Ford ES, Ajani UA, Croft JB, et al. Explaining the decrease in US deaths from coronary disease, 1980-2000. N Engl J Med 2007;356:2388-98. 10.1056/NEJMsa053935. [DOI] [PubMed] [Google Scholar]
- 4. Ritchey MD, Loustalot F, Bowman BA, Hong Y. Trends in mortality rates by subtypes of heart disease in the United States, 2000-2010. JAMA 2014;312:2037-9. 10.1001/jama.2014.11344. [DOI] [PMC free article] [PubMed] [Google Scholar]
- 5. Sidney S, Quesenberry CP, Jr, Jaffe MG, et al. Recent trends in cardiovascular mortality in the United States and public health goals. JAMA Cardiol 2016;1:594-9. 10.1001/jamacardio.2016.1326. [DOI] [PubMed] [Google Scholar]
- 6. Shah NS, Lloyd-Jones DM, O’Flaherty M, et al. Trends in cardiometabolic mortality in the United States, 1999-2017. JAMA 2019;322:780-2. 10.1001/jama.2019.9161 [DOI] [PMC free article] [PubMed] [Google Scholar]
- 7. Curtin SC. Trends in cancer and heart disease death rates among adults aged 45-64: United States, 1999-2017. Natl Vital Stat Rep 2019;68:1-9. [PubMed] [Google Scholar]
- 8. Woolf SH, Chapman DA, Buchanich JM, Bobby KJ, Zimmerman EB, Blackburn SM. Changes in midlife death rates across racial and ethnic groups in the United States: systematic analysis of vital statistics. BMJ 2018;362:k3096. 10.1136/bmj.k3096. [DOI] [PMC free article] [PubMed] [Google Scholar]
- 9. Vaughan AS, Ritchey MD, Hannan J, Kramer MR, Casper M. Widespread recent increases in county-level heart disease mortality across age groups. Ann Epidemiol 2017;27:796-800. 10.1016/j.annepidem.2017.10.012. [DOI] [PMC free article] [PubMed] [Google Scholar]
- 10. Woolf SH, Schoomaker H. Life expectancy and mortality rates in the United States, 1959-2017. JAMA 2019;322:1996-2016. 10.1001/jama.2019.16932. [DOI] [PMC free article] [PubMed] [Google Scholar]
- 11. Lopez AD, Adair T. Is the long-term decline in cardiovascular-disease mortality in high-income countries over? Evidence from national vital statistics. Int J Epidemiol 2019;48:1815-23. 10.1093/ije/dyz143. [DOI] [PubMed] [Google Scholar]
- 12. Sidney S, Quesenberry CP, Jr, Jaffe MG, Sorel M, Go AS, Rana JS. Heterogeneity in national U.S. mortality trends within heart disease subgroups, 2000-2015. BMC Cardiovasc Disord 2017;17:192. 10.1186/s12872-017-0630-2. [DOI] [PMC free article] [PubMed] [Google Scholar]
- 13. Sidney S, Go AS, Jaffe MG, Solomon MD, Ambrosy AP, Rana JS. Association Between aging of the US population and heart disease mortality from 2011 to 2017. JAMA Cardiol 2019;4:1280-6. 10.1001/jamacardio.2019.4187. [DOI] [PMC free article] [PubMed] [Google Scholar]
- 14. Arias E, Schauman WS, Eschbach K, et al. The validity of race and Hispanic origin reporting on death certificates in the United States. Vital Health Statistics. National Center for Health Statistics, 2008. [PubMed] [Google Scholar]
- 15.Centers for Disease Control and Prevention. Wide-ranging Online Data for Epidemiologic Research (WONDER). 2020. https://wonder.cdc.gov/.
- 16. Ingram DD, Franco SJ. 2013 NCHS urban-rural classification scheme for counties. Vital Health Stat 2 2014;(166):1-73. [PubMed] [Google Scholar]
- 17. Gardner JW, Sanborn JS. Years of potential life lost (YPLL)--what does it measure? Epidemiology 1990;1:322-9. 10.1097/00001648-199007000-00012 [DOI] [PubMed] [Google Scholar]
- 18. Iyer DG, Shah NS, Hastings KG, et al. Years of potential life lost because of cardiovascular disease in Asian-American subgroups, 2003-2012. J Am Heart Assoc 2019;8:e010744. 10.1161/JAHA.118.010744. [DOI] [PMC free article] [PubMed] [Google Scholar]
- 19. Arias E, Xu J, Kochanek KD. United States life tables, 2016. Natl Vital Stat Rep 2019;68:1-66. [PubMed] [Google Scholar]
- 20. Arias E, Xu J. United States life tables, 2017. Natl Vital Stat Rep 2019;68:1-66. [PubMed] [Google Scholar]
- 21.National Cancer Institute. Number of joinpoints. 2020. https://surveillance.cancer.gov/help/joinpoint/setting-parameters/method-and-parameters-tab/number-of-joinpoints.
- 22. Glynn P, Lloyd-Jones DM, Feinstein MJ, Carnethon M, Khan SS. Disparities in cardiovascular mortality related to heart failure in the United States. J Am Coll Cardiol 2019;73:2354-5. 10.1016/j.jacc.2019.02.042. [DOI] [PubMed] [Google Scholar]
- 23. Hales CM, Carroll MD, Fryar CD, Ogden CL. Prevalence of obesity and severe obesity among adults: United States, 2017-2018. NCHS Data Brief 2020;1-8. [PubMed] [Google Scholar]
- 24. Virani SS, Alonso A, Benjamin EJ, et al. American Heart Association Council on Epidemiology and Prevention Statistics Committee and Stroke Statistics Subcommittee Heart disease and stroke statistics-2020 update: a report from the American Heart Association. Circulation 2020;141:e139-596. 10.1161/CIR.0000000000000757. [DOI] [PubMed] [Google Scholar]
- 25. Fryar CD, Ostchega Y, Hales CM, Zhang G, Kruszon-Moran D. Hypertension prevalence and control among adults: United States. NCHS Data Brief 2017-2016;2017:1-8. [PubMed] [Google Scholar]
- 26. Khan SS, Shah NS, Ning H, et al. Cardiovascular health behavior and health factor trends (1999-2014) and projections to 2050: results from the National Health and Nutrition Examination Surveys. Circulation 2019;139(suppl 1):AMP01 10.1161/circ.139.suppl_1.MP01. [DOI] [Google Scholar]
- 27. Huffman MD, Capewell S, Ning H, Shay CM, Ford ES, Lloyd-Jones DM. Cardiovascular health behavior and health factor changes (1988-2008) and projections to 2020: results from the National Health and Nutrition Examination Surveys. Circulation 2012;125:2595-602. 10.1161/CIRCULATIONAHA.111.070722. [DOI] [PMC free article] [PubMed] [Google Scholar]
- 28. Hales CM, Fryar CD, Carroll MD, Freedman DS, Ogden CL. Trends in obesity and severe obesity prevalence in US youth and adults by sex and age, 2007-2008 to 2015-2016. JAMA 2018;319:1723-5. 10.1001/jama.2018.3060. [DOI] [PMC free article] [PubMed] [Google Scholar]
- 29. Lin J, Thompson TJ, Cheng YJ, et al. Projection of the future diabetes burden in the United States through 2060. Popul Health Metr 2018;16:9. 10.1186/s12963-018-0166-4. [DOI] [PMC free article] [PubMed] [Google Scholar]
- 30. Roth GA, Johnson CO, Abate KH, et al. Global Burden of Cardiovascular Diseases Collaboration The Burden of Cardiovascular Diseases Among US States, 1990-2016. JAMA Cardiol 2018;3:375-89. 10.1001/jamacardio.2018.0385. [DOI] [PMC free article] [PubMed] [Google Scholar]
- 31. Dhingra R, Vasan RS. Diabetes and the risk of heart failure. Heart Fail Clin 2012;8:125-33. 10.1016/j.hfc.2011.08.008. [DOI] [PMC free article] [PubMed] [Google Scholar]
- 32. Kenchaiah S, Evans JC, Levy D, et al. Obesity and the risk of heart failure. N Engl J Med 2002;347:305-13. 10.1056/NEJMoa020245. [DOI] [PubMed] [Google Scholar]
- 33. Uijl A, Koudstaal S, Vaartjes I, et al. Risk for heart failure: the opportunity for prevention with the American Heart Association’s Life’s Simple 7. JACC Heart Fail 2019;7:637-47. 10.1016/j.jchf.2019.03.009. [DOI] [PubMed] [Google Scholar]
- 34. Pool LR, Ning H, Lloyd-Jones DM, Allen NB. Trends in racial/ethnic disparities in cardiovascular health among US adults From 1999-2012. J Am Heart Assoc 2017;6:e006027. 10.1161/JAHA.117.006027. [DOI] [PMC free article] [PubMed] [Google Scholar]
- 35. Ferdinand KC, Yadav K, Nasser SA, et al. Disparities in hypertension and cardiovascular disease in blacks: The critical role of medication adherence. J Clin Hypertens (Greenwich) 2017;19:1015-24. 10.1111/jch.13089. [DOI] [PMC free article] [PubMed] [Google Scholar]
- 36. Charles H, Good CB, Hanusa BH, Chang CC, Whittle J. Racial differences in adherence to cardiac medications. J Natl Med Assoc 2003;95:17-27. [PMC free article] [PubMed] [Google Scholar]
- 37. Zhang Y, Baik SH. Race/Ethnicity, disability, and medication adherence among medicare beneficiaries with heart failure. J Gen Intern Med 2014;29:602-7. 10.1007/s11606-013-2692-x. [DOI] [PMC free article] [PubMed] [Google Scholar]
- 38. Ferdinand KC, Senatore FF, Clayton-Jeter H, et al. Improving medication adherence in cardiometabolic disease: practical and regulatory implications. J Am Coll Cardiol 2017;69:437-51. 10.1016/j.jacc.2016.11.034. [DOI] [PMC free article] [PubMed] [Google Scholar]
- 39. Salway S, Holman D, Lee C, et al. Transforming the health system for the UK’s multiethnic population. BMJ 2020;368:m268. 10.1136/bmj.m268. [DOI] [PubMed] [Google Scholar]
- 40. Schultz WM, Kelli HM, Lisko JC, et al. Socioeconomic status and cardiovascular outcomes: challenges and interventions. Circulation 2018;137:2166-78. 10.1161/CIRCULATIONAHA.117.029652. [DOI] [PMC free article] [PubMed] [Google Scholar]
- 41. Glei DA, Preston SH. Estimating the impact of drug use on US mortality, 1999-2016. PLoS One 2020;15:e0226732. 10.1371/journal.pone.0226732. [DOI] [PMC free article] [PubMed] [Google Scholar]
- 42. Mensah GA. Black and minority health 2019: more progress is needed. J Am Coll Cardiol 2019;74:1264-8. 10.1016/j.jacc.2019.07.007 [DOI] [PubMed] [Google Scholar]
- 43. Havranek EP, Mujahid MS, Barr DA, et al. American Heart Association Council on Quality of Care and Outcomes Research, Council on Epidemiology and Prevention, Council on Cardiovascular and Stroke Nursing, Council on Lifestyle and Cardiometabolic Health, and Stroke Council Social determinants of risk and outcomes for cardiovascular disease: a scientific statement from the American Heart Association. Circulation 2015;132:873-98. 10.1161/CIR.0000000000000228. [DOI] [PubMed] [Google Scholar]
- 44. Creamer MR, Wang TW, Babb S, et al. Tobacco product use and cessation indicators among adults - United States, 2018. MMWR Morb Mortal Wkly Rep 2019;68:1013-9. 10.15585/mmwr.mm6845a2. [DOI] [PMC free article] [PubMed] [Google Scholar]
- 45. Dunlop DD, Manheim LM, Song J, Chang RW. Gender and ethnic/racial disparities in health care utilization among older adults. J Gerontol B Psychol Sci Soc Sci 2002;57:S221-33. 10.1093/geronb/57.4.S221. [DOI] [PubMed] [Google Scholar]
- 46. Rosenberg HM, Maurer JD, Sorlie PD, et al. Quality of death rates by race and Hispanic origin: A summary of current research. National Center for Health Statistics, 1999. [PubMed] [Google Scholar]
- 47. Pagidipati NJ, Gaziano TA. Estimating deaths from cardiovascular disease: a review of global methodologies of mortality measurement. Circulation 2013;127:749-56. 10.1161/CIRCULATIONAHA.112.128413. [DOI] [PMC free article] [PubMed] [Google Scholar]
- 48. Lloyd-Jones DM, Martin DO, Larson MG, Levy D. Accuracy of death certificates for coding coronary heart disease as the cause of death. Ann Intern Med 1998;129:1020-6. 10.7326/0003-4819-129-12-199812150-00005. [DOI] [PubMed] [Google Scholar]
- 49. Snyder ML, Love SA, Sorlie PD, et al. Redistribution of heart failure as the cause of death: the Atherosclerosis Risk in Communities Study. Popul Health Metr 2014;12:10. 10.1186/1478-7954-12-10. [DOI] [PMC free article] [PubMed] [Google Scholar]
- 50. Kypridemos C, Allen K, Hickey GL, et al. Cardiovascular screening to reduce the burden from cardiovascular disease: microsimulation study to quantify policy options. BMJ 2016;353:i2793. 10.1136/bmj.i2793. [DOI] [PMC free article] [PubMed] [Google Scholar]
- 51. Kypridemos C, Collins B, McHale P, et al. Future cost-effectiveness and equity of the NHS Health Check cardiovascular disease prevention programme: Microsimulation modelling using data from Liverpool, UK. PLoS Med 2018;15:e1002573. 10.1371/journal.pmed.1002573. [DOI] [PMC free article] [PubMed] [Google Scholar]
- 52. Victor RG, Lynch K, Li N, et al. A cluster-randomized trial of blood-pressure reduction in black barbershops. N Engl J Med 2018;378:1291-301. 10.1056/NEJMoa1717250. [DOI] [PMC free article] [PubMed] [Google Scholar]
- 53. Smith SC, Jr, Benjamin EJ, Bonow RO, et al. World Heart Federation and the Preventive Cardiovascular Nurses Association AHA/ACCF secondary prevention and risk reduction therapy for patients with coronary and other atherosclerotic vascular disease: 2011 update: a guideline from the American Heart Association and American College of Cardiology Foundation. Circulation 2011;124:2458-73. 10.1161/CIR.0b013e318235eb4d. [DOI] [PubMed] [Google Scholar]
- 54. Yancy CW, Jessup M, Bozkurt B, et al. 2017 ACC/AHA/HFSA Focused Update of the 2013 ACCF/AHA Guideline for the Management of Heart Failure: A Report of the American College of Cardiology/American Heart Association Task Force on Clinical Practice Guidelines and the Heart Failure Society of America. Circulation 2017;136:e137-61. 10.1161/CIR.0000000000000509. [DOI] [PubMed] [Google Scholar]
Associated Data
This section collects any data citations, data availability statements, or supplementary materials included in this article.
Supplementary Materials
Web appendix: Supplementary material