Abstract
Stressor-response research on stony corals in the laboratory relies on detecting relatively small changes in the size of coral fragments throughout the course of an experiment. Coral colonies are complex, three-dimensional (3D) communities of organisms, so small changes in size are best detected by changes in 3D surface area. Traditional methods to estimate 3D coral surface area commonly require destruction of the sample, thereby eliminating repeat measurements and the ability to calculate growth rate. However, non-destructive two-dimensional (2D) photogrammetry can be used if defensible relationships with 3D surface area can be established. In this study, 165 coral skeletons representing four stony coral species (Pocillopora damicornis, Madracis mirabilis, Orbicella faveolata, Porites porites) were photographed in 2D (top and side views) and then imaged with 3D laser scanning. Significant linear relationships were found between the 3D surface areas (laser) and the sum of various combinations of top and side view surface areas captured by 2D digital photography. The relationships were very strong for simple colony shapes and more variable as coral fragments increased in size and complexity. This study demonstrates an efficient method for obtaining estimates of 3D coral surface area from non-destructive 2D photogrammetry, allowing measurement of growth rate throughout experimental exposure periods.
Keywords: Stony coral, 3D surface area, photogrammetry, coral morphology, methods development, colony size estimation
Introduction
Colony growth and changes in living tissue are valuable physiological endpoints that can detect sublethal effects of environmental stressors on stony corals during laboratory exposures. Because corals are complex, three-dimensional (3D) organisms, both endpoints are best measured using 3D surface area measurements. According to Holmes et al. (2008), changes in complex colonies might be undetectable using two-dimensional (2D) methods. Several methods have been proposed during the last 60 years to obtain accurate 3D surface areas from coral skeletons (Veal et al., 2010a) including wax dipping, foil wrapping, laser scanning and computer tomography (CT) scanning. Wax dipping and CT scanning appear to provide the most accurate 3D surface area estimates of coral skeletons (Veal et al., 2010a). Most of these 3D methods are performed on skeletons because the amount of time required for live corals to be out of water for measurements is destructive to the living organism (Raz-Bahat et al., 2009; LaForsch et al., 2008), barring any repeat measurements needed to calculate changes in skeletal or living tissue during the experimental period.
Photogrammetry (2D images) remains the most portable, cost-effective, and flexible approach for non-destructive shape capture (Niem et al., 1994; Holmes et al., 2008; Chancerelle 2000), but is limited in its ability to measure 3D surface areas because of overlapping coral branches in photographic images (Courtney et al., 2007). Linear regression models can provide a reliable method to predict 3D surface area from 2D images. In this study, various combinations of top and side views of coral fragments obtained with 2D digital photography were compared to 3D laser scans of the same skeletons in an attempt to establish defensible linear models for estimating 3D surface area from 2D photogrammetry. Four stony coral taxa, ranging from simple to complex and ranging in surface area from 224 to 3049 mm2, were included in the study. Results indicate a common linear relationship might be useful for a variety of coral species.
Materials and Methods
Coral Skeletons
Four stony coral species (165 coral skeletons) from Caribbean and Pacific habitats were processed using 2D digital photography and 3D laser scanning methods. The skeletons had been archived as fragments or cut blocks (cube-shaped) from previous laboratory studies at the Environmental Protection Agency’s Gulf Ecology Division (GED) in Gulf Breeze, Florida (Barron et al. 2010; Fournie et al., 2012). Colonies included a highly branched Pacific species Pocillopora damicornis (cauliflower coral, 60 skeletons) two Caribbean species with finger-like projections, Madracis mirabilis (yellow pencil coral, 18 skeletons) and Porites porites (finger coral, 20 skeletons) and an unbranched Caribbean species Orbicella faveolata (mountainous star coral, 67 skeletons, including 25 hemispherical and 42 cube-shaped). Each coral skeleton in the study was mounted with superglue to 25 mm clear plastic disks affixed to a 12 mm square clear plastic rod.
2D Photography
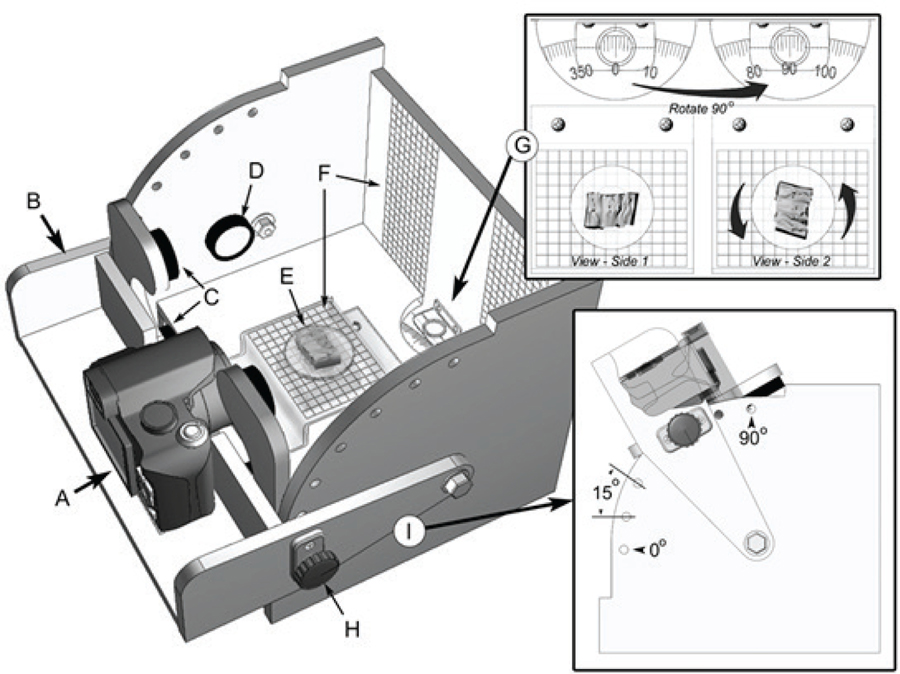
A camera jig (Fig. 1) was constructed to facilitate and standardize the collection of coral skeleton images. The jig consists of a housing which provides consistent and even illumination, a fixed camera position for multiple viewpoints relative to the specimen, and precise positioning and rotation of the coral samples. The plastic mount rods were used to align the colony in the jig and reproducibly position the specimens. Digital photographs (Olympus Digital Camera Model No. SP-560UZ) were taken of each skeleton from five different perspectives, a “top” view looking down on the skeleton and four side views at 0°, 90°, 180°, and 270° rotation in the jig.
FIG. 1.
Camera jig for capture of coral silhouette: A) digital camera; B) movable camera brace and light assembly; C) primary light emitting diode (LED) lights (4 total); D) secondary LED lights (2 total); E) rotating specimen stage; F) scaling reference grids; G) rotation indexing dial which provides accurate positioning of coral samples for repeatable side view images; H) camera brace lock; I) camera brace positioning between 0° and 90° vertical at 15° increments.
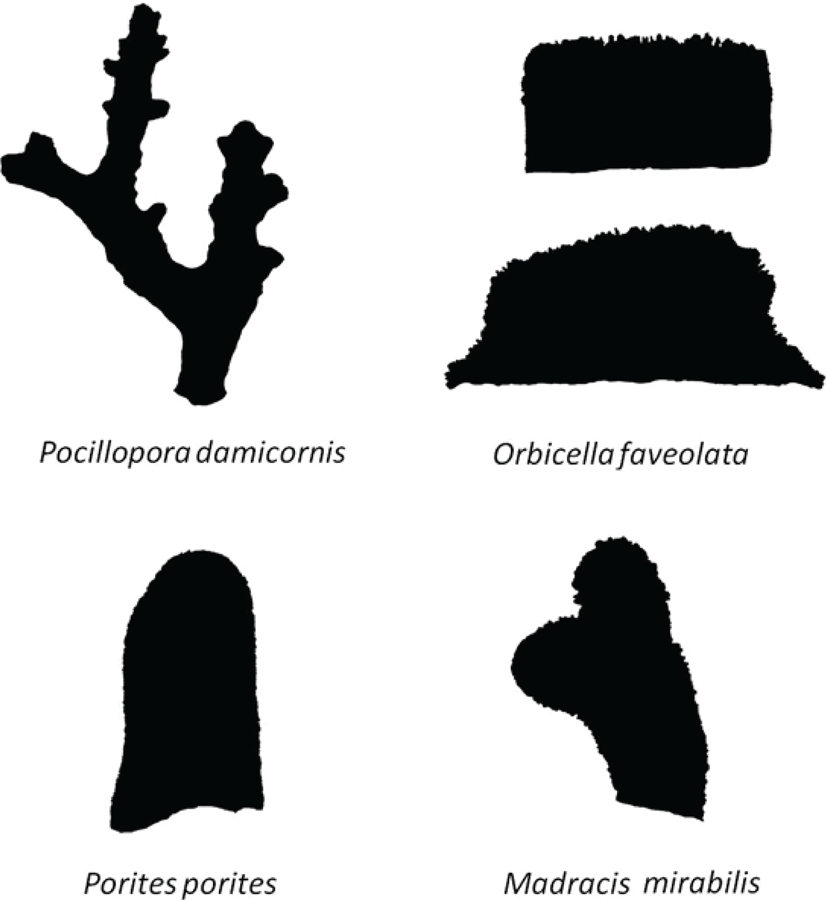
Digital photographs were analyzed in commercially available photographic image processing software (Adobe® Photoshop® CS3 version 10.0, ©1990–2007 Adobe® Systems Inc.). A mask of skeletal area was generated for each photograph (Fig. 2; see Fournie et al., 2012) and exported as grayscale images to produce surface area values (mm2) using ImageJ software (ImageJ 1.38x, Wayne Rasband, National Institutes of Health, USA; http://rsb.info.nih.gov/ij/; public domain). The 25mm clear plastic mounting disks were used as a scaling device to convert pixel numbers to mm2. For comparison with 3D surface areas obtained through laser scanning, the surface areas of each photograph were summed, regardless of how many different views (top and side) were used.
FIG. 2.
Two-dimensional digital masks of example skeletons of the four species used to develop the models, including a cubic and hemispheric shape for O. faveolata (not to scale).
3D Laser Scanning
Laser scanning was used to estimate 3D surface area of the same coral skeletons. The laser scanner (Optix 400S; 3D Digital Corp., Sandy Hook, CT 06482 USA; www.3ddigitalcorp.com) was designed for short range scanning and providing an achievable accuracy of ±0.05 mm at a scan distance of 200 mm. Scanner operation was controlled through RealScan software (Version 5.50.12.15, 3D Digital Corp. ©2008) which also provided control of a rotating table mated through the USB interface. Scan-capture parameters were held constant a 1000 scan lines, 300 point density and 40 threshold. The number of scans (determined by rotation interval of the rotary table; e.g., 12 at 30°; 24 at 15° or 35 at 10°) varied with specimen morphology (i.e., increased complexity = greater number of scans), but most series consisted of 24 scans taken at 15° intervals. A single scan consists of a dataset of x, y, and z coordinates defining points on objects surface; at 1000 lines x 300 points a point density of 300000, therefore a series of 24 scans translates to a 7.2 million 3D point density. Preliminary scans of a range of coral species skeletons determined the number of scans that would be necessary to capture the majority of coral or large areas invisible to the laser beam.
The entire series of scans was processed with SLIM software (3D Digital Corp.) which “cleaned” the raw scans of extraneous data, aligned the scans, and merged the entire series into a single 3D object. Much of the process was automated, however manual registration of scan pairs was sometimes required. The merged 3D object produced by SLIM provided the initial form of the coral colony. This model was further processed in a commercially available 3D-processing software package (Leios 2009.2, Enhanced Geometry Solutions, Italy; www.egsolutions.com) to fill holes resulting from areas invisible to the laser beam, correct any other small imperfections, finalize the surface, and calculate surface area measurements.
Accuracy and Precision
The accuracy of using photographic images was assessed by measuring a 1 cm distance on 12 cm ruler photographed with the same methods used for coral skeletons. Precision of the 2D method was assessed through the repetitive processing (3x) of a series of 61 photographs by a single operator; cross-operator error was also evaluated for 243 photographs. Accuracy of the 3D laser procedure was determined by scanning standardized reference models, five simple and 2 complex blocks. The size range and complexity of the blocks was representative of coral skeletons used in this study. Precision of the laser scanning technique was evaluated using 5 repeated measurements of 10 P. damicornis coral colonies.
Model development
Surface area relationships between 2D masks and 3D laser scans were examined with simple linear regression models using the sum of all four sides for each species separately and for of all species combined. Models were based on the best fit to the generalized linear relationship: 3D SA = aX + b, where X is the 2D SA, a is the slope and b is the intercept. To evaluate potential effects of overlapping images, the same SA relationships were also examined for the top view only and for the sum of the 4 side views and top view. A t-test was used to determine if the slope differed from 1 and the intercept differed from zero in each model. In addition, SA relationships were evaluated for areas summed from progressive inclusion of randomly-selected side views (1 side, 2 sides, etc.). A One-way ANOVA (α = 0.05) was used to detect significant differences in the number of side-view photos used for analysis. All statistical tests were analyzed using Minitab 15© statistical software.
Results
Accuracy and Precision
The photographed ruler distance used for measuring accuracy of the 2D method provided an average of 1.00 cm ±0.000334 cm (n = 25 measurements on 1 cm ruler). Cross-operator error was < 3% for all photographs. Calculated SA values for the standardized reference blocks varied 0.13–1.12 % from actual values. Precision of the laser scanning technique for P. damicornis (n = 50; 5 scans of 10 colonies) was 1.17%.
Model Analysis
Surface areas estimated by the 2D method were significantly related (p<0.001) to 3D estimates for all four species, even with only a single side image (Table 1). However, predictive accuracy (relative to 3D laser-generated surface areas) and precision both increased, with greater r2 and slopes approaching one when additional sides were included in estimates. Increasing the number of side images used reduced the variance for each model (Table 1).
TABLE 1.
Model statistics of linear regressions for 1, 2, 3 or 4 side views for all 165 coral skeletons in the study.
| # Photos summed | Specimen Rotation | Linear Models | p | r2 | MS Σ |
|---|---|---|---|---|---|
| 1 side | 3.34(x) + 203 | <0.001 | 0.90 | 47917 | |
| 2 sides | 0° and 90° | 1.8(x) + 137 | <0.001 | 0.94 | 25751 |
| 2 sides | 0° and 180° | 1.8(x) + 132 | <0.001 | 0.94 | 30143 |
| 2 sides | 0° and 270° | 1.8(x) + 150 | <0.001 | 0.94 | 28083 |
| 3 sides | 0°, 90°, 180° | 1.23(x) + 110 | <0.0001 | 0.96 | 21132 |
| 3 sides | 90°, 180°, 270° | 1.25(x) + 99.2 | <0.001 | 0.96 | 19750 |
| 4 sides | 0°, 90°, 180°, 270° | 0.929(x) + 109 | <0.001 | 0.96 | 18041 |
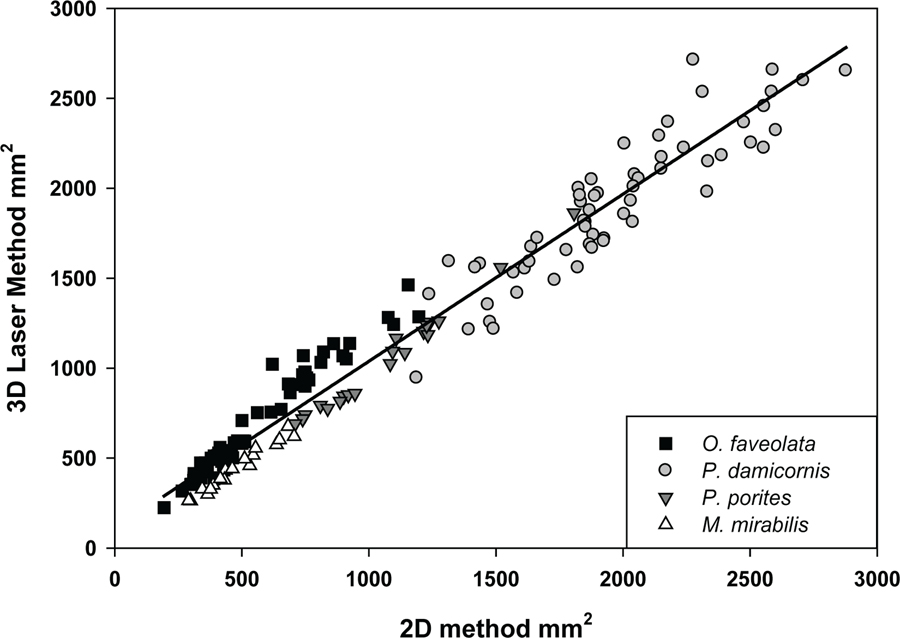
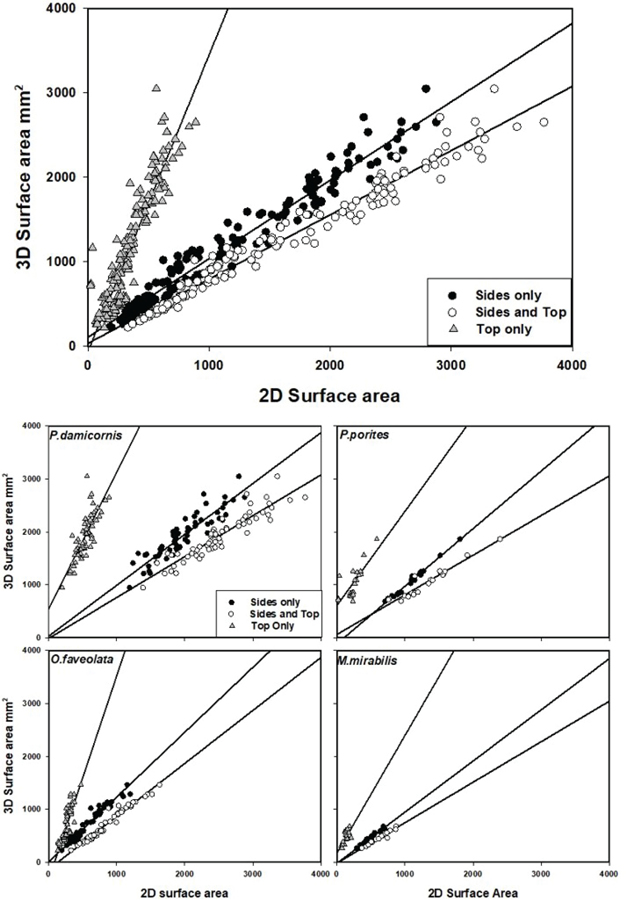
The simple linear regression model generated from all colonies and using the sum of the four side views (no top view) provided the most accurate estimates of 3D surface area, with a slope close to 1 (F=4206.1, p<0.001, r2 =0.963) (Figure 3; Table 2). The slope for the sum of top and side views was <1 for all colonies (0.76), indicating that SA would be overestimated, whereas the slope for the top-only view for all colonies was >1 (3.51), signifying an underestimation of surface area.
FIG. 3.
Relationship between the 3D laser method and the 2D photogrammetry method of the four side views summed for all skeletons and identified by species.
TABLE 2.
Models of the top view only, four side views summed and top and four side views summed using simple linear regression. Information includes results of the regression and T-test used to determine if the slope differed from 1 and the intercept differed from zero.
| Species | Model | Mean SAmm2 (range) | Linear model | df (n-2) | r2 | F | p | MS∑ | Intercept | SE | Intercept T Ratio | p | Slope | SE | Slope T Ratio | p |
|---|---|---|---|---|---|---|---|---|---|---|---|---|---|---|---|---|
| All | Top and Sides | 163 | 0.97 | 5455.21 | <0.001 | 35.7 | 17.72 | 2.015 | 0.0456 | 0.761 | 0.01 | 23.900 | 0.000 | |||
| All | Sides only | 399–1975 | 0.929(x) + 109 | 163 | 0.96 | 4206.09 | <0.001 | 18041 | 109 | 19.2 | 5.677 | 0.0000 | 0.929 | 0.014 | 5.071 | 0.000 |
| All | Top only | 163 | 0.84 | 877.28 | <0.001 | −58.7 | 46.2 | 1.271 | 0.2057 | 3.51 | 0.119 | 21.092 | 0.000 | |||
| P. porites | Top and Sides | 18 | 0.93 | 227.66 | <0.001 | 61.9 | 68.22 | 0.907 | 0.3756 | 0.749 | 0.496 | 0.506 | 0.619 | |||
| P. porites | Sides only | 1051 (690–1862) | 1.09(x) −115 | 18 | 0.99 | 1370.77 | <0.001 | 1260 | −115 | 32.47 | 3.542 | 0.0022 | 1.09 | 0.0294 | 3.061 | 0.006 |
| P. porites | Top only | 18 | 0.59 | 25.52 | <0.001 | 609 | 98.4 | 6.189 | 0.0000 | 1.78 | 0.352 | 2.216 | 0.039 | |||
| P. damicornis | Top and Sides | 58 | 0.86 | 347.01 | <0.001 | −12 | 106.3 | 0.113 | 0.9105 | 0.773 | 0.0415 | 5.470 | 0.000 | |||
| P. damicornis | Sides only | 1930 (946–3049) | 0.962(x) + 30 | 58 | 0.83 | 291.03 | <0.001 | 30445 | 30 | 113.6 | 0.264 | 0.7926 | 0.962 | 0.0564 | 0.674 | 0.503 |
| P. damicornis | Top only | 58 | 0.62 | 96.39 | <0.001 | 542 | 145.4 | 3.728 | 0.0004 | 2.58 | 0.263 | 6.008 | 0.000 | |||
| O. faveolata | Top and Sides | 65 | 0.97 | 1812.02 | <0.001 | −134 | 20.26 | 6.614 | 0.0000 | 1.00 | 0.0235 | 0.000 | 1.000 | |||
| O. faveolata | Sides only | 680 (224–1463) | 1.23(x) + 3.7 | 65 | 0.96 | 1387.17 | <0.001 | 3903 | 3.7 | 19.69 | 0.188 | 0.8515 | 1.23 | 0.03293 | 6.985 | 0.000 |
| O. faveolata | Top only | 65 | 0.72 | 163.17 | <0.001 | −328 | 81.18 | 4.040 | 0.0001 | 3.85 | 0.3014 | 9.456 | 0.000 | |||
| M. mirabilis | Top and Sides | 16 | 0.96 | 362.59 | <0.001 | −17.3 | 25 | 0.692 | 0.4983 | 0.765 | 0.0402 | 5.846 | 0.000 | |||
| M. mirabilis | Sides only | 443 (263–677) | 0.966(x) − 19.7 | 16 | 0.96 | 414.69 | <0.001 | 644 | −19.7 | 23.5 | 0.838 | 0.4135 | 0.966 | 0.0474 | 0.717 | 0.483 |
| M. mirabilis | Top only | 16 | 0.57 | 21.13 | <0.001 | 169 | 62.93 | 2.686 | 0.0156 | 2.22 | 0.484 | 2.521 | 0.022 |
The same patterns held true for individual species. Models using four side views only for P. damicornis, and M. mirabilis tended to produce accurate estimates of true surface area, with slopes close to 1 (0.96) (Table 2). The slope for the P. porites model using four side views was 1.09. The models using the sum of top and side views for these three species (P. damicornis, M. mirabilis, and P. porites) overestimated the SA with slopes ranging from 0.75–0.77 (Table 2). The four side view model for O. faveolata also resulted in a slope near 1 but the sum of top and side views model was slightly more accurate with a slope of 1.0 (Table 2). Models for O. faveolata did not show strong outliers despite using two different shapes, cubic and hemispheric, in the study. Top-view only models underestimated the SA for all species. Smaller, less complex, species (M. mirabilis, P. porites) showed the least variation for models with four side views only. The four side view model of the larger, more complex P. damicornis colonies had the highest variability, but still demonstrated a strong relationship (Table 2).
Discussion
All models revealed strong linear relationships from which estimates of 3D surface area can be defensibly calculated from 2D photogrammetric images. Use of the relationships avoids implementing destructive sampling techniques (i.e. wax and aluminum foil) that eliminate the potential to measure growth and changes in surface area iteratively over the course of an experiment. Scleractinian corals vary in shape and occur in a variety of growth forms on the reef (LaForsch et al., 2008); therefore, a model that incorporates corals exposed to the air for about 20 minutes and causing loss of tissue color (lightening) and sloughing. The digital photography method required less than 1 minute out of water for a coral. Short term air exposure can regularly occur in nature without leaving damage (Romaine et al., 1997)
Pocillopora damicornis was the largest and most complex of the species and exhibited the lowest r2 (0.83) for the four side views model. Orbicella faveolata had the next greatest variance which may have been due to the two different (cubic and hemispheric) shapes represented in the study. We chose two different O. faveolata shapes to increase the variability of morphologies in our model. Chancerelle (2000) and Veal et al. (2010) were both able to produce linear relationships using multiple species and slightly less than 1. Another approach by Bythell et al. (2001) compared foil wrapping with a 3D modeling approach resulting in a slope of 0.82 and r2 = 0.99. Veal et al. (2010b) reported a slope of 0.988 and r2 = 0.993 using four different species to compare the wax procedure and CT scanner. Other examples of these relationships exist (Chancerelle 2000; Hoegh-Guldberg 1988), but all validate destructive techniques. The results here validate the use of simple, non-destructive 2D photogrammetry.
Most of the top views (models with slope >1, or intercept ≥ 0) tended to underestimate the true surface area, whereas the combined top and side views (models with slope < 1, intercept ≥ 0) tended to overestimate. The models using the top view only also had much lower r2 values than the other models. The models using side views only resulted in some of the better fits. As a result, this model was used to examine the number of images needed to produce reliable SA estimates. Results showed that greater accuracy was achieved with additional images, but with decreasing effect on slope and variance (diminishing returns) beyond 2–3 images.
The 3D:2D relationships shown here provide a method for defensibly estimating 3D surface area from simple 2D digital photographs. This is critical for calculating growth rates and changes in the amount of living tissue on stony coral specimens during laboratory experiments. Surface area is also important for normalization of other endpoints used in coral laboratory studies (Edmunds and Gates 2002). The relationships described here provide researchers a tool to measure changes in 3D surface area over time without destroying the coral.
FIG. 4.
Regression models of 3D and 2D surface areas of the top view only (triangle), four side views summed (black circle) and top and four side views summed (white circle) for all skeletons (Top) and identified by species (Bottom).
Acknowledgements.—
We thank Lara Hansen and Leah Oliver of the Gulf Ecology Division for coral collection of Porites porites and Madracia mirabilis (Permit # CRE 01-01). We also thank Lauri MacLaughlin at the Florida Keys National Marine Sanctuary and Debbie Santavy at the Gulf Ecology Division for coral collection of Orbicella faveolata (Permit # FKNMS-2004-001). Special thanks to Satish Mysore of 3D Digital Corp for his help with the laser scanner and software. Additional thanks to Cheryl Hankins, Becky Hemmer for laboratory support and Jack Fournie for his editorial comments on this manuscript. The views expressed in this article are those of the author[s] and do not necessarily reflect the views or policies of the U.S. Environmental Protection Agency.
Literature Cited
- Barron MG, McGill CJ, Courtney LA, and Marcovich DT 2010. Experimental bleaching of a reef-building coral using a simplified recirculating laboratory exposure system. Journal of Marine Biology 2010: 1–8. [Google Scholar]
- Bythell JC, Pan P, and Lee J 2001. Three-dimensional morphometric measurements of reef corals using underwater photogrammetry techniques. Coral Reefs 20:193–199. [Google Scholar]
- Chancerelle Y 2000. Méethodes d’estimation des surfaces développées de coraux scléractiniaires à l’échelle d’une colonie ou d’un peuplement. Oceanologica Acta 23: 211–219. [Google Scholar]
- Courtney LA, Fisher WS, Raimondo S, Oliver LA, and Davis W 2007. Estimating 3-dimensional colony surface area of field corals. Journal of Experimental Marine Biology and Ecology 351:234–242. [Google Scholar]
- Edmunds PJ, and Gates RD 2002. Normalizing physiological data for scleractinian corals. Coral Reefs 21:193–197. [Google Scholar]
- Fournie JW, Vivian DN, Yee SH, Courtney LA, and Barron MG 2012. Comparative sensitivity of six scleractinian corals to temperature and solar radiation. Diseases of Aquatic Organisms 99:85–93. [DOI] [PubMed] [Google Scholar]
- Hoegh-Guldberg O 1988. A method for determining the surface area of corals. Coral Reefs 7:113–116, [Google Scholar]
- Holmes G 2008. Estimating three-dimensional surface area on coral reefs. Journal of Experimental Marine Biology and Ecology 365:67–73. [Google Scholar]
- Holmes G, Ortiz J, Kaniewska P, and Johnstone R 2008. Using three-dimensional surface area to compare growth of two Pocilloporid coral species. Marine Biology 155:421–427. [Google Scholar]
- LaForsch C, Christoph E, Glaser C, Naumann M, Wild C, and Niggl W 2008. A precise and non-destructive method to calculate the surface area in living sceleractinian corals using X-ray computed tomography and 3D modeling. Coral Reefs 27:811–820. [Google Scholar]
- Niem W 1994. Automatic reconstruction of 3-D objects using a mobile camera. Image and Vision Computing 17:125–134. [Google Scholar]
- Raz-Bahat M, Faibish H, Mass T, and Rinkevich B 2009. Three-dimensional laser scanning as an efficient tool for coral surface area measurements. Limnology and Oceanography Methods 7: 657–663. [Google Scholar]
- Romaine S, Tambutte E, Allemand D, and Gattuso JP 1997. Photosynthesis, respiration and calcification of a zooxanthallate scleractinian coral under submerged and exposed conditions. Marine Biology 129:175–182. [Google Scholar]
- Veal CJ, Homes G, Nunez M, Hoegh-Guldberg O, and Osborn J 2010a. A comparative study of methods for surface areas and three dimensional shape measurement of coral skeletons. Limnology and Oceanography Methods 8:241–253. [Google Scholar]
- Veal CJ, Carmi M, Fine M, and Hoegh-Guldberg O 2010b. Increasing the accuracy of surface area estimation using single wax dipping of coral fragments. Coral Reefs 29: 893–897. [Google Scholar]


