

Abstract
Here, a three-channel absorbance sensor array based on the nanocurcumin–metal ion (NCur–MI) aggregates is designed for the detection and identification of deoxyribonucleic acid nucleobases (DNA NBs) for the first time. For this purpose, the binding affinities of some of MIs (i.e., Co2+, Cr3+, Cu2+, Fe2+, Fe3+, Hg2+, Mn2+, Ni2+, V3+, and Zn2+) to the NCur to induce the aggregation were evaluated under various experimental conditions. Further studies reveal that in the presence of DNA NBs, the aggregates of NCur–Co2+, NCur–Ni2+, and NCur–Zn2+ show the diverse absorbance responses to the deaggregation of NCur depending on the binding affinity of each of DNA NBs to the metal ions Co2+, Ni2+, and Zn2+. These responses are distinguishable from one another. Thus, clear differentiation among the DNA NBs is achieved by linear discriminant analysis and hierarchical clustering analysis to generate clustering maps. The discriminatory capacity of the sensor array for the identification of the DNA NBs is tested in the ranges of 2.4–16 and 5.6–10.4 μM. Furthermore, a mixed set of the DNA NBs was prepared for multivariate multicomponent analysis. Finally, the practicability of the sensor array is confirmed by the discrimination of the DNA NBs in an animal DNA sample. It should be noted that the proposed array is the first example to fabricate an NCur-based sensor array for the simultaneous detection of DNA NBs.
1. Introduction
Nowadays, biological sensors as a novel technology offer many advantages such as simple, suitable cost and adequate time for wide range of applications. The biological sensors determine vital parameters related to diagnostics, environmental monitoring, and health. One of the most importance problems in development of a biological sensor is its capability for the simultaneous detection of chemical targets. Recently, sensor array-based detection systems, which are examples of highly low-cost analytical systems, have been successfully used for the determination and discrimination of a wide range of chemical targets such as biological compounds,1−5 heavy metals,6−9 food,10 and pesticides.11
Generally, a sensor array, similar to the mammalian olfactory and gustatory system, uses cross-reactive receptor elements (REs) to create of unique patterns (i.e., fingerprints) for each target. Thus, unlike with a “lock–key system”, the cross-reactive REs involve receptors with the lower selectivity. Each RE shows the various affinity degrees toward targets. As a result, this leads to produce the non-specific interaction profiles for targets. Finally, the matrix of data obtained is analyzed by the linear discriminant analysis (LDA) and hierarchical clustering analysis (HCA).12−15 The HCA is an unsupervised approach for the grouping of target vectors according to their spatial distances in their full original vector space. The HCA is performed by the minimum variance (Ward’s) method.16 LDA is a supervised pattern recognition method for recognizing the linear combination of features that differentiate two or more classes of object. In array-based sensors, the LDA is used to differentiate quantitatively the response patterns of targets.17
The choice of a suitable number of the cross-reactive REs also is an important parameter for transfer of desired information. If the number of cross-reactive REs is very high, over-fitting phenomenon causes. This phenomenon removes the prediction ability of sensor array for unknown samples. In addition, if the number of cross-reactive REs be insufficient, the capability of sensor array to discriminate of targets decreases.18
The DNA containing purine and pyrimidine bases is well known as two of the constructing blocks of DNA. They are the indispensable units of the cell programming machinery. There is a great interest in development of high-efficiency biosensors for the monitoring of DNA nucleobases (NBs) (i.e., adenine, guanine, cytosine, and thymine). This is mainly due to vital roles of the DNA NBs in the different life process in human.19 The abnormal changes in the DNA NBs content show mutation of the immunity system that may be responsible for different diseases. Typically, the average concentration of DNA NBs and other extracellular fluids are in the range of 0.4–6 μM.20−23 The concentration of DNA NBs can serve as a key index for the detection of cancer, AIDS, and disease growth.24,25 Methods currently available for detecting DNA NBs mainly include electrochemical, surface-enhanced Raman scattering, and colorimetric methods.26−36
For example, Ng et al. reported an Au-rGO/MWCNT/graphite-based array sensor for the determination of DNA NBs by square wave voltammetry.29 Lavanya et al. developed an electrochemical method based on Cu-doped CeO2 nanoparticle-modified glassy carbon electrode (Cu–CeO2/GCE) for the determination of DNA NBs.31 Our team used the electrocatalytic oxidation of DNA NBs on a glassy carbon electrode modified with SiC nanoparticles (SiCNP/GC) for the determination of DNA NBs.33 However, these methods often require sample preparation and complex instrumentation. As a result, there is an urgent need for low-cost, sensitive, and selective methods for the determination of DNA NBs. To access a rapid and reliable method, an essential idea can be using of sensor array-based sensing platforms. Liu et al. reported the first sensor array based on self-assembly of mercaptoethylamine, N-acetyl-l-cysteine, 2-dimethyl-aminethanethiol, and thioglycolic acid-quantum dots for the identification of DNA NBs.37
Curcumin or diferuloylmethane is the main compound extracted from the root of turmeric. The curcumin exhibits antioxidant, antineoplastic, and antimicrobial properties. In addition, the curcumin shows neuroprotective and anticancer activities.38,39 Nevertheless, the curcumin suffers from the low water solubility and poor bioavailability.40 Nanoionization of the curcumin [nanocurcumin (NCur)] is one of procedures that can help to solve this problem.41−43 Recently, the photophysical properties of the NCur as a sensing probe in optical sensors have received notable attention in chemistry of various fields.44−46
Herein, we explore the nanocurcumin–metal ion (NCur–MIs) aggregates to fabricate an absorbance sensor array for the detection and discrimination of the DNA NBs. The MIs including Co2+, Cr3+, Cu2+, Fe2+, Fe3+, Hg2+, Mn2+, Ni2+, V3+, and Zn2+ are selected to induce of the aggregation NCur. It was found that in the presence of DNA NBs, the deaggregation NCur with various degrees is observed for the NCur–Co2+, NCur–Ni2+, and NCur–Zn2+ aggregates. As a result of the deaggregation NCur, the absorbance profiles produce a unique spectral pattern for each of the DNA NBs. Moreover, we employed the proposed array for the identification of the DNA NBs in an animal DNA sample. According to our best knowledge, the proposed array is the first example to fabricate an NCur-based sensor array for the simultaneous detection of DNA NBs.
2. Results and Discussion
2.1. Characterization of the NCur
The photophysical properties and morphology of the NCur are investigated by the ultraviolet–visible (UV–vis) absorption, transmission electron microscopy (TEM), and Fourier-transform infrared (FT-IR), as shown in Figure S1. The NCur displays a characteristic UV–vis absorption band centered at 429 nm, and its color is yellow, as shown in Figure S1I. The TEM image in Figure S1II shows that the NCur is well dispersed in the aqueous solution. Thus, the NCur can be used as a nanoprobe for the identification of DNA NBs. Another evidence for the successful synthesis of the NCur is FT-IR analysis. Figure S1III shows the vibrational spectra of the curcumin and the NCur. The peaks of curcumin at 3200–3500 cm–1, 1628 cm, 1515 cm–1, 1284 cm–1, and 1160 cm–1 in Figure S1III(a) are attributed to the phenolic OH stretching, C=O group, C=C vibrations, aromatic C–O, and C–O–C stretching, respectively. Figure S1III(b) shows the FT-IR spectrum of the NCur. As can be seen, the NCur shows the similar vibrational frequencies to the curcumin. This result confirms in which the NCur is successfully synthesized.
2.2. Scheme of the Sensor Array
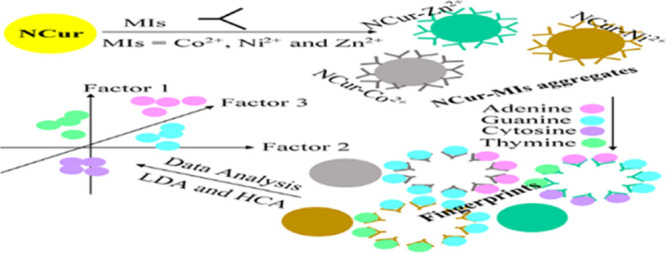
The MI-induced aggregation of the NCur for formation of chemosensing aggregates by chemical interaction mechanisms has been described in several reports.47−50 On the other hand, over the past few decades, the interaction of DNA NBs with MIs (especially transition MIs) has attracted considerable interest because of their biological importance and clinical implications.51−54 Therefore, based on the competing interaction of MIs with the NCur and the DNA NBs, a multichannel sensor array can be constructed by an appropriate number of NCur–MI aggregates by displaying the absorbance changes of the NCur. As a result of the different structures of DNA NBs, the binding affinities of MIs toward the DNA NBs (typically Co2+, Ni2+, and Zn2+) can be differentiated from the competition with the NCur. Subsequently, the absorbance changes of the sensor array can be recorded to produce fingerprints for each of the DNA NBs. Then, the fingerprint maps are analyzed by the LDA and HCA. This sensing strategy of the sensor array can be displayed in Scheme 1. It should be noted that the sensing strategy used in this work is very simple in the process fabrication, and there is no need for complex synthesis steps.
Scheme 1. Design of the Fabricated Sensor Array Using the NCur–MI Aggregates for the Detection and Identification of DNA NBs.

2.3. Steps of Fabrication of the Sensor Array
2.3.1. Stability of the NCur
Previous studies have shown that the curcumin at the basic solutions is decomposed to other components such as vanillin, ferulic acid, and feruloyl methane by hydrolytic degradation.55 Therefore, the effect of the pH solution and buffer composition was examined on the stability of the NCur. Figure S2 shows the absorbance spectra and photographs of the NCur in the different pHs/buffers. The results revealed that in the phosphate buffers (PHBs, pH 11 and 12) and the ammonium buffer (AMB, pH 10), the NCur is fully faded and the color solution changes to colorless. In general, the maximum stability of the NCur is in the range of pH 2–8. The tris buffer (TRB, pH 9) also is an appropriate buffer for further experimental studies on the NCur at the basic solutions. Therefore, the PHBs (pH 2–10), acetate buffers (ACBs, pH 4–6), tris buffers (TRBs, pH 7–9), and ammonium buffers (AMBs, pH 8 and 9) were selected for further experiments.
2.3.2. Formation of the NCur–MI Aggregates
In the next step of designing the sensor array, the absorbance responses of the NCur to some of MIs (i.e., Co2+, Cr3+, Cu2+, Fe2+, Fe3+, Hg2+, Mn2+, Ni2+, V3+, and Zn2+) in the selected pHs/buffers were recorded, as shown in Figure S3. The results revealed that in the presence of MIs, the absorbance intensity of the NCur was decreased in different degrees with introduction of most of these MIs because of the aggregation of the NCur. As can be seen, in the range of pH 2–7, the MIs show the lowest binding affinity toward the NCur. The lowest and highest binding affinity toward the NCur is related to the ions Cr3+ (or V3+) and Hg2+, respectively. Moreover, the addition of the Co2+, Cr3+, Cu2+, Mn2+, Ni2+, V3+, and Zn2+ to the NCur solution in the PHB (pH 10) causes that the spectrum of the NCur inclines toward its spectrum in the lower basic solutions. This is probably because of the precipitation of MIs and resulting in the decrease of the pH solution. Therefore, considering the absorbance of responding extents, eight MIs under specific conditions [i.e., the Co2+ in TRB (pH 8), the Cu2+ in TRB (pH 9), the Fe2+ in PHB (pH 8), the Fe3+ in TRB (pH 7), the Hg2+ in TRB (pH 8), the Mn2+ in AMB (pH 9), the Ni2+ in TRB (pH 9), and the Zn2+ in AMB (pH 8)] were selected as primary candidates for the fabrication of the NCur–MI aggregates. The results are presented in Figure S3. From the results shown in Figure S3, about 44 μM Co2+, 40 μM Cu2+, 44 μM Fe2+, 44 μM Fe3+, 24 μM Hg2+, 48 μM Mn2+, 44 μM Ni2+, and 44 μM Zn2+ μM during times of 11, 10, 11, 11, 6, 12, 11, and 11 min were observed to achieve the maximum aggregation of the NCur, respectively.
2.4. Sensor Array Responses to DNA NBs
The results revealed that in the presence of DNA NBs from among the primary candidates, the three of NCur–Co2+, NCur–Ni2+, and NCur–Zn2+ aggregates can produce different deaggregation responses. Thus, a three-channel sensor array was fabricated in this work. To better determine the sensing conditions, the effect of the incubation time was also explored. Figure S4 indicates that the maximum peak intensity of the NCur stabilizes after 100 min of the incubation of the DNA NBs with Co2+, Ni2+, and Zn2+, respectively. The DNA NBs were exposed to the three of NCur–Co2+, NCur–Ni2+, and NCur–Zn2+ aggregates in the range of 0.8–10.4 μM. Then, the absorbance responses were measured, as shown in Figure 1I–III. As can be observed, the adenine and guanine can induce the deaggregation of the NCur for the NCur–Co2+ aggregate. However, in the presence of cytosine and thymine, the insignificant spectral changes occur, as shown in Figure 1I. This confirms that the adenine and guanine show the more binding affinity for the Co2+ compared to the NCur. However, the situation is opposite for the cytosine and thymine. For the NCur–Ni2+ aggregate, no significant deaggregation was seen with the addition of the adenine or cytosine, as shown in Figure 1II. Nonetheless, in the presence of guanine and thymine, the deaggregation of the NCur occurs. The behavior of the NCur–Zn2+ aggregate is somewhat different compared to the NCur–Co2+ or NCur–Ni2+ aggregate, as shown in Figure 1III. The adenine, cytosine, and thymine can induce the deaggregation of the NCur. The weaker complexation of Zn2+ with the NCur compared to the Co2+ or Ni2+ leads to the more selectivity of the DNA NBs for Zn2+.39 All these results suggest that the sensor array can produce the unique absorbance profiles (i.e., fingerprints) to each of the DNA NBs. These fingerprints can be used for the identification of DNA NBs. Furthermore, the colorimetric responses of the sensor array to DNA NBs are shown in Figure 2A. Also, a color difference map is provided to qualitatively visualize the colorimetric patterns of the sensor array, as shown in Figure 2B. As can be seen from Figure 2A,B, the DNA NBs exhibit different colorimetric patterns. These colorimetric patterns demonstrate the ability of the sensor array to discriminate the DNA NBs.
Figure 1.

UV–vis spectra of DNA NB-induced deaggregation of NCur by NCur–Co2+ aggregate (I): (A) adenine, (B) guanine, (C) cytosine, and (D) thymine; NCur–Ni2+ aggregate (II): (A) adenine, (B) guanine, (C) cytosine, and (D) thymine; NCur–Zn2+ aggregate (III): (A) adenine, (B) guanine, (C) cytosine, and (D) thymine. The UV–vis spectra of NCur–Co2+, Ni2+, and Zn2+ aggregates is defined as the spectrum of blank.
Figure 2.

(A) Color change patterns of the solutions using three of the NCur–Co2+, NCur–Ni2+, and NCur–Zn2+ aggregates as REs for DNA NBs at 5.6 μM. (B) Color map corresponding to (A).
The determination of binding sites the ions of Co2+, Ni2+, and Zn2+ to the DNA NBs theoretically and empirically have been investigated in several studies.56−62 Based on our observations and accordingly previous studies, the probable mechanism in our array can be illustrated in Scheme 2. The ions of Co2+, Ni2+, and Zn2+ bind to the NCur via the acetylacetone functional group. This results in the aggregation of the NCur. The stronger binding of ions of the Co2+, Ni2+, and Zn2+ to the DNA NBs (i.e., the Co2+ to adenine and guanine, the Ni2+ to guanine and thymine to and the adenine, and Zn2+ to cytosine and thymine) leads to release of them from the NCur. Thus, the deaggregation of the NCur occurs depending on the binding affinity of each the DNA NBs for the aforesaid ions. To end, it is necessary to point out that there is not significant interaction among the DNA NBs and the NCur in the range of worked concentrations.
Scheme 2. Probable Mechanism in the Proposed Array for the Detection and Identification of DNA NBs.

2.5. Analysis of TEM Images
It is obviously revealed that the NCur solution is well dispersed, as shown in Figure S1II. Next, the morphology changes of the NCur–Co2+, NCur–Ni2+, and NCur–Zn2+ aggregates were surveyed in the absence and presence of the DNA NBs, as shown in Figure 3. In the presence of Co2+, Ni2+, and Zn2+, without the DNA NBs, the NCur is irregularly shaped to different degrees. This is mainly due to the differential interactions of Co2+, Ni2+, and Zn2+ with the NCur, the value of pH solution, and the buffer composition. The Zn2+ has the minimum capability to the absorbance quenching of the NCur, followed by the Ni2+ and Co2+, as shown in Figure 3I,VI,XI. In the presence of DNA NBs, the diverse extents of the deaggregation NCur can be seen depending on the binding affinity of each of the DNA NBs toward ions of the Co2+, Ni2+, and Zn2+. Figure 3II–V shows the TEM images of the NCur–Zn2+ aggregate in the presence of DNA NBs. These observations suggest the substitution of Zn2+ from the surface NCur. Resulting, the deaggregation of NCur occurs. About the NCur–Ni2+ and NCur–Co2+aggregates, the selectivity of DNA NBs to induce the deaggregation of NCur is further clear. This indicates that the binding affinity of the NCur toward the Ni2+ and Co2+ is comparable with the DNA NBs. For example, in the presence of guanine and thymine, the NCur–Ni2+ aggregate indicates the maximum selectivity to induce the deaggregation of NCur, as shown in Figure 3VIII,X. However, for the NCur–Co2+ aggregate, the cytosine and thymine indicate the minimum selectivity to induce of the deaggregation NCur, Figure 3XIV,XV. Similarity, for the Ni2+–NCur aggregate, in the presence of the adenine and cytosine, the aggregation NCur almost is constant, as shown in Figure 3VII,IX. For the NCur–Co2+ aggregate, in the presence of adenine and guanine, the deaggregation of NCur occurs, as shown in Figure 3XII,XIII.
Figure 3.

TEM images of the NCur–Zn2+ aggregate (I) in the presence of adenine (II), guanine (III), cytosine (IV), and thymine (V); the NCur–Ni2+ aggregate (VI) in the presence of adenine (VII), guanine (VIII), cytosine (IX), and thymine (X); and the NCu–Co2+aggregate (XI) in the presence of adenine (XII), guanine (XIII), cytosine (XIV), and thymine (XV).
2.6. DNA NB Discrimination by LDA and HCA
The LDA and HCA analyses were employed for quantitative evaluation of the absorbance responses of the sensor array. Considering the spectral regions having the most spectral changes, 14 variables in the range of 352–612 with 20 nm intervals (i.e., 352, 372, 392, 412, 432, 452, 472, 492, 512, 532, 552, 572, 592, and 612 nm) were selected. Then, the differences between the absorbance values of the NCur in the absence and presence of the DNA NBs, ΔA, were defined as the analytical signals. Consequently, vectors with size 14 variables × 3 REs were organized according to ΔA values for further analyses. Because of the large number of absorbance responses and probably overlapping of them, all the concentration range were divided into two ranges of 2.4–4.8 (3 REs × 4 DNA NBs × 4 concentrations × 3 replicates) and 5.6–10.4 μM (3 REs × 4 DNA NBs × 7 concentrations × 3 replicates). Then, the LDA and HCA were employed for the identification of DNA NBs. The results revealed that the DNA NBs can be accurately discriminated in both the concentration ranges, as shown in Figures 4 and 5. For the range of 2.4–4.8 μM, the contribution variances of first/second factors and first/third factors are 98.9% (94 + 4.9%) and 95.2% (94 + 1.2%) and for the range of 5.6–10.4 μM, they are 95% (83.6 + 11.4%) to 88.6% (83.6 + 5%), respectively. Based on the HCA dendrograms also, the DNA NBs were effectively classified against one another (in triplicate). The absorbance responses [explained by the Euclidean distances (EDs)] are plotted as a function of the concentration for both the concentration ranges, Figure 6. As can be seen, the EDs values increase as a result of the increases concentration of the DNA NBs from 2.4 to 4.8 and 5.6 to 10.4 μM. Subsequently, the limits of detections (LODs) were calculated using the well-known equation 3Sb/m, Table 1. Accordingly, the LODs of 0.51, 0.41, 0.81, and 0.59 μM were obtained for the adenine, guanine, cytosine, and thymine, respectively. These results confirm that the sensor array can be used not only for the identification but also for the quantification of the DNA NBs.
Figure 4.

Illustrated results of LDA and HCA in the range of 2.4–4.8 μM of DNA NBs.
Figure 5.

Illustrated results of LDA and HCA in the range of 5.6–10.4 μM of DNA NBs.
Figure 6.

Values of EDs vs different concentrations of DNA NBs in the ranges of 2.4–4.8 μM (I) and 5.6–10.4 μM (II) for (A) adenine, (B) guanine, (C) cytosine, and (D) thymine (n = 3).
Table 1. Parameters of Linear Calibration Equations for Concentration Ranges of 2.4–4.8 of DNA NBs.
| parameter | adenine | guanine | cytosine | thymine |
|---|---|---|---|---|
| number of sample (n) | 4 | 4 | 4 | 4 |
| linear range (μM) | 2.4–4.8 | 2.4–4.8 | 2.4–4.8 | 2.4–4.8 |
| detection limit (μM) | 0.51 | 0.41 | 0.81 | 0.59 |
The analytical performance of the sensor array was compared with some of previously electrochemical methods employed for the determination of DNA NBs. The details are presented in Table 2. This comparison shows the ability of sensor array to accomplish the determination of DNA NBs within a single test. As can be seen, the sensitivity of the proposed array is comparable with reported electrochemical methods. It is worthwhile to note that the most obvious feature of our array is its cost-effectiveness.
Table 2. Comparison of the Performance of Some of Pervious Methods and the Current Study for the Sensing of DNA NBs.
| method | DNA NBs | LOD (μM) | linear range (μM) | refs |
|---|---|---|---|---|
| electrochemical | adenine | 0.05 | 0.125–200 | Qin et al., 201327 |
| guanine | 0.07 | 0.125–175 | ||
| cytosine | 0.5 | 2.5–650 | ||
| thymine | 1.2 | 2.5–650 | ||
| electrochemical | adenine | 0.02 | 0.06–100 | Gao et al., 201428 |
| guanine | 0.01 | 0.04–100 | ||
| electrochemical | adenine | 3.7 | 3–170 | Ng et al., 201729 |
| guanine | 3.3 | 3–190 | ||
| cytosine | 9 | 9–900 | ||
| thymine | 7.9 | 7.5–800 | ||
| electrochemical | adenine | 5.66 | 10–120 | Yari et al., 201630 |
| guanine | 1.47 | 8–130 | ||
| electrochemical | adenine | 0.021 | 0.1–500 | Lavanya et al., 201831 |
| guanine | 0.031 | 1–650 | ||
| cytosine | 0.038 | 1–250 | ||
| thymine | 0.024 | 1–300 | ||
| sensor array | adenine | 0.51 | 2.4–10.4 | this study |
| guanine | 0.41 | 2.4–10.4 | ||
| cytosine | 0.81 | 2.4–10.4 | ||
| thymine | 0.59 | 2.4–10.4 |
2.7. Discrimination of DNA NB Mixtures
The discrimination of DNA NBs mixture has specific importance because of their quantitative amounts reflect diagnostic criteria for different diseases. The absorbance responses of the sensor array were measured for two binary mixtures (i.e., adenine/thymine and guanine/thymine), two ternary mixtures (i.e. adenine/guanine/cytosine and adenine/guanine/thymine), and a quadruple mixture of DNA NBs. The concentration of all of the DNA NBs was 5 μM. It was observed that the absorbance responses of DNA NB mixture are different than pure forms of them, as shown in Figure S5. The results of LDA and HCA show that all mixtures as well as two pure forms of the guanine and cytosine are well resolved, as shown in Figure S6.
2.8. Study of Selectivity
To evaluate the performance of the sensor array, its absorbance responses to a variety of interfering substances were measured. It was found that the NO3–, Cl–, K+, Na+, Ca2+, and Mg2+ at a concentration of 10 μM did not interfere in the identification of the DNA NBs, Figure S7I. As can be observed, the DNA NBs and these substances are clustered to two separated groups. However, it is clear that some of biological compounds and MIs may cause the sensor array’s spectral changes. The effects of arginine, ascorbic acid, cysteine, dopamine, and glucose (all a concentration 10 μM) and Cd2+, Cu2+, Fe3+, Mn2+, and Pb2+ (all a concentration 10 μM) also were investigated. The results revealed that although these biological compounds and MIs can cause the absorbance responses, they are obviously resolved from the DNA NBs, Figure S7II,III. The HCA dendrograms are presented in Figure S8. They suggest that the sensor array can effectively discriminate the DNA NBs in the presence of other interference substances.
2.9. Analysis of an Animal DNA Sample
Eventually, the applicability of the sensor array for the identification of DNA NBs was assessed in a rat DNA sample. Figure 7 indicates that the rat DNA sample produces a specific array’s pattern, whereas four NBs-spiked DNA samples were grouped into four different clusters. The first two factors consisted the 96.8 and 2.2% of the total variance 99%, respectively. These results show that the sensor array had potential to distinguish the DNA NBs in real samples.
Figure 7.

Illustrated results of LDA and HCA for the rat DNA sample and DNA NB-spiked rat DNA samples.
3. Conclusions
The three of NCur–Co2+, NCur–Ni2+, and NCur–Zn2+ aggregates were used as REs in the development a sensor array for the identification and discrimination of DNA NBs for the first time. Depending on experimental conditions, the MIs (i.e., Co2+, Cr3+, Cu2+, Fe2+, Fe3+, Hg2+, Mn2+, Ni2+, V3+, and Zn2+) can induce the aggregation of NCur. Further studies revealed that in the presence the DNA NBs, the three of NCur–Co2+, NCur–Ni2+, and NCur–Zn2+ aggregates show the different deaggregation responses of the NCur. These responses can produce a fingerprint pattern for each of the DNA NBs, and it allows the discrimination of the DNA NBs and their mixtures. Finally, it was found that the sensor array can detect the DNA NBs in an animal real sample. We believed that the sensor array presents a novel approach for the development of highly selective arrays for biological applications.
4. Experimental Section
4.1. Materials
Curcumin (≥92.5%), dichloromethane (CH2Cl2 ≥ 98%), Triton-X 100 (5%), adenine (≥99%, HPLC), guanine (≥99%, HPLC), cytosine (≥99%, HPLC), and thymine (≥97%, UV) were purchased from Sigma-Aldrich Co (www.sigmaaldrich.com). NaH2PO4·2H2O, CH3COONa·3H2O, H2NC(CH2OH)3, NH4Cl, HCl, NaOH, Co(NO3)2·6H2O, Cr(NO3)3·9H2O, Cu(NO3)2·3H2O, FeSO4·7H2O, Fe(NO3)3·9H2O, Hg(NO3)2, Mn(NO3)2·6H2O, Ni(NO3)2·6H2O, Zn(NO3)2·6H2O, Cd(NO3)2·4H2O, Pb(NO3)2, KCl, NaCl, NaNO3, arginine, ascorbic acid, cysteine, dopamine, and glucose were purchased from Merck Co. (Darmstadt, Germany, www.merck.com). All solutions were prepared using doubly deionized water. The PHBs in the range of pH 2–12, the ACBs in the range of pH 4–6, the TRBs in the range of pH 7–9, and the AMBs in the range of pH 8–10 were prepared by the addition either concentrated HCl or NaOH solutions to the 10 mM of NaH2PO4·2H2O, CH3COONa·3H2O, H2NC(CH2OH)3 and NH4Cl, respectively.
4.2. Equipment and Software
An ultrasound bath (230/240V-50 Hz-30 W, Italy) was utilized for the synthesis of the NCur solution. A rotary evaporator (Heidolph, Germany) was used for solvent elimination. The pH values were recorded using a Metrohm 713 model pH-meter. The UV–vis absorbance spectra were recorded on an Analytik Jena Specord 210 spectrophotometer (Germany, www.analytik-jena.com). TEM images were provided by an EM10 at an acceleration voltage of 80 kV (Zeiss). The vibrational spectra of the curcumin and the NCur were taken on a Vector 22 BRUKER spectrophotometer (Germany). The photographs were taken using an ASUS ZC521TL ZenFone 3S smartphone. Color difference map was provided by subtracting the digital red, green, and blue values of “after-exposure” and “before-exposure” images of the sensor array using Adobe Photoshop. The LDA and HCA analyses were performed in SPSS (version 24).
4.3. Synthesis of the NCur
The curcumin solution was prepared by dissolving the 125 mg curcumin in the 25 mL CH2Cl2. Then, aqueous solution was prepared by the addition of the 10 mL of Triton X-100 (5%) to 90 mL of boiling water (T = 70–80 °C). The procedure is continued by the addition of the 2 mL of curcumin solution to the aqueous solution (almost 10 droplets in min) under ultrasonic conditions. The sonication was continued for t = 20 min. The obtained content was stirred at 1500 rpm under a magnetic stirrer for t = 20 min at T = 25 ± 1 °C until a yellow color was observed. To end, a rotary evaporator was used for the elimination of CH2Cl2. The NCur solution was stored in a brown bottle. The total concentration of the NCur solution was estimated 0.27 mM.
4.4. MI-Induced Aggregation of the NCur
The MI-induced aggregation of the NCur by Co2+, Cr3+, Cu2+, Fe2+, Fe3+, Hg2+, Mn2+, Ni2+, V3+, and Zn2+ was screened in the PHBs (10 mM, pH 2–10), ACBs (10 mM, pH 4–6), TRBs (10 mM, pH 7–9), and AMBs (10 mM, pH 8–9) as the following: the 30 μL of the NCur solution was added to 0.5 mL of the as-prepared buffers. Then, the 1 μL volumes of MIs (Co2+, Cr3+, Cu2+, Fe2+, Fe3+, Hg2+, Mn2+, Ni2+, V3+, and Zn2+) with different concentrations were added to each of the NCur solution. In each pH, the absorption spectra were measured after standing for 1 min in the range of 325–650 nm. In each pH, the addition of the MI is continued until that the constant aggregation was achieved.
4.5. Assay Procedure
The fabrication of the sensor array was carried out as the following: the 0.5 mL of TRB (10 mM, pH 8) containing the 44 μM of Co2+, the 0.5 mL of TRB (10 mM, pH 9) containing the 44 μM Ni2+, and the 0.5 mL of AMB (10 mM, pH 8) containing the 44 μM of Zn2+ were separately incubated with the different concentrations of DNA NBs (0.8–10.4 μM) for t = 100 min. In each solution, the absorption spectra were measured in the presence of 30 μL of NCur solution for t = 12 min before the detection procedure. The selectivity of the sensor array was studied by addition of various interfering substances. All the measurements were performed in triplicates. Finally, the LDA and HCA were employed for the purposes of the detection and identification of the DNA NBs.
4.6. Acid Hydrolysis and DNA Identification in an Animal DNA Sample
For real sample analysis, an animal DNA sample from brain tissues of male Wistar rat was used for the identification of DNA NBs. For this purpose, the DNA sample is provided by Dr. S. Ahmadi Animal Physiology Laboratory in Department of Biological Science, University of Kurdistan, Sanandaj, Iran. Briefly, rat was decapitated and the whole brain rapidly was removed from the skull and prefrontal cortex. The isolated brain tissue was instantly incubated with RNAlater RNA stabilization agent at 4 °C. After a period of 24 h, the RNAlater solution was aspirated and the tissue was kept at −80 °C. The RNeasy Mini Kit was employed for the total RNA extraction. Quality of the extracted RNA is determined by electrophoresis. Finally, reverse transcription of the total RNA is performed by Thermo Scientific RevertAid first strand cDNA synthesis kit.63 For acid hydrolysis, the DNA sample was incubated with 5 mL of H2SO4 (8 M) in a glassy tube. The solution was sonicated at 150 °C for 2 h, followed by neutralization with 10 mL of NaOH solution (8 M). After cooling to room temperature, the absorbance responses of the sensor array to acid hydrolyzed-spiked DNA samples (all DNA NBs at 3 μM), as described in the Section 4.5, were recorded. Subsequently, these responses were analyzed by the LDA and HCA.
Acknowledgments
The authors are grateful for the financial support of the University of Kurdistan for this study. We appreciate from Dr. S. Ahmadi for providing rat DNA sample. We also appreciate from Dr. H. Golmohammadi for help discussion.
Supporting Information Available
The Supporting Information is available free of charge at https://pubs.acs.org/doi/10.1021/acsomega.0c00593.
UV–vis spectrum of the NCur, (II) the TEM image of the NCur, and (III) the FT-IR spectrum of the curcumin (a) and NCur (b); UV–vis spectra and photographs of NCur solution; UV–vis spectra of MI-induced aggregation of NCur; effect of incubation time on determination of each of the DNA NBs; UV–vis spectra of DNA NB mixture-induced deaggregation of NCur; illustrated results of LDA and HCA for the different mixtures of DNA NBs; illustrated results of LDA for the discrimination of DNA NBs in the presence of various interfering compounds; and illustrated results of HCA for the discrimination of DNA NBs (PDF)
The authors declare no competing financial interest.
Supplementary Material
References
- Zopf D.; Pittner A.; Dathe A.; Grosse N.; Csáki A.; Arstila K.; Toppari J. J.; Schott W.; Dontsov D.; Uhlrich G.; Fritzsche W.; Stranik O. Plasmonic nanosensor array for multiplexed DNA-based pathogen detection. ACS Sens. 2019, 4, 335–343. 10.1021/acssensors.8b01073. [DOI] [PubMed] [Google Scholar]
- Xi H.; He W.; Liu Q.; Chen Z. Protein discrimination using a colorimetric sensor array based on gold nanoparticle aggregation induced by cationic polymer. ACS Sustainable Chem. Eng. 2018, 6, 10751–10757. 10.1021/acssuschemeng.8b02063. [DOI] [Google Scholar]
- Wang B.; Han J.; Bojanowski N. M.; Bender M.; Ma C.; Seehafer K.; Herrmann A.; Bunz U. H. F. An optimized sensor array identifies all natural amino acids. ACS Sens. 2018, 3, 1562–1568. 10.1021/acssensors.8b00371. [DOI] [PubMed] [Google Scholar]
- Xi H.; Li X.; Liu Q.; Chen Z. Cationic polymer-based plasmonic sensor array that discriminates proteins. Analyst 2018, 143, 5578–5582. 10.1039/c8an01360h. [DOI] [PubMed] [Google Scholar]
- Mao J.; Lu Y.; Chang N.; Yang J.; Zhang S.; Liu Y. Multidimensional colorimetric sensor array for discrimination of proteins. Biosens. Bioelectron. 2016, 86, 56–61. 10.1016/j.bios.2016.06.040. [DOI] [PubMed] [Google Scholar]
- He W.; Luo L.; Liu Q.; Chen Z. Colorimetric sensor array for discrimination of heavy metal ions in aqueous solution based on three kinds of thiols as receptors. Anal. Chem. 2018, 90, 4770–4775. 10.1021/acs.analchem.8b00076. [DOI] [PubMed] [Google Scholar]
- Li X.; Li S.; Liu Q.; Chen Z. Electronic-Tongue Colorimetric-Sensor Array for Discrimination and Quantitation of Metal Ions Based on Gold-Nanoparticle Aggregation. Anal. Chem. 2019, 91, 6315–6320. 10.1021/acs.analchem.9b01139. [DOI] [PubMed] [Google Scholar]
- Gao W.; Nyein H. Y. Y.; Shahpar Z.; Fahad H. M.; Chen K.; Emaminejad S.; Gao Y.; Tai L.-C.; Ota H.; Wu E.; Bullock J.; Zeng Y.; Lien D.-H.; Javey A. Wearable microsensor array for multiplexed heavy metal monitoring of body fluids. ACS Sens. 2016, 1, 866–874. 10.1021/acssensors.6b00287. [DOI] [Google Scholar]
- Lin Z.-Y.; Xue S.-F.; Chen Z.-H.; Han X.-Y.; Shi G.; Zhang M. Bioinspired copolymers based nose/tongue-mimic chemosensor for label-free fluorescent pattern discrimination of metal ions in biofluids. Anal. Chem. 2018, 90, 8248–8253. 10.1021/acs.analchem.8b01769. [DOI] [PubMed] [Google Scholar]
- Xiao-wei H.; Xiao-bo Z.; Ji-yong S.; Zhi-hua L.; Jie-wen Z. Colorimetric sensor arrays based on chemo-responsive dyes for food odor visualization. Trends Food Sci. Technol. 2018, 81, 90–107. 10.1016/j.tifs.2018.09.001. [DOI] [Google Scholar]
- Yan X.; Li H.; Su X. Review of optical sensors for pesticides. Trends Anal. Chem. 2018, 103, 1–20. 10.1016/j.trac.2018.03.004. [DOI] [Google Scholar]
- Askim J. R.; Mahmoudi M.; Suslick K. S. Optical sensor arrays for chemical sensing: the optoelectronic nose. Chem. Soc. Rev. 2013, 42, 8649–8682. 10.1039/c3cs60179j. [DOI] [PubMed] [Google Scholar]
- Anzenbacher P. Jr.; Lubal P.; Buček P.; Palacios M. A.; Kozelkova M. E. A practical approach to optical cross-reactive sensor arrays. Chem. Soc. Rev. 2010, 39, 3954–3979. 10.1039/b926220m. [DOI] [PubMed] [Google Scholar]
- Liao Z.; Zhang Y.; Li Y.; Miao Y.; Gao S.; Lin F.; Deng Y.; Geng L. Microfluidic chip coupled with optical biosensors for simultaneous detection of multiple analytes: A review. Biosens. Bioelectron. 2019, 126, 697–706. 10.1016/j.bios.2018.11.032. [DOI] [PubMed] [Google Scholar]
- Albert K. J.; Lewis N. S.; Schauer C. L.; Sotzing G. A.; Stitzel S. E.; Vaid T. P.; Walt D. R. Cross-reactive chemical sensor arrays. Chem. Rev. 2000, 100, 2595–2626. 10.1021/cr980102w. [DOI] [PubMed] [Google Scholar]
- Fahimi-Kashani N.; Hormozi-Nezhad M. R. Gold nanoparticle-based colorimetric sensor array for discrimination of organophosphate pesticides. Anal. Chem. 2016, 88, 8099–8106. 10.1021/acs.analchem.6b01616. [DOI] [PubMed] [Google Scholar]
- Lu Y.; Liu Y.; Zhang S.; Wang S.; Zhang S.; Zhang X. Aptamer-based plasmonic sensor array for discrimination of proteins and cells with the naked eye. Anal. Chem. 2013, 85, 6571–6574. 10.1021/ac4014594. [DOI] [PubMed] [Google Scholar]
- Bigdeli A.; Ghasemi F.; Golmohammadi H.; Abbasi-Moayed S.; Nejad M. A. F.; Fahimi-Kashani N.; Jafarinejad S.; Shahrajabian M.; Hormozi-Nezhad M. R. Nanoparticle-based optical sensor arrays. Nanoscale 2017, 9, 16546–16563. 10.1039/c7nr03311g. [DOI] [PubMed] [Google Scholar]
- Van Gennip A. H.; Van Kuilenburg A. B. P.. Defects of pyriidine degradation clinical molecular and diagnostic aspects. Purine and Pyrimidine Metabolism in Man X; Springer, 2002 [DOI] [PubMed] [Google Scholar]
- Brotons A.; Mas L. A.; Metters J. P.; Banks C. E.; Iniesta J. Voltammetric behaviour of free DNA bases, methylcytosine and oligonucleotides at disposable screen printed graphite electrode platforms. Analyst 2013, 138, 5239–5249. 10.1039/c3an00682d. [DOI] [PubMed] [Google Scholar]
- Lim C. X.; Hoh H. Y.; Ang P. K.; Loh K. P. Direct voltammetric detection of DNA and pH sensing on epitaxial graphene: an insight into the role of oxygenated defects. Anal. Chem. 2010, 82, 7387–7393. 10.1021/ac101519v. [DOI] [PubMed] [Google Scholar]
- Carrillo-Carrión C.; Armenta S.; Simonet B. M.; Valcárcel M.; Lendl B. Determination of pyrimidine and purine bases by reversed-phase capillary liquid chromatography with at-line surface-enhanced Raman spectroscopic detection employing a novel SERS substrate based on ZnS/CdSe silver-quantum dots. Anal. Chem. 2011, 83, 9391–9398. 10.1021/ac201821q. [DOI] [PubMed] [Google Scholar]
- Lu Y.; Luo L.; Ding Y.; Wang Y.; Zhou M.; Zhou T.; Zhu D.; Li X. Electrospun nickel loaded porous carbon nanofibers for simultaneous determination of adenine and guanine. Electrochim. Acta 2015, 174, 191–198. 10.1016/j.electacta.2015.05.165. [DOI] [Google Scholar]
- Badralmaa Y.; Natarajan V. Impact of the DNA extraction method on 2-LTR DNA circle recoveryfrom HIV-1 infected cells. J. Virol. Methods 2013, 193, 184–189. 10.1016/j.jviromet.2013.06.014. [DOI] [PMC free article] [PubMed] [Google Scholar]
- Ouyang X.; Luo L.; Ding Y.; Liu B.; Xu D. Simultaneous determination of purine and pyrimidine bases in DNA using poly(3,4-ethylenedioxythiophene)/graphene composite film. J. Electroanal. Chem. 2014, 735, 51–56. 10.1016/j.jelechem.2014.09.037. [DOI] [Google Scholar]
- Paleček E.; Bartošík M. Electrochemistry of nucleic acids. Chem. Rev. 2012, 112, 3427–3481. 10.1021/cr200303p. [DOI] [PubMed] [Google Scholar]
- Qin X.; Liu X.; Li H.-b.; Yin L.-n.; Hu X. Electrochemical determination of purine and pyrimidine DNA bases based on the recognition properties of azocalix[4]arene. Biosens. Bioelectron. 2013, 42, 355–361. 10.1016/j.bios.2012.11.004. [DOI] [PubMed] [Google Scholar]
- Gao Y.-S.; Xu J.-K.; Lu L.-M.; Wu L.-P.; Zhang K.-X.; Nie T.; Zhu X.-F.; Wu Y. Overoxidized polypyrrole/graphene nanocomposite with good electrochemical performance as novel electrode material for the detection of adenine and guanine. Biosens. Bioelectron. 2014, 62, 261–267. 10.1016/j.bios.2014.06.044. [DOI] [PubMed] [Google Scholar]
- Ng K. L.; Khor S. M. Graphite-based nanocomposite electrochemical sensor for multiplex detection of adenine, guanine, thymine, and cytosine: a biomedical prospect for studying DNA damage. Anal. Chem. 2017, 89, 10004–10012. 10.1021/acs.analchem.7b02432. [DOI] [PubMed] [Google Scholar]
- Yari A.; Derki S. New MWCNT-Fe3O4@PDA-Ag nanocomposite as a novel sensingelement of an electrochemical sensor for determination of guanine and adenine contents of DNA. Sens. Actuators, B 2016, 227, 456–466. 10.1016/j.snb.2015.12.088. [DOI] [Google Scholar]
- Lavanya N.; Nizeyimana Claude J.; Sekar C. Electrochemical determination of purine and pyrimidine bases using copper doped cerium oxide nanoparticles. J. Colloid Interface Sci. 2018, 530, 202–211. 10.1016/j.jcis.2018.06.046. [DOI] [PubMed] [Google Scholar]
- Zhang S.; Zhuang X.; Chen D.; Luan F.; He T.; Tian C.; Chen L. Simultaneous voltammetric determination of guanine and adenine using MnO2 nanosheets and ionic liquid-functionalized graphene combined with a permeation-selective polydopamine membrane. Microchim. Acta 2019, 186, 450–459. 10.1007/s00604-019-3577-4. [DOI] [PubMed] [Google Scholar]
- Ghavami R.; Salimi A.; Navaee A. SiC nanoparticles-modified glassy carbon electrodes for simultaneous determination of purine and pyrimidine DNA bases. Biosens. Bioelectron. 2011, 26, 3864–3869. 10.1016/j.bios.2011.02.048. [DOI] [PubMed] [Google Scholar]
- Wang X.; Choi N.; Cheng Z.; Ko J.; Chen L.; Choo J. Simultaneous detection of dual nucleic acids using a SERS-based lateral flow assay biosensor. Anal. Chem. 2017, 89, 1163–1169. 10.1021/acs.analchem.6b03536. [DOI] [PubMed] [Google Scholar]
- Wang J.; Li T.; Shen R.; Li G.; Ling L. Polymerase chain reaction-dynamic light scattering sensor for dna and protein by using both replication and cleavage properties of taq polymerase. Anal. Chem. 2019, 91, 3429–3435. 10.1021/acs.analchem.8b04929. [DOI] [PubMed] [Google Scholar]
- Lan L.; Yao Y.; Ping J.; Ying Y. Ultrathin transition-metal dichalcogenide nanosheet-based colorimetric sensor for sensitive and label-free detection of DNA. Sens. Actuators, B 2019, 290, 565–572. 10.1016/j.snb.2019.04.016. [DOI] [Google Scholar]
- Liu J.; Li G.; Yang X.; Wang K.; Li L.; Liu W.; Shi X.; Guo Y. Exciton energy transfer-based quantum dot fluorescence sensing array: “chemical noses” for discrimination of different nucleobases. Anal. Chem. 2015, 87, 876–883. 10.1021/ac503819e. [DOI] [PubMed] [Google Scholar]
- Nelson K. M.; Dahlin J. L.; Bisson J.; Graham J.; Pauli G. F.; Walters M. A. The essential medicinal chemistry of curcumin. J. Med. Chem. 2017, 60, 1620–1637. 10.1021/acs.jmedchem.6b00975. [DOI] [PMC free article] [PubMed] [Google Scholar]
- Gupta S. C.; Prasad S.; Kim J. H.; Patchva S.; Webb L. J.; Priyadarsini I. K.; Aggarwal B. B. Multitargeting by curcumin as revealed by molecular interaction studies. Nat. Prod. Rep. 2011, 28, 1937–1955. 10.1039/c1np00051a. [DOI] [PMC free article] [PubMed] [Google Scholar]
- Anand P.; Kunnumakkara A. B.; Newman R. A.; Aggarwal B. B. bioavailability of curcumin: problems and promises. Mol. Pharm. 2007, 4, 807–818. 10.1021/mp700113r. [DOI] [PubMed] [Google Scholar]
- Bhawana S.; Basniwal R. K.; Buttar H. S.; Jain V. K.; Jain N. Curcumin nanoparticles: preparation, characterization, and antimicrobial study. J. Agric. Food Chem. 2011, 59, 2056–2061. 10.1021/jf104402t. [DOI] [PubMed] [Google Scholar]
- Loo C.-Y.; Rohanizadeh R.; Young P. M.; Traini D.; Cavaliere R.; Whitchurch C. B.; Lee W. H. Combination of silver nanoparticles and curcumin nanoparticles for enhanced anti-biofilm activities. J. Agric. Food Chem. 2016, 64, 2513–2522. 10.1021/acs.jafc.5b04559. [DOI] [PubMed] [Google Scholar]
- Yang X. X.; Li C. M.; Huang C. Z. Curcumin modified silver nanoparticles for highly efficient inhibition of respiratory syncytial virus infection. Nanoscale 2016, 8, 3040–3048. 10.1039/c5nr07918g. [DOI] [PubMed] [Google Scholar]
- Naghdi T.; Golmohammadi H.; Vosough M.; Atashi M.; Saeedi I.; Maghsoudi M. T. Lab-on-nanopaper: An optical sensing bioplatform based on curcumin embedded in bacterial nanocellulose as an albumin assay kit. Anal. Chim. Acta 2019, 1070, 104–111. 10.1016/j.aca.2019.04.037. [DOI] [PubMed] [Google Scholar]
- Pandya A.; Goswami H.; Lodha A.; Menon S. K. A novel nanoaggregation detection technique of TNT using selective and ultrasensitive nanocurcumin as a probe. Analyst 2012, 137, 1771–1774. 10.1039/c2an35131e. [DOI] [PubMed] [Google Scholar]
- Park S.; Lee S.-Y. Significant enhancement of curcumin photoluminescence by aphotosensitizing organogel: An optical sensor for pyrrole detection. Sens. Actuators, B 2015, 220, 318–325. 10.1016/j.snb.2015.05.078. [DOI] [Google Scholar]
- Wanninger S.; Lorenz V.; Subhan A.; Edelmann F. T. Metal complexes of curcumin-synthetic strategies, structures and medicinal applications. Chem. Soc. Rev. 2015, 44, 4986–5002. 10.1039/c5cs00088b. [DOI] [PubMed] [Google Scholar]
- Pourreza N.; Golmohammadi H. Hemoglobin detection using curcumin nanoparticles as a colorimetric chemosensor. RSC Adv. 2015, 5, 1712–1717. 10.1039/c4ra10386f. [DOI] [Google Scholar]
- Bhopate D. P.; Mahajan P. G.; Garadkar K. M.; Kolekar G. B.; Patil S. R. A highly selective and sensitive single click novel fluorescent off–on sensor for copper and sulfide ions detection directly in aqueous solution using curcumin nanoparticles. New J. Chem. 2015, 39, 7086–7096. 10.1039/c5nj01228g. [DOI] [Google Scholar]
- Faham S.; Golmohammadi H.; Ghavami R.; Khayatian G. A nanocellulose-based colorimetric assay kit for smartphone sensing of iron and iron-chelating deferoxamine drug in biofluids. Anal. Chim. Acta 2019, 1087, 104–112. 10.1016/j.aca.2019.08.056. [DOI] [PubMed] [Google Scholar]
- Reedijk J. Metal-ion nucleic-acid interactions: A personal account. Inorg. Chim. Acta. 2016, 452, 268–272. 10.1016/j.ica.2015.12.011. [DOI] [Google Scholar]
- Morris D. L. Jr. DNA-bound metal ions: recent developments. Biomol. Concepts 2014, 5, 397–407. 10.1515/bmc-2014-0021. [DOI] [PubMed] [Google Scholar]
- Zhou W.; Saran R.; Liu J. Metal Sensing by DNA. Chem. Rev. 2017, 117, 8272–8325. 10.1021/acs.chemrev.7b00063. [DOI] [PubMed] [Google Scholar]
- Kanellis V. G.; Dos Remedios C. G. A review of heavy metal cation binding to deoxyribonucleic acids for the creation of chemical sensors. Biophys. Rev. 2018, 10, 1401–1414. 10.1007/s12551-018-0455-y. [DOI] [PMC free article] [PubMed] [Google Scholar]
- Wang Y.-J.; Pan M.-H.; Cheng A.-L.; Lin L.-I.; Ho Y.-S.; Hsieh C.-Y.; Lin J.-K. Stability of curcumin in buffer solutions and characterization of its degradation products. J. Pharm. Biomed. Anal. 1997, 15, 1867–1876. 10.1016/s0731-7085(96)02024-9. [DOI] [PubMed] [Google Scholar]
- Lee G.-Y. DFT Studies of the Zinc complexes of DNA bases. Bull. Korean Chem. Soc. 2006, 27, 419–422. 10.5012/bkcs.2006.27.3.419. [DOI] [Google Scholar]
- Masoud M. S.; Soayed A. A.; Ali A. E. Complexing properties of nucleic-acid constituents adenine and guanine complexes. Spectrochim. Acta, Part A 2004, 60, 1907–1915. 10.1016/j.saa.2003.09.025. [DOI] [PubMed] [Google Scholar]
- Abd El Wahed M. G.; Metwally S. M. Physical studies of some adenine complexes. Mater. Chem. Phys. 2003, 78, 299–303. 10.1016/s0254-0584(02)00204-3. [DOI] [Google Scholar]
- Hanna Elżanowska H.; van de Sande J. H. Complexation of bases and phosphates of nucleic acid components by transition metal ions. Bioelectrochem. Bioenerg. 1988, 19, 425–439. 10.1016/0302-4598(88)80023-0. [DOI] [Google Scholar]
- Parajuli R. Correlation between the stabilities of Cu+-cytosine, Zn2+-cytosine complexes and energies of frontier orbitals: DFT study in the gas phase. Sci. Rev. Chem. Commun. 2012, 2, 123–132. [Google Scholar]
- Gresh N.; Šponer J. Complexes of pentahydrated Zn2+ with guanine, adenine, and the guanine-cytosine and adenine-thymine base pairs. Structures and energies characterized by polarizable molecular mechanics and ab initio calculations. J. Phys. Chem. B 1999, 103, 11415–11427. 10.1021/jp9921351. [DOI] [Google Scholar]
- Hamada Y. Z.; Burkey T.; Waddell E.; Aitha M.; Phambu N. Reactions of Zn2+, Cd2+ and Hg2+ with free adenine. J. Appl. Solution Chem. Model. 2013, 2, 77–88. 10.6000/1929-5030.2013.02.02.1. [DOI] [Google Scholar]
- Ahmadi S.; Faridi S.; Tahmasebi S. Calcium-dependent kinases in the brain have site-specific associations with locomotion and rearing impairments in rats with bile duct ligation. Behav. Brain Res. 2019, 372, 112009–112016. 10.1016/j.bbr.2019.112009. [DOI] [PubMed] [Google Scholar]
Associated Data
This section collects any data citations, data availability statements, or supplementary materials included in this article.