Abstract
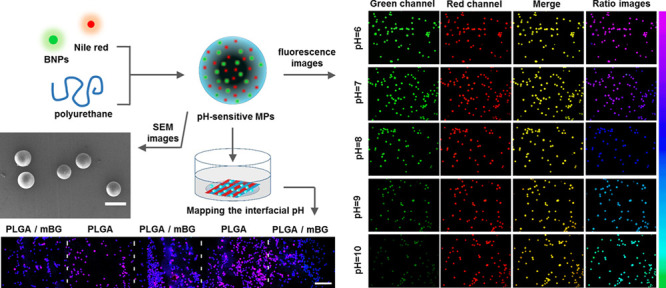
Bone regeneration has attracted extensive attention in the field of regenerative medicine. The influence of biomaterial on the extracellular environment is important for regulating the biological functions of cells for tissue regeneration. Among the various influencing factors, we had previously demonstrated that the extracellular pH value in the local microenvironment during biomaterial degradation affected the balance of bone formation and resorption. However, there is a lack of techniques for conveniently detecting the pH of the extracellular environment. In light of the development of fluorescent pH-sensing probes, herein, we fabricated a novel ratiometric fluorescent microgel (F-MG) for real-time and spatiotemporal monitoring of microenvironment pH. F-MGs were prepared from polyurethane with a size of around 75 μm by loading with pH-sensitive bovine serum albumin nanoparticles (BNPs) and pH-insensitive Nile red as a reference. The pH probes exhibited reversible fluorescence response to pH change and worked in a linear range of 6–10. F-MGs were biocompatible and could be used for long-term pH detection. It could be used to map interfacial pH on biomaterials during their degradation through pseudocolored images formed by the fluorescence intensity ratio between the green fluorescence of BNPs and the red fluorescence of Nile red. This study provided a useful tool for studying the influence of biomaterial microenvironment on biological functions of surrounding cells.
1. Introduction
Bone regeneration has attracted extensive attentions in the field of regenerative medicine.1 Repair of large bone defects that resulted from fractures, osteitis, osteotomies, arthrodesis trauma, and tumors remains a clinical challenge. For overcoming the limitations of autograft and allograft, various artificial bone grafts and scaffolds based on biomaterials have been developed to enhance the healing response, but the clinical efficacy of these materials is still unsatisfied.2,3 As we know, the biophysical properties of biomaterials could regulate the biological functions of cells and influence tissue regeneration.4 Therefore, investigation of the influence of the biomaterial on the extracellular environment is important for tissue regeneration.
Among the various influencing factors, the extracellular pH value in the local microenvironment during material degradation was important to balance bone formation and resorption.5−7 Bioglass could release alkaline ions to stimulate the nucleation of calcium phosphates and promote proliferation of osteoblasts.8 However, poly(lactide-co-glycolide) (PLGA) degradation releases acidic products, which would delay bone healing.9 Although the microenvironment pH is thought to be constantly buffered by the body fluid in vivo, our previous studies showed that the interfacial pH of biomaterials during their degradation was different from the physiological pH value (7.4).10−13 A number of methods, such as microelectrodes, 31P NMR spectroscopy, and optical microscopy, have been used to measure pH.14 However, the interfacial pH of biomaterials and its influence on the surrounding cells at the microscale were usually hard to detect.
The development of fluorescent probes for measuring intracellular pH has recently attracted extensive attentions for the high sensitivity and unrivaled spatiotemporal resolution.15,16 Various fluorescent pH probes have been developed such as fluorescent dyes, proteins, and nanoscale particles.17−19 It is technically mature and easily applied in fluorescence microscopy and flow cytometry for living cell imaging.20 Intracellular pH was usually quantified by the fluctuation of fluorescence intensity and fluorescence lifetime induced by pH.21,22 However, the signal was often interfered by probe concentration, instrumental efficiency, and environmental conditions. The appearance of ratiometric fluorescent probes further increased the reliability of pH measurement through ratiometric self-calibration of the two emission bands.23,24 The application of these probes was mainly for intracellular studies, and there is a lack of ratiometric fluorescent probes for monitoring the extracellular environment. Extracellular pH is very important for investigating the influence of biomaterials on cellular biological function. Efforts have been made for developing extracellular pH gradient detection.25,26 Besides, many of these fluorescent probes have low solubility and biocompatibility. Incorporation of ratiometric fluorescent pH probes into microspheres provides a feasible strategy for realizing extracellular pH detection with spatial and temporal resolution, also avoiding being flushed by blood/tissue fluid circulation.27−29
Polyurethane (PU) could be used for pH probe encapsulation. It is known for its stability and biocompatibility and has been widely used in medicine.30 Most importantly, it does not have volume change in response to pH variation, which is essential in terms of efficient dye loading and avoiding disturbing cellular activities.27,28 We had developed linear PU with controllable degradability for bone repair as previously reported.31,32 It is very suitable for possible long-term in vivo pH detection. Most pH fluorescent probes were fabricated based on tetraphenylethene and cyanine (Cy) units, which were complicated procedures.33−35 Cross-linking the denatured bovine serum albumin (BSA) was reported as a relative simple method to prepare the pH sensing probe, and it presented reversible fluorescence response to pH change in physiology range.36 Combination with pH-insensitive reference and microsphere encapsulation, ratiometric fluorescent spheres for extracellular pH detection could be developed.
In this study, we fabricated novel ratiometric fluorescent microgels (F-MGs) with the loading of BSA nanoparticles (BNPs) and Nile red in PU MGs for real-time and spatiotemporal monitoring microenvironment pH. The F-MGs exhibited a reversible and linear fluorescence response to pH values in the range of 6–10. Meanwhile, they were able to map the interfacial pH of biomaterials by the pseudocolored fluorescence ratiometric images. This study provided a useful tool for studying the influence of biomaterial microenvironment on biological functions of surrounding cells.
2. Materials and Methods
2.1. Materials
BSA, Nile red, glutaraldehyde, and poly(d,l-lactide-co-glycolide) (lactide/glycolide 50:50, ester terminated, Mw 7000–17,000) were purchased from Sigma-Aldrich. Acetone, ethanol, toluene, and hexafluoroisopropanol were purchased from Lingfeng Chemical Reagent Co., Ltd. (China). A cell counting kit-8 for cell variability was obtained from Dojindo Molecular Technologies (Japan).
2.2. Apparatus
Fluorescence spectroscopy measurements were performed on an FS920 fluorescence spectrometer (Edinburgh Instruments, UK). The morphology of MGs was observed using a Zeiss SUPRA 55 field emission scanning electron microscope (Carl Zeiss, Germany). Fluorescence imaging was performed on a BX53 fluorescence microscope (Olympus, Japan). The microenvironment pH value was measured using a pH microelectrode with 1.7 mm tip diameter (Inlab Nano, Mettler Toledo). Films were prepared using an SYSC-300 spin coater (SAN-YAN, Shanghai).
2.3. Preparation of Ratiometric pH-Sensitive Fluorescent Probes
Ratiometric pH-sensitive probes were composed of pH-sensitive nanoparticles and a pH-insensitive reference. The pH-sensitive nanoparticles were synthesized by cross-linking of denatured BSA proteins.36 Specifically, ethanol solution (2 mL, 75%) was added dropwise to BSA solution in phosphate-buffered saline (PBS; pH 7.4, 1 mL, 50 mg/mL) at room temperature with stirring. An opalescent suspension was spontaneously formed, and glutaraldehyde (25 μL, 8% v/v) was added for cross-linking BSA with stirring for 18 h until the solution turned light yellow. The resulting BNP solution was purified by centrifugation. Nile red as a pH-insensitive reference was first dissolved in acetone (0.1 mL, 0.1 mg/mL) and added into BNP solution (ethanol/PBS = 2:1 (v/v), 4.9 mL) with stirring for 3 h in the dark to form a uniform fluorescent pH probe solution. The probe solution was stored at 4 °C before use.
2.4. Fabrication of Ratiometric pH-Sensitive F-MGs
PU MGs were chosen as a carrier for pH-detecting probes. The linear PU with controllable degradability was synthesized and characterized as described in our previous study.31,32 Probes loaded with fluorescent PU MGs were prepared by an emulsion solvent evaporation method. Briefly, the prepared fluorescent pH probe solution (100 μL) as mentioned above was added to toluene (1 mL) containing 0.1 g of PU in an ultrasonic bath at 40 °C for 30 min. The obtained solution was then emulsified in 100 mL of distilled water containing 1% Tween-20 (Sigma) by adding dropwise and stirred overnight to evaporate the organic solvent, thereby solidifying the MGs. The MGs with diameters between 70 and 100 μm were isolated by filtration through cell strainers (Falcon, 70, 100 μm) and dialysis in distilled water for three days. The morphology of MGs was observed by scanning electron microscopy (SEM), and size distribution was analyzed using ImageJ software.
2.5. Spectrophotometric Characterizations
The fluorescence response of probes to pH was investigated at pH values ranging from 3 to 12. The probe solution containing BNPs and Nile red was mixed with the buffer (1:10, v/v), and the fluorescence spectra were recorded on a fluorescence spectrometer (Edinburgh Instruments FS920) with excitations at 490 and 580 nm, respectively. The reversibility of the fluorescence response of the pH probe was examined between pH 6 and pH 10 for five circles. For the interference study, diverse interference substances (Na+, K+, NH4+, Cl–, NO3–, Ca2+, Cu2+, Mg2+, Sr2+, CO32–, SO42–, Fe3+, BSA, HAS, Cys, and Ser) were mixed with the pH-sensitive fluorescent probe (pH = 7.0). The concentration of interference substances was 1 mM. Besides, fluorescence responses of the probe with different temperatures (4, 25, 37, and 50 °C) were recorded on a fluorescence spectrometer.
2.6. Microscopic Imaging
The fluorescence imaging of ratiometric pH-sensitive F-MGs was performed on a fluorescence microscope (Olympus BX53). The green emission was collected from 510 to 550 nm for BNPs (λex = 488 nm). The red emission was collected from 575 to 650 nm for Nile red (λex = 561 nm). Pseudocolored images were constructed using the fluorescence ratio between the green fluorescence of BNPs (Igreen) and the red fluorescence of Nile red (Ired) using OLYMPUS CellSens Dimension software.
2.7. Fluorescence Stability and Biocompatibility
The fluorescence stability of pH probes in solutions and MGs was investigated. The probe solution of BNPs and Nile red was stored in the dark at 37 °C, and the fluorescence intensity was measured on a fluorescence spectrometer at determined times for 2 months. Each value was averaged from six independent experiments. Because it was not able to directly detect the fluorescence intensity of probes in PU MGs, the fluorescence images were taken and the pseudocolored images were constructed.
For cytotoxicity evaluation, the MGs were sterilized using 75% ethanol and ultraviolet irradiation and then washed with sterile PBS several times. The extracts of MGs were obtained by incubating in a fresh culture medium at 37 °C (0.2 g/mL) for 24 h. Mouse fibroblast cells (L929) were seeded in 96-well tissue culture plates (1 × 10³ cells/well) and incubated in a minimum essential medium (Gibco) supplemented with 10% fetal bovine serum (Corning) and 100 units/mL penicillin and streptomycin (HyClone) for 24 h. Then, the medium was replaced with extracts and cultured for 48 h. Cell variability was determined using the cell counting kit-8 (Dojindo), according to the manufacturer’s instructions, and the results were shown as the percentage of cell viability. Each value was averaged from six independent experiments. Cells cultured in media without extracts were used as the control.
2.8. PLGA/mBG Film Preparation
The PLGA film was prepared by the spin-coating method. PLGA was dissolved in hexafluoroisopropanol at a concentration of 30% (w/v). The PLGA/mBG film was prepared by adding PLGA (15% w/v) and 45S5 bioglass microparticles (mBG, 15% w/v) in the solution. The solution was added onto the spin coater with a speed of 1000 rpm to form a film on the glass slide. The solvent was allowed to evaporate overnight at room temperature for 24 h to form a solid film. The 45S5 bioglass was prepared by the traditional melting method, as described previously, and the glass particles were sieved to the size range 75–150 μm.12 Increasing the mBG component would accelerate the disintegration of the film, and decreasing the mBG component would not influence degradation pH significantly. Therefore, an equal weight ratio of PLGA to mBG in the film was used. Films were sterilized by UV exposure and 75% ethanol soaking.
The composite film with interval bands was prepared by the spin-coating method utilizing a template with 2 mm interval bands. PLGA solution was first added on the template on the spin coater to make the PLGA band with a width of 2 mm. After evaporation, the template was moved for loading PLGA/mBG solution. The solvent was allowed to evaporate overnight at room temperature to form the interval band film. After vacuuming for 24 h, samples were sterilized by UV exposure and soaking in 75% ethanol for 2 h. After washing with sterile PBS several times, the films could be used for long-term incubation and detection.
2.9. Interfacial pH Detection of Material Films
The interfacial pH of films was detected by F-MGs and a microelectrode pH meter (sentron-MicroFET). The films were cultured in a medium for 2 weeks. The F-MGs were added at the beginning and always soaked in the solution. The variation of interfacial pH was monitored at the determined time during film degradation.
2.10. Statistical Analysis
All experiments were performed at least in three independent batches. Data were represented as the mean standard deviation (SD). For data in the figures, the error bars show SDs. One-way analysis of variance (ANOVA) followed by the Bonferroni post hoc test was used to test the statistical significance, and differences were considered statistically significant when p < 0.05.
3. Results and Discussion
3.1. Ratiometric pH-Sensitive Dye Fabrication and Spectrophotometric Characterizations
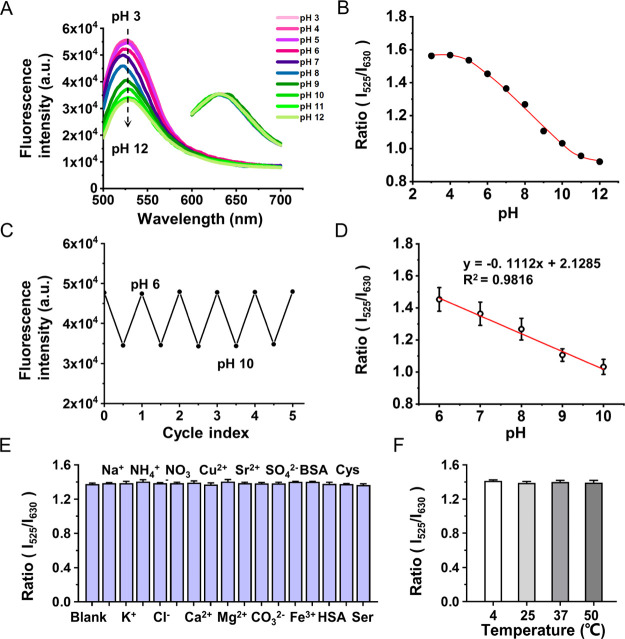
Ratiometric pH-sensitive fluorescent probes were fabricated using pH-sensitive BNPs and pH-insensitive Nile red. BNPs were prepared through cross-linking of the denatured BSA.36 Compared with other molecular fluorescent probes, BNPs were easier to prepare and purify. The fluorescence intensity of BNPs was sensitive to the pH value (Figure 1A). It was conceived that BNPs could perform reversible conformation variation in response to acid–base change and generate fluorescence intensity variation.37,38 Glutaraldehyde as the cross-linker of BAS to form nanoparticles may also contribute to the fluorescence formation.39 It has been found that glutaraldehyde reacted with the amino group of proteins, and peptides could generate visible to near-IR emitters, especially the reaction with secondary amine could generate a green emitter.40 From the fluorescence spectrum, Nile red with red fluorescence is insensitive to pH change, serving as an inner reference. By simply mixing BNPs and Nile red, their fluorescence response at different pH values was investigated using a fluorescence spectrometer in the pH range of 3–12. The fluorescence of BNPs at 525 nm (Ex 490 nm) decreased gradually with the increase in pH, while Nile red maintained the constant fluorescence at 630 nm (Ex 580 nm) (Figure 1A). A sigmoidal response of these two dyes’ fluorescence intensity ratio (I525/I630) is shown in Figure 1B.
Figure 1.
Fluoresence response of ratiometric probes to pH fluctuation. (A) pH-dependent fluorescence response curves of BNPs/Nile red solution with excitation at 490 and 580 nm, respectively. (B) pH response curve of BNPs/Nile red probes calculated from the ratio of fluorescence intensities at 525 and 630 nm (pH 3–12). (C) Reversible fluorescence changes in BNPs between pH 6 and pH 10. (D) pH calibration plot of BNPs/Nile red probes calculated from the ratio of fluorescence intensities at 525 and 630 nm. (E) Fluorescence responses of the pH-sensitive probe with diverse interference substance solution (1 mM, pH = 7.0): (1) blank, (2) Na+, (3) K+, (4) NH4+, (5) Cl–, (6) NO3–, (7) Ca2+, (8) Cu2+, (9) Mg2+, (10) Sr2+, (11) CO32–, (12) SO42–, (13) Fe3+, (14) BSA, (15) HAS, (16) Cys, and (17) Ser. (F) Fluorescence responses of the pH-sensitive probe at different temperatures (pH = 7.0): (1) 4, (2) 25, (3) 37, and (4) 50 °C.
Considering that the microenvironment pH of biomaterial degradation for bone regeneration was mainly within 6–10,41 this study focused on the response of the pH-sensitive probe in this range. The fluorescence fluctuation of BNPs was reversible corresponding to the pH change in the range cycles from 6 to 10 (Figure 1C). However, the ratio of their fluorescence intensity I525/I630 presented a linear relationship with pH change y = −0.1112x + 2.1285 (R2 = 0.9816, pH 6–10), as shown in Figure 1D. On the basis of these results, the pH of the surrounding could be determined. The interference of some substances on pH detection was studied in ddH2O solution (1 mM, pH = 7.0) containing the ion, protein, or amino acid (Figure 1E). The ratio of fluorescence intensity I525/I630 presented negligible influence in the presence of some ions (Na+, K+, NH4+, Cl–, NO3–, Ca2+, Cu2+, Mg2+, Sr2+, CO32–, SO42–, and Fe3+), proteins (HAS and BSA), and amino acids (Cys and Ser). In addition, as shown in Figure 1F, changes in temperature (4, 25, 37, and 50 °C) had a negligible effect on the fluorescence response. The results show the good specificity of the probe for determination of pH.
3.2. Ratiometric Fluorescent pH-Sensitive PU MGs
Ratiometric F-MGs for sensing pH values in the physiological range were prepared from PU by loading it with ratiometric BNPs and Nile red pH probes (Figure 2A). PU contains both hydrophilic and hydrophobic domains, which is suitable to embed BNPs and Nile red in its polymer network.28 The linear PU with controllable degradability used in this study provided the long-term biosafety for potential in vivo application. PU MGs were obtained by an emulsion method followed by filtration. The stirring rate during preparation would affect the size of MGs. The size around 75 μm was chosen, which is much larger than the size of normal cells. Therefore, PU MGs could reflect the local extracellular pH microenvironment and avoid cellular uptake, which also ensures cellular biocompatibility. As shown in SEM images, PU MGs showed a relatively uniform particle size distribution of around 75 μm and spherical morphology (Figure 2B,C). Under the fluorescence microscope, both the BNPs and Nile red were well distributed in PU MGs and gave bright green or red fluorescence (Figure 2D).
Figure 2.
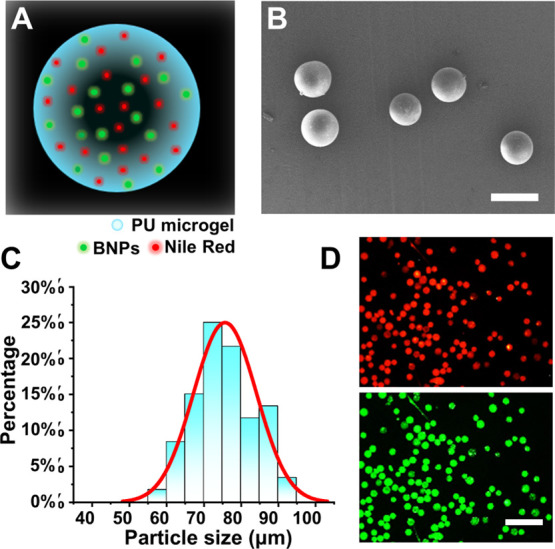
Ratiometric pH-sensitive PU MGs carrying BNPs and Nile red pH probes. (A) Schematic diagram of the ratiometric pH-sensing F-MGs used in this work. (B) SEM image of F-MGs and (C) their size distribution. (D) Distribution of BNPs (green) and Nile red (red) in PU MGs. Scale bar: (B) 100 and (D) 400 μm.
3.3. Ratiometric pH-Sensitive PU MGs (F-MGs) for pH Detection
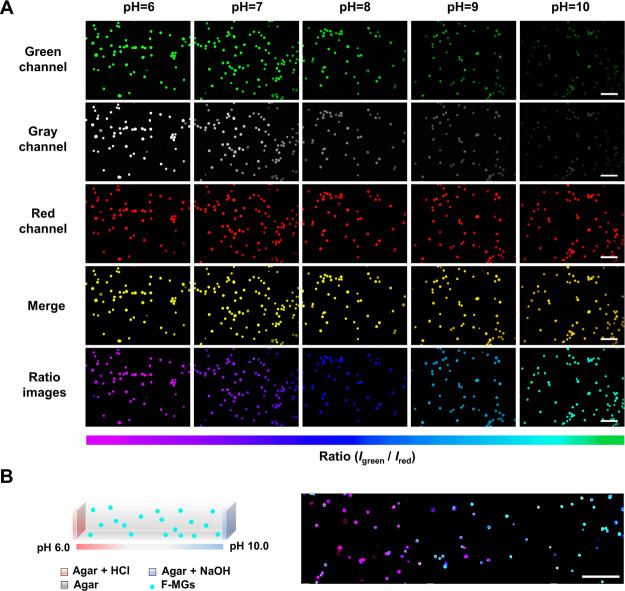
Ratiometric pH-sensitive fluorescent PU MGs (F-MGs) were used to detect the pH value. Buffers at various pH values from 6 to 10 were prepared. As observed under a fluorescence microscope, the fluorescence intensity in the green channel from BNPs gradually decreased with an increase in pH value, whereas the fluorescence intensity in the red channel from Nile red maintained constant (Figure 3A).
Figure 3.
Fluorescence images of the ratiometric pH-sensing F-MGs for pH detection. (A) Fluorescence images of F-MGs in different pH buffers; the pseudocolored ratiometric images (last row) were constructed by the fluorescence intensity ratio between the green fluorescence of BNPs and the red fluorescence of Nile red using OLYMPUS CellSens Dimension software. The bottom color strip represents the pseudocolor change with pH. (B) Hydrogel with spatial pH variation from pH 6 on one side to pH 10 on the other side was constructed, and the F-MGs in the hydrogel indicated pH changed by different pseudocolors. Scale bar: (A) 500 μm and (B) 1 mm.
The merged images confirmed the colocalization of BNPs and Nile red in the MGs. Pseudocolored images were constructed using the intensity ratio between the green fluorescence of BNPs and the red fluorescence of Nile red using OLYMPUS software.42 The pink and blue pseudocolors correspond to the high and low green-to-red emission ratios, which were directly related to the local pH value. Through analysis of the ratio images, monitoring the pH of the microenvironment could be achieved. We then fabricated an agar hydrogel with spatial pH variation from pH 6 on one side to pH 10 on the other side (Figure 3B). The buffer solutions were added on each side of the hydrogel, and the diffusion of hydrogen ions and hydroxide ions in the hydrogel from two sides caused the spatial pH variation inside the agar hydrogel. The F-MGs in the hydrogel showed different pseudocolors, which could indicate the spatial pH distribution in the hydrogel from pH 6 to pH 10. This result suggested the feasibility of spatial detection of pH in the microenvironment.
3.4. F-MG Stability and Biocompatibility
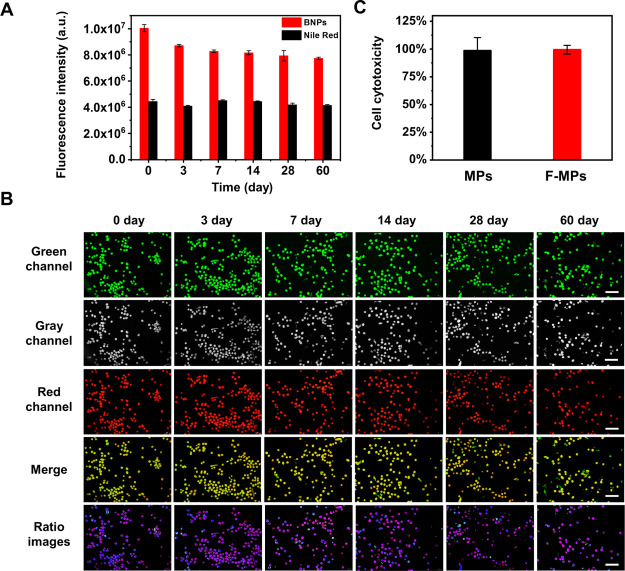
Because the course of osteogenic differentiation usually takes weeks, the stability and biocompatibility of F-MGs were very important. The fluorescence stability of dyes and F-MGs were monitored as long as 2 months. For dyes alone, the changes in the fluorescence intensity of BNPs and Nile red were detected using a fluorescence spectrometer, and they could maintain 78 and 93% of the initial intensity after storing for 60 days (Figure 4A). This result indicated that BNPs may degrade in solution during storage and resulted in the decrease in fluorescence.
Figure 4.
Stability and biocompatibility of F-MGs. (A) Stability of fluorescence intensity of BNPs and Nile red detected using a fluorescence spectrometer within 2 months. (B) Fluorescence images of F-MGs observed within 2 months, pseudocolored images (last row) of their fluorescence ratio reflected constant pH. (C) L929 cell viability incubated in the extracts of MPs and F-MPs measured by cck-8 assay. Scale bar: (B) 500 μm.
The fluorescence stability of the dyes encapsulated in MGs was then studied. Because the fluorescence intensity of F-MGs could not be detected with a fluorescence spectrometer for its large particle size, the fluorescence images and pseudocolored ratio images were observed (Figure 4B). It could be found that the green fluorescence did not show significant degrease. Furthermore, the pseudocolored images showed a similar color, which suggested the relative constant fluorescence ratio of BNPs to Nile red during long-term incubation. The encapsulation of BNPs and Nile red in PU MGs seems to protect BNPs from degradation and fluorescence decrease. Besides, F-MGs could still maintain the spherical structure after 2 month incubation. This piperazine-based linear PU has controllable degradation ability, which could maintain its morphology and mechanical properties for more than 2 months.31,32 This property could ensure long-term pH detection.
The in vitro cytotoxicity of F-MGs was assessed by CCK-8 assay. The cultivation of L929 cells in the extracts revealed no significant cytotoxicity. Both the PU MGs with and without pH probe loading (F-MGs and MGs) showed high cell viability, as shown in Figure 4C.
3.5. Biomaterial Interfacial pH Detection
As we know, the degradation of different biomaterials usually generates different microenvironments, including the varied pH value. PLGA degradation generates the acid component, whereas the degradation of bioglass would increase the pH value of its surroundings.11,43 In order to observe the continuous pH change in microenvironment at the PLGA interface during a 14 day degradation, PLGA (lactide: glycolide 50:50, ester-terminated, Mw 7000–17,000) was selected for its fast degradation.44
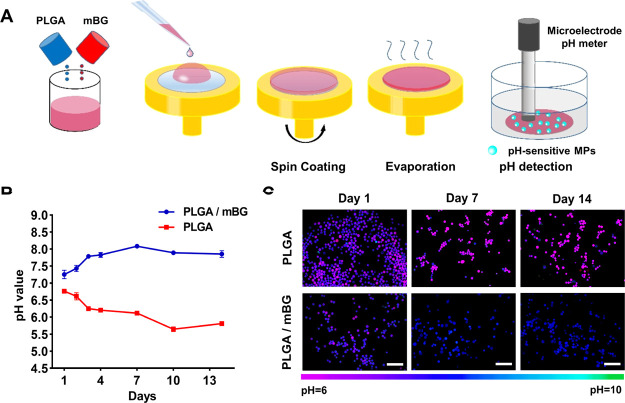
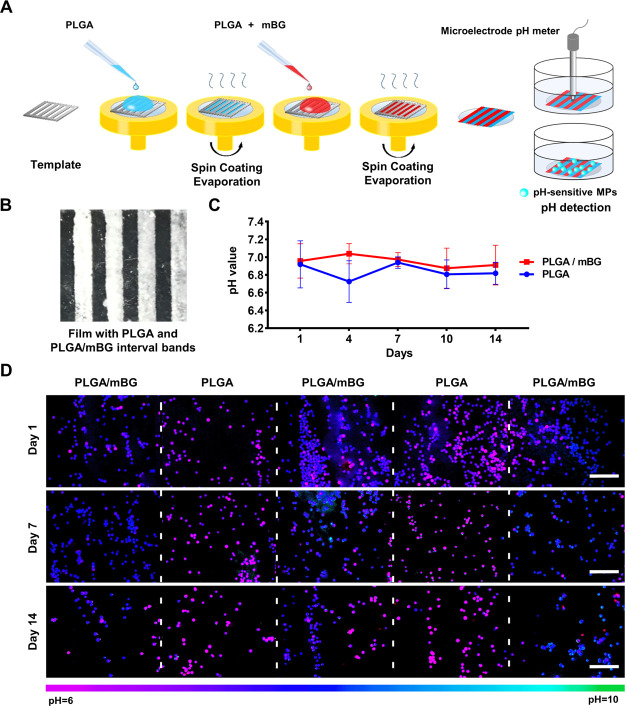
PLGA films were prepared by the spin-coating method, and bioglass microparticles (mBGs) were added to PLGA solution for making the PLGA/mBG film (Figure 5A). After incubation in a medium for 2 weeks, the interfacial pH values on PLGA and PLGA/mBG films were detected by F-MGs and compared with a microelectrode pH meter. The microelectrode showed that the pH on the surface of the PLGA film decreased from 6.76 at day 1 to 6.12 at day 7 and finally fell below 6 at day 14. The pseudo pink color of F-MGs indicated the increased green-to-red ratio and acidic environment. With the addition of mBG, the decrease in pH on the film surface was attenuated. The pH value varied around 7.25 to 8.08, and F-MGs showed the pseudo blue colors with the increased green-to-red ratio. The different pH variations on the surface of PLGA and PLGA/mBG films could be observed in the pseudocolored fluorescence images, which should be generated by the different degradation rates and sensed by F-MGs. Because the pseudocolor of F-MGs from the fluorescence ratio was consistent with the results of the microelectrode pH meter, mapping of pH for the heterogeneous biomaterial could be achieved.
Figure 5.
Interfacial pH detection during PLGA and mBG degradation. (A) Schematic representation of PLGA and PLGA/mBG film preparation and interfacial pH detection. Changes in film interfacial pH in the medium during 2 weeks were monitored using a (B) microelectrode pH meter and (C) pseudocolored ratiometric images of F-MGs. Scale bar: (C) 500 μm.
3.6. Mapping the Spatial Distribution of Interfacial pH on Biomaterials
Biomaterials for tissue engineering are usually constructed using multicomponents to realize the biological function. Their degradation would generate spatial distribution of microenvironment pH. For detecting the spatially distributed pH change, we constructed a film with interval bands of PLGA and PLGA/mBG. PLGA was used to shape mBG into bands because it is difficult to prepare the pure BG film band. The film was constructed by the spin-coating method using a template to generate 2 mm interval bands. The bands of PLGA and PLGA/mBG were generated sequentially (Figure 6A,B). With their degradation in the medium, the different microenvironment pH values would be generated around the individual band to form spatial pH variation.
Figure 6.
Interfacial pH detection on the films with PLGA/mBG interval bands during degradation. (A,B) Schematic representation of preparing the film with interval bands of PLGA and PLGA/mBG, 2 mm bands. Interfacial pH detection in the medium during 2 week incubation using a (C) microelectrode pH meter and (D) pseudocolored ratiometric images of F-MGs. Scale bar: (D) 500 μm.
The interfacial pH was mapped by F-MGs and detected with a microelectrode pH meter. Pseudocolored ratiometric images of F-MGs showed significant different color bands corresponding to the different material bands. The pseudo pink color of the microspheres gathered in the PLGA material region on the surface of the film indicated an acidic environment. However, in the PLGA/mBG region, the pseudo blue color indicated a higher pH value (Figure 6D). This result was consistent with the former result and suggested the sensitivity of F-MGs in detecting microenvironment pH. However, the microelectrode pH meter can hardly distinguish the spatial pH change on the surface of the films because of the diffusion of the solution and the low resolution relative to the width of bands (Figure 6C). Ratiometric fluorescence pH imaging of F-MGs displayed the advantages of real-time and spatiotemporal pH mapping of the extracellular environment and biomaterial interface. The double signal output would not be affected by the fluctuations of the excitation light source and the uneven distribution of local concentration of the probe, which were particularly suitable for pH monitoring in the complex material interfacial microenvironment.45,46 Additional insightful mechanistic information for the degradable biomaterial could therefore be elucidated by exploring the dynamic pH change at the material interface in a spatially resolved route.47,48 More importantly, additional probes could be integrated into PU MGs for wider application. With the loading of near-infrared pH fluorescent probes, in vivo microenvironment investigation could be realized.49 This technique was based on the analysis of the fluorescence intensity by fluorescence microscopy, which would induce variations. The procedure of constructing the pH color map of the ratiometric images could also be optimized for wider compatibility and needs further investigation.50 This technique opens up a new way for monitoring the degradation behavior of the degradable biomaterial and guiding the design of the material.
4. Conclusions
In summary, we fabricated novel ratiometric F-MGs for real-time and spatiotemporal monitoring of microenvironment pH. They were prepared from PU MGs with a size of around 75 μm by loading with pH-sensitive BNPs and pH-insensitive Nile red as the reference. The pH probes exhibited reversible fluorescence response to pH change and worked in a linear range of 6–10. F-MGs were biocompatible and could be used for long-term pH detection. It would be used for interfacial pH mapping on biomaterials during their degradation through pseudocolored images formed by the ratio between the green fluorescence of BNPs and the red fluorescence of Nile red. This technique opens up a new way for monitoring the degradation behavior of the degradable biomaterial and guiding the design of the material.
Acknowledgments
This work was supported by the National Key R&D Program of China (2018YFA0703100), the National Natural Science Foundation of China (81672226 and 81972071), and the Science and Technology Research Funding of Shenzhen (JSGG20180503182359108, JCYJ20170413162540673, and JCYJ20180507182237428).
Author Contributions
⊥ F.L. and Y.L. contributed equally.
The authors declare no competing financial interest.
References
- Sui B.-D.; Hu C.-H.; Liu A.-Q.; Zheng C.-X.; Xuan K.; Jin Y. Stem cell-based bone regeneration in diseased microenvironments: Challenges and solutions. Biomaterials 2019, 196, 18–30. 10.1016/j.biomaterials.2017.10.046. [DOI] [PubMed] [Google Scholar]
- Ho-Shui-Ling A.; Bolander J.; Rustom L. E.; Johnson A. W.; Luyten F. P.; Picart C. Bone regeneration strategies: Engineered scaffolds, bioactive molecules and stem cells current stage and future perspectives. Biomaterials 2018, 180, 143–162. 10.1016/j.biomaterials.2018.07.017. [DOI] [PMC free article] [PubMed] [Google Scholar]
- Wubneh A.; Tsekoura E. K.; Ayranci C.; Uludağ H. Current state of fabrication technologies and materials for bone tissue engineering. Acta Biomater. 2018, 80, 1–30. 10.1016/j.actbio.2018.09.031. [DOI] [PubMed] [Google Scholar]
- Li Y.; Xiao Y.; Liu C. The Horizon of Materiobiology: A Perspective on Material-Guided Cell Behaviors and Tissue Engineering. Chem. Rev. 2017, 117, 4376–4421. 10.1021/acs.chemrev.6b00654. [DOI] [PubMed] [Google Scholar]
- Tan J.; Wang D.; Cao H.; Qiao Y.; Zhu H.; Liu X. Effect of Local Alkaline Microenvironment on the Behaviors of Bacteria and Osteogenic Cells. ACS Appl. Mater. Interfaces 2018, 10, 42018–42029. 10.1021/acsami.8b15724. [DOI] [PubMed] [Google Scholar]
- Kim J.-W.; Alfafara A. M. D.; Kim H.-Y.; Kim S.-Y.; Kim S.-J. Effects of pH alteration on the pathogenesis of medication-related osteonecrosis of the jaw. Bone 2019, 122, 45–51. 10.1016/j.bone.2019.02.007. [DOI] [PubMed] [Google Scholar]
- Avnet S.; Di Pompo G.; Lemma S.; Baldini N. Cause and effect of microenvironmental acidosis on bone metastases. Cancer Metastasis Rev. 2019, 38, 133–147. 10.1007/s10555-019-09790-9. [DOI] [PMC free article] [PubMed] [Google Scholar]
- Naruphontjirakul P.; Tsigkou O.; Li S.; Porter A. E.; Jones J. R. Human mesenchymal stem cells differentiate into an osteogenic lineage in presence of strontium containing bioactive glass nanoparticles. Acta Biomater. 2019, 90, 373–392. 10.1016/j.actbio.2019.03.038. [DOI] [PubMed] [Google Scholar]
- Lin S.; Cui L.; Chen G.; Huang J.; Yang Y.; Zou K.; Lai Y.; Wang X.; Zou L.; Wu T.; Cheng J. C. Y.; Li G.; Wei B.; Lee W. Y. W. PLGA/β-TCP composite scaffold incorporating salvianolic acid B promotes bone fusion by angiogenesis and osteogenesis in a rat spinal fusion model. Biomaterials 2019, 196, 109–121. 10.1016/j.biomaterials.2018.04.004. [DOI] [PubMed] [Google Scholar]
- Shen Y.; Liu W.; Lin K.; Pan H.; Darvell B. W.; Peng S.; Wen C.; Deng L.; Lu W. W.; Chang J. Interfacial pH: A Critical Factor for Osteoporotic Bone Regeneration. Langmuir 2011, 27, 2701–2708. 10.1021/la104876w. [DOI] [PubMed] [Google Scholar]
- Ruan C.; Hu N.; Ma Y.; Li Y.; Liu J.; Zhang X.; Pan H. The interfacial pH of acidic degradable polymeric biomaterials and its effects on osteoblast behavior. Sci. Rep. 2017, 7, 6794. 10.1038/s41598-017-06354-1. [DOI] [PMC free article] [PubMed] [Google Scholar]
- Liu W.; Dan X.; Lu W. W.; Zhao X.; Ruan C.; Wang T.; Cui X.; Zhai X.; Ma Y.; Wang D.; Huang W.; Pan H. Spatial Distribution of Biomaterial Microenvironment pH and Its Modulatory Effect on Osteoclasts at the Early Stage of Bone Defect Regeneration. ACS Appl. Mater. Interfaces 2019, 11, 9557–9572. 10.1021/acsami.8b20580. [DOI] [PubMed] [Google Scholar]
- Liu W.; Wang T.; Yang C.; Darvell B. W.; Wu J.; Lin K.; Chang J.; Pan H.; Lu W. W. Alkaline biodegradable implants for osteoporotic bone defects-importance of microenvironment pH. Osteoporosis Int. 2016, 27, 93–104. 10.1007/s00198-015-3217-8. [DOI] [PubMed] [Google Scholar]
- Yuqing M.; Jianrong C.; Keming F. New technology for the detection of pH. J. Biochem. Biophys. Methods 2005, 63, 1–9. 10.1016/j.jbbm.2005.02.001. [DOI] [PubMed] [Google Scholar]
- Han J.; Burgess K. Fluorescent Indicators for Intracellular pH. Chem. Rev. 2010, 110, 2709–2728. 10.1021/cr900249z. [DOI] [PubMed] [Google Scholar]
- Yin J.; Hu Y.; Yoon J. Fluorescent probes and bioimaging: alkali metals, alkaline earth metals and pH. Chem. Soc. Rev. 2015, 44, 4619–4644. 10.1039/c4cs00275j. [DOI] [PubMed] [Google Scholar]
- Qi Z.; Chen Y. Charge-transfer-based terbium MOF nanoparticles as fluorescent pH sensor for extreme acidity. Biosens. Bioelectron. 2017, 87, 236–241. 10.1016/j.bios.2016.08.052. [DOI] [PubMed] [Google Scholar]
- Ma X.; Wang Y.; Zhao T.; Li Y.; Su L.-C.; Wang Z.; Huang G.; Sumer B. D.; Gao J. Ultra-pH-sensitive nanoprobe library with broad pH tunability and fluorescence emissions. J. Am. Chem. Soc. 2014, 136, 11085–11092. 10.1021/ja5053158. [DOI] [PMC free article] [PubMed] [Google Scholar]
- Tantama M.; Hung Y. P.; Yellen G. Imaging intracellular pH in live cells with a genetically encoded red fluorescent protein sensor. J. Am. Chem. Soc. 2011, 133, 10034–10037. 10.1021/ja202902d. [DOI] [PMC free article] [PubMed] [Google Scholar]
- Wu M.-Y.; Li K.; Liu Y.-H.; Yu K.-K.; Xie Y.-M.; Zhou X.-D.; Yu X.-Q. Mitochondria-targeted ratiometric fluorescent probe for real time monitoring of pH in living cells. Biomaterials 2015, 53, 669–678. 10.1016/j.biomaterials.2015.02.113. [DOI] [PubMed] [Google Scholar]
- Orte A.; Alvarez-Pez J. M.; Ruedas-Rama M. J. Fluorescence Lifetime Imaging Microscopy for the Detection of Intracellular pH with Quantum Dot Nanosensors. ACS Nano 2013, 7, 6387–6395. 10.1021/nn402581q. [DOI] [PubMed] [Google Scholar]
- Yu F.; Li P.; Li G.; Zhao G.; Chu T.; Han K. A Near-IR Reversible Fluorescent Probe Modulated by Selenium for Monitoring Peroxynitrite and Imaging in Living Cells. J. Am. Chem. Soc. 2011, 133, 11030–11033. 10.1021/ja202582x. [DOI] [PubMed] [Google Scholar]
- Liu X.; Su Y.; Tian H.; Yang L.; Zhang H.; Song X.; Foley J. W. Ratiometric Fluorescent Probe for Lysosomal pH Measurement and Imaging in Living Cells Using Single-Wavelength Excitation. Anal. Chem. 2017, 89, 7038–7045. 10.1021/acs.analchem.7b00754. [DOI] [PubMed] [Google Scholar]
- Ma T.; Hou Y.; Zeng J.; Liu C.; Zhang P.; Jing L.; Shangguan D.; Gao M. Dual-Ratiometric Target-Triggered Fluorescent Probe for Simultaneous Quantitative Visualization of Tumor Microenvironment Protease Activity and pH in Vivo. J. Am. Chem. Soc. 2018, 140, 211–218. 10.1021/jacs.7b08900. [DOI] [PubMed] [Google Scholar]
- Ying L.; Xie N.; Yang Y.; Yang X.; Zhou Q.; Yin B.; Huang J.; Wang K. A cell-surface-anchored ratiometric i-motif sensor for extracellular pH detection. Chem. Commun. 2016, 52, 7818–7821. 10.1039/c6cc03163c. [DOI] [PubMed] [Google Scholar]
- Munteanu R.-E.; Stǎnicǎ L.; Gheorghiu M.; Gáspár S. Measurement of the Extracellular pH of Adherently Growing Mammalian Cells with High Spatial Resolution Using a Voltammetric pH Microsensor. Anal. Chem. 2018, 90, 6899–6905. 10.1021/acs.analchem.8b01124. [DOI] [PubMed] [Google Scholar]
- Cao L.; Li X.; Wang S.; Li S.; Li Y.; Yang G. A novel nanogel-based fluorescent probe for ratiometric detection of intracellular pH values. Chem. Commun. 2014, 50, 8787–8790. 10.1039/c4cc03716b. [DOI] [PubMed] [Google Scholar]
- Peng H.-s.; Stolwijk J. A.; Sun L.-N.; Wegener J.; Wolfbeis O. S. A Nanogel for Ratiometric Fluorescent Sensing of Intracellular pH Values. Angew. Chem., Int. Ed. 2010, 49, 4246–4249. 10.1002/anie.200906926. [DOI] [PubMed] [Google Scholar]
- Zhang X.; Rehm S.; Safont-Sempere M. M.; Würthner F. Vesicular perylene dye nanocapsules as supramolecular fluorescent pH sensor systems. Nat. Chem. 2009, 1, 623–629. 10.1038/nchem.368. [DOI] [PubMed] [Google Scholar]
- Joseph J.; Patel R. M.; Wenham A.; Smith J. R. Biomedical applications of polyurethane materials and coatings. Trans. Inst. Met. Finish. 2018, 96, 121–129. 10.1080/00202967.2018.1450209. [DOI] [Google Scholar]
- Ma Y.; Hu N.; Liu J.; Zhai X.; Wu M.; Hu C.; Li L.; Lai Y.; Pan H.; Lu W. W.; Zhang X.; Luo Y.; Ruan C. Three-Dimensional Printing of Biodegradable Piperazine-Based Polyurethane-Urea Scaffolds with Enhanced Osteogenesis for Bone Regeneration. ACS Appl. Mater. Interfaces 2019, 11, 9415–9424. 10.1021/acsami.8b20323. [DOI] [PubMed] [Google Scholar]
- Ruan C.; Hu N.; Hu Y.; Jiang L.; Cai Q.; Wang H.; Pan H.; Lu W. W.; Wang Y. Piperazine-based polyurethane-ureas with controllable degradation as potential bone scaffolds. Polymer 2014, 55, 1020–1027. 10.1016/j.polymer.2014.01.011. [DOI] [Google Scholar]
- Chen S.; Hong Y.; Liu Y.; Liu J.; Leung C. W. T.; Li M.; Kwok R. T. K.; Zhao E.; Lam J. W. Y.; Yu Y.; Tang B. Z. Full-Range Intracellular pH Sensing by an Aggregation-Induced Emission-Active Two-Channel Ratiometric Fluorogen. J. Am. Chem. Soc. 2013, 135, 4926–4929. 10.1021/ja400337p. [DOI] [PubMed] [Google Scholar]
- Myochin T.; Kiyose K.; Hanaoka K.; Kojima H.; Terai T.; Nagano T. Rational design of ratiometric near-infrared fluorescent pH probes with various pKa values, based on aminocyanine. J. Am. Chem. Soc. 2011, 133, 3401–3409. 10.1021/ja1063058. [DOI] [PubMed] [Google Scholar]
- Liu W.; Sun R.; Ge J.-F.; Xu Y.-J.; Xu Y.; Lu J.-M.; Itoh I.; Ihara M. Reversible near-infrared pH probes based on benzo[a]phenoxazine. Anal. Chem. 2013, 85, 7419–7425. 10.1021/ac4013539. [DOI] [PubMed] [Google Scholar]
- Yang Q.; Ye Z.; Zhong M.; Chen B.; Chen J.; Zeng R.; Wei L.; Li H.-w.; Xiao L. Self-Assembled Fluorescent Bovine Serum Albumin Nanoprobes for Ratiometric pH Measurement inside Living Cells. ACS Appl. Mater. Interfaces 2016, 8, 9629–9634. 10.1021/acsami.6b00857. [DOI] [PubMed] [Google Scholar]
- Liu W.; Dan X.; Wang T.; Lu W. W.; Pan H. A Bone-Implant Interaction Mouse Model for Evaluating Molecular Mechanism of Biomaterials/Bone Interaction. Tissue Eng., Part C 2016, 22, 1018–1027. 10.1089/ten.tec.2016.0250. [DOI] [PubMed] [Google Scholar]
- Wu Y.; Chakrabortty S.; Gropeanu R. A.; Wilhelmi J.; Xu Y.; Er K. S.; Kuan S. L.; Koynov K.; Chan Y.; Weil T. pH-Responsive quantum dots via an albumin polymer surface coating. J. Am. Chem. Soc. 2010, 132, 5012–5014. 10.1021/ja909570v. [DOI] [PubMed] [Google Scholar]
- Ma X.; Sun X.; Hargrove D.; Chen J.; Song D.; Dong Q.; Lu X.; Fan T.; Fu Y.; Lei Y. A Biocompatible and Biodegradable Protein Hydrogel with Green and Red Autofluorescence: Preparation, Characterization and In Vivo Biodegradation Tracking and Modeling. Sci. Rep. 2016, 6, 19370. 10.1038/srep19370. [DOI] [PMC free article] [PubMed] [Google Scholar]
- Lee K.; Choi S.; Yang C.; Wu H.-C.; Yu J. Autofluorescence generation and elimination: a lesson from glutaraldehyde. Chem. Commun. 2013, 49, 3028–3030. 10.1039/c3cc40799c. [DOI] [PubMed] [Google Scholar]
- Maquet V.; Boccaccini A. R.; Pravata L.; Notingher I.; Jérôme R. Preparation, characterization, and in vitro degradation of bioresorbable and bioactive composites based on Bioglass-filled polylactide foams. J. Biomed. Mater. Res., Part A 2003, 66, 335–346. 10.1002/jbm.a.10587. [DOI] [PubMed] [Google Scholar]
- Shi W.; Li X.; Ma H. A Tunable Ratiometric pH Sensor Based on Carbon Nanodots for the Quantitative Measurement of the Intracellular pH of Whole Cells. Angew. Chem., Int. Ed. 2012, 51, 6432–6435. 10.1002/anie.201202533. [DOI] [PubMed] [Google Scholar]
- El Kadi N.; Taulier N.; Le Huérou J. Y.; Gindre M.; Urbach W.; Nwigwe I.; Kahn P. C.; Waks M. Unfolding and refolding of bovine serum albumin at acid pH: Ultrasound and structural studies. Biophys. J. 2006, 91, 3397–3404. 10.1529/biophysj.106.088963. [DOI] [PMC free article] [PubMed] [Google Scholar]
- Lanao R. P. F.; Jonker A. M.; Wolke J. G. C.; Jansen J. A.; van Hest J. C. M.; Leeuwenburgh S. C. G. Physicochemical properties and applications of poly(lactic-co-glycolic acid) for use in bone regeneration. Tissue Eng., Part B 2013, 19, 380. 10.1089/ten.teb.2012.0443. [DOI] [PMC free article] [PubMed] [Google Scholar]
- Brückner R.; Tylkowski M.; Hupa L.; Brauer D. S. Controlling the ion release from mixed alkali bioactive glasses by varying modifier ionic radii and molar volume. J. Mater. Chem. B 2016, 4, 3121–3134. 10.1039/c5tb02426a. [DOI] [PubMed] [Google Scholar]
- Ning P.; Hou L.; Feng Y.; Xu G.; Bai Y.; Yu H.; Meng X. Real-time visualization of autophagy by monitoring the fluctuation of lysosomal pH with a ratiometric two-photon fluorescent probe. Chem. Commun. 2019, 55, 1782–1785. 10.1039/c8cc09517e. [DOI] [PubMed] [Google Scholar]
- Lin B.; Fan L.; Ying Z.; Ge J.; Wang X.; Zhang T.; Dong C.; Shuang S.; Wong M. S. The ratiometric fluorescent probe with high quantum yield for quantitative imaging of intracellular pH. Talanta 2020, 208, 120279. 10.1016/j.talanta.2019.120279. [DOI] [PubMed] [Google Scholar]
- Wu Y.; Wong Y. S.; Fuh J. Y. H. Degradation behaviors of geometric cues and mechanical properties in a 3D scaffold for tendon repair. J. Biomed. Mater. Res., Part A 2017, 105, 1138–1149. 10.1002/jbm.a.35966. [DOI] [PubMed] [Google Scholar]
- Stastny P.; Sedlacek R.; Suchy T.; Lukasova V.; Rampichova M.; Trunec M. Structure degradation and strength changes of sintered calcium phosphate bone scaffolds with different phase structures during simulated biodegradation in vitro. Mater. Sci. Eng., C 2019, 100, 544–553. 10.1016/j.msec.2019.03.027. [DOI] [PubMed] [Google Scholar]
- Geissbuehler M.; Lasser T. How to display data by color schemes compatible with red-green color perception deficiencies. Opt. Express 2013, 21, 9862–9874. 10.1364/oe.21.009862. [DOI] [PubMed] [Google Scholar]


