

Abstract
The mesolimbic dopamine system comprises distinct compartments supporting different functions in learning and motivation. Less well understood is how complex addiction-related behaviors emerge from activity patterns across these compartments. Here we show how different forms of relapse to alcohol-seeking in male rats are assembled from activity across the VTA and the nucleus accumbens. First, we used chemogenetic approaches to show a causal role for VTA TH neurons in two forms of relapse to alcohol-seeking: renewal (context-induced reinstatement) and reacquisition. Then, using gCaMP fiber photometry of VTA TH neurons, we identified medial and lateral VTA TH neuron activity profiles during self-administration, renewal, and reacquisition. Next, we used optogenetic inhibition of VTA TH neurons to show distinct causal roles for VTA subregions in distinct forms of relapse. We then used dLight fiber photometry to measure dopamine binding across the ventral striatum (medial accumbens shell, accumbens core, lateral accumbens shell) and showed complex and heterogeneous profiles of dopamine binding during self-administration and relapse. Finally, we used representational similarity analysis to identify mesolimbic dopamine signatures of self-administration, extinction, and relapse. Our results show that signatures of relapse can be identified from heterogeneous activity profiles across the mesolimbic dopamine system and that these signatures are unique for different forms of relapse.
SIGNIFICANCE STATEMENT It is axiomatic that the actions of dopamine are critical to drug addiction. Yet how relapse to drug-seeking is assembled from activity across the mesolimbic dopamine system is poorly understood. Here we show how relapse to alcohol-seeking relates to activity in specific VTA and accumbens compartments, how these change for different forms of relapse, and how relapse-associated activity relates to activity during self-administration and extinction. We report the mesolimbic dopamine activity signatures for relapse and show that these signatures are unique for different forms of relapse.
Keywords: accumbens, dopamine, reinstatement, relapse, ventral tegmental area
Introduction
It is axiomatic that the actions of dopamine are critical to drug addiction. Dopamine mediates the reinforcing effects of drugs of abuse, instructs learning about behavioral as well as environmental antecedents to these effects, and contributes to action selection controlling drug-seeking and drug-taking (Everitt et al., 2008; Nutt et al., 2015; Luscher, 2016). Moreover, exposure to drugs of addiction can profoundly alter these functions (Volkow et al., 2017).
Much remains to be learned about these roles of dopamine in addiction, including how dopamine contributes to relapse. A persistent propensity to relapse is a diagnostic feature of drug addiction and remains a primary impediment to successful long-term treatment (American Psychiatric Association, 2013; Jonas et al., 2014). In animal models, dopamine mediates various forms of relapse to drug-seeking (cue, stress, priming, context/renewal reinstatement) because these can be prevented by systemic or local manipulation of VTA and nucleus accumbens (Acb) (McFarland and Kalivas, 2001; Schmidt et al., 2005; Bossert et al., 2007, 2013; Hamlin et al., 2007; Chaudhri et al., 2009; Mahler et al., 2014; Marchant and Kaganovsky, 2015; Gibson et al., 2018). However, the mesolimbic dopamine system has a complex architecture. VTA dopamine neurons form channels linked to differences in behavioral and motivational function (Lammel et al., 2008, 2011, 2012; Cohen et al., 2012; Watabe-Uchida et al., 2012; Tian et al., 2016; Saunders et al., 2018; de Jong et al., 2019; Heymann et al., 2020). In turn, there are distinct profiles of dopamine release and binding across compartments of the ventral striatum, giving rise to different functions (de Jong et al., 2019; Mohebi et al., 2019).
Relapse is presumably assembled from activity across the mesolimbic dopamine system. But how relapse relates to activity in specific VTA and accumbens compartments, whether this is the same for different forms of relapse and how relapse-associated activity relates to activity during self-administration or extinction/abstinence are each poorly understood. Here we answered these questions by studying the temporal dynamics of activity across spatially distinct compartments of the mesolimbic dopamine system during self-administration, extinction, renewal (context-induced reinstatement), and reacquisition of alcohol-seeking. We also studied the causal roles of this activity in producing relapse during renewal and reacquisition. Our findings show that signatures of relapse can be identified from heterogeneous activity profiles across the mesolimbic dopamine system and that these signatures are unique for different forms of relapse.
Materials and Methods
Subjects
Subjects were adult male Long-Evans (School of Psychology, University of New South Wales) or Th-Cre (SD- Th-cretm1sage) (Sage Laboratories) rats. They were housed in ventilated racks, in groups of 4, on corn cob bedding in a climate-controlled colony room maintained on 12:12 h light/dark cycle (0700 lights on). Rats had free access to food (Gordon's Rat Chow) and water until 2 d before commencement of behavioral training when they received 1 h of access to food and water each day for the remainder of the experiment. All subjects were randomly allocated to experimental conditions. All studies were performed in accordance with the Animal Research Act 1985 (New South Wales), under the guidelines of the National Health and Medical Research Council Code for the Care and Use of Animals for Scientific Purposes in Australia (2013). The University of New South Wales Animal Care and Ethics Committee approved all procedures.
Viral vectors
pAAV-hSyn-DIO-hM4D(Gi)-mCherry was a gift from Bryan Roth (Addgene, viral prep #44362-AAV5; http://n2t.net/addgene:44362: RRID:Addgene_44362, 5.4 × 10¹² vp/ml). pAAV-hSyn-dF-HA-KORD-IRES-mCitrine was a gift from Bryan Roth (Addgene, viral prep #65417-AAV8; http://n2t.net/addgene:65417: RRID:Addgene_65417). pAAV.Syn.Flex.GCaMP6f.WPRE.SV40 was a gift from Douglas Kim and GENIE Project (Addgene, viral prep #100833-AAV5; http://n2t.net/addgene:100833; RRID:Addgene_100833). AAV5-hSyn-DIO-eYFP (4.1 × 10¹² vp/ml) and AAV5-hSyn-eNpHR3.0-eYFP (7.7 × 10¹² vp/ml) were obtained from UNC Vector core from plasmids as gifts from Karl Deisseroth. pAAV-CAG-dLight1.1 was a gift from Lin Tian (Addgene, viral prep #111067-AAV5; http://n2t.net/addgene:111067; RRID:Addgene_111067).
Surgeries and injections
Rats were anaesthetized via intraperitoneal injection with a mixture of 1.3 ml/kg ketamine anesthetic (Ketamil; Troy Laboratories) at a concentration of 100 mg/ml and 0.3 ml/kg of the muscle relaxant xylazine (Xylazil; Troy Laboratories) at a concentration of 20 mg/ml. Rats received a subcutaneous injection of 0.1 ml 50 mg/ml carprofen (Pfizer) before being placed in the stereotaxic frame (Kopf Instruments). Rats received stereotaxic surgery using the flat skull coordinates relative to bregma shown in Table 1.
Table 1.
Stereotaxic coordinates
| Location | AP (mm frombregma) | ML (mm frombregma) | DV (mm frombregma) |
|---|---|---|---|
| VTA AAV (bilateral) | –5.8 | ±2.25 (10° angle) | –8.3 |
| mVTA AAV (unilateral) | –5.8 | –0.5 | –8.15 |
| lVTA AAV (unilateral) | –5.8 | –1 | –8.15 |
| VTA optic fibers (bilateral) | –5.8 | ±2.25 (10° angle) | –7.8 |
| mVTA optic fibers (unilateral) | –5.8 | –0.5 | –7.65 |
| lVTA optic fibers (unilateral) | –5.8 | –1 | –7.65 |
| AcbShM and AcbC AAV(unilateral) | 1.2 | –0.8 | –7.5 |
| AcbShL AAV (unilateral) | 1.2 | –2.8 | –7.5 |
| AcbShM and AcbC opticfibers (unilateral) | 1.2 | –0.8 | –7 |
| AcbShL optic fibers (unilateral) | 1.2 | –2.8 | –7 |
Vectors (0.5 μl hM4Di and KORD, 0.75 μl otherwise) were infused with a 23-gauge, cone-tipped 5 μl stainless-steel injector (SGE Analytical Sciences) over 3 min using an infusion pump (UMP3 with SYS4 Micro-controller, World Precision Instruments). The needle was left in place for 7 min to allow for diffusion of and reduce spread up the infusion tract. Optic cannulae for relevant experiments were implanted during a concurrent stereotaxic procedure and secured using jeweler's screws and dental cement (Vertex Dental). At the end of surgery, rats received an intraperitoneal injection of 0.2 ml of 150 mg/ml solution of procaine penicillin (Benacillin; Troy Laboratories) and 0.2 ml of 100 mg/ml cephazolin sodium (AFT Pharmaceuticals). All rats were monitored daily for weight and/or behavioral changes.
Apparatus
Standard rat operant chambers (ENV-008) (Med Associates) with dimensions 29.5 cm (width) × 24.8 cm (length) × 18.7 cm (height) were used for all alcohol self-administration and extinction procedures. The chambers contained two nosepoke holes symmetrically located on one sidewall of the chamber, 3 cm above a grid floor. A recessed magazine was located behind a 4 × 4 cm opening in the center of the same wall between the two nosepokes. Responding on one (active) nosepoke extinguished the cue light in the nosepoke and triggered a syringe pump to deliver alcoholic beer to the magazine during acquisition training, whereas responding on the other (inactive) nosepoke had no programmed consequences (Table 2). A computer running MedPC-IV software controlled all events. For optogenetic experiments, an LED plus fiberoptic rotary joint and LED driver (Doric Lenses) was suspended above each chamber and controlled by MedPC-IV. For fiber photometry, the patch cable was supported by a gimbal and counterweighted arm.
Table 2.
Responding at the end of acquisition and extinction training for each group in each experiment
| Experiment | Day | Group | Manipulanda | Mean | SEM |
|---|---|---|---|---|---|
| VTA hM4Di | Day 10 | eYFP | Active | 154.5 | 14.1 |
| Inactive | 2.3 | 0.6 | |||
| hM4Di | Active | 142.5 | 17.4 | ||
| Inactive | 0.5 | 0.6 | |||
| Extinction 1 | eYFP | Active | 30.3 | 5.3 | |
| Inactive | 4.8 | 1.3 | |||
| hM4Di | Active | 23.1 | 3 | ||
| Inactive | 3.4 | 0.8 | |||
| Extinction 2 | eYFP | Active | 26 | 7.3 | |
| Inactive | 5.2 | 1 | |||
| hM4Di | Active | 16.1 | 2 | ||
| Inactive | 3.8 | 0.8 | |||
| Extinction 3 | eYFP | Active | 18.3 | 5.1 | |
| Inactive | 4.8 | 0.9 | |||
| hM4Di | Active | 15.9 | 3.3 | ||
| Inactive | 3.1 | 0.7 | |||
| Extinction 4 | eYFP | Active | 11.7 | 1.4 | |
| Inactive | 2.5 | 0.6 | |||
| hM4Di | Active | 10.25 | 1.3 | ||
| Inactive | 2.1 | 0.4 | |||
| VTA KORD | Day 10 | eYFP | Active | 145.6 | 25.3 |
| Inactive | 2.6 | 1.3 | |||
| KORD | Active | 116.9 | 18.9 | ||
| Inactive | 1.3 | 0.3 | |||
| Extinction 1 | eYFP | Active | 36.9 | 7.7 | |
| Inactive | 5.1 | 0.9 | |||
| KORD | Active | 55 | 11.3 | ||
| Inactive | 6.1 | 0.9 | |||
| Extinction 2 | eYFP | Active | 18.8 | 3.6 | |
| Inactive | 4.3 | 0.8 | |||
| KORD | Active | 32.9 | 3.1 | ||
| Inactive | 4.4 | 0.8 | |||
| Extinction 3 | eYFP | Active | 29.1 | 8.1 | |
| Inactive | 4.8 | 1 | |||
| KORD | Active | 30.1 | 5.2 | ||
| Inactive | 9.1 | 2.2 | |||
| Extinction 4 | eYFP | Active | 20.1 | 1 | |
| Inactive | 6.6 | 1.1 | |||
| KORD | Active | 16.1 | 3.9 | ||
| Inactive | 6.9 | 3.0 | |||
| VTA gCaMP | Day 10 | gCaMP | Active | 104.5 | 11.1 |
| Inactive | 1.0 | 0.2 | |||
| Extinction 1 | gCaMP | Active | 39.2 | 3.7 | |
| Inactive | 3.5 | 0.4 | |||
| Extinction 2 | gCaMP | Active | 19.8 | 2.0 | |
| Inactive | 3.8 | 0.7 | |||
| Extinction 3 | gCaMP | Active | 16.4 | 3.2 | |
| Inactive | 3.3 | 0.7 | |||
| Extinction 4 | gCaMP | Active | 6.5 | 0.7 | |
| Inactive | 3.1 | 0.8 | |||
| VTA eNpHR3.0 | Day 10 | eYFP | Active | 113.9 | 16.6 |
| Inactive | 1.4 | 0.3 | |||
| eNpHR3.0mVTA | Active | 112.8 | 19.1 | ||
| Inactive | 3.7 | 2.3 | |||
| eNpHR3.0 | Active | 112.8 | 20.2 | ||
| lVTA | Inactive | 4.8 | 1.1 | ||
| Extinction 1 | eYFP | Active | 39.1 | 7.1 | |
| Inactive | 7.6 | 1.8 | |||
| eNpHR3.0 | Active | 50.2 | 15.6 | ||
| mVTA | Inactive | 7.2 | 1.7 | ||
| eNpHR3.0 | Active | 44.2 | 10 | ||
| lVTA | Inactive | 8.8 | 1.9 | ||
| Extinction 2 | eYFP | Active | 24.5 | 5.1 | |
| Inactive | 8.4 | 3.9 | |||
| eNpHR3.0 | Active | 27.3 | 5.7 | ||
| mVTA | Inactive | 10.7 | 6.7 | ||
| eNpHR3.0 | Active | 19.9 | 3.4 | ||
| lVTA | Inactive | 5 | 2.0 | ||
| Extinction 3 | eYFP | Active | 3.9 | 0.9 | |
| Inactive | 1.5 | 0.4 | |||
| eNpHR3.0 | Active | 10.7 | 2.2 | ||
| mVTA | Inactive | 1 | 0.4 | ||
| eNpHR3.0 | Active | 8.5 | 1.8 | ||
| lVTA | Inactive | 2.2 | 0.7 | ||
| Extinction 4 | eYFP | Active | 11 | 2.1 | |
| Inactive | 14.8 | 9.8 | |||
| eNpHR3.0 | Active | 16.7 | 5.6 | ||
| mVTA | Inactive | 3.0 | 1.2 | ||
| eNpHR3.0 | Active | 14.0 | 6.0 | ||
| lVTA | Inactive | 1.5 | 0.5 | ||
| SCH31966 | Day 10 | 0 | Active | 75.1 | 7.2 |
| Inactive | 0.8 | 0.3 | |||
| 0.025 | Active | 65.3 | 10.6 | ||
| Inactive | 2.6 | 0.6 | |||
| 0.1 | Active | 87.9 | 17.8 | ||
| Inactive | 1.8 | 0.7 | |||
| 0.25 | Active | 93.6 | 15.8 | ||
| Inactive | 1.9 | 0.6 | |||
| Extinction 1 | 0 | Active | 32.4 | 4.0 | |
| Inactive | 5.4 | 0.8 | |||
| 0.025 | Active | 30.5 | 7.4 | ||
| Inactive | 8.9 | 4.7 | |||
| 0.1 | Active | 32.6 | 4.8 | ||
| Inactive | 5.3 | 1.3 | |||
| 0.25 | Active | 36.1 | 8.0 | ||
| Inactive | 7.6 | 1.6 | |||
| Extinction 2 | 0 | Active | 18.6 | 5.4 | |
| Inactive | 2.0 | 0.3 | |||
| 0.025 | Active | 15.6 | 2.4 | ||
| Inactive | 4.0 | 1.7 | |||
| 0.1 | Active | 24.1 | 3.2 | ||
| Inactive | 3.4 | 1.1 | |||
| 0.25 | Active | 20.3 | 5.5 | ||
| Inactive | 2.8 | 0.8 | |||
| Extinction 3 | 0 | Active | 10.5 | 2.5 | |
| Inactive | 1.8 | 0.6 | |||
| 0.025 | Active | 10.5 | 1.5 | ||
| Inactive | 2.8 | 0.6 | |||
| 0.1 | Active | 14.5 | 1.7 | ||
| Inactive | 3.1 | 0.7 | |||
| 0.25 | Active | 8.4 | 2.3 | ||
| Inactive | 3.1 | 0.8 | |||
| Extinction 4 | 0 | Active | 8.4 | 2.5 | |
| Inactive | 1.1 | 0.3 | |||
| 0.025 | Active | 8.4 | 1.0 | ||
| Inactive | 1.6 | 0.5 | |||
| 0.1 | Active | 11.3 | 2.3 | ||
| Inactive | 1.9 | 0.5 | |||
| 0.25 | Active | 9.6 | 2.4 | ||
| Inactive | 1.5 | 0.6 | |||
| Acb dLight | Day 10 | dLight | Active | 109.4 | 22.1 |
| Inactive | 0.8 | 0.3 | |||
| Extinction 1 | dLight | Active | 39.2 | 6.6 | |
| Inactive | 6 | 2.7 | |||
| Extinction 2 | dLight | Active | 19 | 5.1 | |
| Inactive | 3.3 | 1.1 | |||
| Extinction 3 | dLight | Active | 19.4 | 5.3 | |
| Inactive | 2.4 | 0.6 | |||
| Extinction 4 | dLight | Active | 16.2 | 4.8 | |
| Inactive | 1.4 | 0.4 |
The eight self-administration chambers were divided into two groups of four to serve as distinct contexts for experiments with context as a factor. These chambers differed in their olfactory (rose vs peppermint essence), tactile (grid vs Perspex flooring), and visual (light on vs off) properties. These two contexts were counterbalanced to serve as the training (Context A) and extinction (Context B) contexts. All fiberoptic cannulae and patch cables were hand fabricated and tested using parts from Thor Labs. Construction procedure was adapted from the protocol described (Sparta et al., 2011). Fiberoptic cannulae and patch cables were fabricated from 0.39 NA, Ø400 μm core multimode optical fiber and ceramic ferrules (Thor Labs).
Locomotor chambers (ENV-515) (Med Associates) with dimensions 43.4 cm (width) × 43.4 cm (length) × 30.3 cm (height) were used for locomotor assessment. Movement was tracked with three 16 beam infrared arrays. Infrared beams were located on both the × and y axes for positional tracking.
Behavioral procedures
General behavioral testing procedures
All behavioral procedures commenced a minimum of 4 weeks after surgery. On the first 2 d, the rats received 20 min magazine training sessions in Context A and Context B each day, in a counterbalanced order. During these sessions, there were 10 noncontingent deliveries of 0.6 ml of the reward (4% alcohol (v/v) decarbonated beer; Coopers Brewing) at time intervals variable around a mean of 1.2 min. On the next 10 d, rats received self-administration training in Context A for 1 h per day (unless otherwise stated). Responding on the active nosepoke extinguished the nosepoke cue light and triggered delivery via syringe pump of 0.6 ml alcoholic beer to the magazine on an FR-1 schedule followed by a 24 s timeout. Responses on the inactive nosepoke were recorded but had no consequences. On the next 4 d, rats received extinction training in Context B for 1 h per day (unless otherwise stated). During this training, responses on the active nosepoke extinguished the cue light and triggered the pump but no beer was delivered.
Testing commenced 24 h after extinction. Rats were tested for 1 h in the extinction context (ABB) and for 1 h in the training context (ABA) for expression of extinction and renewal (context-induced reinstatement), respectively. The order of tests was counterbalanced, and tests were 24 h apart. Tests were identical to self-administration, except that the syringe pump was empty. Rats were tested 24 h later for 1 h reacquisition of alcoholic beer seeking in the training context. Our past research has shown no impact of the prior order of ABA and ABB testing on responding during reacquisition. Unless otherwise stated, tests lasted 60 min. We selected these procedures based on our past work that has shown robust context-induced reinstatement and reacquisition under these conditions (Hamlin et al., 2007; Gibson et al., 2018).
Chemogenetic hM4Di inhibition of VTATh neurons on renewal, reacquisition, and locomotor activity
There were two groups of Th Cre+/− rats. Group enhanced yellow fluorescent protein (eYFP, n = 6) received AAV5-hSyn-DIO-eYFP, whereas group hM4Di (n = 8) received AAV5-hSyn-DIO-hM4D(Gi)-mCherry bilaterally in the VTA. Rats were trained, extinguished, and tested as described above. Clozapine (#C6305, Sigma Millipore) was dissolved in 5% DMSO and saline to desired final concentrations (1 ml/kg diluted). Rats received an intraperitoneal injection 0.1 mg/kg of clozapine 15 min before tests. They then received 2 d of 30 min habituation each day in locomotor chambers, rats were tested for locomotor activity (30 min) 15 min after intraperitoneal injection of saline or clozapine. The order of tests (saline or clozapine) were counterbalanced and 24 h apart.
Chemogenetic KORD inhibition of VTATh neurons on reacquisition
There were two groups of Th Cre+/− rats. Group eYFP (n = 8) received AAV5-hSyn-DIO-eYFP, whereas group hM4Di (n = 8) received AAV8-hSyn-DIO-KORD-mCitrine, bilaterally in the VTA. Rats were trained, extinguished, and tested as described above, with the exceptions that all training and testing occurred in a single context and rats were tested for reacquisition only, 24 h after last extinction session. Rats were injected subcutaneously with salvinorin B (Apple Pharms Ingredients, 15 mg/kg) dissolved in 100% DMSO (0.5 ml/kg) 15 min before reacquisition. Rats had been habituated to the subcutaneous injection procedure via four daily injections (0.5 ml/kg, 100% DMSO).
Fiber photometry of Ca2+ transients in VTATh neurons during acquisition, extinction, renewal, and reacquisition
There was one group of Th Cre+/− rats (n = 24) with fibers targeted unilaterally at the lVTA (n = 16) or mVTA (n = 8). Rats received AAV5-hSyn.Flex.GCaMP6f.WPRE.SV40 unilaterally in the VTA. Rats were trained, extinguished, and tested as described above. Fiber photometry recordings were made on days 2 and 10 of self-administration training and day 1 of extinction training. Six animals were not recorded on day 2 of acquisition (3 lVTA, 3 mVTA). These sessions were 60 min duration, and recordings were made for the first 30 min. Recordings were also made during tests for extinction (ABB), renewal (ABA), and reacquisition. These sessions were 30 min in duration, and recordings were made for 30 min.
Optogenetic inhibition of VTA on renewal and reacquisition
There was one group of Th Cre−/− rats (n = 8) and two groups of Cre+/− rats (N = 12) with fibers targeted bilaterally at lVTA (n = 6) or mVTA (n = 6). Rats were trained and tested as described above, except the test sessions were 30 min in duration. During tests, rats were connected to patch cables attached to 625 nm LEDs (Doric Lenses) and received optical stimulation for 10 s after each nosepoke during the FR (Nosepoke+) but not during the timeout (Nosepoke–). Rats had been habituated to patch cables on days 6 and 7 of acquisition and days 2 and 3 of extinction.
D1 dopamine receptor antagonist on renewal, reacquisition, and locomotor activity
There were four groups injected with 0 (n = 8), 0.025 (n = 8), 0.1 (n = 8), or 0.25 (n = 8) mg/kg SCH39166 dissolved in saline (1 ml/kg). Rats were trained, extinguished, and tested as described above. Rats received subcutaneous injections of SCH39166 or saline 15 min before test sessions. They then received 2 d of 30 min habituation to the locomotor chambers before being tested for locomotor activity (30 min). Rats all received subcutaneous injection of saline and SCH39166 at the same dose they had received during relapse tests. The order of these tests (saline and SCH39166) was counterbalanced and tests were 24 h apart.
Fiber photometry of dopamine transients in Acb during acquisition, extinction, renewal, and reacquisition
There were three groups with AAV and fibers targeted unilaterally at the accumbens shell (AcbShM) (n = 6), Acb core (AcbC) (n = 7), or lateral accumbens shell (AcbShL) (n = 5). Rats received AAV5-CAG-dLight1.1 and optic fibers unilaterally in the Acb. Fiber photometry recordings were made on days 2 and 10 of self-administration training and day 1 of extinction training. These sessions were 60 min duration, and recordings were made for the first 30 min. Recordings were also made during tests for extinction (ABB), renewal (ABA), and reacquisition. These sessions were 30 min in duration, and recordings were made for 30 min.
Fiber photometry
Recordings were performed using Fiber Photometry Systems from Doric Lenses and Tucker Davis Technologies (RZ5P, Synapse). Two excitation wavelengths, 465 nm (Ca2+-dependent signal) and 405 nm (isosbestic control signal) emitted from LEDs (465 nm: LEDC1-B_FC, 405 nm: LEDC1-405_FC; Doric Lenses), controlled via dual channel programmable LED drivers (LEDD_4, Doric Lenses), were channeled into 0.39 NA, Ø400 μm core multimode prebleached patch cables via a Doric Dual Fluorescence Mini Cube (FMC2, Doric Lenses). Light intensity at the tip of the patch was maintained at 10-30 µW across sessions. GCaMP6, dLight1.1, and isosbestic fluorescence wavelengths were measured using femtowatt photoreceivers (Newport, 2151). Synapse software controlled and modulated excitation lights (465 nm: 209 Hz; 405 nm: 331 Hz), as well as demodulated and low-pass filtered (3 Hz) transduced fluorescence signals in real time via the RZ5P. Synapse/RZ5P also received Med-PC signals to record behavioral events and experimenter-controlled stimuli in real time.
Slice preparation
Brain slices were prepared from TH-Cre+ rats that received AAV-EF1α-DIO-eNpHR3.0-EYFP to VTA, at least 6 weeks before slice preparation. Three neuroprotective ACSF solutions were used in slice preparation: (1) cutting ACSF composed of 95 mm NaCl, 2.5 mm KCl, 30 mm NaHCO3, 1.2 mm NaH2PO4, 20 mm HEPES, 25 mm glucose, 5 mm ascorbate, 2 mm thiourea, 3 mm sodium pyruvate, 0.5 mm CaCl2, and 10 mm MgSO4; (2) recovery ACSF, containing equimolar N-methyl-D-glucamine in place of NaCl; and (3) holding ACSF, identical to cutting ACSF, but with 2 mm CaCl2, and 2 mm MgSO4. All solutions were pH-adjusted to 7.3-7.4 with HCl or NaOH and gassed with carbogen (95% O2/5% CO2).
Rats were deeply anaesthetized with isoflurane (5%), decapitated, and the brain rapidly removed and submerged in an ice-cold cutting ACSF. After 3-4 min, the brain was trimmed, glued to a chilled vibratome chamber, and submerged in cutting ACSF. Coronal slices (300 µm) were made using a vibratome (model VT1200, Leica Microsystems), incubated for 10 min in a 30°C in the recovery ACSF, and then transferred to a Braincubator (Payo Scientific) and held at 18°C in holding-ACSF until used for recording.
Whole-cell patch-clamp recordings
For recordings, slices were transferred to a recording chamber and continuously perfused (2 ml min-1) with ACSF (30°C) containing the following (in mm): 124 NaCl, 3 KCl, 26 NaHCO3, 1.2 NaH2PO4, 10 glucose, 2.5 CaCl2, and 1.3 MgCl2. Whole-cell patch-clamp recordings were made from visually identified neurons using a microscope (Axio Examiner D1, Carl Zeiss) equipped with a 20× water immersion objective (1.0 NA), an LED fluorescence illumination system (pE-2, CoolLED), and an EMCCD camera (iXon+, Andor Technology). Patch pipettes (3-5 mΩ) were filled with an internal solution containing the following (in mm): 130 potassium gluconate, 10 KCl, 10 HEPES, 4 Mg2-ATP, 0.3 Na3-GTP, 0.3 EGTA, 10 phosphocreatine disodium salt, pH 7.3, with KOH, 280-290 mOsm. Electrophysiological recordings were amplified using a Multiclamp amplifier (700B, Molecular Devices), filtered at 6 kHz, digitized at 20 kHz with a Digidata1440A (Molecular Devices) interface, and controlled using AxoGraph. Neurons were stimulated by 530 nm LED illumination delivered through the objective. Electrophysiological data were analyzed offline using Axograph. Only recordings with series resistance < 20 mΩ and membrane resistance > 80 mΩ were included in the dataset. Data were not corrected for liquid junction potentials.
Histology
eYFP/mCherry immunohistochemistry
Rats were deeply anesthetized with sodium pentobarbital (100 mg/kg, i.p.; Virbac) and perfused transcardially with 200 ml of 0.9% saline, containing heparin (360 μl/L), and sodium nitrite (12.5 ml/L), followed by 400 ml of 4% PFA in 0.1 m PB, pH 7.4. Brains were extracted from the skull and postfixed for 1 h in the same fixative and then placed in 20% sucrose solution overnight. Brains were frozen and sectioned coronally at 40 μm using a cryostat (Leica Microsystems, CM1950).
To visualize eYFP, mCherry, mCitrine immunoreactivity (rabbit anti-eGFP polyclonal antibody, catalog #AA11122; RRID:AB_221569; rabbit anti-mCherry polyclonal antibody, catalog #PA5-34 974; RRID:AB_2552323, Thermo Fisher Scientific), four serially adjacent sets of sections from the ROIs were obtained from each brain and stored in 0.1% sodium azide in 0.1 m PBS, pH 7.2. Sections were washed in 0.1 m PB, followed by 50% ethanol, 50% ethanol with 3% hydrogen peroxidase, then 5% normal horse serum (NHS) in PB (30 min each). Sections were then incubated in rabbit antiserum against eGFP or mCherry (1:2000; Thermo Fisher Scientific) in a PB solution containing 2% NHS and 0.2% Triton X-100 (48 h at 4°C). The sections were then washed and incubated in biotinylated donkey anti-rabbit (1:1000; 24 h at 4C; biotin donkey anti-rabbit catalog #711-065-152; RRID:AB_2540016, Jackson ImmunoResearch Laboratories). Finally, sections were incubated in avidin-biotinylated HRP complex (6 μl/ml avidin and 6 μl/ml biotin; 2 h at room temperature; Vector Laboratories), washed in PB, and then incubated for 15 min in a DAB solution containing 0.1% 3,3-diaminobenzidine, 0.8% D-glucose, and 0.016% ammonium chloride. Immunoreactivity was catalyzed by the addition of 0.2 μl/ml glucose oxidase aspergillus (24 mg/ml, 307 U/mg, Sigma Millipore). Brain sections were then washed in PB, mounted onto gelatin-coated slides, dehydrated, cleared in histolene, coverslipped with Entellan (Proscitech), and assessed using a BX50 transmitted light microscope (Olympus) or Axio Scan.Z1 slide scanner (Carl Zeiss).
Double fluorescence immunohistochemistry
Rats were deeply anesthetized with sodium pentobarbital (100 mg/kg, i.p.; Virbaca) and perfused transcardially with 200 ml of 0.9% saline, containing heparin (360 μl/L) and sodium nitrite (12.5 ml/L), followed by 400 ml of 4% PFA in 0.1 m PB, pH 7.4. Brains were extracted from the skull and postfixed for 1 h in the same fixative and then placed in 20% sucrose solution overnight. Brains were frozen and sectioned coronally at 40 μm using a cryostat (Leica Microsystems, CM1950). Four serially adjacent sets of sections from the ROIs were obtained from each brain and stored in 0.1% sodium azide in 0.1 m PBS, pH 7.2. Free-floating sections were washed repeatedly in 0.1 m PBS, pH 7.2, followed by a 2 h incubation in PBS, pH 7.2, containing 10% normal donkey serum and 0.2% Triton X-100. Sections were then incubated in the primary antibodies diluted in 0.1 m PBS, pH 7.2, containing 0.1% sodium azide, 2% NHS, and 0.2% Triton X-100, for 48 h at room temperature, with gentle agitation. The primary antibodies used were sheep anti-TH (1:1000; Sheep Anti-TH Polyclonal Antibody; catalog #PA1-4679; RRID:AB_561880; Thermo Fisher Scientific) and rabbit anti-eGFP (1:1000; Rabbit Anti-eGFP Polyclonal Antibody; catalog #A-11122; RRID:AB_221569; Thermo Fisher Scientific). After washing off unbound primary antibodies, sections were then incubated for 4 h at room temperature in secondary antibodies diluted in 0.1 m PBS, pH 7.2 containing 2% NHS and 0.2% Triton X-100 (PBST-X). The secondary antibodies used were Alexa-488 donkey anti-rabbit (1:500; Donkey Anti-Rabbit IgG (H + L) Highly Cross-Adsorbed Secondary Antibody, AlexaFluor-488; catalog #A-21206; RRID:AB_2535792; Thermo Fisher Scientific) and Alexa-594 donkey anti-goat (1:500; Donkey Anti-Goat IgG (H + L) Cross-Adsorbed Secondary Antibody, AlexaFluor-594; catalog #A-11058; RRID:AB_2534105; Thermo Fisher Scientific). After washing off unbound secondary antibodies, sections were mounted onto gelatin-treated slides and coverslipped with Permafluor mounting medium (Thermo Fisher Scientific). Fluorescent images were taken by Olympus BX53 upright microscope (Olympus).
Experimental design and statistical analyses
Data in figures are represented as mean ± SEM unless otherwise stated. Group numbers for each experiment are indicated at two locations: (1) under the subheadings of Behavioral procedures above and (2) in Results. Group sizes were based on past experience with these preparations showing that they were sufficient to detect large (d = 0.8) effect sizes in behavioral studies with at least 80% power.
Inclusion criteria
The criteria for inclusion in final analyses were correct adeno-associated virus (AAV) and fiber placements as determined after histology. Data in figures represent mean ± SEM unless otherwise stated.
Behavioral analyses
Our primary behavioral-dependent variables were numbers of active nosepokes, inactive nosepokes, and distance traveled (locomotor activity). These were analyzed by means of ANOVA, and analyses involving repeated measures adopted a multivariate approach (Harris, 2004). All analyses partitioned variances into main effect and interaction terms using Psy Statistical Package (Bird, 2004).
Fiber photometry analyses
For fiber photometry, the primary dependent variables were Ca2+ or dopamine transients around nosepokes and magazine entries during training (Sessions 2 and 10), extinction (Session 1), extinction test (ABB), renewal test (ABA), and reacquisition. These data were analyzed using custom MATLAB scripts.
Specifically, for gCaMP experiments, Ca2+-dependent and Ca2+-independent (isosbestic) signals during recording sessions were extracted and downsampled (15.89 samples/s); signals around logged disconnections were removed before further signal processing. The isosbestic signal was regressed onto the Ca2+-dependent signal to create a fitted isosbestic signal, and a fractional fluorescence signal ΔF/F was calculated via subtracting fitted 405 nm signal from 465 nm channels and then dividing by the fitted 405 nm signal. This produces a motion-artifact-corrected Ca2+ signal with a mean of ∼0. ΔF/F signal was detrended via 90 s moving average (convolution window), and high-frequency noise (determined via fast Fourier transform) was removed via 2 Hz low-pass filter.
We used three different analysis strategies to ask different questions of these photometry data. First, ΔF/F within a time window around events was compiled. To determine significant event-related transients within this window, a bootstrapping CI procedure (95% CI, 1000 bootstraps) was used (Jean-Richard-dit-Bressel et al., 2020). A distribution of bootstrapped ΔF/F means was generated by randomly resampling from trial ΔF/F waveforms, with replacement, for the same number of trials. A CI was obtained per time point using the 2.5 and 97.5 percentiles of the bootstrap distribution, which was then expanded by a factor of sqrt(n/(n – 1)) to adjust for narrowness bias (Jean-Richard-dit-Bressel et al., 2020). Significant transients were defined as periods whose 95% CI did not contain 0 (baseline) for at least 0.5 s (low-pass filter threshold). A similar analysis procedure was used for dLight experiments, signals (465 nm, 405 nm) were downsampled and processed (logged disconnections removed, ΔF/F obtained using fitted isosbestic). Then, signals were low-pass filtered at 3 Hz. Waveform kernels were obtained by normalizing each trial waveform according to its sum square deviation from 0 and were used for all analyses. Significant transients were defined as periods whose 95% CI (derived as per the above) did not contain 0 continuously (minimum 1/3 s).
Second, we compared photometry signals between renewal and reacquisition per brain region. We did these via univariate analyses on event-related activity across trials, controlling for subject as a covariate.
Third, we used a multivariate approach, representational similarity analysis (RSA), to ask whether the patterns of activity during one session were similar to the patterns of activity during another session and to compare cross-sensor and cross-brain region similarity. RSA (Kriegeskorte et al., 2008a,b; Nili et al., 2014) is a modality-independent way of comparing activity patterns. To this end, the dissimilarity of two perievent kernel waveforms was quantified using correlation distance (1 – Pearson correlation) of the mean trial kernel waveforms (±3s around events). A first-order representational dissimilarity matrix (RDM) was formed from the pairwise correlation distances, indicating the degree to which each pair of waveforms are similar/dissimilar. These first-order RDMs represent dissimilarity in activity patterns to nosepokes across session for each brain region (see Figs. 3B,C, 7A–C) and were generated using custom MATLAB scripts. A cross-experiment first-order RDM was constructed using the same methodology (correlation distance of perievent activity), using the mean Nosepoke+ (active nosepoke that triggered pump) kernel across sessions and brain regions as inputs. The dissimilarity in the dissimilarity matrices was assessed using second-order RSA (Kriegeskorte et al., 2008a) (see Fig. 8). Instead of comparing gCaMP or dLight activity, second-order RSA compares first-order RDMs. By abstracting from underlying data, second-order RSA is modality-independent and can be used to compare similarities across different brain regions, different subjects, and in disparate data types (e.g., fMRI, neuron spiking) (for review, see Kriegeskorte et al., 2008a). For dissimilarity of different brain region activity profiles (see Fig. 8B), the correlation distance (1 – Spearman correlation) between single brain region RDMs (cross-session RDM) was calculated. For dissimilarity of different session activity profiles (see Fig. 8C), the correlation distance (1 – Spearman correlation) between single-session RDMs (cross-region RDM) was calculated.
Figure 3.
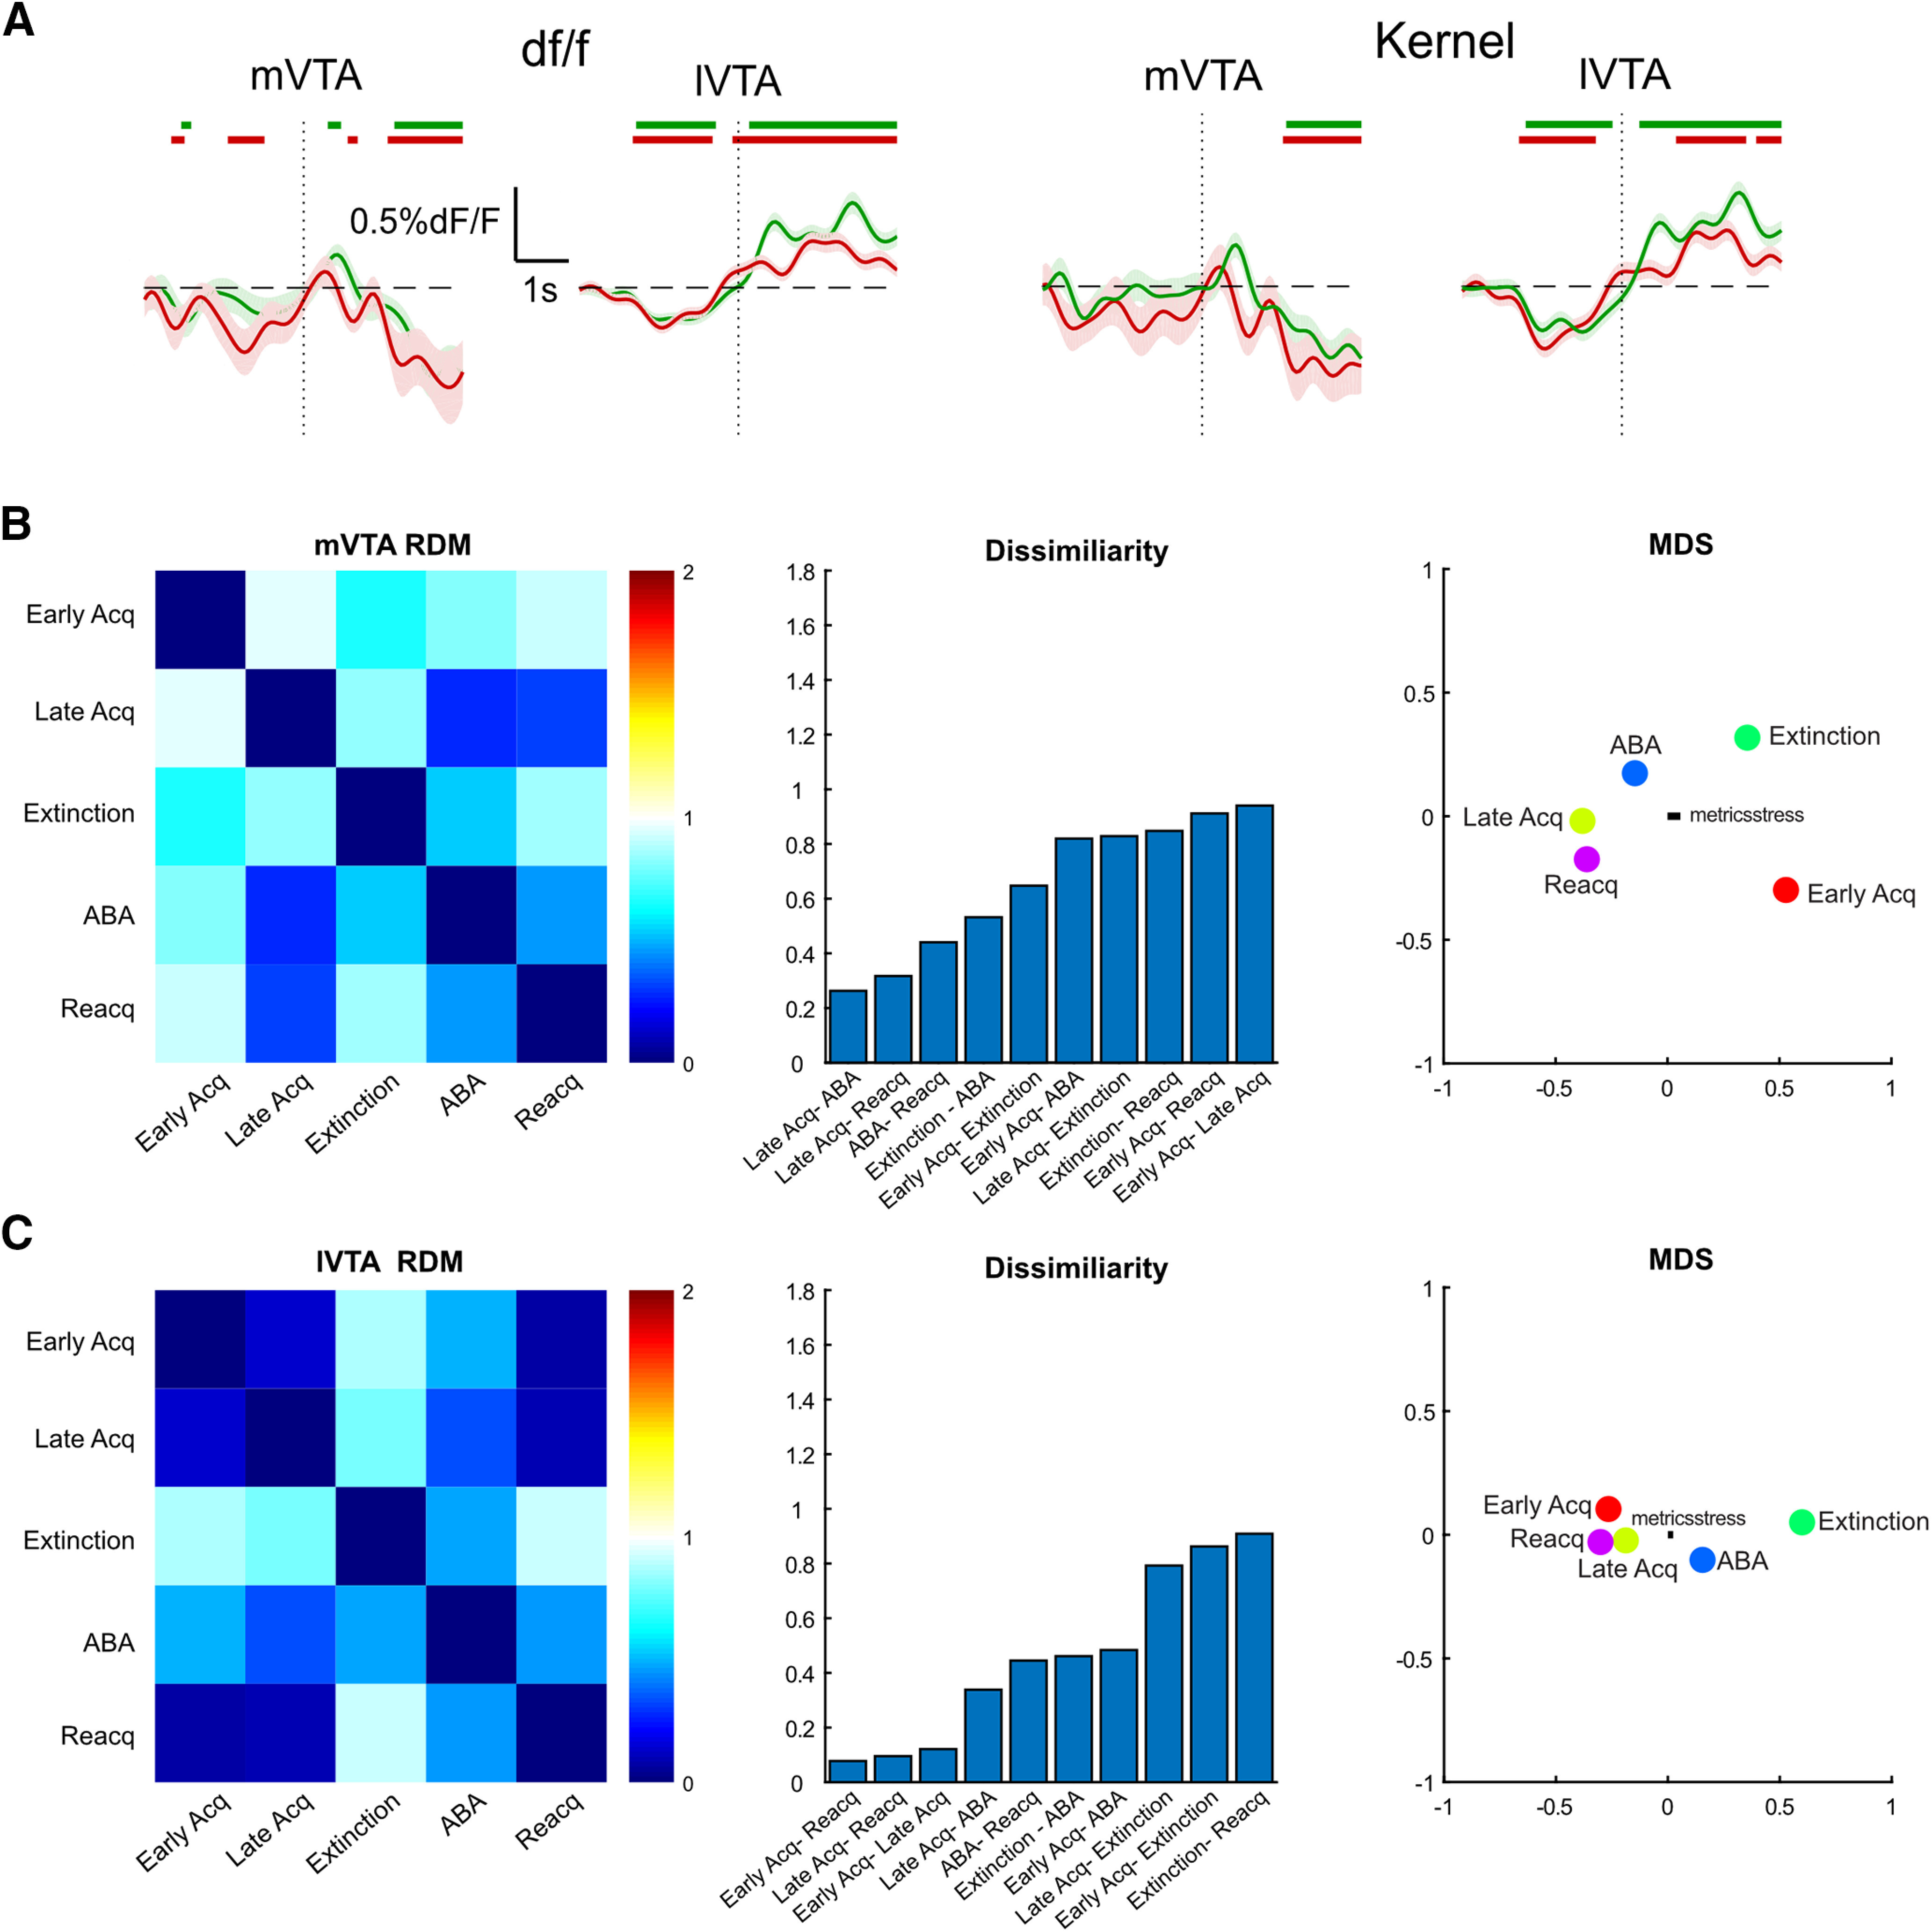
RSAs for VTA TH gCaMP activity. A, Comparison of actual df/f and normalized waveform kernels. Normalized kernels were obtained by normalizing each trial waveform according to its sum square deviation from 0. B, C, First-order RDM for mVTA and lVTA (0 for perfect similarity, 1 for no similarity, 2 for perfect dissimilarity) with MDS visualization whereby distances reflect dissimilarity.
Figure 7.
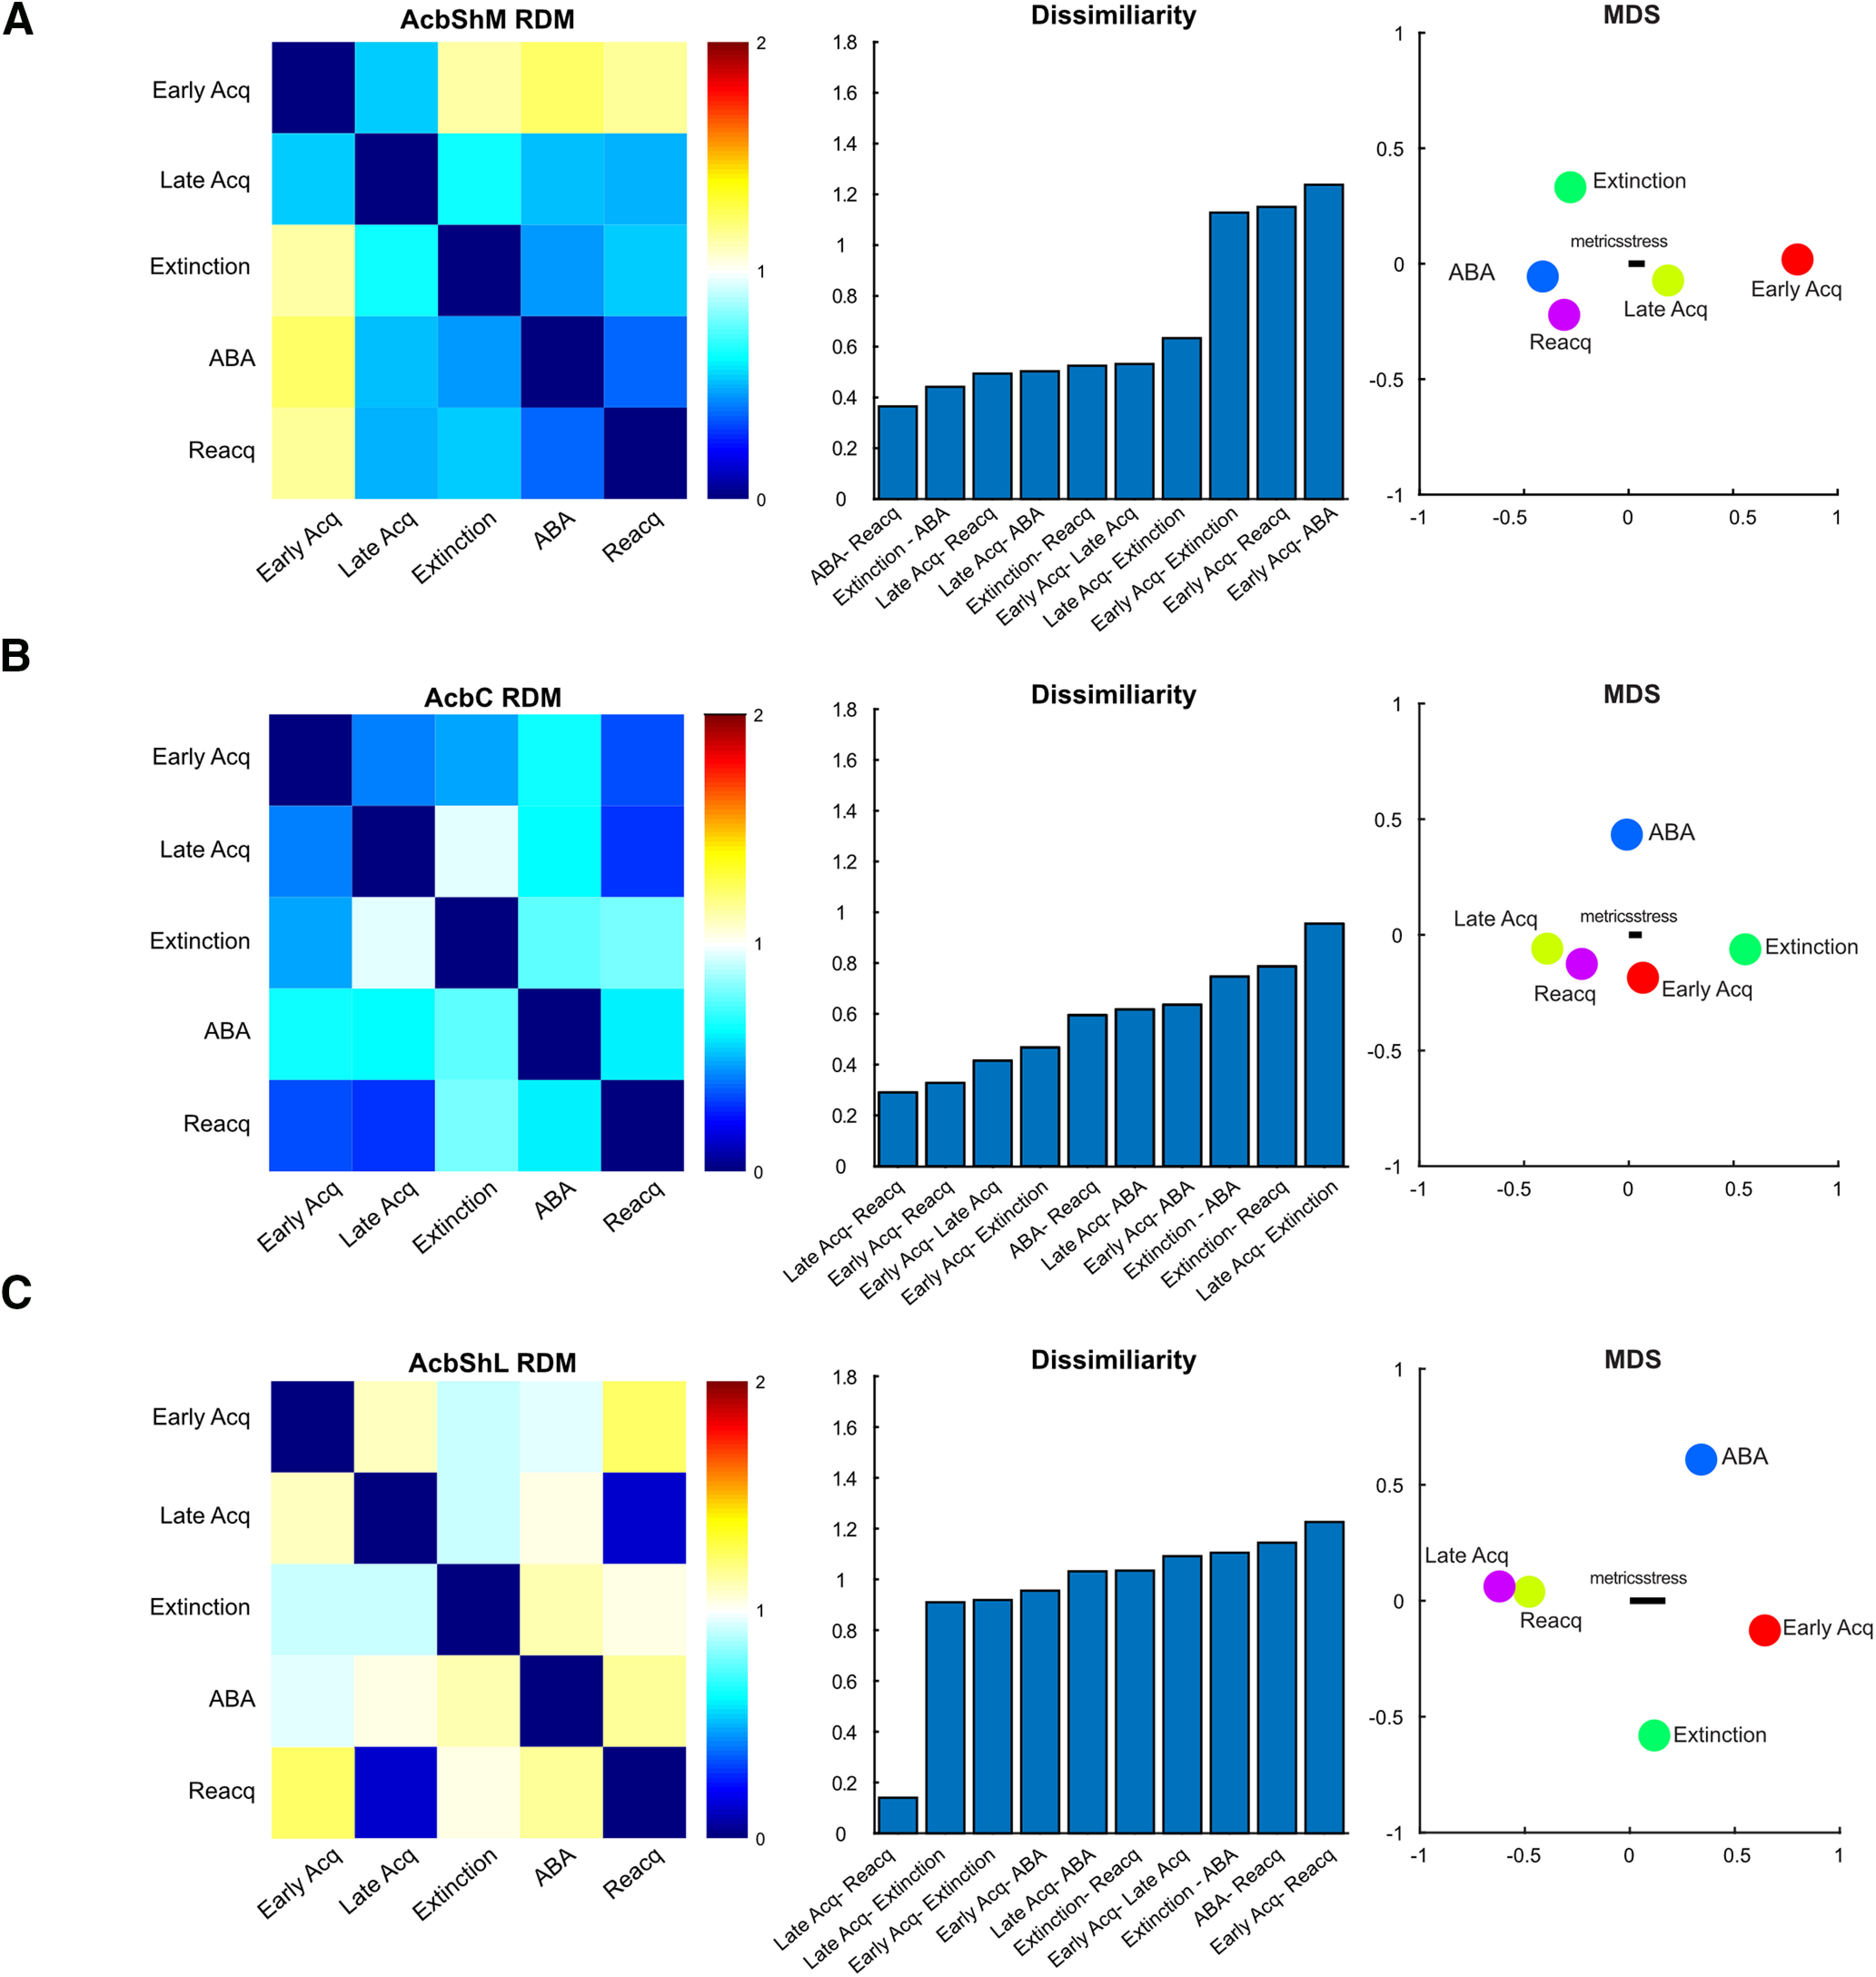
RSAs for ventral striatal dLight activity. First-order RDMs with MDS visualization whereby distances reflect dissimilarity for AcbShM (A), AcbC (B), and AcbShL (C).
Figure 8.

RSA for complete dataset. A, First-order RDM showing correlation distances between all pairs of conditions. B, Second-order brain RDM showing dissimilarity for each pair of brain regions, and MDS visualization of these differences whereby distances reflect dissimilarity. C, Second-order behavior RDM showing dissimilarity for each pair of behavioral self-administration stages, difference from RDM for each pair of behavioral conditions, and MDS visualization of these differences.
To visualize first- and second-order similarities/dissimilarities between pairs of condition, correlation distances were also conveyed using multidimensional scaling (MDS). Coordinates were obtained using MATLAB mdscale function (p = 2, criterion = metricsstress). Across graphs, S-Stress was consistently <0.2, indicating a fair fit of the data.
Results
Chemogenetic inhibition of VTATh neurons during relapse
We used chemogenetic inhibition to study the causal role of VTATH neurons in two forms of relapse to alcohol-seeking: renewal (Crombag and Shaham, 2002; Hamlin et al., 2007; Bouton et al., 2011) and reacquisition (Willcocks and McNally, 2011) (Fig. 1B). We first expressed the cre-dependent inhibitory hM4Di DREADD (n = 8) or eYFP (n = 6) in the VTA of TH-Cre rats (Liu et al., 2016) (Fig. 1A). In a separate experiment, we expressed the cre-dependent inhibitory KORD DREADD (Vardy et al., 2015; Marchant et al., 2016) (n = 8) or eYFP (n = 8) in the VTA of TH-Cre rats and determined the effects of chemogenetic inhibition on reacquisition.
Figure 1.

VTA TH neurons mediate relapse. A, Cre-dependent inhibitory DREADDs were applied to the VTA. B, Rats were trained and tested in an ABA renewal procedure and also tested for reacquisition. C, Location of hM4DI or KORD expression in VTA with each animal shown at 25% opacity. Example of hM4Di expression in VTA TH neurons. D, Mean ± SEM nosepokes during test in extinction and training contexts. Rats refrained from alcohol-seeking in the extinction context but relapsed to alcohol-seeking in the training context. Chemogenetic inhibition of VTA TH neurons reduced responding during renewal. E, Mean ± SEM nosepokes during reacquisition. hM4Di chemogenetic inhibition of VTA TH neurons reduced reacquisition, with data shown as total and in 10 min time bins. F, Mean ± SEM nosepokes during reacquisition. KORD chemogenetic inhibition of VTA TH neurons reduced reacquisition, with data shown as total and in 10 min time bins. G, No effect of chemogenetic inhibition of VTA TH neurons on latency to first nosepoke or locomotor activity. Raw active nosepoke data are shown for all individual rats as cumulative functions. Statistical analysis was done by ANOVA. *p < 0.05.
Histology
Figure 1C shows the location of hM4D, KORD, or eYFP expression for all animals. All rats had viral expression in VTA and were included in the statistical analyses. Therefore, for hM4Di chemogenetic inhibition, the final group sizes were n = 6 eYFP and n = 8 hM4Di, for KORD chemogenetic inhibition the final group sizes were n = 8 eYFP and n = 8 KORD.
Behavior
Table 1 shows the mean and SEM active and inactive nospokes at the end of self-administration and extinction training for each experiment. In this and remaining experiments, there were no differences in behaviors between groups before testing. In this experiment, at the end of training, there was no difference overall between hM4Di and eYFP groups (F(1,12) = 0.28, p = 0.606), there were more active than inactive nosepokes (F(1,12) = 152.1, p < 0.001), but no group × nosepoke interaction (F(1,12) = 0.24, p = 0.633). During extinction, there were more active than inactive nosepokes (F(1,12) = 85.75, p < 0.001), responding declined in a linear fashion across extinction training (F(1,12) = 31.55, p < 0.001), and this decrease was greater for the active nosepoke (F(1,12) = 126.01, p < 0.001). There were no differences between groups in this rate of extinction (all interaction: F(1,12) = 1.84, p = 0.1998).
On test there was evidence for renewal (Fig. 1D). Responding was greater in ABA than ABB (F(1,12) = 52.91, p < 0.001), there were more active than inactive nosepokes (F(1,12) = 72.77, p < 0.001), and there was a context × nosepoke interaction (F(1,12) = 39.97, p < 0.001). Chemogenetic inhibition of VTATH neurons reduced this renewal. There was an overall difference between hM4Di and eYFP groups (F(1,12) = 13.01, p = 0.004), and this interacted significantly with the difference in responding between contexts (F(1,12) = 5.78, p = 0.033) and nosepoke (F(1,12) = 8.09, p = 0.015). Interestingly, there was no three-way group × context × nosepoke interaction (F(1,12) = 1.77, p = 0.208), showing that VTATH neurons were important for responding in both the training and extinction contexts.
Consistent with past findings (Willcocks and McNally, 2011), rats rapidly returned to self-administration behaviors during reacquisition (Fig. 1E). There were significantly more active than inactive nosepokes (F(1,12) = 82.62, p < 0.001). This reacquisition, like renewal, was reduced by chemogenetic inhibition of VTATH neurons (main effect group: F(1,12) = 16.09, p = 0.002; and group × nosepoke interaction: F(1,12) = 15.99, p = 0.002). Responding was greatest during the first 10 min of test and declined thereafter. Simple effect analyses confirmed that chemogenetic VTATH neurons inhibition reduced active nosepokes during the initial period of peak relapse (F(1,12) = 15.09, p = 0.002).
There was no evidence that these effects of chemogenetic inhibition of VTATH neurons on relapse behaviors could be attributed to changes in locomotor activity (Fig. 1G). First, there was no effect of chemogenetic inhibition on latency to active nosepoking during tests for extinction (F(1,12) = 0.85, p = 0.375), renewal (F(1,12) = 1.48, p = 0.247), or reacquisition (F(1,12) = 0.30, p = 0.594). Second, we directly assessed the effects of chemogenetic VTATH inhibition on locomotor behavior in a locomotor chamber. There was no within subject effect of chemogenetic inhibition of VTA on locomotor activity (main effect: F(1,12) = 0.59, p = 0.457) and no group × ligand interaction (F(1,12) = 1.00, p = 0.335).
We used a second, KORD chemogenetic approach to exclude the possibility that clozapine as the hM4Di ligand (Gomez et al., 2017) interacted with the effects of alcoholic beer during reacquisition. Animals acquired self-administration behavior (Table 1). There was no difference overall between groups (F(1,14) = 0.935, p = 0.35), there were more active than inactive nosepokes (F(1,14) = 65.45, p < 0.001), but no group × nosepoke interaction (F(1,14) = 0.733, p = 0.406). During extinction, there were more active than inactive nosepokes (F(1,14) = 118.29, p < 0.001), responding declined in a linear fashion across extinction training (F(1,14) = 8.39, p < 0.012), and this decrease was greater for the active nosepoke (F(1,14) = 15.67, p = 0.001). There were no differences between groups in this rate of extinction (all interaction: F(1,14) = 3.55, p = 0.080).
During reacquisition (Fig. 1F), rats reacquired nosepoke behaviors, with significantly more active than inactive nosepokes (F(1,14) = 42.855, p < 0.001). Reacquisition was reduced by chemogenetic inhibition of VTATH neurons by KORD (main effect group: F(1,14) = 5.26, p = 0.038; group × nosepoke interaction: F(1,14) = 4.55, p = 0.051; overall: F(1,14) = 9.647, p = 0.008 first 10 min). Again, responding was greatest during the first 10 min of test and declined thereafter. Simple effect analyses confirmed that chemogenetic VTATH neurons inhibition reduced active nosepokes during this initial period of peak relapse (F(1,14) = 10.48, p = 0.006).
Fiber photometry of Ca2+ transients in VTATh neurons during acquisition, extinction, renewal, and reacquisition
Together, our results show a causal role for VTATH neurons in renewal and reacquisition of alcohol-seeking. Although demonstrating a causal role for VTATH neurons, these findings do not provide information about the activity profiles of VTATH neurons during relapse. To address this, we used fiber photometry (Gunaydin et al., 2014) to determine when during self-administration and relapse VTA TH neuron activity was important and whether this varied across the mediolateral extent of the VTA (Lammel et al., 2011, 2012; Yang et al., 2018) (Fig. 2A). We expressed cre-dependent gCaMP6f and implanted optical fibers above VTA of TH-cre rats (n = 24). Ca2+ transients were recorded during early and late self-administration, the first day of extinction training, and tests (ABA renewal, ABB extinction, reacquisition).
Figure 2.

Activity of VTA TH neurons during relapse. A, Cre-dependent gCaMP6f was applied to the VTA. Location of gCaMP6 expression and fiber tips in midbrain with each rat represented at 25% opacity. The lateral edge of the fasciculus retroflexus was used as anatomic boundary between mVTA and lVTA. Example of gCaMP6 expression in VTA TH neurons and a representative trace is shown. B, Mean ± SEM active (A) and inactive (I) nosepokes from the five recording sessions. C, Mean ± SEM calcium transients in VTA TH neurons ±3 s around Nosepoke+ (active nosepokes that triggered the pump) and Nosepoke– (active nosepokes at other times) for mVTA and lVTA. Colored bars above traces represent periods (with minimum consecutive threshold) of significant difference from 0 as defined by 95% CIs. D, Mean ± SEM calcium transients in VTA TH neurons from –3 s to 3 s around Magazine+ (first magazine entry after Nosepoke+) and Magazine– (magazine entries at other times) for mVTA and lVTA. Colored bars above traces represent periods (with minimum consecutive threshold) of significant difference from 0 as defined by 95% CIs.
Histology
Figure 2A shows the location of GCaMP6f expression and fiber tips in midbrain with each rat represented at 25% opacity. The lateral edge of the fasciculus retroflexus was used as anatomic boundary between mVTA and lVTA (Ikemoto, 2007). Animals had viral expression in VTA and tips of cannula in mVTA (n = 8) or lVTA (n = 16).
GCaMP6f transients
We recorded gcaMP6f transients during early (day 2) and late (day 9) self-administration training, early extinction (day 1), and during tests for renewal and reacquisition (Fig. 2B). We analyzed these data three ways, to ask three related questions about activity of VTA TH neurons during relapse.
First, we used a bootstrap 95% CI procedure (Jean-Richard-dit-Bressel et al., 2020) to analyze perievent (±3 s) ΔF/F waveforms and detect significant Ca2+ transients associated with nosepokes and magazine entry. This analysis showed, for each phase of the experiment, when Ca2+ transients were significantly different from 0% ΔF/F (i.e., the 95% CI does not include 0% ΔF/F). These periods of statistical significance are shown by colored bars above each waveform. For mVTA, there were significant negative transients associated with Nosepoke+ and Nosepoke– during early acquisition; significant positive transients to Nosepoke+ and significant negative transients to Nosepoke– during late acquisition. These significant positive transients to Nosepoke+ were absent during extinction and renewal but were restored during reacquisition. For lVTA, there were significant positive transients associated with Nosepoke+ and Nosepoke– during early acquisition; significant positive transients to Nosepoke+ during late acquisition, extinction, renewal, and reacquisition. Similar findings were observed for Magazine behaviors.
Second, we used ANCOVA on the area under the ΔF/F curve (AUC) 0-3 s after Nosepoke+ and Magazine+ to ask whether there were significant differences in VTA Ca2+ transients between renewal and reacquisition while controlling for subject identity. For mVTA, both Nosepoke+ (mean ABA = 2.69 [SEM = 13.87], mean reacquisition = 12.68 [SEM = 3.84], F(1,290) = 5.93, p = 0.016) and Magazine+ (mean ABA = −8.36 [SEM = 14.01], mean reacquisition = 11.57 [SEM = 4.43], F(1,273) = 7.49, p = 0.007) were significantly greater during reacquisition than renewal. For lVTA, Nosepoke+ was not significantly different between reacquisition and renewal (mean ABA = 11.12 [SEM = 7.68], mean reacquisition = 26.74 [SEM = 2.97], F(1,525) = 2.95, p = 0.086), but Magazine+ was (mean ABA = 7.54 [SEM = 8.68], mean reacquisition = 36.50 [SEM = 4.18], F(1,508) = 7.82 p = 0.005).
Next, we used a multivariate approach to understand the relationship between VTA TH gCaMP signals across the entire experiment. To do so, we compared VTA gCaMP waveforms across different stages of the experiment with each other using RSA (Kriegeskorte et al., 2008a,b; Kriegeskorte and Kievit, 2013; Nili et al., 2014). We computed normalized Ca2+ waveforms (kernels) for each stage (Fig. 3A), correlated these across each pair of conditions, and computed correlation distance (1 – Pearson correlation) between pairs to measure their dissimilarity (0 for perfect correlation, 1 for no correlation, 2 for perfect anticorrelation). This multivariate approach complements single-event and univariate AUC analysis because it asks whether the patterns of activity elicited during one session of self-administration are similar to the patterns of activity elicited from another session. Correlation distances were assembled into a first-order dissimilarity matrix (RDM) reporting dissimilarity of mVTA and lVTA TH waveforms across the experiment (Fig. 3B,C). MDS visualized these dissimilarities. This analysis showed that mVTA waveforms in early and late self-administration were dissimilar. Moreover, in mVTA, both forms of relapse were similar to late self-administration. For lVTA, the different stages of acquisition and the different forms of relapse were similar to each other. The notable exception to this was extinction, with lVTA responses during extinction most dissimilar to all other stages of the experiment.
To ask how consistent our data were across subjects, we first assessed dissimilarity between individual subjects' lVTA TH kernels across the experiment (Extended Data Fig. 3-1). We chose lVTA because it had the highest number of subjects and so was a conservative way to assess between-subject variability. This analysis showed that there was generally low dissimilarity between subjects, with most dissimilarity being observed during extinction. Then we asked how each subject's kernel differed from the trial kernels for each stage of the experiment. This identifies how dissimilar each subject was, at each stage of the experiment, from the trial data used for analyses. Dissimilarity was low for both lVTA and mVTA (Extended Data Fig. 3-1). There was occasional dissimilarity during different stages of the experiment, but there were no consistent differences between individual subjects and the trial level kernels across the experiment.
(A). First-order RDM showing correlation distances between each subject with lVTA gCaMP for each stage of the experiment. Overall levels of dissimilarity were low across the experiment with the notable exception of extinction. (B) Dissimilarity between each subject and the trial-based kernels across all experimental stages for mVTA. (C) Dissimilarity between each subject and the trial-based kernels across all experimental stages for lVTA. In both mVTA and lVTA, overall levels of dissimilarity were low, showing that trial-based data were representative. In all panels, animals were not recorded on Day 2 (early acquisition and are excluded, data shown as NaN). Download Figure 3-1, TIF file (1.3MB, tif) .
Optogenetic inhibition of VTATh neurons during relapse
Our fiber photometry results show that mVTA transients during alcohol-seeking were significantly greater during reacquisition than renewal, whereas lVTA transients were not. This suggests that renewal may depend on lVTA, but not mVTA, whereas reacquisition may depend on both. However, our approach to photometry analysis did not allow statistical comparison between regions. Moreover, our chemogenetic inhibition findings suggested that VTA TH neurons contribute to both renewal and reacquisition, but we were unable to limit DREADD expression to either VTA subregion. To determine whether different forms of relapse are dissociable across the mVTA and lVTA, we used an optogenetic approach. Our rationale was that we could more effectively restrict optogenetic inhibition to one region versus the other because the extent of this inhibition is determined by placement of the fiberoptic cannulae. To test this, we expressed Cre-dependent eNpHR3.0 (n = 12) or eYFP (n = 8) in VTA of TH Cre+ rats and targeted optical fibers toward either medial or lateral VTA to limit optogenetic inhibition to these regions. We silenced VTA TH neurons for 10 s only during Nosepoke+ behavior to inhibit these neurons during the time we had observed significant Ca2+ transients.
Histology
Figure 4B shows the location of eNpHR3.0 or eYFP expression and fiber tips in midbrain with each rat represented at 25% opacity. The lateral edge of the fasciculus retroflexus was again used as the anatomic boundary between mVTA and lVTA (Ikemoto, 2007). Animals had viral expression in VTA and tips of cannula in either mVTA or lVTA. The group sizes were eYFP n = 8, for eNpHR3.0 animals, mVTA n = 6, lVTA n = 6.
Figure 4.
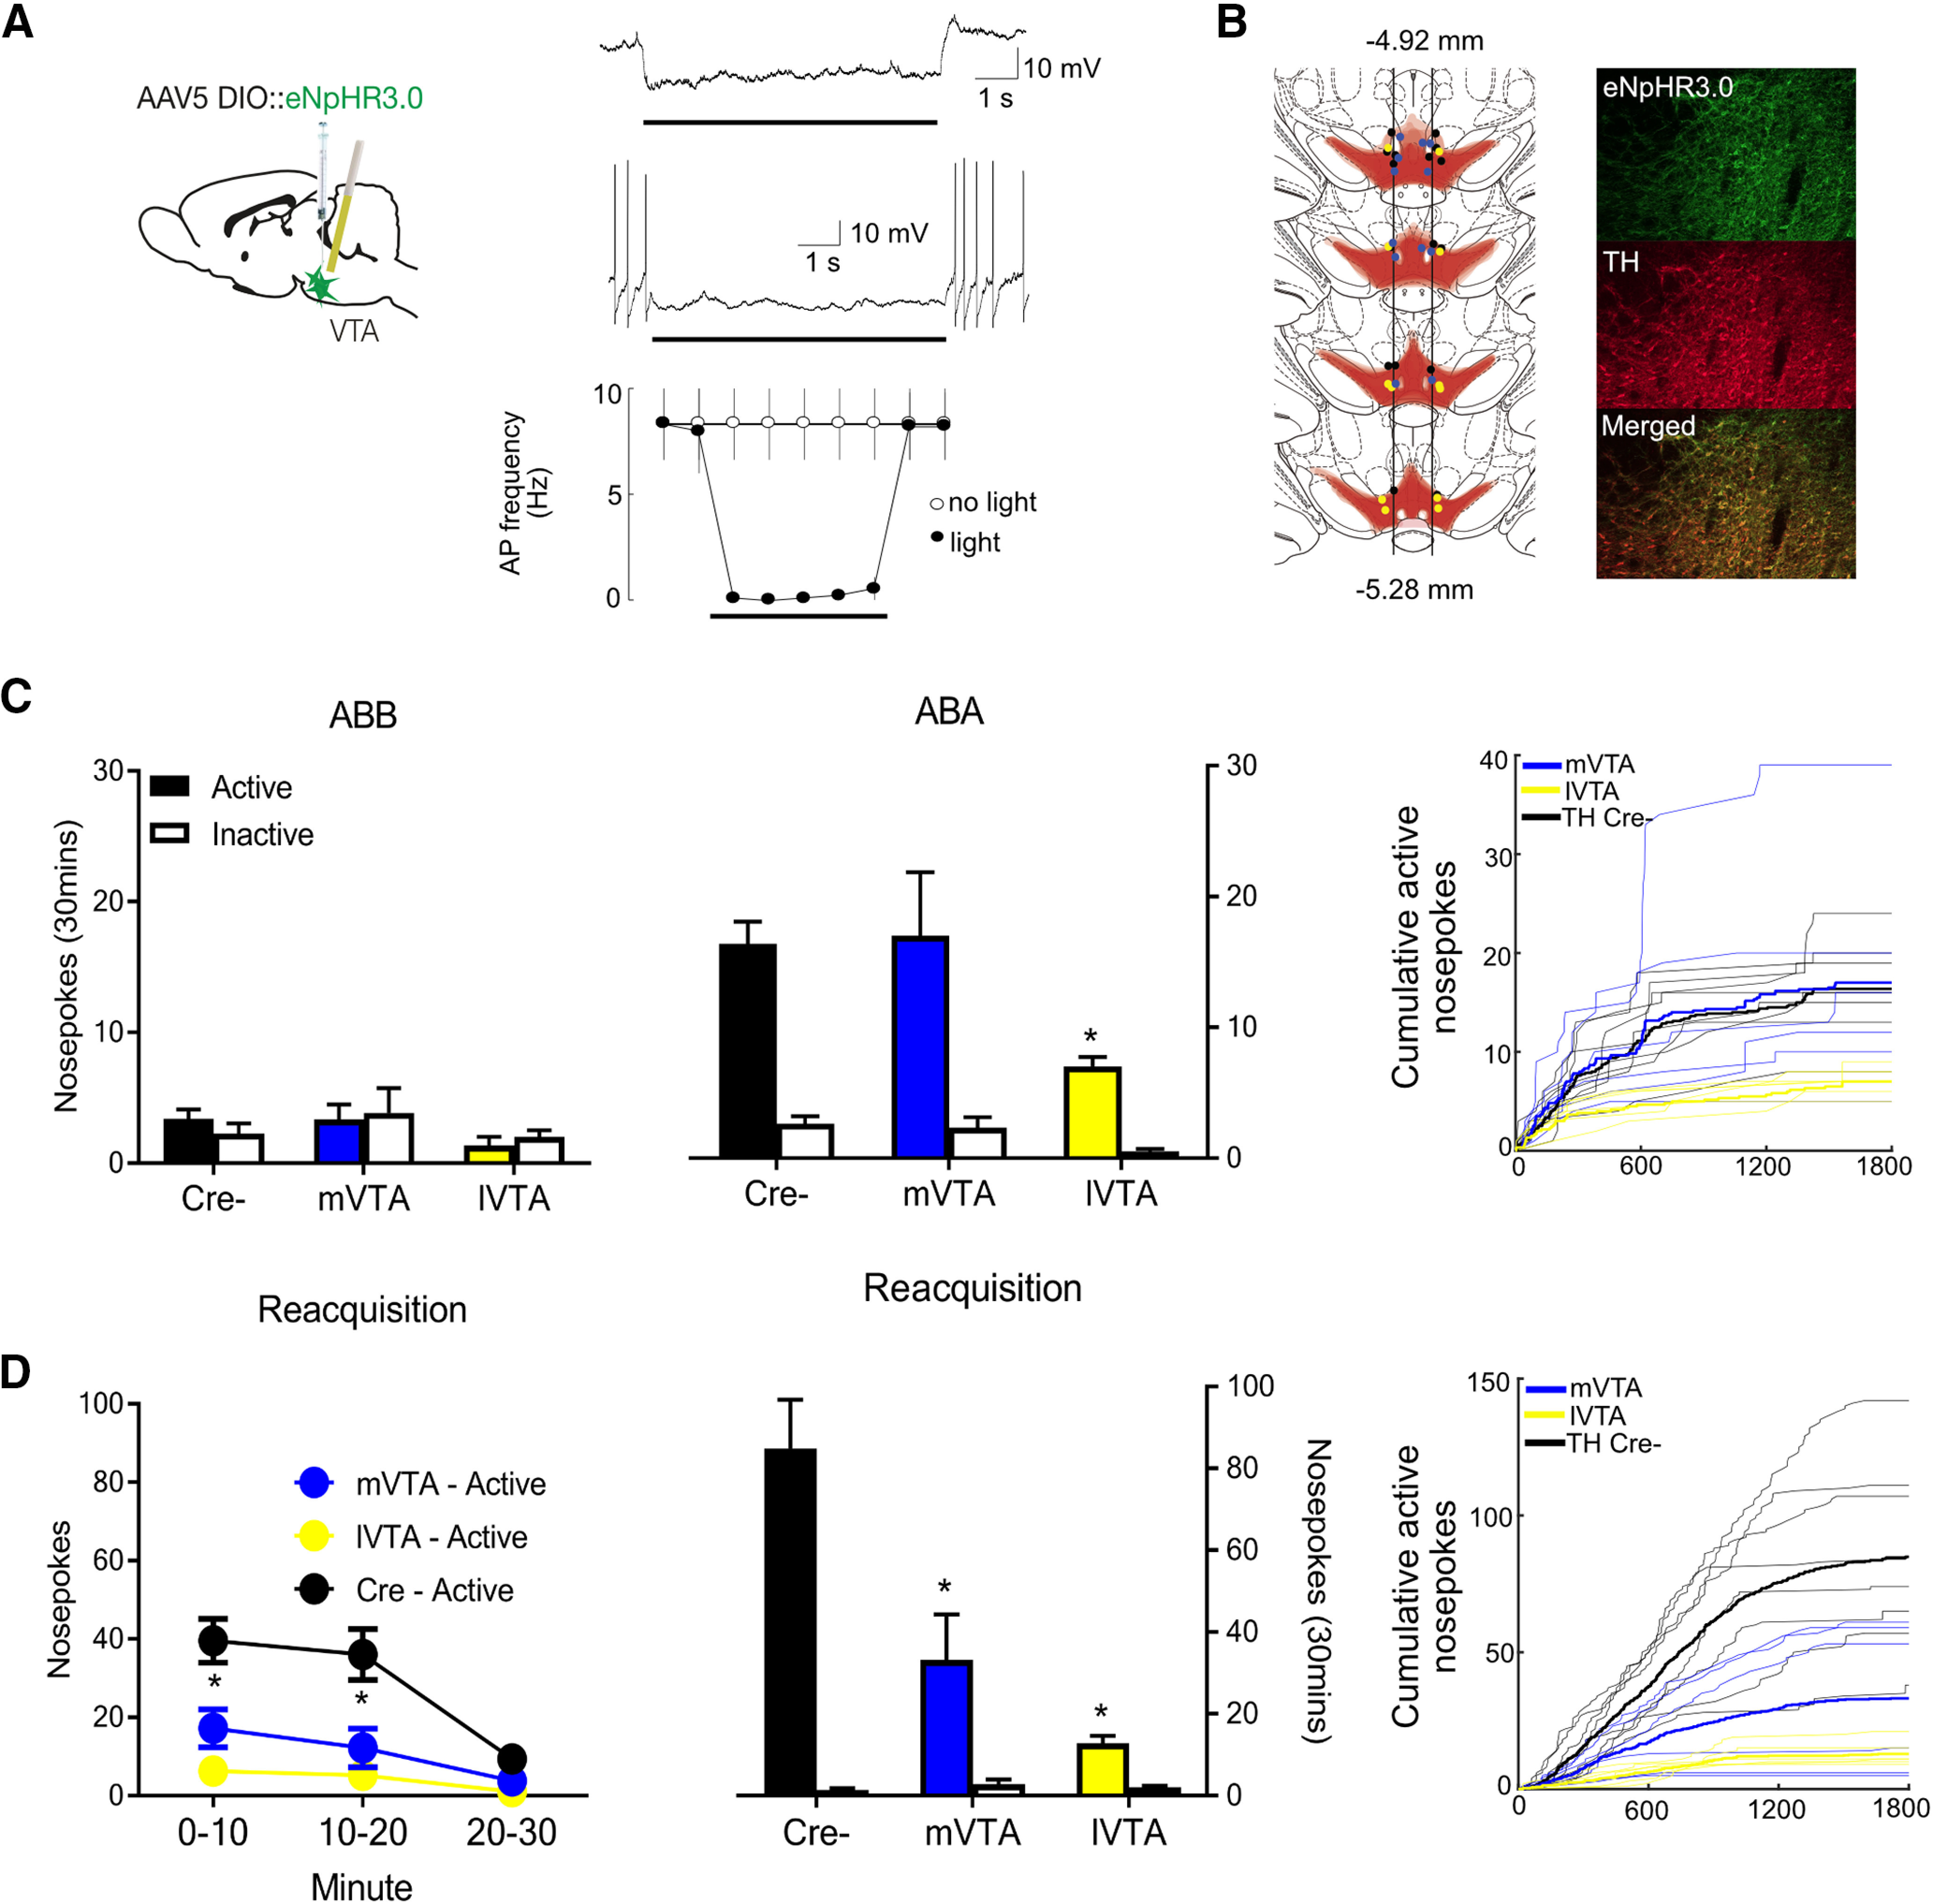
VTA TH optogenetic inhibition and relapse. A, Light-evoked responses of eNpHR3.0-positive VTA neurons. Typical light-evoked hyperpolarization, example of light-evoked suppression of spontaneous firing, and summary data plotting mean firing frequency evoked by a train of brief (5 ms) current injections in the presence and absence of light stimulation. Bars represent timing of light presentation. B, Location of eNpHR3.0 expression and fiber tips in midbrain with each rat represented at 25% opacity. The lateral edge of the fasciculus retroflexus was used as anatomic boundary between mVTA and lVTA. Example of eNpHR3.0 expression in VTA TH neurons. C, Mean ± SEM nosepokes during test in extinction and training contexts. Rats refrained from alcohol-seeking in the extinction context but relapsed to alcohol-seeking in the training context. lVTA, but not mVTA, inhibition prevented this relapse. Raw active nosepoke data are shown for all individual rats as cumulative functions. D, Mean ± SEM nosepokes during reacquisition. Both mVTA and lVTA inhibition reduced reacquisition. Raw active nosepoke data are shown for all individual rats as cumulative functions. Statistical analysis was done by ANOVA. *p < 0.05.
Whole-cell patch-clamp recordings
To confirm photoinhibition, whole-cell patch-clamp recordings were made from eNpHR3.0-expressing VTA neurons in vitro (7 neurons from 3 rats) (Fig. 4A). Photostimulation evoked a rapid-onset hyperpolarization that persisted for the duration of the light (Fig. 4A, right top, peak –18.0 ± 2.5 mV, steady state −12.2 ± 2.5 mV). The light-evoked hyperpolarization suppressed spontaneous firing (Fig. 4A, right middle) and action potentials generated by trains of depolarizing current injections (Fig. 4A, right bottom).
Behavior
All animals acquired self-administration behavior that was extinguished (Table 1). At the end of training, there was no difference overall between groups (F(2,17) = 0.005, p = 0.995), there were more active than inactive nosepokes (F(1,17) = 102.0, p < 0.001), but no group × nosepoke interaction (F(2,17) = 0.017, p = 0.983). During extinction, there were more active than inactive nosepokes (F(1,17) = 44.55, p < 0.001), responding declined in a linear fashion across extinction training (F(3,51) = 13.09, p < 0.001), and this decrease was greater for the active nosepoke (F(1,17) = 17.62, p = 0.001). There were no differences between groups in this rate of extinction (all interaction: F(6,51) = 0.45, p = 0.839).
There was renewal on test (Fig. 4C). Responding was greater in ABA than ABB (F(1,17) = 33.83, p < 0.001), there were more active than inactive nosepokes (F(1,17) = 32.68, p < 0.001), and there was a context × nosepoke interaction (F(1,17) = 42.30, p < 0.001). Optogenetic inhibition of VTATH neurons in lVTA, but not mVTA, reduced this renewal. There was an overall difference between eYFP and lVTA groups (F(1,17) = 8.93, p = 0.008), and this interacted significantly with the difference in responding between contexts (F(1,17) = 5.108, p =0.037), but not nosepoke (F(1,17) = 3.452, p = 0.081). Interestingly, there was no three-way group × context × nosepoke interaction (F(1,17) = 1.62, p = 0.220), showing that lVTA VTATH neurons were important for responding in both the training and extinction contexts. This was similar to our findings from chemogenetic inhibition. In contrast, mVTA optogenetic inhibition around Nosepoke+ did not reduce renewal (main effect group: F(1,17) = 0.17, p = 0.69; group × context interaction: F(1,17) = 0.09, p = 0.77).
During reacquisition (Fig. 4D), there were significantly more active than inactive nosepokes (F(1,17) = 49.11, p < 0.001). lVTA (main effect group: F(1,17) = 25.18, p < 0.001; group × nosepoke interaction: F(1,17) = 26.22, p < 0.001) and mVTA (main effect group: F(1,17) = 12.47, p = 0.003; group × nosepoke interaction: F(1,17) = 14.04, p = 0.002) inhibition around Nosepoke+ both reduced reacquisition.
There was no evidence that these effects of optogenetic inhibition of VTA TH neurons on relapse behaviors could be attributed to changes in locomotor activity. We found no effect of optogenetic inhibition on latency to active nosepoking during tests for extinction (F(2,17) = 0.51, p = 0.609), renewal (F(2,17) = 0.101, p = 0.905), or reacquisition (F(2,17) = 2.22, p = 0.139).
So, inhibition of lVTA, but not mVTA, TH neurons reduced renewal, whereas inhibition of either lVTA or mVTA TH neurons reduced reacquisition. This shows a dissociation between these regions in relapse and supports the findings from our photometry data. Importantly, the lack of effect of mVTA inhibition on renewal is not easily attributed to methodological factors because the same inhibition in the same animals reduced reacquisition.
Role of D1 dopamine receptors in relapse
Next, we studied the role of dopamine binding in renewal and reacquisition. Past work has shown that D1 dopamine receptors are important for renewal of drug-seeking because systemic administrations of D1 receptor antagonists prevent renewal for alcohol-, heroin-, or cocaine-seeking (Crombag et al., 2002; Bossert et al., 2007; Hamlin et al., 2007). However, the role of D1 receptors in reacquisition remains poorly understood. So, we sought to extend past findings regarding renewal via use of a different D1 receptor antagonist (SCH39166) and to also assess the role of these receptors in reacquisition. To do so, we injected rats with 0, 0.025, 0.1, or 0.25 mg/kg SCH39166 before tests for extinction, renewal, and reacquisition.
Behavior
All animals acquired self-administration behavior that was extinguished (Table 1). At the end of training, there was no difference overall between groups (F(3,28) = 0.96, p = 0.426), there were more active than inactive nosepokes (F(1,28) = 95.93, p < 0.001), but no group × nosepoke interaction (F(3,28) = 0.961, p = 0.425). During extinction, there was more active than inactive nosepokes (F(1,28) = 83.96, p < 0.001), responding declined in a linear fashion across extinction training (F(3,84) = 24.65, p < 0.001), and this decrease was greater for the active nosepoke (F(3,84) = 11.44, p < 0.001). There were no differences between groups in this rate of extinction (all interaction: F(9,84) = 0.71, p = 0.695). By the last day of extinction, there were no differences between groups (F(3,28) = 0.990, p = 0.412) and no group × nosepoke interaction (F(3,28) = 0.926, p = 0.441).
On test there was evidence for renewal. Responding was greater in ABA than ABB (F(1,28) = 21.85, p < 0.001), there were more active than inactive nosepokes (F(1,28) = 51.55, p < 0.001), and there was a context × nosepoke interaction (F(1,28) = 27.56, p < 0.001) (Fig. 5A). SCH39166 reduced renewal (context × group interaction: F(3,28) = 9.79, p < 0.001; and context × nosepoke × group: F(3,28) = 15.20, p < 0.001), including at the lowest dose (0.025 m/kg) compared with saline (context × group interaction: F(1,28) = 21.69, p < 0.001; and context × nosepoke × group: F(1,28) = 35.49, p < 0.001). SCH39166 also reduced reacquisition (group main effect: F(3,28) = 19.24, p < 0.01; and group × nosepoke interaction: F(3,28) = 20.02, p < 0.001), including at the lowest dose (0.025 m/kg) compared with saline (0 vs 0.025 mg/kg main effect: F(1,28) = 35.87, p < 0.001; and group × nosepoke: F(1,28) = 36.46, p < 0.001).
Figure 5.
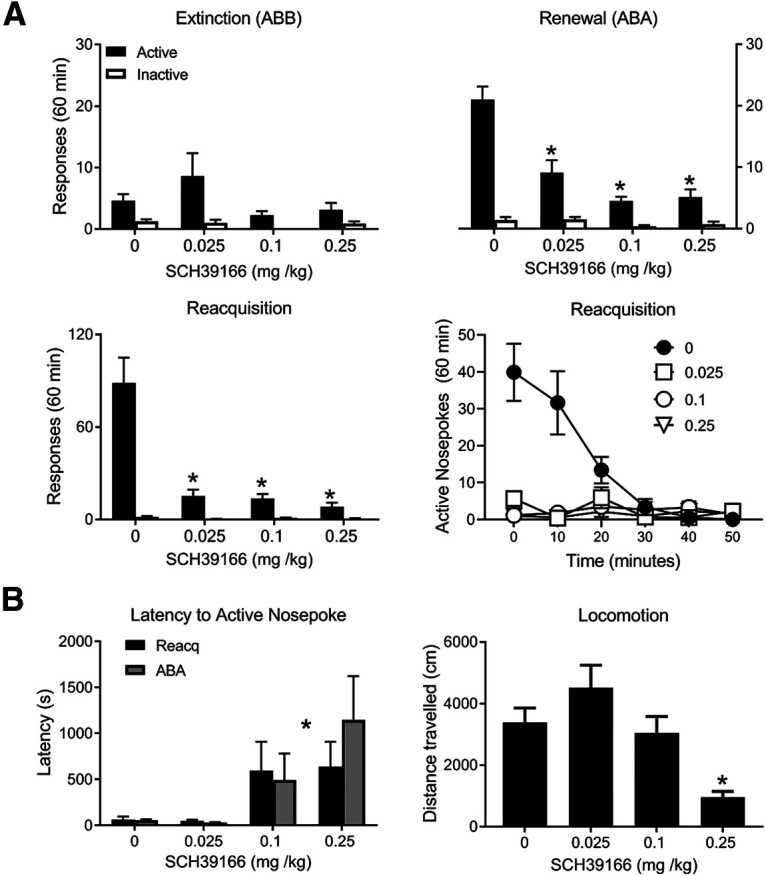
D1 dopamine receptor antagonist effects on relapse. A, Mean ± SEM nosepokes during test in extinction and training contexts as well as reacquisition (shown as average total responses and in 10 min time bins). SCH39166 prevented renewal and reacquisition. B, Effects of SCH39166 on latency to first nosepoke and locomotor activity. *p < 0.05.
These effects of D1 receptor antagonism on relapse cannot simply be attributed to differences in locomotor activity (Fig. 5B). There was an overall effect of SCH39166 on latency to first active nosepoke (main effect of drug: F(3,56) = 5.59, p = 0.002) and a linear effect of SCH39166 dose (F(1,60) = 16.40, p < 0.001) during ABA and reacquisition. Importantly, there was no effect of the lowest dose of SCH39166 (F(1,28) = 0.006, p = 0.939), although this dose reduced both renewal and reacquisition. There were no interactions with test session (ABA, reacquisition, F(3,56) = 0.64, p = 0.592). There was an overall effect of SCH39166 on locomotor activity (main effect F(3,28) = 8.33, p < 0.001) with a linear effect (F(1,30) = 19.62, p < 0.001). Locomotor activity was reduced at the highest dose (0.25 mg/kg) (linear trend across dose: F(1,14) = 8.33, p < 0.001). Critically, the lowest dose (0.025 mg/kg) that reduced renewal and reacquisition did not affect locomotor activity compared with 0 mg/kg (F(1,14) = 2.43, p = 0.13).
Fiber photometry of dopamine transients in Acb during acquisition, extinction, renewal, and reacquisition
Single-unit (Carelli and Deadwyler, 1994; Chang et al., 1998, 2000; Janak et al., 1999; Carelli and Ijames, 2000; Woodward et al., 2000) and fast-scan cyclic voltammetry (Phillips et al., 2003; Stuber et al., 2005a,b) recordings strongly link activity and dopamine release in the AcbC to drug-seeking. Moreover, microinjections of D1 receptor antagonists into AcbShM, AcbShL, or AcbC can prevent renewal of alcohol- or heroin-seeking (Bossert et al., 2007; Chaudhri et al., 2009). Nonetheless, the spatiotemporal profiles of dopamine binding across the Acb during relapse are unknown. We used dLight photometry (Patriarchi et al., 2018) to address this. We expressed dLight1.1 in Acb (N = 18) and implanted optical fibers above AcbShM (n = 6), AcbC (n = 7), or AcbShL (n = 5) of Long-Evans rats (Fig. 6A). Dopamine transients were recorded during early and late self-administration, early extinction training, and relapse (Fig. 6B).
Figure 6.

Dopamine transients in the ventral striatum. A, dLight was applied to AcbShM, AcbC, or AcbShL, and rats were trained and tested in an ABA renewal procedure and for reacquisition. A representative recording trace is shown. Location of dLight1.1 expression and fiber tips in Acb with each rat represented at 25% opacity. B, Mean ± SEM active (A) and inactive (I) nosepokes from the five recording sessions. C, Mean ± SEM normalized dopamine transients ±3 s around Nosepoke+. Green bars above traces represent periods (with minimum consecutive threshold) of significant difference from 0 as defined by 95% CIs. D, Mean ± SEM normalized dopamine transients from –3 s to 3 s around Magazine+ for AcbShM, AcbC, AcbShL. Green bars above traces represent periods (with minimum consecutive threshold) of significant difference from 0 as defined by 95% CIs.
Histology
Figure 6A shows the location of dLight expression and fiber tips in Acb with each rat represented at 25% opacity. Animals had viral expression in VTA and tips of cannula in AcbShM (n = 6), AcbC (n = 7), or AcbShL (n = 5).
dLight transients
Based on our findings from VTA gCaMP, we examined dopamine transients around Nosepoke+ and Magazine+ behaviors. Again, we used three different analysis strategies. First, we used bootstrap 95% CI procedure analyses of normalized perievent (±3 s) dLight waveforms to ask when there were statistically significant dopamine transients for Nosepoke+ (Fig. 6C) and Magazine+ (Fig. 6D) within each region. These periods of statistical significance are shown via colored bars above the waveforms. Dopamine transients were highly heterogeneous, both across Acb subregion and the stage of the experiment. In general, for AcbShM, there were reductions in dopamine transients early in acquisition replaced by positive transients in late self-administration, and these were preserved during the remaining stages. On the other hand, for AcbC, there were positive dopamine transients across each stage. Finally, for, AcbShL, positive transients emerged across self-administration, were lost across extinction, and were restored during reacquisition but not renewal.
Second, we used ANCOVA on the AUCs 0-3 s after Nosepoke+ and Magazine+ to ask whether there were significant differences in dopamine transients between renewal and reacquisition while controlling for subject identity. For AcbShM, there was no difference for Nosepoke+ (mean ABA = 1.35 [SEM = 4.13], mean reacquisition = 0.83 [SEM = 2.04], F(1,199) = 0.189, p = 0.664), but there was for Magazine+ (mean ABA = 3.92 [SEM = 4.43]; mean reacquisition = −7.04 [SEM = 2.03], F(1,192) = 5.48, p = 0.02). For AcbC, there was also no difference for Nosepoke+ (mean ABA = 2.82 [SEM = 2.62], mean reacquisition = 8.1 [SEM = 2.17], F(1,270) = 1.15, p = 0.285), but there was for Magazine+ (mean ABA = −5.27 [SEM = 3.86], mean reacquisition = −8.27 [SEM = 2.05], F(1,257) = 9.40, p = 0.002). For AcbShL, there was a difference for Nosepoke+ (mean ABA = −6.96 [SEM = 4.19], mean reacquisition = 10.92 [SEM = 1.70], F(1,258) = 24.79, p = 0.0001), but not Magazine+ (mean ABA = 4.43 [SEM = 3.98]; mean reacquisition = 6.60 [SEM = 1.83], F(1,246) = 2.06, p = 0.153).
Third, we used RSA to understand activity how dopamine transients within an Acb region changed across self-administration, extinction, and relapse. First-order RDMs and MDS captured the dissimilarity of Acb dopamine responses across sessions. For AcbShM, the dopamine response during self-administration was dissimilar to all other stages (Fig. 7A). There was similarity between AcbC dopamine responses across all stages of the experiment, except extinction (Fig. 7B). In contrast, AcbShL dopamine responses were highly dissimilar across the experiment, with only late self-administration and reacquisition being similar (Fig. 7C). We again assessed how each subject related to the trial data used for RSA. Dissimilarity was low (Extended Data Fig. 7-1) with no consistent differences between individual subjects and the trial level kernels across the experiment.
Dissimilarity between each subject and the trial-based kernels across all experimental stages for AcbShM (A), AcbC (B), and AcbShL (C). Overall levels of dissimilarity were low, showing that trial-based data were representative. Download Figure 3-1, TIF file (900.5KB, tif) .
RSA of dopamine contributions to relapse
Our results thus far show recruitment across the mesolimbic dopamine system, with complex and distinct profiles of activity within and across distinct compartments of this system. These findings raise fundamental questions about how activity in these distinct compartments relates to each other and how relapse is assembled from these distinct spatiotemporal activity profiles.
We used RSA on our complete photometry dataset to answer these questions. RSA quantitatively assesses the extent to which the dopamine activity signatures (i.e., VTA TH gCaMP and Acb dLight) across brain regions or behavioral stages are alike (Kriegeskorte et al., 2008b; Kriegeskorte and Kievit, 2013; Nili et al., 2014). To do this, we computed a first-order RDM for each brain region from early self-administration to relapse (Fig. 8A). This reports dissimilarity between pairs of activity patterns. Then, we computed a second-order RDM across the first-order RDM for each brain region (Fig. 8B), reporting dissimilarity across pairs of values in the first-order RDM (dissimilarity defined as the correlation distance: 1 – Spearman correlation). This provides a dissimilarity score between brain regions in their cross-stage activity profiles. This overcomes the problem of correspondency between spatiotemporally distinct (e.g., AcbShM vs mVTA) activity profiles obtained from different sensors (i.e., gCaMP, dLight) because second-order RDMs compare first-order RDMs (i.e., they compare cross-stage dissimilarity), not activity itself. Again, to aid interpretation, we used MDS to visualize dissimilarity of these second-order RDMs.
Consistent with known connectivity (Lammel et al., 2011, 2012; Yang et al., 2018; de Jong et al., 2019), the region RDM (Fig. 8B) showed that, across self-administration to relapse, the activity signatures of lVTA and AcbC as well as mVTA and AcbShM were highly similar. Surprisingly, the signatures of the three Acb regions were dissimilar. Indeed, there was more similarity between individual VTA and Acb subregions than there was among the Acb subregions themselves.
Finally, we computed second-order RDMs across experimental stage to identify and compare mesolimbic dopamine signatures for self-administration stages. The second-order behavior RDM (Fig. 8C) identified four key findings. First, there was a change in the mesolimbic dopamine signature from early to late self-administration. Second, there were distinct mesolimbic dopamine signatures for the two forms of relapse. Third, the signature of reacquisition was similar to the signature of late self-administration. Fourth, there was little meaningful relationship between mesolimbic dopamine signatures when animals could only use environmental cues to guide their behavior because the outcome was absent (i.e., extinction and ABA).
Discussion
It is axiomatic that the actions of dopamine are critical to drug-seeking and relapse to this seeking. Yet how relapse to drug-seeking is assembled from activity across the mesolimbic dopamine system is poorly understood. Here we show how relapse to alcohol-seeking relates to activity in specific VTA and accumbens compartments, how these change for different forms of relapse, and how relapse-associated activity relates to activity during self-administration and extinction. We show considerable diversity in the spatiotemporal activity profiles across the VTA and ventral striatum during self-administration and two forms of relapse to alcohol-seeking. We show that dopamine was causal to relapse because both renewal and reacquisition could be prevented by dopamine receptor antagonism. However, different forms of relapse were associated with distinct mesolimbic activity signatures and different causal roles for VTA subregions.
The assembly of relapse
VTA dopamine neurons form channels linked to differences in behavioral and motivational function (Lammel et al., 2008, 2011, 2012; Cohen et al., 2012; Watabe-Uchida et al., 2012; Tian et al., 2016; Saunders et al., 2018; de Jong et al., 2019; Heymann et al., 2020) that are linked to distinct profiles of dopamine release and binding across compartments of the ventral striatum (de Jong et al., 2019; Mohebi et al., 2019). The isolated response profiles of individual compartments of the mesolimbic dopamine system during self-administration, extinction, and relapse were interesting in this regard (e.g., Figs. 2C, 3C). These showed considerable heterogeneity both within the same compartment across the different stages of self-administration and relapse as well as between compartments during the same behavioral stages. For example, early self-administration training was associated with significant reductions in mVTA Th Ca2+ and AcbShM dopamine transients; whereas during the same stage, there were increases in these transients for lVTA and AcbC. In contrast, during reacquisition, there were significant positive transients across the VTA and increased dopamine binding across the ventral striatum. We could also use differences in these activity profiles to show distinct causal roles for mVTA and lVTA in different forms of relapse.
However interesting these individual response profiles may be, a key challenge is to move beyond them to understand how complex behaviors are orchestrated from activity across the mesolimbic dopamine system. This has proved difficult. It requires comparison of response profiles across different brain regions and different measures, in the same or different animals. This problem is not solved by multisite recordings in the same animals because these still require comparison of response profiles across different brain regions. RSA is one approach to overcome this correspondency problem and to reveal how different features of alcohol-seeking relate to different features of the mesolimbic dopamine response. It allowed us to identify mesolimbic dopamine signatures of relapse.
Established alcohol self-administration was a period of striking conformity across the mesolimbic system. This conformity was not present during early self-administration and instead emerged across training, suggesting that it was a product of learning. Extinction, on the other hand, was a fracture point in these signatures. The similarity in activity profiles that was pronounced during late self-administration was lost during the first extinction session, revealing functional segregation across the mesolimbic dopamine system. Overall, there was strong similarity between mVTA and AcbShM as well as between lVTA and AcbC, consistent with contemporary understanding of mesolimbic dopamine architecture (Lammel et al., 2011, 2012; Yang et al., 2018; de Jong et al., 2019). The activity signature of AcbShL, on the other hand, was not only highly dissimilar to the rest of ventral striatum, but also highly dissimilar to itself across self-administration, extinction, and relapse. This dissimilarity between AcbShL and AcbShM was surprising because dopamine actions in both AcbShM and AcbShL are necessary for renewal (Bossert et al., 2007). However, our findings align with other well-described anatomic (Ikemoto, 2007), functional (Basso and Kelley, 1999; Ikemoto et al., 2005), and cellular (Meredith et al., 1993) differences between AcbShL and the remainder of the ventral striatum.
Our finding that different forms of relapse have distinct mesolimbic dopamine signatures stands in contrast to influential theoretical (Bouton, 2002, 2014; Bouton and Todd, 2014; Todd et al., 2014) and clinical (Marlatt, 1996; Stout et al., 1996) models. The mesolimbic dopamine activity signature for renewal was unique. It was dissimilar to self-administration, extinction, and reacquisition. This was surprising because renewal shares many behavioral features with each of these other stages. For example, renewal involves exposure to the same contextual cues as self-administration, shares with extinction the use of environmental cues and memory to guide behavior (e.g., both involve behavior guided by partially observable outcomes), and shares with reacquisition a return to responding after extinction. It is precisely the similarities between different forms of relapse that have shaped contemporary theoretical and clinical understanding. Nonetheless, the mesolimbic dopamine signature of renewal was dissimilar to other stages of self-administration. Relapse initiated by contextual cues is distinctly represented by the mesolimbic dopamine system.
Reacquisition, on the other hand, was not distinctly represented. The mesolimbic dopamine signature of reacquisition was remarkably similar to late self-administration and dissimilar to early acquisition. So, the mesolimbic dopamine signature that emerged across days of self-administration and was lost across extinction rapidly reappeared during a single session of reacquisition. This preservation or savings of the mesolimbic dopamine signature from late self-administration is strong evidence that extinction training does not return the mesolimbic dopamine system to a naive state. Importantly, the savings of the dopamine signature from late self-administration and the widespread upregulation of mesolimbic dopamine activity during reacquisition offer a powerful biological explanation for why relapse after contingent contact with alcohol is so difficult to prevent or treat (Marlatt and Donovan, 2005; Anton et al., 2006; Willcocks and McNally, 2014).
Methodological considerations
We focused here on the mesolimbic dopamine system in relapse. However, dopamine binding in other brain regions is also likely to contribute to these forms of relapse. For example, the orbitofrontal cortex (Lasseter et al., 2014) and dorsal striatum (Bossert et al., 2009) have both been implicated in dopamine contributions to renewal. Likewise, we focused on renewal and reacquisition as two forms of relapse, so it remains to be discovered whether the dopamine signatures of other forms of relapse (cue, stress, priming) have the same or different features to those discovered here. It also remains to be discovered whether and how these signatures vary across different drugs of abuse and whether these are the same or different for experiments using extended access to alcohol as opposed to the short access (1 h/d) used here. The RSA approach used here offers a powerful and straightforward way to answer these and related questions.
Although we distinguished between mVTA and lVTA as well as between Acb subregions, there is evidence for further functional differences within these regions that depend on DV (Marchant et al., 2010; Millan et al., 2010; Al-Hasani et al., 2015; de Jong et al., 2019) and anteroposterior location in AcbSh (Reynolds and Berridge, 2002, 2003; Castro et al., 2016) and anteroposterior aspects of the VTA (Ikemoto et al., 1998; Lee et al., 2007). Moreover, AcbShL viral expression (but not fiber tips) encroached on dorsal striatum. Whether and how such anatomic differences relate to relapse await investigation.
We did not include vehicle controls in our DREADD experiments. This raises the possibility that DREADD expression alone may have contributed to differences between groups. However, against this, we did show the same effects using two different DREADDs (hM4Di and KORD) as well as using optogenetic silencing. So, the effects we observed here were independent of how VTA TH cells were silenced.
Finally, our goal here was to map activity across the VTA and ventral striatum during relapse. Pathway-specific manipulations are beginning to show causal roles for individual mesolimbic pathways in relapse (Valyear et al., 2020). Although we show different roles for mVTA and lVTA in different forms of relapse, and the results of our RSA are consistent with recent descriptions of mesolimbic dopamine architecture, our approach was not intended to test specific causal inferences about specific pathways. Rather, it was intended to provide the first overview of mesolimbic dopamine activity during relapse. We show complex changes across many compartments of the mesolimbic dopamine system during self-administration and relapse and that these changes differ for different forms of relapse.
In conclusion, return to drug-seeking after a period of treatment and abstinence remains a key theoretical and clinical problem. Here we show a key role for VTA TH neurons in this relapse, and we report the mesolimbic dopamine activity signatures for two forms of relapse. Our key findings are that there are distinct mesolimbic dopamine signatures for different forms of relapse. Relapse initiated by contextual cues is distinctly represented by the mesolimbic dopamine system, whereas relapse initiated by contingent reexposure to alcohol is similar to the activity signature of well-trained self-administration. These unique activity signatures for different forms of relapse highlight the need for new theoretical models to better understand the mechanisms, and inform clinical approaches, for preventing relapse.
Footnotes
This work was supported by National Health and Medical Research Council GNT1164514 and GNT1138062, University of New South Wales Research Infrastructure Scheme, and University of New South Wales School of Psychology. Data reported here are archived in the University of New South Wales Long Term Data Archive (ID: D0239413).
The authors declare no competing financial interests.
References
- Al-Hasani R, McCall JG, Shin G, Gomez AM, Schmitz GP, Bernardi JM, Pyo CO, Park SI, Marcinkiewcz CM, Crowley NA, Krashes MJ, Lowell BB, Kash TL, Rogers JA, Bruchas MR (2015) Distinct subpopulations of nucleus accumbens dynorphin neurons drive aversion and reward. Neuron 87:1063–1077. 10.1016/j.neuron.2015.08.019 [DOI] [PMC free article] [PubMed] [Google Scholar]
- American Psychiatric Association (2013) Diagnostic and statistical manual of mental disorders, Ed 5 Arlington, VA: American Psychiatric. [Google Scholar]
- Anton RF, O'Malley SS, Ciraulo DA, Cisler RA, Couper D, Donovan DM, Gastfriend DR, Hosking JD, Johnson BA, LoCastro JS, Longabaugh R, Mason BJ, Mattson ME, Miller WR, Pettinati HM, Randall CL, Swift R, Weiss RD, Williams LD, Zweben A, et al. (2006) Combined Pharmacotherapies and Behavioral Interventions for Alcohol Dependence---the COMBINE Study: a randomized controlled trial. JAMA 295:2003–2017. 10.1001/jama.295.17.2003 [DOI] [PubMed] [Google Scholar]
- Basso AM, Kelley AE (1999) Feeding induced by GABAA receptor stimulation within the nucleus accumbens shell: regional mapping and characterization of macronutrient and taste preference. Behav Neurosci 113:324–336. 10.1037/0735-7044.113.2.324 [DOI] [PubMed] [Google Scholar]
- Bird KD. (2004) Analysis of variance via confidence intervals. London: Sage. [Google Scholar]
- Bossert JM, Poles GC, Wihbey KA, Koya E, Shaham Y (2007) Differential effects of blockade of dopamine D1-family receptors in nucleus accumbens core or shell on reinstatement of heroin seeking induced by contextual and discrete cues. J Neurosci 27:12655–12663. 10.1523/JNEUROSCI.3926-07.2007 [DOI] [PMC free article] [PubMed] [Google Scholar]
- Bossert JM, Wihbey KA, Pickens CL, Nair SG, Shaham Y (2009) Role of dopamine D(1)-family receptors in dorsolateral striatum in context-induced reinstatement of heroin seeking in rats. Psychopharmacology (Berl) 206:51–60. 10.1007/s00213-009-1580-x [DOI] [PMC free article] [PubMed] [Google Scholar]
- Bossert JM, Marchant NJ, Calu DJ, Shaham Y (2013) The reinstatement model of drug relapse: recent neurobiological findings, emerging research topics, and translational research. Psychopharmacology (Berl) 229:453–476. 10.1007/s00213-013-3120-y [DOI] [PMC free article] [PubMed] [Google Scholar]
- Bouton ME. (2002) Context, ambiguity, and unlearning: sources of relapse after behavioral extinction. Biol Psychiatry 52:976–986. 10.1016/S0006-3223(02)01546-9 [DOI] [PubMed] [Google Scholar]
- Bouton ME. (2014) Why behavior change is difficult to sustain. Prev Med 68:29–36. 10.1016/j.ypmed.2014.06.010 [DOI] [PMC free article] [PubMed] [Google Scholar]
- Bouton ME, Todd TP (2014) A fundamental role for context in instrumental learning and extinction. Behav Process 104:13–19. 10.1016/j.beproc.2014.02.012 [DOI] [PMC free article] [PubMed] [Google Scholar]
- Bouton ME, Todd TP, Vurbic D, Winterbauer NE (2011) Renewal after the extinction of free operant behavior. Learn Behav 39:57–67. 10.3758/s13420-011-0018-6 [DOI] [PMC free article] [PubMed] [Google Scholar]
- Carelli RM, Deadwyler SA (1994) A comparison of nucleus accumbens neuronal firing patterns during cocaine self-administration and water reinforcement in rats. J Neurosci 14:7735–7746. 10.1523/JNEUROSCI.14-12-07735.1994 [DOI] [PMC free article] [PubMed] [Google Scholar]
- Carelli RM, Ijames SG (2000) Nucleus accumbens cell firing during maintenance, extinction, and reinstatement of cocaine self-administration behavior in rats. Brain Res 866:44–54. 10.1016/S0006-8993(00)02217-4 [DOI] [PubMed] [Google Scholar]
- Castro DC, Terry RA, Berridge KC (2016) Orexin in rostral hotspot of nucleus accumbens enhances sucrose 'liking' and intake but scopolamine in caudal shell shifts 'liking' toward 'disgust' and 'fear'. Neuropsychopharmacology 41:2101–2111. 10.1038/npp.2016.10 [DOI] [PMC free article] [PubMed] [Google Scholar]
- Chang JY, Janak PH, Woodward DJ (1998) Comparison of mesocorticolimbic neuronal responses during cocaine and heroin self-administration in freely moving rats. J Neurosci 18:3098–3115. 10.1523/JNEUROSCI.18-08-03098.1998 [DOI] [PMC free article] [PubMed] [Google Scholar]
- Chang JY, Janak PH, Woodward DJ (2000) Neuronal and behavioral correlations in the medial prefrontal cortex and nucleus accumbens during cocaine self-administration by rats. Neuroscience 99:433–443. 10.1016/S0306-4522(00)00218-9 [DOI] [PubMed] [Google Scholar]
- Chaudhri N, Sahuque LL, Janak PH (2009) Ethanol seeking triggered by environmental context is attenuated by blocking dopamine D1 receptors in the nucleus accumbens core and shell in rats. Psychopharmacology (Berl) 207:303–314. 10.1007/s00213-009-1657-6 [DOI] [PMC free article] [PubMed] [Google Scholar]
- Cohen JY, Haesler S, Vong L, Lowell BB, Uchida N (2012) Neuron-type-specific signals for reward and punishment in the ventral tegmental area. Nature 482:85–88. 10.1038/nature10754 [DOI] [PMC free article] [PubMed] [Google Scholar]
- Crombag HS, Shaham Y (2002) Renewal of drug-seeking by contextual cues after prolonged extinction in rats. Behav Neurosci 116:169–173. 10.1037/0735-7044.116.1.169 [DOI] [PubMed] [Google Scholar]
- Crombag HS, Grimm JW, Shaham Y (2002) Effect of dopamine receptor antagonists on renewal of cocaine seeking by reexposure to drug-associated contextual cues. Neuropsychopharmacology 27:1006–1015. 10.1016/S0893-133X(02)00356-1 [DOI] [PubMed] [Google Scholar]
- de Jong JW, Afjei SA, Pollak Dorocic I, Peck JR, Liu C, Kim CK, Tian L, Deisseroth K, Lammel S (2019) A neural circuit mechanism for encoding aversive stimuli in the mesolimbic dopamine system. Neuron 101:133–151.e137. 10.1016/j.neuron.2018.11.005 [DOI] [PMC free article] [PubMed] [Google Scholar]
- Everitt BJ, Belin D, Economidou D, Pelloux Y, Dalley JW, Robbins TW (2008) Review: neural mechanisms underlying the vulnerability to develop compulsive drug-seeking habits and addiction. Philos Trans R Soc Lond B Biol Sci 363:3125–3135. 10.1098/rstb.2008.0089 [DOI] [PMC free article] [PubMed] [Google Scholar]
- Gibson GD, Prasad AA, Jean-Richard-Dit-Bressel P, Yau JO, Millan EZ, Liu Y, Campbell EJ, Lim J, Marchant NJ, Power JM, Killcross S, Lawrence AJ, McNally GP (2018) Distinct accumbens shell output pathways promote versus prevent relapse to alcohol-seeking. Neuron 98:512–520.e516. 10.1016/j.neuron.2018.03.033 [DOI] [PubMed] [Google Scholar]
- Gomez JL, Bonaventura J, Lesniak W, Mathews WB, Sysa-Shah P, Rodriguez LA, Ellis RJ, Richie CT, Harvey BK, Dannals RF, Pomper MG, Bonci A, Michaelides M (2017) Chemogenetics revealed: DREADD occupancy and activation via converted clozapine. Science 357:503–507. 10.1126/science.aan2475 [DOI] [PMC free article] [PubMed] [Google Scholar]
- Gunaydin LA, Grosenick L, Finkelstein JC, Kauvar IV, Fenno LE, Adhikari A, Lammel S, Mirzabekov JJ, Airan RD, Zalocusky KA, Tye KM, Anikeeva P, Malenka RC, Deisseroth K (2014) Natural neural projection dynamics underlying social behavior. Cell 157:1535–1551. 10.1016/j.cell.2014.05.017 [DOI] [PMC free article] [PubMed] [Google Scholar]
- Hamlin AS, Newby J, McNally GP (2007) The neural correlates and role of D1 dopamine receptors in renewal of extinguished alcohol-seeking. Neuroscience 146:525–536. 10.1016/j.neuroscience.2007.01.063 [DOI] [PubMed] [Google Scholar]
- Harris RJ. (2004) ANOVA: an analysis of variance primer. Itasca, IL: Peacock. [Google Scholar]
- Heymann G, Jo YS, Reichard KL, McFarland N, Chavkin C, Palmiter RD, Soden ME, Zweifel LS (2020) Synergy of distinct dopamine projection populations in behavioral reinforcement. Neuron 105:909–920. 10.1016/j.neuron.2019.11.024 [DOI] [PMC free article] [PubMed] [Google Scholar]
- Ikemoto S. (2007) Dopamine reward circuitry: two projection systems from the ventral midbrain to the nucleus accumbens-olfactory tubercle complex. Brain Res Rev 56:27–78. 10.1016/j.brainresrev.2007.05.004 [DOI] [PMC free article] [PubMed] [Google Scholar]
- Ikemoto S, Murphy JM, Mcbride WJ (1998) Regional differences within the rat ventral tegmental area for muscimol self-infusions. Pharmacol Biochem Behav 61:87–92. 10.1016/S0091-3057(98)00086-0 [DOI] [PubMed] [Google Scholar]
- Ikemoto S, Qin M, Liu ZH (2005) The functional divide for primary reinforcement of D-amphetamine lies between the medial and lateral ventral striatum: is the division of the accumbens core, shell, and olfactory tubercle valid? J Neurosci 25:5061–5065. 10.1523/JNEUROSCI.0892-05.2005 [DOI] [PMC free article] [PubMed] [Google Scholar]
- Janak PH, Chang JY, Woodward DJ (1999) Neuronal spike activity in the nucleus accumbens of behaving rats during ethanol self-administration. Brain Res 817:172–184. 10.1016/S0006-8993(98)01245-1 [DOI] [PubMed] [Google Scholar]
- Jean-Richard-dit-Bressel P, Clifford CW, McNally GP (2020) Analyzing event-related transients: confidence intervals, permutation tests, and consecutive thresholds. Front Mol Neurosci 13:14. 10.3389/fnmol.2020.00014 [DOI] [PMC free article] [PubMed] [Google Scholar]
- Jonas DE, Amick HR, Feltner C, Bobashev G, Thomas K, Wines R, Kim MM, Shanahan E, Gass CE, Rowe CJ, Garbutt JC (2014) Pharmacotherapy for adults with alcohol use disorders in outpatient settings: a systematic review and meta-analysis. JAMA 311:1889–1900. 10.1001/jama.2014.3628 [DOI] [PubMed] [Google Scholar]
- Kriegeskorte N, Kievit RA (2013) Representational geometry: integrating cognition, computation, and the brain. Trends Cogn Sci 17:401–412. 10.1016/j.tics.2013.06.007 [DOI] [PMC free article] [PubMed] [Google Scholar]
- Kriegeskorte N, Mur M, Bandettini P (2008a) Representational similarity analysis: connecting the branches of systems neuroscience. Front Syst Neurosci 2:4. 10.3389/neuro.06.004.2008 [DOI] [PMC free article] [PubMed] [Google Scholar]
- Kriegeskorte N, Mur M, Ruff DA, Kiani R, Bodurka J, Esteky H, Tanaka K, Bandettini PA (2008b) Matching categorical object representations in inferior temporal cortex of man and monkey. Neuron 60:1126–1141. 10.1016/j.neuron.2008.10.043 [DOI] [PMC free article] [PubMed] [Google Scholar]
- Lammel S, Hetzel A, Hackel O, Jones I, Liss B, Roeper J (2008) Unique properties of mesoprefrontal neurons within a dual mesocorticolimbic dopamine system. Neuron 57:760–773. 10.1016/j.neuron.2008.01.022 [DOI] [PubMed] [Google Scholar]
- Lammel S, Ion DI, Roeper J, Malenka RC (2011) Projection-specific modulation of dopamine neuron synapses by aversive and rewarding stimuli. Neuron 70:855–862. 10.1016/j.neuron.2011.03.025 [DOI] [PMC free article] [PubMed] [Google Scholar]
- Lammel S, Lim BK, Ran C, Huang KW, Betley MJ, Tye KM, Deisseroth K, Malenka RC (2012) Input-specific control of reward and aversion in the ventral tegmental area. Nature 491:212–217. 10.1038/nature11527 [DOI] [PMC free article] [PubMed] [Google Scholar]
- Lasseter HC, Xie X, Arguello AA, Wells AM, Hodges MA, Fuchs RA (2014) Contribution of a mesocorticolimbic subcircuit to drug context-induced reinstatement of cocaine-seeking behavior in rats. Neuropsychopharmacology 39:660–669. 10.1038/npp.2013.249 [DOI] [PMC free article] [PubMed] [Google Scholar]
- Lee DY, Guttilla M, Fung KD, McFeron S, Yan J, Ranaldi R (2007) Rostral–caudal differences in the effects of intra-VTA muscimol on cocaine self-administration. Pharmacol Biochem Behav 86:542–549. 10.1016/j.pbb.2007.01.017 [DOI] [PMC free article] [PubMed] [Google Scholar]
- Liu Z, Brown A, Fisher D, Wu Y, Warren J, Cui X (2016) Tissue specific expression of Cre in rat tyrosine hydroxylase and dopamine active transporter-positive neurons. PLoS One 11:e0149379. 10.1371/journal.pone.0149379 [DOI] [PMC free article] [PubMed] [Google Scholar]
- Luscher C. (2016) The emergence of a circuit model for addiction. Annu Rev Neurosci 39:257–276. [DOI] [PubMed] [Google Scholar]
- Mahler SV, Vazey EM, Beckley JT, Keistler CR, McGlinchey EM, Kaufling J, Wilson SP, Deisseroth K, Woodward JJ, Aston-Jones G (2014) Designer receptors show role for ventral pallidum input to ventral tegmental area in cocaine seeking. Nat Neurosci 17:577–585. 10.1038/nn.3664 [DOI] [PMC free article] [PubMed] [Google Scholar]
- Marchant NJ, Kaganovsky K (2015) A critical role of accumbens D1-family receptors in renewal of alcohol-seeking after punishment-imposed abstinence. Behav Neurosci 129:281–291. 10.1037/bne0000050 [DOI] [PMC free article] [PubMed] [Google Scholar]
- Marchant NJ, Furlong TM, McNally GP (2010) Medial dorsal hypothalamus mediates the inhibition of reward seeking after extinction. J Neurosci 30:14102–14115. 10.1523/JNEUROSCI.4079-10.2010 [DOI] [PMC free article] [PubMed] [Google Scholar]
- Marchant NJ, Whitaker LR, Bossert JM, Harvey BK, Hope BT, Kaganovsky K, Adhikary S, Prisinzano TE, Vardy E, Roth BL, Shaham Y (2016) Behavioral and physiological effects of a novel kappa-opioid receptor-based DREADD in rats. Neuropsychopharmacology 41:402–409. 10.1038/npp.2015.149 [DOI] [PMC free article] [PubMed] [Google Scholar]
- Marlatt GA. (1996) Taxonomy of high-risk situations for alcohol relapse: evolution and development of a cognitive-behavioral model. Addiction 91:S37–S49. 10.1111/j.1360-0443.1996.tb02326.x [DOI] [PubMed] [Google Scholar]
- Marlatt GA, Donovan DM (2005) Relapse prevention. New York: Guildford. [Google Scholar]
- McFarland K, Kalivas PW (2001) The circuitry mediating cocaine-induced reinstatement of drug-seeking behavior. J Neurosci 21:8655–8663. 10.1523/JNEUROSCI.21-21-08655.2001 [DOI] [PMC free article] [PubMed] [Google Scholar]
- Meredith GE, Pennartz CM, Groenewegen HJ (1993) The cellular framework for chemical signalling in the nucleus accumbens. Prog Neurobiol 99:3–24. [DOI] [PubMed] [Google Scholar]
- Millan EZ, Furlong TM, McNally GP (2010) Accumbens shell-hypothalamus interactions mediate extinction of alcohol-seeking. J Neurosci 30:4626–4635. 10.1523/JNEUROSCI.4933-09.2010 [DOI] [PMC free article] [PubMed] [Google Scholar]
- Mohebi A, Pettibone JR, Hamid AA, Wong JM, Vinson LT, Patriarchi T, Tian L, Kennedy RT, Berke JD (2019) Dissociable dopamine dynamics for learning and motivation. Nature 570:65–70. 10.1038/s41586-019-1235-y [DOI] [PMC free article] [PubMed] [Google Scholar]
- Nili H, Wingfield C, Walther A, Su L, Marslen-Wilson W, Kriegeskorte N (2014) A toolbox for representational similarity analysis. PLoS Comput Biol 10:e1003553. 10.1371/journal.pcbi.1003553 [DOI] [PMC free article] [PubMed] [Google Scholar]
- Nutt DJ, Lingford-Hughes A, Erritzoe D, Stokes PR (2015) The dopamine theory of addiction: 40 years of highs and lows. Nat Rev Neurosci 16:305–312. 10.1038/nrn3939 [DOI] [PubMed] [Google Scholar]
- Patriarchi T, Cho JR, Merten K, Howe MW, Marley A, Xiong WH, Folk RW, Broussard GJ, Liang R, Jang MJ, Zhong H, Dombeck D, von Zastrow M, Nimmerjahn A, Gradinaru V, Williams JT, Tian L (2018) Ultrafast neuronal imaging of dopamine dynamics with designed genetically encoded sensors. Science 360:eaat4422 10.1126/science.aat4422 [DOI] [PMC free article] [PubMed] [Google Scholar]
- Phillips PE, Stuber GD, Heien ML, Wightman RM, Carelli RM (2003) Subsecond dopamine release promotes cocaine seeking. Nature 422:614–617. 10.1038/nature01476 [DOI] [PubMed] [Google Scholar]
- Reynolds SM, Berridge KC (2002) Positive and negative motivation in nucleus accumbens shell: bivalent rostrocaudal gradients for GABA-elicited eating, taste “Liking”/“Disliking” reactions, place preference/avoidance, and fear. J Neurosci 22:7308–7320. 10.1523/JNEUROSCI.22-16-07308.2002 [DOI] [PMC free article] [PubMed] [Google Scholar]
- Reynolds SM, Berridge KC (2003) Glutamate motivational ensembles in nucleus accumbens: rostrocaudal shell gradients of fear and feeding. Eur J Neurosci 17:2187–2200. 10.1046/j.1460-9568.2003.02642.x [DOI] [PubMed] [Google Scholar]
- Saunders BT, Richard JM, Margolis EB, Janak PH (2018) Dopamine neurons create Pavlovian conditioned stimuli with circuit-defined motivational properties. Nat Neurosci 21:1072–1083. 10.1038/s41593-018-0191-4 [DOI] [PMC free article] [PubMed] [Google Scholar]
- Schmidt HD, Anderson SM, Famous KR, Kumaresan V, Pierce RC (2005) Anatomy and pharmacology of cocaine priming-induced reinstatement of drug-seeking. Eur J Pharmacol 526:65–76. 10.1016/j.ejphar.2005.09.068 [DOI] [PubMed] [Google Scholar]
- Sparta DR, Stamatakis AM, Phillips JL, Hovelso N, van Zessen R, Stuber GD (2011) Construction of implantable optical fibers for long-term optogenetic manipulation of neural circuits. Nat Protoc 7:12–23. 10.1038/nprot.2011.413 [DOI] [PMC free article] [PubMed] [Google Scholar]
- Stout RL, Longabaugh R, Rubin A (1996) Predictive validity of Marlatt's relapse taxonomy versus a more general relapse code. Addiction 91:S99–S110. 10.1111/j.1360-0443.1996.tb02330.x [DOI] [PubMed] [Google Scholar]
- Stuber GD, Roitman MF, Phillips PE, Carelli RM, Wightman RM (2005a) Rapid dopamine signaling in the nucleus accumbens during contingent and noncontingent cocaine administration. Neuropsychopharmacology 30:853–863. 10.1038/sj.npp.1300619 [DOI] [PubMed] [Google Scholar]
- Stuber GD, Wightman RM, Carelli RM (2005b) Extinction of cocaine self-administration reveals functionally and temporally distinct dopaminergic signals in the nucleus accumbens. Neuron 46:661–669. 10.1016/j.neuron.2005.04.036 [DOI] [PubMed] [Google Scholar]
- Tian J, Huang R, Cohen JY, Osakada F, Kobak D, Machens CK, Callaway EM, Uchida N, Watabe-Uchida M (2016) Distributed and mixed information in monosynaptic inputs to dopamine neurons. Neuron 91:1374–1389. 10.1016/j.neuron.2016.08.018 [DOI] [PMC free article] [PubMed] [Google Scholar]
- Todd TP, Vurbic D, Bouton ME (2014) Behavioral and neurobiological mechanisms of extinction in Pavlovian and instrumental learning. Neurobiol Learn Mem 108:52–64. 10.1016/j.nlm.2013.08.012 [DOI] [PMC free article] [PubMed] [Google Scholar]
- Valyear MD, Glovaci I, Zaari A, Lahlou S, Trujillo-Pisanty I, Chapman CA, Chaudhri N (2020) Divergent mesolimbic dopamine circuits support alcohol-seeking triggered by discrete cues and contexts. bioRxiv. doi: 10.1101/475343. [DOI] [PMC free article] [PubMed] [Google Scholar]
- Vardy E, Robinson JE, Li C, Olsen RH, DiBerto JF, Giguere PM, Sassano FM, Huang XP, Zhu H, Urban DJ, White KL, Rittiner JE, Crowley NA, Pleil KE, Mazzone CM, Mosier PD, Song J, Kash TL, Malanga CJ, Krashes MJ, et al. (2015) A new DREADD facilitates the multiplexed chemogenetic interrogation of behavior. Neuron 86:936–946. 10.1016/j.neuron.2015.03.065 [DOI] [PMC free article] [PubMed] [Google Scholar]
- Volkow ND, Wise RA, Baler R (2017) The dopamine motive system: implications for drug and food addiction. Nat Rev Neurosci 18:741–752. 10.1038/nrn.2017.130 [DOI] [PubMed] [Google Scholar]
- Watabe-Uchida M, Zhu L, Ogawa SK, Vamanrao A, Uchida N (2012) Whole-brain mapping of direct inputs to midbrain dopamine neurons. Neuron 74:858–812. 10.1016/j.neuron.2012.03.017 [DOI] [PubMed] [Google Scholar]
- Willcocks AL, McNally GP (2011) The role of context in re-acquisition of extinguished alcoholic beer-seeking. Behav Neurosci 125:541–550. 10.1037/a0024100 [DOI] [PubMed] [Google Scholar]
- Willcocks AL, McNally GP (2014) An extinction retrieval cue attenuates renewal but not reacquisition of alcohol-seeking. Behav Neurosci 128:83–91. 10.1037/a0035595 [DOI] [PubMed] [Google Scholar]
- Woodward DJ, Chang JY, Janak P, Azarov A, Anstrom K (2000) Activity patterns in mesolimbic regions in rats during operant tasks for reward. Prog Brain Res 126:303–322. 10.1016/S0079-6123(00)26021-4 [DOI] [PubMed] [Google Scholar]
- Yang H, de Jong JW, Tak Y, Peck J, Bateup HS, Lammel S (2018) Nucleus accumbens subnuclei regulate motivated behavior via direct inhibition and disinhibition of VTA dopamine subpopulations. Neuron 97:434–449.e434. 10.1016/j.neuron.2017.12.022 [DOI] [PMC free article] [PubMed] [Google Scholar]
Associated Data
This section collects any data citations, data availability statements, or supplementary materials included in this article.
Supplementary Materials
(A). First-order RDM showing correlation distances between each subject with lVTA gCaMP for each stage of the experiment. Overall levels of dissimilarity were low across the experiment with the notable exception of extinction. (B) Dissimilarity between each subject and the trial-based kernels across all experimental stages for mVTA. (C) Dissimilarity between each subject and the trial-based kernels across all experimental stages for lVTA. In both mVTA and lVTA, overall levels of dissimilarity were low, showing that trial-based data were representative. In all panels, animals were not recorded on Day 2 (early acquisition and are excluded, data shown as NaN). Download Figure 3-1, TIF file (1.3MB, tif) .
Dissimilarity between each subject and the trial-based kernels across all experimental stages for AcbShM (A), AcbC (B), and AcbShL (C). Overall levels of dissimilarity were low, showing that trial-based data were representative. Download Figure 3-1, TIF file (900.5KB, tif) .