Abstract
Objective
This study was performed to investigate the value of computed tomography (CT) in the differentiation of gastric glomus tumors (GGTs) and small gastric stromal tumors (GSTs).
Methods
Fifty-nine patients with pathologically confirmed GGTs (n = 11) and GSTs (n = 48) from 2006 to 2019 were retrospectively evaluated. All patients’ preoperative CT imaging features were analyzed.
Results
The following features were significantly different between GGTs and small GSTs: location in the antrum, endophytic growth, heterogeneous enhancement in the arterial phase, CT value in the arterial phase of ≥60.7 Hounsfield units (HU), CT value in the portal phase of ≥87.6 HU, degree of enhancement in the arterial phase of ≥29.9 HU, and degree of enhancement in the portal phase of ≥49.0 HU. A model including four randomly selected features among these seven criteria was built to differentiate GGTs from small GSTs with a sensitivity and specificity of 90.9% (10/11) and 100% (48/48), respectively.
Conclusion
We identified seven features that are useful for differentiating GGTs from small GSTs. A combination of four of these seven criteria may increase the diagnostic accuracy.
Keywords: Gastric glomus tumor, gastric stromal tumor, subepithelial tumors, gastric neoplasm, computed tomography, X-ray
Introduction
A glomus tumor is a benign tumor that originates from the modified smooth muscle cells of the glomus body. Glomus tumors can occur anywhere in the body but are extremely rare in the stomach, where they account for <1% of all gastrointestinal soft tissue tumors.1,2 Gastric glomus tumors (GGTs) usually grow in the antrum, and patients with GGTs often have no specific symptoms.3,4
Most GGTs cannot be differentiated from small gastric stromal tumors (GSTs) without invasive procedures to obtain tissue because of the similar clinical manifestations and radiographic appearances between the two tumor types.5,6 To our knowledge, 20% to 30% of GSTs have a high risk of recurrence and metastasis that lead to a poor prognosis, even when they are small.7–10 Although several case reports have described the computed tomography (CT) features of GGTs,11–13 the CT imaging differentiation of GGTs from small GSTs has been less well studied. Choi et al.14 recently attempted to identify CT features such as a non-cardia location, heterogeneous enhancement, presence of necrosis, larger lesion size, and absence of lymphadenopathy, which were helpful to differentiate large GSTs from other benign gastric tumors. However, they did not mention the differentiation between GSTs and GGTs. A precise preoperative diagnosis of GGTs may provide certain guidance for clinical treatment decision-making because small GGTs with a more indolent course could be left in situ or monitored by various tests. CT is widely used for the diagnosis and preoperative examination of gastric diseases in clinical practice.15–17 Therefore, as a noninvasive and economic imaging modality, CT is an optimal method to differentiate these two diseases.
In the present study, we performed a detailed analysis of the CT features between GGTs and small GSTs of <4 cm in diameter to obtain a precise diagnosis without an invasive procedure or operation.
Materials and methods
Patients
We searched the database in Tongde Hospital of Zhejiang Province and Zhejiang University School of Medicine Sir Run Run Shaw Hospital from January 2006 to August 2019 for patients with GGTs and from January 2014 to August 2018 for patients with GSTs. Finally, 301 pathologically confirmed cases of GGTs (n = 12) and GSTs (n = 289) were found. Patients who met the following criteria were included in this study: pathological diagnosis of GGT or GST, available contrast-enhanced CT images, tumor diameter of >1 to <4 cm, solitary lesion, and available integrated clinical data. One GGT and 38 GSTs were excluded because of unavailable integrated clinical data or CT images. We also excluded 4 GSTs with multiple lesions and 199 GSTs with diameters of >4 cm or <1 cm. Finally, 11 patients with GGTs (3 men, 8 women; mean age, 53.3 ± 10.34 years; age range, 42–69 years) and 48 patients with small GSTs (21 men, 27 women; mean age, 61.0 ± 7.71 years; range, 36–80 years) were enrolled in this study (Figure 1).
Figure 1.
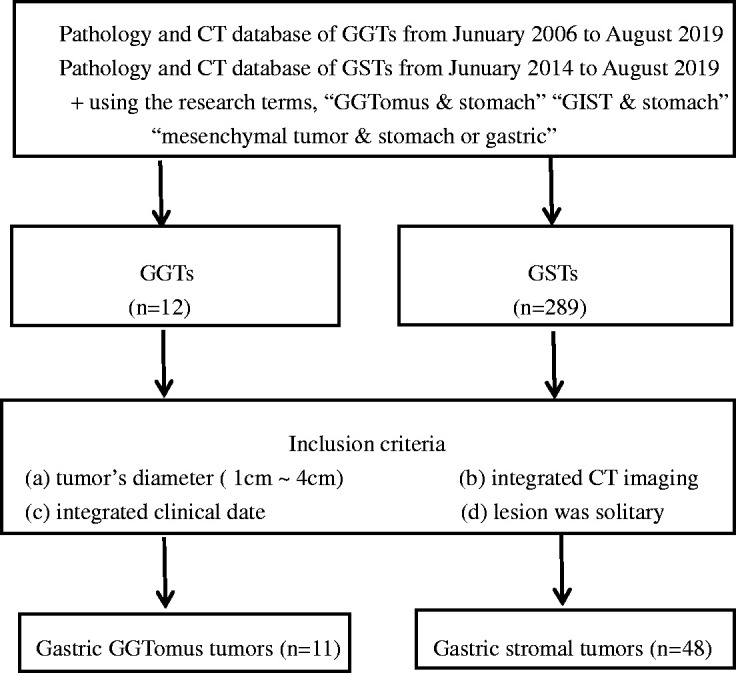
Flowchart of study based on recommended standards for differentiating diagnostic accuracy.
CT acquisition
All enhanced CT images were obtained on a multidetector CT scanner (SOMATOM Sensation 16, Siemens Healthcare, Forchheim, Germany; Siemens Definition AS 40, Siemens Healthcare; SOMATOM Definition Flash, Siemens Healthcare; or LightSpeed VCT, GE Healthcare, Milwaukee, WI, USA).
For each patient, contrast-enhanced images of the arterial phase (AP) and portal venous phase (PP) were acquired with 30- and 60-s delays, respectively. Using a power injector (Ulrich Medizintechnik, Buchbrunnenweg, Germany), 150 mL of contrast agent (either iopamidol, 300 mg of iodine/mL [Iopamiro, Bracco Sine, Shanghai, China] or iohexol, 300 mg iodine/mL [Omnipaque 300, Amersham, Shanghai, China]) was injected at a rate of 3 to 5 mL/s through a large-bore peripheral intravenous catheter into a medially located antecubital vein. The scanning parameters for the CT examination were set as follows. SOMATOM Sensation 16: beam collimation = 1.2 mm × 16, pitch = 1, kVp/effective mA = 120/300, and gantry rotation time = 0.5 s. Siemens Definition AS 40: beam collimation = 1.2 mm × 40, pitch = 1, kVp/effective mA = 120/300, and gantry rotation time = 0.5 s. SOMATOM Definition Flash: beam collimation = 1.2 mm × 32, pitch = 1, kVp/effective mA = 120/300, and gantry rotation time = 0.5 s. LightSpeed VCT: beam collimation = 0.625 mm × 64, pitch = 0.984, kVp/mA = 120/100–300, and gantry rotation time = 0.6 s. Multidetector CT was performed using the inspiratory breath-holding method. All original images were reconstructed into a 2-mm slice thickness and subsequently uploaded to a picture archiving and communication system (GE Healthcare-Centricity RIS CE V2.0; GE Medical Systems, Fairfield, CT, USA) for analysis.
Image analysis
Two radiologists (J.W. with 14 years of experience and WQ.A. with 13 years of experience) interpreted the CT images independently and then reached a consensus regarding the characteristic features between GGTs and small GSTs. Both radiologists were unaware of the pathological results before evaluating the CT images.
Based on the CT images, the radiologists assessed the following CT features: size, location, contour, growth pattern, gradual enhancement, enhancement pattern, the presence of necrosis, the presence of calcification, and the presence of surface ulceration. Symptoms that did not occur in either GGTs or GSTs, such as hemorrhage and lymphadenopathy, were not further analyzed statistically. The long diameter (LD) and short diameter (SD) of each tumor were measured. The locations were classified as cardia, fundus, body, and antrum, and the contours were categorized as round, oval, and irregular. Three growth patterns were defined: endophytic (the mass was completely located in the gastric lumen without bulging into the exophytic space), exophytic (the tumor was confined to the extraluminal space without protruding into the gastric lumen), and mixed type (the mass had combined features of both endophytic and exophytic growth). The degree of enhancement (DE) was divided into two types: DE (AP) (CT attenuation value of the AP minus that of the unenhanced phase) and DE (PP) (CT attenuation value of the PP minus that of the unenhanced phase). The enhancement pattern (homogeneous or heterogeneous) was also evaluated. Homogeneous enhancement was defined as fluctuation of the CT values of <20 Hounsfield units (HU) in the AP or PP. Otherwise, the pattern was regarded as heterogeneous enhancement. A gradual enhancement pattern was defined as a higher DE (PP) than DE (AP) value. Intralesional necrosis was defined as a CT attenuation value of <20 HU and no visible enhancement, and unenhanced CT attenuation values of >100 HU were considered to indicate intralesional calcification.10 Surface ulcerations were considered to be present when the endoluminal surface of the lesion showed a focal tissue defect.
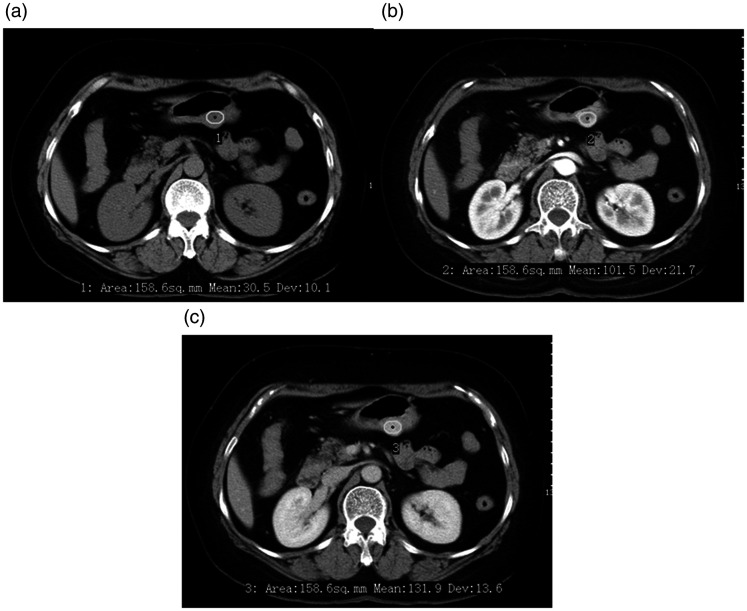
Two radiologists measured the LD and SD of all lesions on the transverse images and calculated the LD/SD ratio. The CT attenuation values of the lesions were measured in HU using 20- to 40-mm2 circular regions of interest (ROIs) on the corresponding level of the cross-sectional unenhanced and contrast-enhanced CT images (Figure 2), and the DE (AP) and DE (PP) were then calculated. The ROI cursors were carefully drawn to encompass as much of the obviously enhanced areas of the lesions as possible and to avoid necrosis, calcification, adjacent tissues, and organs. Each ROI was measured three times, and the average value was calculated for analysis.
Figure 2.
A 53-year-old woman with a gastric glomus tumor detected using enhanced computed tomography (CT). (a) Axial unenhanced CT scan showed a round mass in the gastric body. (b) Axial contrast-enhanced CT scan showed a heterogeneously enhanced mass in the arterial phase. (c) Axial contrast-enhanced CT scan showed a homogeneous and gradually enhancing mass in the portal venous phase. The CT values of the three phases were 30.5, 101.5, and 131.9 HU, respectively.
Statistical analysis
The differences in qualitative data and quantitative data were assessed. The rank sum test (abnormally distributed data and/or heterogeneity of variance) or the independent-samples t test (normally distributed data and homogeneity of variance) was used to compare continuous variables, including age, LD, SD, LD/SD, CT attenuation values, and DE, between the GGTs and small GSTs. Statistically significant variables were analyzed by the receiver operating characteristic (ROC) curve to determine the optimal cutoff value, sensitivity, and specificity.
A P value of <0.05 was considered statistically significant. MedCalc version 8.0.0.1 for Windows (MedCalc Software, Ostend, Belgium) was used for all analyses.
Ethical approval
The review board of our institute waived the requirement for ethics approval. Additionally, the patients were not required to provide informed consent because of the anonymous nature of the data analysis.
Results
Clinical features
The clinical features of the patients with GGTs and small GSTs are summarized in Table 1. There were no significant differences in the sex distribution or clinical symptoms between the two groups. However, a significant difference was observed in the mean age of patients with GGTs versus small GSTs (53.3 ± 10.3 vs. 61.0 ± 7.7 years, respectively; P < 0.05).
Table 1.
Clinical characteristics of 59 patients with GGTs and small GSTs.
| Clinical characteristics | GGT (n = 11) | GST (n = 48) | P value* |
|---|---|---|---|
| Sex | |||
| Male | 3 (27.3) | 21 (43.8) | 0.316a |
| Female | 8 (72.7) | 27 (56.2) | |
| Mean age, years | 53.3 ± 10.3 | 61.0 ± 7.7 | 0.003b |
| Age range, years | (42–69) | (36–80) | |
| Symptoms | |||
| Yes | 7 (63.6) | 34 (70.8) | 0.640a |
| No | 4 (36.4) | 14 (29.2) |
Data are presented as n (%) or mean ± standard deviation unless otherwise indicated.
GGT, gastric glomus tumor; GST, gastric stromal tumor.
*Between GGT and GST; calculated with aχ2 test and bStudent’s t test.
Qualitative CT findings
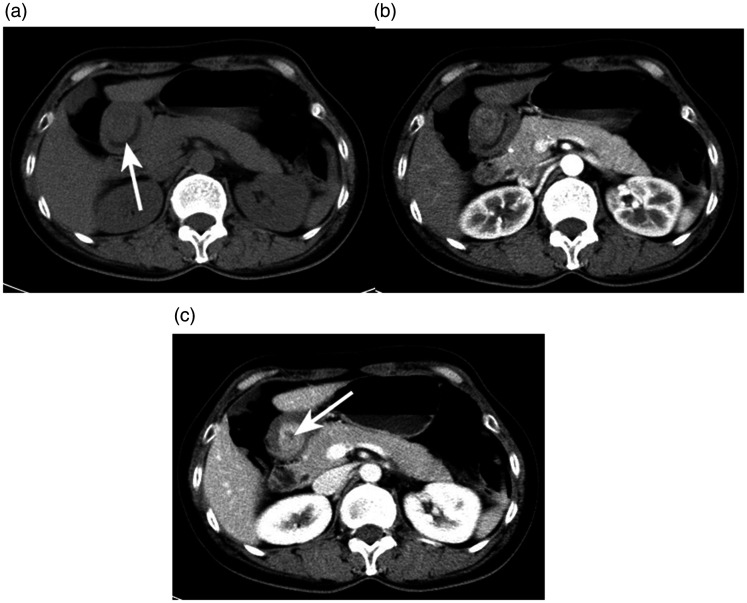
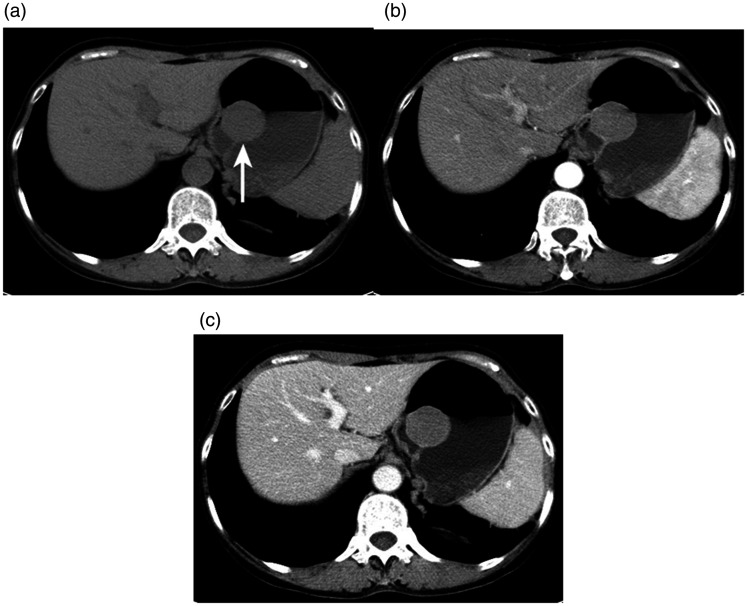
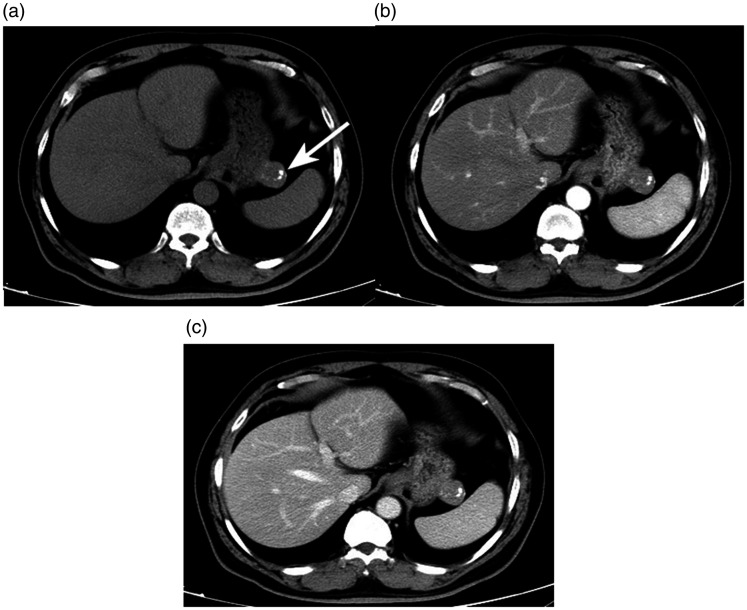
The results of the qualitative imaging analysis are shown in Table 2. The tumor site distribution was significantly different between the two groups (P < 0.001). Most GGTs were located in the antrum (72.7% [8/11]) (Figure 3), while most GSTs were located in the body of the stomach (72.9% [35/48]) (Figure 4). GGTs tended to grow endoluminally (72.7% [8/11]), while GSTs showed a mainly exophytic growth pattern (62.5% [30/48]) (P < 0.05) (Figures 4 and 5).
Table 2.
Qualitative CT findings of 59 patients with GGTs and small GSTs.
| CT criteria | GGT (n = 11) | GST (n = 48) | P value* |
|---|---|---|---|
| Qualitative analysis | |||
| Location | <0.001 | ||
| Cardia | 0 (0.0) | 3 (6.3) | |
| Fundus | 0 (0.0) | 7 (14.6) | |
| Body | 3 (27.3) | 35 (72.9) | |
| Antrum | 8 (72.7) | 3 (6.3) | |
| Contour | 0.415 | ||
| Round or oval | 8 (72.7) | 40 (83.3) | |
| Irregular | 3 (27.3) | 8 (16.7) | |
| Growth pattern | 0.029 | ||
| Endophytic | 8 (72.7) | 16 (33.3) | |
| Exophytic | 2 (18.2) | 30 (62.5) | |
| Mixed | 1 (9.1) | 2 (4.2) | |
| Gradual enhancement | 0.159 | ||
| Yes | 12 (100) | 41 (85.4) | |
| No | 0 (0.0) | 7 (14.6) | |
| Pattern of enhancement | |||
| Homogenousa,b | 5 (45.5)a, 10 (90.9)b | 45 (93.7)a,b | <0.001a |
| Heterogeneousa,b | 6 (54.5)a, 1 (9.1)b | 3 (6.3)a,b | 0.735b |
| Necrosis | 1 (9.1) | 3 (6.3) | 0.735 |
| Calcification | 1 (9.1) | 6 (12.5) | 0.752 |
| Surface ulceration | 1(9.1) | 1 (2.1) | 0.247 |
Data are presented as n (%).
CT, computed tomography; GGT, gastric glomus tumor; GST, gastric stromal tumor.
*Between GGT and GST; calculated with χ2 test.
aPattern of enhancement in the arterial phase. bPattern of enhancement in the portal venous phase.
Figure 3.
A 51-year-old woman with a gastric glomus tumor detected using enhanced computed tomography (CT). (a) Axial unenhanced CT scan depicted an oval mass in the antrum (↑). Axial contrast-enhanced CT scans in the (b) arterial phase and (c) portal venous phase showed a heterogeneous and gradually enhancing mass with a low attenuating necrotic portion (↑). The CT values of the three phases were 37.4, 58.9, and 101.0 HU, respectively.
Figure 4.
A 52-year-old woman with a gastric stromal tumor detected using enhanced computed tomography (CT). (a) Axial unenhanced CT scan showed a round mass in the gastric fundus (arrows). Axial contrast-enhanced CT scans in the (b) arterial phase and (c) portal venous phase showed a homogeneous, non-gradually enhancing mass. The CT values of the three phases were 32.0, 61.1, and 55.7 HU, respectively.
Figure 5.
A 71-year-old man with a gastric stromal tumor detected using enhanced computed tomography (CT). (a) Axial unenhanced CT scan showed an irregular mass with dispersed or isolated calcification spots in the gastric body (arrows). Axial contrast-enhanced CT scans in the (b) arterial phase and (c) portal venous phase showed a homogeneous and gradually enhancing mass. The CT values of the three phases were 37.1, 74.1, and 95.0 HU, respectively.
The two study groups showed different enhancement patterns during biphasic contrast-enhanced CT scanning. The incidence of heterogeneous enhancement in the AP was much higher in patients with GGTs than GSTs (54.5% [6/11] vs. 6.3% [3/48], respectively), while the two groups had a similar incidence of heterogeneous enhancement in the PP. In addition, there was no significant difference in necrosis, calcification, surface ulceration, contour, or gradual enhancement between the two groups. GSTs were more likely than GGTs to show non-gradual enhancement (14.6% [7/48] vs. 0.0% [0/11], respectively).
Quantitative CT findings
The results of the quantitative CT imaging analysis are summarized in Table 3. The CT attenuation values for AP, PP, DE (AP), and DE (PP) of GGTs were significantly higher for GGTs than small GSTs (84.8 ± 26.83 vs. 52.2 ± 10.83 HU for AP, 113.8 ± 26.30 vs. 67.0 ± 14.04 HU for PP, 48.0 ± 27.35 vs. 18.2 ± 9.44 HU for DE [AP], and 77.1 ± 27.06 vs. 32.6 ± 14.10 HU for DE [PP]; P < 0.0001). The other unenhanced CT values showed no significant differences. Additionally, the LD, SD, and LD/SD were not statistically significant CT features in differentiating GGTs from small GSTs.
Table 3.
Quantitative CT findings of 59 patients with GGTs and small GSTs.
| CT criteria | GGT (n = 11) | GST (n = 48) | P value |
|---|---|---|---|
| Quantitative analysis | |||
| CT attenuation value | |||
| Unenhanced, HU | 36.8 ± 4.46 (29.9–44.0) | 34.3 ± 6.97 (18.2–53.0) | 0.129 |
| AP, HU | 84.8 ± 26.83 (56.7–149.6) | 52.2 ± 10.83 (31.7–79.8) | <0.001 |
| PP, HU | 113.8 ± 26.30 (69.8–158.8) | 67.0 ± 14.04 (39.2–97.7) | <0.001 |
| Degree of enhancement | |||
| DE, AP | 48.0 ± 27.35 (17.0–114.0) | 18.2 ± 9.44 (2.5–43.1) | <0.001 |
| DE, PP | 77.1 ± 27.06 (34.6–123.2) | 32.6 ± 14.10 (4.8–68.1) | <0.001 |
| LD, mm | 22.3 ± 7.50 (11–37) | 23.6 ± 7.90 (11–38) | 0.508 |
| SD, mm | 18.6 ± 7.46 (10–36) | 19.7 ± 6.69 (10–35) | 0.558 |
| LD/SD ratio | 1.23 ± 0.18 (1.1–1.5) | 1.21 ± 0.18 (1.0–2.0) | 0.754 |
Data are presented as mean ± standard deviation and range.
GGT, gastric glomus tumor; GST, gastric stromal tumor; CT, computed tomography; HU, Hounsfield unit; AP, arterial phase; PP, portal venous phase; DE, degree of enhancement; LD, long diameter; SD, short diameter.
*Between GGT and GST; calculated with the independent-samples t test or rank sum test.
Sensitivity and specificity of CT diagnosis
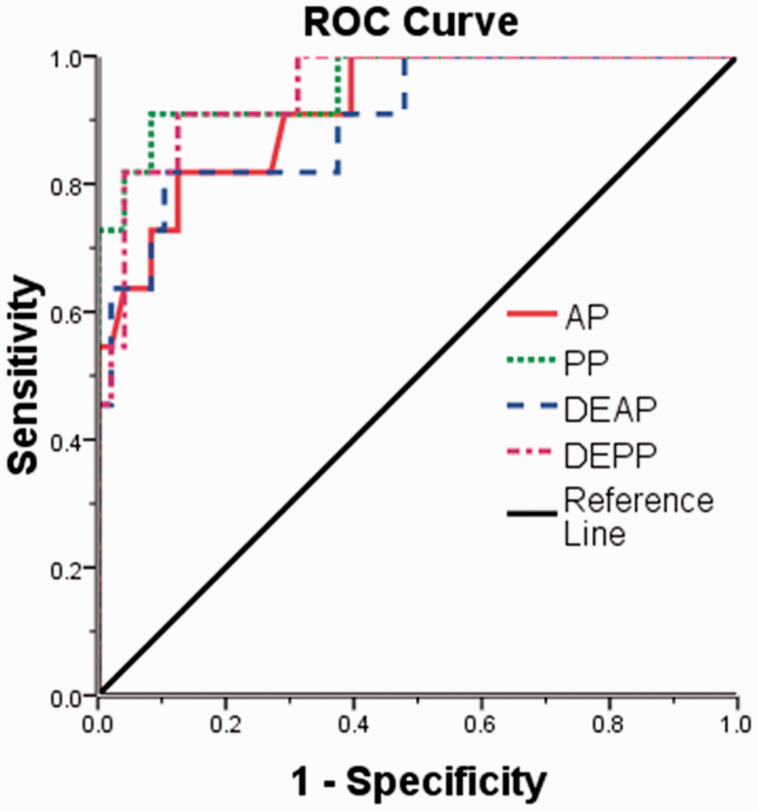
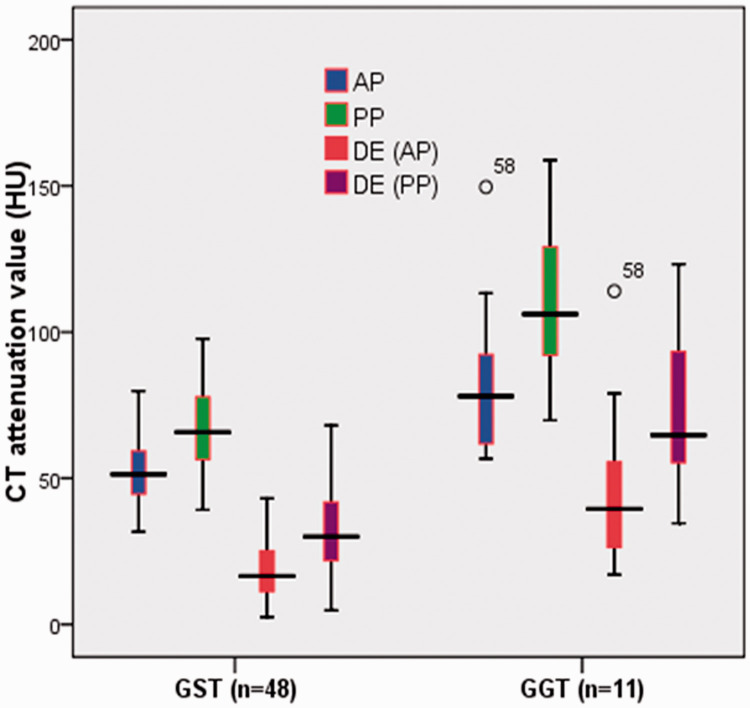
The sensitivity and specificity of each statistically significant CT feature for differentiating GGTs from small GSTs are shown in Table 4. According to the ROC analysis, the largest area under the ROC curve was the PP (0.932), followed by the DE (PP) (0.922), the DE (AP) (0.909), and the AP (0.886) among the statistically significant continuous variables that differentiated GGTs from small GSTs (Figure 6). Using a clustered boxplot to study the CT attenuation values of the statistically significant continuous variables for differentiating GGTs from small GSTs, we found that the median CT attenuation value was universally higher for the GGTs than small GSTs, regardless of whether analyzing the AP, PP, DE (AP), or DE (PP) (Figure 7).
Table 4.
Sensitivity and specificity of each significant CT criterion for differentiating GGTs from small GSTs.
| CT criteria | Sensitivity (%) | Specificity (%) |
|---|---|---|
| Qualitative features | ||
| Location in antrum | 72.5 (8/11) | 93.7 (45/48) |
| Endophytic growth pattern | 72.5 (8/11) | 66.7 (32/48) |
| Heterogeneous enhancement (AP) | 54.5 (6/11) | 93.97 (45/48) |
| Quantitative features | ||
| AP (cutoff: ≥60.7 HU) | 81.8 (9/11) | 85.4 (41/48) |
| PP (cutoff: ≥87.6 HU) | 90.9 (10/11) | 91.7 (44/48) |
| DE (AP) (cutoff: ≥29.9 HU) | 81.8 (9/11) | 89.6 (43/48) |
| DE (PP) (cutoff: ≥49.0 HU) | 90.9 (10/11) | 87.5 (42/48) |
Data in parentheses are numbers of patients.
GGT, gastric glomus tumor; GST, gastric stromal tumor; CT, computed tomography; HU, Hounsfield unit; AP, arterial phase; PP, portal venous phase; DE, degree of enhancement.
Figure 6.
Graph showing four receiver operating characteristic (ROC) curves of the significant quantitative computed tomography findings (AP, PP, DE(AP), DE(PP)) for differentiating GGTs from small GSTs. The areas under the ROC curve are 0.886 (AP), 0.932 (PP), 0.909 (DE [AP]), and 0.922 (DE [PP]). GGT, gastric glomus tumor; GST, gastric stromal tumor; DE, degree of enhancement; AP, arterial phase; PP, portal venous phase.
Figure 7.
Use of a clustered boxplot to study the computed tomography attenuation values of the statistically significant continuous variables for differentiating GGTs from small GSTs. GGT, gastric glomus tumor; GST, gastric stromal tumor; DE, degree of enhancement; AP, arterial phase; PP, portal venous phase; HU, Hounsfield unit.
When any two of these seven criteria were combined, the sensitivity and specificity for differentiating GGTs from small GSTs were 100% (11 of 11) and 77.1% (37 of 48), respectively (Table 5). When any four, five, six, or all seven of these criteria were used, specificity of 100% was achieved (Table 5).
Table 5.
Combined CT criteria for differentiating GGTs from small GSTs.
| Number of CT criteria | GGT (n = 11) | GST (n = 48) | Sensitivity (100%) | Specificity (100%) |
|---|---|---|---|---|
| ≥1 | 11 | 28 | 100.0 | 41.7 |
| ≥2 | 11 | 11 | 100.0 | 77.1 |
| ≥3 | 10 | 3 | 90.9 | 93.7 |
| ≥4 | 10 | 0 | 90.9 | 100.0 |
| ≥5 | 9 | 0 | 81.8 | 100.0 |
| ≥6 | 6 | 0 | 54.5 | 100.0 |
| 7 | 2 | 0 | 18.2 | 100.0 |
Data are numbers of patients with one or more of the following seven CT features: location at antrum, endophytic growth pattern, heterogeneous enhancement in the AP, CT value in AP of ≥60.7 HU, CT value in PP of ≥87.6 HU, DE (AP) of ≥29.9 HU, and DE (PP) of ≥49.0 HU.
GGT, gastric glomus tumor; GST, gastric stromal tumor; CT, computed tomography; HU, Hounsfield unit; AP, arterial phase; PP, portal venous phase; DE, degree of enhancement.
Discussion
A GGT is an extremely rare gastric mesenchymal tumor that has been recently described in sporadic case reports and small-scale studies.1–3,19,20 Accurate differential diagnosis of GGTs from GSTs has become an increasingly more important issue mainly because of the high similarity of the clinical and imaging features between the two types of tumors. To our knowledge, no reports have described the use of characteristic CT features to differentiate GGTs from GSTs. Therefore, we attempted to identify the differences in the performance of the two groups of CT images to allow for an accurate diagnosis, which is essential to make reasonable decisions regarding clinical treatment.
GGTs and GSTs have many similarities, including female dominance, a predilection for the middle-aged population, and the absence of specific clinical symptoms. In our study, GGTs and GSTs showed no significant differences in sex or clinical symptoms; however, patients with GGTs were significantly younger than those with GSTs, which is consistent with previous reports.6,21,22
We found that seven CT imaging findings were useful to distinguish GGTs from small GSTs: location (antrum), growth pattern (endophytic), heterogeneous enhancement (AP), and the CT attenuation value (AP, PP, DE [AP], and DE [PP] of more than 6.07, 87.6, 29.9, and 49.0 HU, respectively). Furthermore, when these CT imaging criteria were combined, GGTs could be distinguished from small GSTs with a higher sensitivity and specificity. These findings are noteworthy because they show that CT imaging findings may be helpful for achieving an accurate diagnosis, which has not been reported previously.
Most GGTs in this study were located in the antrum, and their growth patterns were predominantly endophytic. In contrast, the most common location of small GSTs was the gastric body, and small GSTs had a tendency to show exophytic growth. These results are consistent with previous studies; unfortunately, however, previous reports included only simple descriptions without a comparative statistical analysis of the CT imaging features of the two groups.4,18
Interestingly, GGTs and small GSTs had different enhancement patterns in different enhancement phases, and the proportion of GGTs showing heterogeneous enhancement in the AP was significantly higher than that of GSTs. However, the enhancement features in the PP were not significantly different between the two groups. This was mainly due to the difference in the tumor blood vessel density and distribution, which resulted in different enhancement behaviors of the GGTs. Moreover, most of the GGTs showed heterogeneous enhancement in the AP and tended to show homogeneous enhancement in the PP, which is extremely similar to the characteristics of angiomyoneuromas elsewhere in the body. Coincidentally, this enhanced CT performance is consistent with a recent case report of GGT.23 Previous research has shown that necrosis and surface ulceration are common in patients with large GSTs (47.5% [47/99] and 40.4% [40/99], respectively).18 In fact, necrosis, calcification, and surface ulceration were rarely found and showed no significant difference between these two groups in the present study, which may be attributed to their small diameter.
Our study demonstrated that the CT attenuation values of GGTs in the AP and PP were significantly higher than those of GSTs. Additionally, both the DE (AP) and DE (PP) were much heavier for GGTs than GSTs. This performance of the enhancement pattern was consistent with a previous study showing how the lesion-to-aorta ratio reacted to different DEs.22 There are two reasons for the aforementioned results. First, GGTs contain a large number of small dilated vessels and therefore exhibit higher attenuation values during the enhancement process. Second, GSTs have malignant potential and rapid growth, which easily degenerate tumor cells. All of these factors should be considered to contribute to the obviously decreased DE of GSTs.
Among the seven significant CT findings in our study, the value of a differential diagnosis when four quantitative criteria were combined was higher than that when three qualitative criteria were combined, especially when the area under the ROC curve was >0.9. This is of high clinical value for distinguishing GGTs from small GSTs. In other words, if the CT attenuation value of the PP, DE (AP), and DE (PP) is more than 87.6, 29.9, and 47.0 HU, respectively, GGTs can be more readily diagnosed. In addition, when any four of the seven criteria are used in combination, the sensitivity and specificity for distinguishing GGTs from small GSTs increases to 90.9% and 100%, respectively.
Our study has several limitations. First, only two types of gastric mesenchymal tumors were compared; other subepithelial lesions were ignored. Additionally, we excluded larger GSTs to avoid the influence of size bias because most large gastric mesenchymal tumors are eventually diagnosed as GSTs.24 Second, because this was a retrospective study, the collection of data inevitably involved the use of different standardized CT protocols, leading to bias of the imaging quality. Finally, because of the small sample size, the conclusions are inevitably biased. The reliability of our findings needs to be confirmed by further research.
In conclusion, we identified seven CT features that can help to differentiate GGTs from small GSTs: location in the antrum, endophytic growth, heterogeneous enhancement in the AP, CT value in the AP of ≥60.7 HU, CT value in the PP of ≥87.6 HU, DE (AP) of ≥29.9 HU, and DE (PP) of ≥49.0 HU. In particular, when these CT findings are used in combination, the accuracy of the differential diagnosis will be higher.
Authors’ contributions
Collection and analysis of the data and treatment of the patient: JW, CL, WQA, YYA, WMZ, ZFN, and YZJ; drafting of the manuscript: JW; editing and revision of the manuscript: YZJ. All authors read and approved the final version of the manuscript.
Declaration of conflicting interest
The authors declare that there is no conflict of interest.
Funding
This work was supported by the Zhejiang Provincial Natural Science Foundation of China under Grant No. LGF18H180016.
ORCID iDs
Jian Wang https://orcid.org/0000-0003-1194-9046
Yuzhu Jia https://orcid.org/0000-0002-9913-8856
References
- 1.Ruiz CC, Carlinfante G, Zizzo M, et al. Glomus tumor of the stomach: GI image. J Gastrointest Surg 2017; 21: 1099–1101. [DOI] [PMC free article] [PubMed] [Google Scholar]
- 2.Papadelis A Brooks CJ andAlbaran RG.. Gastric glomus tumor. J Surg Case Rep 2016; 2016: 1–2. [DOI] [PMC free article] [PubMed] [Google Scholar]
- 3.Chen K andChen L.. Glomus tumor in the stomach: a case report and review of the literature. Oncol Lett 2014; 7: 1790–1792. [DOI] [PMC free article] [PubMed] [Google Scholar]
- 4.Hu SD, Hu DM, Huang W, et al. Computed tomography and clinical characteristics of gastric glomus tumors. J Dig Dis 2014; 15: 477–482. [DOI] [PubMed] [Google Scholar]
- 5.Rubin BP. Gastrointestinal stromal tumours: an update. Histopathology 2006; 48: 83–96. [DOI] [PubMed] [Google Scholar]
- 6.McDonnell MJ, Punnoose S, Viswanath YKS, et al. Gastrointestinal stromal tumours (GISTs): an insight into clinical practice with review of literature. Frontline Gastroenterol 2017; 8: 19–25. [DOI] [PMC free article] [PubMed] [Google Scholar]
- 7.Shinagare AB, Ip IK, Lacson R, et al. Gastrointestinal stromal tumor: optimizing the use of cross-sectional chest imaging during follow-up. Radiology 2015; 274: 395–404. [DOI] [PubMed] [Google Scholar]
- 8.Zhou C, Duan X, Zhang X, et al. Predictive features of CT for risk stratifications in patients with primary gastrointestinal stromal tumour. Eur Radiol 2016; 26: 3086–3093. [DOI] [PubMed] [Google Scholar]
- 9.Iannicelli E, Carbonetti F, Federici GF, et al. Evaluation of the relationships between computed tomography features, pathological findings, and prognostic risk assessment in gastrointestinal stromal tumors. J Comput Assist Tomogr 2017; 41: 271–278. [DOI] [PubMed] [Google Scholar]
- 10.Nilsson B, Bümming P, Meis-Kindblom JM, et al. Gastrointestinal stromal tumors: the incidence, prevalence, clinical course, and prognostication in the preimatinib mesylate era–a population-based study in western Sweden. Cancer 2005; 103: 821–829. [DOI] [PubMed] [Google Scholar]
- 11.Handa Y, Kano M, Kaneko M, et al. Gastric glomus tumor: a rare cause of upper gastrointestinal bleeding. Case Rep Surg 2015; 2015: 193684. [DOI] [PMC free article] [PubMed] [Google Scholar]
- 12.Baek YH, Choi SR, Lee BE, et al. Gastric glomus tumor: analysis of endosonographic characteristics and computed tomographic findings. Dig Endosc 2013; 25: 80–83. [DOI] [PubMed] [Google Scholar]
- 13.Kang G, Park HJ, Kim JY, et al. Glomus tumor of the stomach: a clinicopathologic analysis of 10 cases and review of the literature. Gut Liver 2012; 6: 52–57. [DOI] [PMC free article] [PubMed] [Google Scholar]
- 14.Choi YR, Kim SH, Kima SA, et al. Differentiation of large (≥5 cm) gastrointestinal stromal tumors from benign subepithelial tumors in the stomach: radiologists’ performance using CT. Eur J Radiol 2014; 83: 250–260. [DOI] [PubMed] [Google Scholar]
- 15.Ashida H, Igarashi T, Morikawa K, et al. Distinguishing gastric anisakiasis from non- anisakiasis using unenhanced computed tomography. Abdom Radiol (NY) 2017; 42: 2792–2798. [DOI] [PubMed] [Google Scholar]
- 16.Choi KS, Kim SH, Kim SG, et al. Early gastric cancers: is CT surveillance necessary after curative endoscopic submucosal resection for cancers that meet the expanded criteria? Radiology 2016; 281: 444–453. [DOI] [PubMed] [Google Scholar]
- 17.Joo I, Kim SH, Ahn SJ, et al. Preoperative tumor restaging and resectability assessment of gastric cancers after chemotherapy: diagnostic accuracy of MDCT using new staging criteria. Abdom Radiol (NY) 2017; 42: 2807–2815. [DOI] [PubMed] [Google Scholar]
- 18.Zhu H, Chen H, Zhang S, et al. Differentiation of gastric true leiomyoma from gastric stromal tumor based on biphasic contrast-enhanced computed tomographic findings. J Comput Assist Tomogr 2014; 38: 228–234. [DOI] [PubMed] [Google Scholar]
- 19.Wang X, Hanif S, Wang B, et al. Management of gastric glomus tumor: a case report. Medicine (Baltimore) 2019; 98: e16980. [DOI] [PMC free article] [PubMed] [Google Scholar]
- 20.Vig T, Bindra M, Kumar R, et al. Gastric glomus tumour misdiagnosed as gastric carcinoid: an unfamiliar entity with aids to diagnosis and review of literature. J Clin Diagn Res 2017; 11: ED32–ED33. [DOI] [PMC free article] [PubMed] [Google Scholar]
- 21.Morte D Bingham J andSohn V.. Gastric glomus tumor: an uncommon source for an acute upper GI bleed. Case Rep Gastrointest Med 2018; 2018: 7961981. [DOI] [PMC free article] [PubMed] [Google Scholar]
- 22.Hur BY, Kim SH, Choi JY, et al. Gastroduodenal glomus tumors: differentiation from other subepithelial lesions based on dynamic contrast-enhanced CT findings. AJR Am J Roentgenol 2011; 197: 1351–1359. [DOI] [PubMed] [Google Scholar]
- 23.Vieites Branco I, Silva JC, Pinto F, et al. Rare mesenchymal antral gastric tumors: case reports of glomus tumor and plexiform fibromyxoma. Radiol Case Rep 2019; 15: 71–76. [DOI] [PMC free article] [PubMed] [Google Scholar]
- 24.Kim JY, Lee JM, Kim KW, et al. Ectopic pancreas CT findings with emphasis on differentiation from small gastrointestinal stromal tumor and leiomyoma. Radiology 2009; 252: 92–100. [DOI] [PubMed] [Google Scholar]


