

Abstract
Huntington’s disease is caused by the expansion of a CAG repeat within exon 1 of the HTT gene, which is unstable, leading to further expansion, the extent of which is brain region and peripheral tissue specific. The identification of DNA repair genes as genetic modifiers of Huntington’s disease, that were known to abrogate somatic instability in Huntington’s disease mouse models, demonstrated that somatic CAG expansion is central to disease pathogenesis, and that the CAG repeat threshold for pathogenesis in specific brain cells might not be known. We have previously shown that the HTT gene is incompletely spliced generating a small transcript that encodes the highly pathogenic exon 1 HTT protein. The longer the CAG repeat, the more of this toxic fragment is generated, providing a pathogenic consequence for somatic expansion. Here, we have used the R6/2 mouse model to investigate the molecular and behavioural consequences of expressing exon 1 HTT with 90 CAGs, a mutation that causes juvenile Huntington’s disease, compared to R6/2 mice carrying ∼200 CAGs, a repeat expansion of a size rarely found in Huntington’s disease patient’s blood, but which has been detected in post-mortem brains as a consequence of somatic CAG repeat expansion. We show that nuclear aggregation occurred earlier in R6/2(CAG)90 mice and that this correlated with the onset of transcriptional dysregulation. Whereas in R6/2(CAG)200 mice, cytoplasmic aggregates accumulated rapidly and closely tracked with the progression of behavioural phenotypes and with end-stage disease. We find that aggregate species formed in the R6/2(CAG)90 brains have different properties to those in the R6/2(CAG)200 mice. Within the nucleus, they retain a diffuse punctate appearance throughout the course of the disease, can be partially solubilized by detergents and have a greater seeding potential in young mice. In contrast, aggregates from R6/2(CAG)200 brains polymerize into larger structures that appear as inclusion bodies. These data emphasize that a subcellular analysis, using multiple complementary approaches, must be undertaken in order to draw any conclusions about the relationship between HTT aggregation and the onset and progression of disease phenotypes.
Keywords: Huntington’s disease, polyglutamine, huntingtin aggregation and seeding, transcriptional dysregulation, somatic CAG instability
Huntingtin aggregates in the brains of Huntington’s disease transgenic mice with 90 or 200 CAGs have different subcellular localization, appearance and molecular properties. In these mice, aggregated huntingtin precedes transcriptional dysregulation in neuronal nuclei and the rate of disease progression correlated with the accumulation of aggregated huntingtin in the cytoplasm.
Graphical Abstract
Graphical Abstract.

Introduction
Huntington’s disease is an inherited neurodegenerative disorder that manifests with psychiatric, motor and cognitive symptoms (Bates et al., 2015). The mutation is a CAG repeat expansion in exon 1 of the huntingtin gene (HTT) that results in an abnormally long polyglutamine (polyQ) tract in the huntingtin protein (HTT) (Huntington’s Disease Collaborative Research Group, 1993). Individuals with less than 36 CAGs remain unaffected, those with 40 or more will develop the disease within a normal lifespan and those with 36–39 CAGs have an increasing chance of developing Huntington’s disease (Rubinsztein et al., 1996). CAG repeat expansions of ∼65 or more are likely to result in symptom onset in childhood or adolescence (Telenius et al., 1993). Huntington’s disease causes widespread atrophy of the brain and results in prominent cell loss in the striatum, cortex and other brain regions (Vonsattel and DiFiglia, 1998). HTT aggregation can be detected in the brain by antibody staining and occurs as nuclear inclusions and neuropil aggregates (DiFiglia et al., 1997; Gutekunst et al., 1999).
Although CAG repeat length is the major determinant of age of onset and disease progression, genetic and environmental modifiers also contribute (Wexler et al., 2004). CAG repeats are unstable in Huntington’s disease patient brains (Kennedy et al., 2003; Shelbourne et al., 2007; Gonitel et al., 2008) and somatic expansion in brain is correlated with an earlier disease onset (Swami et al., 2009). This somatic instability is recapitulated in mouse models of Huntington’s disease (Mangiarini et al., 1997) and is prevented in the absence of the mismatch repair genes Msh2, Msh3, Mlh1 and Mlh3 (Manley et al., 1999; Pinto et al., 2013; Tome et al., 2013). Therefore, the identification of six DNA repair genes as modifiers of the age of onset and/or progression of Huntington’s disease through genome-wide association studies: FAN1, MSH3, MLH1, PMS1, PMS2 and LIG1 (GeM-HD Consortium, 2015, 2019; Lee et al., 2017; Moss et al., 2017; Ciosi et al., 2019; Flower et al., 2019) underlined a causative role for somatic CAG instability in the pathogenesis of Huntington’s disease. It also suggested that the pathogenic repeat threshold in brain cells might be larger than that measured in blood and, if so, such a threshold is currently unknown.
The HTT gene contains 67 exons, and we have previously shown that exon 1 does not always splice to exon 2 resulting in the production of a small transcript (Httexon1) that terminates at cryptic polyadenylation sites within intron 1. This occurs in knock-in mouse models (Sathasivam et al., 2013; Franich et al., 2019), where the level of incomplete splicing correlates with the appearance of disease phenotypes, and in Huntington’s disease post-mortem brains and cell lines (Neueder et al., 2017). The Httexon1 transcript contains a stop codon at the beginning of intron 1 and is translated to produce the highly pathogenic exon 1 HTT protein (Sathasivam et al., 2013; Neueder et al., 2018), by the same mechanism as occurs in R6/2 mice (Mangiarini et al., 1996). The extent of this incomplete splicing increases with increasing CAG repeat length, and therefore, the consequence of somatic CAG expansion in the HTT allele is the increased production of the pathogenic exon 1 HTT protein.
The critical role that N-terminal HTT fragments play in the pathogenesis of Huntington’s disease is supported by the fact that when CAG repeat size and strain background are comparable, R6/2 and knock-in mice have highly comparable phenotypes at late-stage disease (Kuhn et al., 2007; Woodman et al., 2007; Sathasivam et al., 2010; Labbadia et al., 2011; Mielcarek et al., 2014; Mielcarek et al., 2015). Here, we have established a novel R6/2 line with 90 CAGs [R6/2(CAG)90], a mutation that causes juvenile Huntington’s disease, and conducted a molecular, immunohistochemical and behavioural comparison with R6/2 mice carrying ∼200 CAGs [R6/2(CAG)200]. We find that transcriptional dysregulation occurred earlier in R6/2(CAG)90 mice and correlated with the appearance of aggregated HTT in neuronal nuclei. However, behavioural phenotypes progressed faster in the R6/2(CAG)200 mice and this correlated with the accumulation of cytoplasmic aggregates. The length of the polyQ tract, which drives HTT aggregation in Huntington’s disease patient brains is unknown; and we show here that the HTT aggregates formed from the expanded polyQ tracts in these two models have different immunohistochemical and molecular properties. Our work demonstrates that correlations between HTT aggregation and disease phenotypes requires a subcellular analysis both at molecular and immunohistochemical levels.
Materials and methods
Mouse breeding and maintenance
All procedures were performed in accordance with the Animals (Scientific Procedures) Act 1986 and were approved by the University Ethical Review Panel. Hemizygous R6/2 mice were bred by backcrossing R6/2 males to (C57BL/6JOlaHsd × CBA/CaOlaHsd)F1 females (B6CBAF1/OlaHsd, Envigo, the Netherlands). R6/2 and wild type mice were group housed dependent on gender, but genotypes were mixed within cages. The temperature was regulated at 21°C ± 1°C and animals were kept on a 12 h light/dark cycle. All animals had unlimited access to water and breeding chow (Special Diet Services, Witham, UK) and to standard cage environmental enrichment (bedding and play tube). Mouse brains were rapidly dissected, frozen in liquid nitrogen and stored at −80°C.
Genotyping, CAG repeat sizing and somatic instability analysis
Mice were genotyped, and the CAG repeat size was measured by PCR of tail-tip DNA as previously described (Sathasivam et al., 2010). The mean CAG repeat size for all R6/2(CAG)90 mice was 90.55 ± 1.79, and for all R6/2(CAG)200 mice was 210.24 ± 7.2 (±SD). For somatic instability analysis, 50 ng DNA was amplified using HD3 FAM 5′-CCTTCGAGTCCCTCAAGTCCTT-3′ and HD5 5′-CGGCTGAGGCAGCAGCGGCTGT-3′ primers with Amplitaq Gold and GC enhancer (Thermo Fisher Scientific). Cycling conditions were 95°C for 10 min, 35 cycles of (95°C for 30 s, 65°C for 30 s, 72°C for 90 s) and 72°C for 10 min. Samples were run on an ABI 3730xl Genetic Analyser with MapMarker ROX 1000 internal size standards and analysed using GeneMapper v5 software (Thermo Fisher Scientific). The extent of repeat instability was assessed by the somatic instability index (Lee et al., 2010) and expansion index (GeM-HD Consortium, 2019), relative to heart, using a custom R script and confirmed manually. Inclusion threshold for instability and expansion indices was 10% of modal peak height.
Behavioural and phenotype assessment
Body weight
Body weight was monitored weekly, prior to grip strength and rotarod assessment, and recorded to the nearest 0.1 g.
Grip strength
Forelimb grip strength was measured using a Grip Strength Meter (San Diego Instruments, CA, USA) at the following ages: R6/2(CAG)90 at 6, 12, 16, 20 and 24 weeks of age, and R6/2(CAG)200 at 4, 7, 9, 11 and 13 weeks of age. Mice were held by the base of the tail and allowed to grip the wire, they were gently pulled horizontally away from the apparatus until the wire was released and the maximum tension (g) was recorded. The mice were tested five times and the average performance of the best three trials was used (Hockly et al., 2003). The apparatus was thoroughly cleaned with 70% industrial methylated spirit between trials.
Rotarod performance
Mice were tested on a standard Ugo Basile 7650 rotarod (Linton Instrumentation, UK), with the modification of a smooth rubber coating over the rotating rod as previously described (Hockly et al., 2003). At the start of each trial, mice were acclimatized to the apparatus by being placed on the rotating rod at 4 rpm for 20 s. Following acclimatization, the rod progressively accelerated from 4 rpm to 40 rpm over a period of 5 min. Latency (s) for mice to fall from the rod was recorded. For the first test session [at 6 weeks of age for R6/2(CAG)90, or 4 weeks of age for R6/2(CAG)200], rotarod performance was tested for three trials per day for four consecutive days. For all later sessions, performance was tested for three trials per day for three consecutive days. In both cases, the data from the last 2 days were used for the analysis. The apparatus was thoroughly cleaned with 70% industrial methylated spirit between testing each mouse.
RNA extraction and real‐time quantitative PCR
Total RNA was isolated from individual brain regions using the RNeasy mini kit according to the manufacturer’s instructions, which includes a DNase I treatment to remove genomic DNA (Qiagen). RNA was quantified using a Nanodrop-1000 spectrophotometer (Thermo Fisher Scientific) and stored at −80°C. cDNA was synthesized using random hexamers with an MMLV RT-ase kit (Invitrogen). Real-time quantitative PCR (qPCR) was then performed using the CFX96 C1000 real-time thermal cycler (Bio-Rad). Housekeeping reference genes were for cortex: Atp5b, Canx, Rpl13a and Ubc, striatum: Atp5b, Eif4a2 and Ubc, cerebellum: Atp5b, Rpl13a and Ubc (Primer Design). Primer sequences and probes used are summarized in Supplementary Table 1. The levels of gene expression were determined by normalizing to housekeeping genes, and the relative levels of the transcripts were determined by using the 2−ΔΔCt method (Livak and Schmittgen, 2001; Benn et al., 2008).
Antibodies
The antibodies used for western blotting, Seprion-ligand ELISA, agarose gel electrophoresis for resolving aggregates (AGERA), filter-trap and immunohistochemistry, together with their respective dilutions, are summarized in Supplementary Table 2. Because of the difference in the length of the polyQ tracts between the two mouse lines, antibodies with a polyQ epitope were avoided, except for the detection of aggregates after formic acid antigen retrieval.
Cytoplasmic and nuclear fractionation
Cytoplasmic and nuclear fractions were prepared as previously described (Davies et al., 1999), their protein concentration was determined using the PierceTM BCA protein assay kit (Thermo Fisher Scientific), and their purity was determined by immunoblotting using anti-histone H3 and anti-α-tubulin antibodies.
Western blotting
Half brains were homogenized (Polytron PT1200E) in ice-cold IGEPAL RIPA buffer [150 mM NaCl, 50 mM Tris–HCl pH 8.0, 1% IGEPAL, 0.5% sodium deoxycholate, 0.1% sodium dodecyl sulphate (SDS)] with 1 mM phenylmethylsulphonyl fluoride, 1 mM dithiothreitol and cOmplete protease inhibitor cocktail tablets (Roche). Protein concentration was determined using the PierceTM BCA protein assay kit (Thermo Fisher Scientific). For immunoblotting, 20–40 μg of total protein in Laemmli loading buffer was denatured at 85°C for 5 min and separated by 10-, 12-, or 15% Criterion TGX Stain-free SDS-PAGE (Bio-Rad) and blotted onto 0.45 μm nitrocellulose membrane (Bio-Rad) by submerged transfer apparatus (Bio-Rad) in [25 mM Tris base, 192 mM glycine, 20% v/v methanol]. For immunoblotting of cytoplasmic and nuclear fractions, either 25 μg of cytoplasm or 12.5 μg of nuclei in Laemmli loading buffer was used. Membranes were blocked for 1 h at room temperature in 3% non-fat dried milk in PBST [phosphate buffer saline (PBS), 0.1% Tween-20], and then incubated overnight with gentle agitation at 4 °C with the primary antibody (in PBST with 1% non-fat dried milk). For chemiluminescent detection, blots were washed three times in PBST for 5 min, probed with horse radish peroxidase-linked secondary antibodies (in PBST with 0.5% non-fat dried milk) for 1 h at room temperature and washed three times in PBST. Protein was detected by chemiluminescense (Clarity, Bio-Rad) according to the manufacturer’s instructions. The signals were captured on a ChemiDoc Touch Imaging System (Bio-Rad).
SeprionTM-Pad ELISA
HTT aggregates were captured in Seprion-ligand coated plates (Microsens, PADPCB1 SEP1–01) as previously described (Sathasivam et al., 2010). For individual brain regions, a 2.5% (w/v) total protein lysate was prepared in ice-cold IGEPAL RIPA buffer [150 mM NaCl, 50 mM Tris–HCl pH 8.0, 1% IGEPAL, 0.5% sodium deoxycholate, 0.1% SDS] with 1 mM phenylmethylsulphonyl fluoride, 1 mM dithiothreitol and cOmplete protease inhibitor cocktail tablets (Roche), by homogenizing three times for 30 s in Lysing matrix D tubes (MP Biomedicals) in a Fast-Prep-24TM instrument (MP Biomedicals), and 15 μl was loaded per well. For cytoplasmic and nuclear fractions, samples were prepared as described, and either 25 μg cytoplasm or 5 μg nuclei diluted in 15 μl ice-cold IGEPAL RIPA buffer was loaded per well.
FRET-based aggregate seeding assay
For cortical brain tissue, a 10% (w/v) total protein lysate was prepared by homogenizing in ice-cold FRET-based aggregate seeding assay buffer [10 mM Tris–HCl pH 7.4, 0.8 M NaCl, 1 mM EDTA, 10% sucrose, 0.25 U/ml benzonase], with cOmplete protease inhibitor tablets (Roche), in Precellys® CK14 lysing kit tubes (Precellys® 24 Homogenizer). The homogenate was incubated for 1 h at 4 °C on a rotating wheel and protein concentration was determined using the PierceTM BCA protein assay kit (Thermo Fisher Scientific). The FRET-based aggregate seeding assay was performed and evaluated according to the method previously described (Ast et al., 2018) using 2.5 µg of crude lysate per replicate.
Agarose gel electrophoresis for resolving aggregates
For AGERA gels (Weiss et al., 2007), 1.5 g agarose (Bio-Rad) was dissolved in 100 ml 375 mM Tris–HCl, pH 8.8, then once fully dissolved, SDS was added to a final concentration of 0.1%. Gels were gently poured into 10 cm Flowgen BioscienceTM gel trays (8 mm thick), and allowed to set (20-well comb, 2 mm thick). For immunoblotting, either 100 μg cytoplasm or 25 μg nuclei was diluted in non-reducing Laemmli buffer [150 mM Tris–HCl pH 6.8, 33% glycerol, 1.2% SDS and bromophenol blue], denatured at 95 °C for 5 min, and loaded alongside a Hi-MarkTM HMW pre-stained standard (Invitrogen). Samples were run in ultra-pure Tris/Glycine/SDS [25 mM Tris, 192 mM glycine, 0.1% SDS] running buffer (National Diagnostics) at 100 V until the dye front reached the bottom of the gel, and blotted onto 0.45 μm nitrocellulose membrane by submerged transfer apparatus as described for western blotting above.
Filter-trap retardation assay of SDS insoluble aggregates
Half brains were homogenized in ice-cold IGEPAL RIPA buffer and protein concentration determined exactly as described for western blotting. For filter-trap, two WhatmanTM 3 mm and one 0.2 μm cellulose acetate membrane filter (Whatman) were equilibrated in (PBS 0.1% SDS) and assembled onto a 96-well MiniFold-1TM dot-blot system (Whatman). Next, wells were filled and washed twice with 250 μl [PBS, 0.1% SDS] and aspirated under vacuum. Then, after filling each well with 200 μl [PBS, 0.1% SDS], 10 μg of protein lysate was loaded per well dissolved in 50 μl [PBS, 0.1% SDS]. Finally, under vacuum, samples were aspirated, and subsequently washed three times in 250 μl [PBS, 0.1% SDS]. Once disassembled, cellulose acetate membranes were blocked for 1 h at room temperature in 3% non-fat dried milk in PBST [PBS, 0.2% Tween-20], and processed exactly as described for western blotting.
Immunohistochemistry
Mice were transcardially perfusion fixed with 4% paraformaldehyde (Pioneer Research Chemical Ltd). Brains were removed and further post-fixed for 6 h at 4 °C before cryoprotection with gradient steps of 20% and 30% sucrose in 0.01 M PBS (Sigma). Once the brains reached equilibrium (had sunk to the bottom of the sucrose solution) they were washed in PBS, embedded in OCT (CellPath Ltd) and stored at −80°C. Coronal brain sections were cut at 30 μm on a cryostat and stored free floating at −20°C in tissue protective solution [30% ethylene glycol, 25% glycerol and 0.05% sodium azide in PBS] until staining.
Sections were washed in PBS before endogenous peroxide activity was quenched using 1% hydrogen peroxide (H2O2) in PBS for 30 min followed by three washes in PBS. Prior to immunostaining, non-specific binding was blocked for 1 h using 10% normal goat serum (Sigma) in PBST [0.5% tritonX-100 (Sigma) in PBS]. MW8 primary antibody was applied in fresh blocking solution overnight at 4°C. Sections were washed three times in PBS before application of the biotinylated secondary antibody (1:500, Vector, Peterborough, UK) for 2 h. Sections were washed three times in PBS before signal amplification using Elite ABC reagent. Biotinylated antibody staining was visualized using Sigma FastDAB (0.5 mg/ml) in PBS and activated with H2O2. Sections were treated with DAB solution for 20 s and rapidly washed with ice-cold PBS to stop the reaction. The sections were washed a further three times with ice-cold PBS to remove the DAB solution completely before mounting on glass slides. To counterstain nuclei, slides were exposed to thionin (Sigma) in [40 mM sodium acetate, 90 mM acetic acid pH 4.3] for 2 min. Slides were then processed through 70%, 90% and 100% alcohols and xylene before cover-slipping with DPX mountant (Sigma).
Prior to 4H7H7 primary antibody application, antigen retrieval was used to expose aggregation buried epitopes. Sections were treated three times with 88% formic acid (Alfa Aesar) for 10 min followed by three washes in PBS after each treatment. Then, sections were treated with 0.5 M ethanolamine (Sigma) in PBS (pH 9.5, blocking excess reacting aldehyde sites) for 1 h with the addition of ascorbic acid (EDQM) to a concentration of 5 mM for the final 10 min (reducing Schiff bases). Sections were rinsed in PBS three times and blocked three times with PBST for 10, 30 and 10 min. Biotinylated 4H7H7 (1:3000) was then applied in fresh PBST overnight at 4°C. Sections were washed three times in PBS before signal amplification using Elite ABC reagent (Vector). Sections were washed three times in TI buffer [0.05 M Tris pH 7.4, 0.05 M Imidazole (Sigma) in PBS]. Signals were amplified using the Tyramide Signal Amplification kit (Perkin Elmer) according to the manufacturer’s recommendations and then washed three times in PBST prior to a second application of Elite ABC reagent.
Histological images were obtained using a Ziess AxioSkop2 plus microscope fitted with a Ziess AxioCam HRc colour camera. Images were recorded using Ziess AxioVision 4.7.
Statistical analysis
Data were screened for outliers using ROUT or Grubb’s Test (GraphPad software), and any outliers were removed before between-group comparisons. Statistical analysis was performed with SPSS (v22 and v26) and R using two-tailed Student’s t-test, one‐way ANOVA, two‐way ANOVA or GLM ANOVA, with Bonferroni post hoc tests as indicated. Graphs were prepared using GraphPad Prism (v6 and v7) and R. P-values less than 0.05 were considered statistically significant.
Data Availability
The authors confirm that all the data supporting the findings of this study are available within the article and its Supplementary material. Raw data will be shared by the corresponding author on request. The custom repeat instability R script can be accessed and run online on request.
Results
The CAG repeat has been maintained at ∼200 CAGs in our R6/2 colony for more than 15 years. To generate a line with a shorter CAG repeat expansion, R6/2 mice were recovered from cryopreserved sperm (Jackson laboratory; stock initially deposited by James Olson). The three resultant pups included one wild type female, one R6/2 male and one R6/2 female, both of which had CAG repeats of 90 CAGs. The line was established by backcrossing R6/2(CAG)90 males to (CBA/Ca × C57BL/6J)F1 females. We had previously shown that CAG repeats in R6 lines of mice expand when bred through the male line, and contract when bred from females (Mangiarini et al., 1997). Therefore, we transmitted the (CAG)90 allele through the female line for six generations with the intention of reducing the CAG repeat length further, but the CAG repeat in this R6/2 allele proved to be very stable, whether bred through the male or female germ lines.
Behavioural phenotypes progress more slowly in R6/2 mice with (CAG)90 than with (CAG)200
To determine the course of disease in the R6/2(CAG)90 mice, progressive changes in body weight, grip strength and rotarod performance were recorded. The R6/2(CAG)200 data presented here were not collected at the same time and are included to allow the reader to draw comparisons in disease progression between the two lines. R6/2(CAG)90 and R6/2(CAG)200 mice were sacrificed at 24 and 15 weeks of age respectively at which point, they had reached comparable end-stage disease.
Body weight was measured weekly from 6 to 24 weeks of age for R6/2(CAG)90 mice and 4 to 15 weeks of age for R6/2(CAG)200 mice. In both cases, R6/2 mice stopped gaining weight and then lost weight relative to wild type littermates and the decrease in weight was more pronounced in males than in females: R6/2(CAG)90 males (Fig. 1A) [F(age × genotype)16,306 = 10.125, P < 0.001], R6/2(CAG)90 females (Fig. 1B) [F(age × genotype)16,306 = 3.247, P < 0.001], R6/2(CAG)200 males (Fig. 1C) [F(age × genotype)11,167 = 6.590, P < 0.001] and R6/2(CAG)200 females (Fig. 1D) [F(age × genotype)11,141 = 2.681, P = 0.004].
Figure 1.

Behavioural and physiological phenotypes progress more slowly in R6/2(CAG)90 than R6/2(CAG)200 mice. (A–D) Failure to gain body weight occurred later in (A) R6/2(CAG)90 males and (B) R6/2(CAG)90 females than in (C) R6/2(CAG)200 males and (D) R6/2(CAG)200 females respectively. (E–H) Reduction in fore-limb grip strength progressed more slowly in (E) R6/2(CAG)90 males and (F) R6/2(CAG)90 females than in (G) R6/2(CAG)200 males and (H) R6/2(CAG)200 females. A statistically significant reduction in grip strength occurred at 12 weeks of age for R6/2(CAG)90 and 11 weeks of age for R6/2(CAG)200 for both genders of each genotype. Discrepancies in the wild type grip strength between the R6/2(CAG)90 and R6/2(CAG)200 datasets are because the data were collected on different machines by different operators at different times. (I, J) Rotarod performance, as compared to that of wild type littermates, deteriorated more slowly in (I) R6/2(CAG)90 mice than in their (J) R6/2(CAG)200 counterparts. The R6/2(CAG)200 data were extracted from the analysis published in Bobrowska et al. (2012). Discrepancies in the latency to fall between the wild type data sets are because the data were collected using different machines by different operators at different times. Wild type (CAG)90 (n = 20), R6/2(CAG)90 (n = 17–20), wild type (CAG)200 (n = 14–18) and R6/2(CAG)200 (n = 16–19). Statistical analysis was GLM ANOVA with Bonferroni post hoc correction *P ≤ 0.05, **P ≤ 0.01, ***P ≤ 0.001.
Forelimb grip strength was measured on weeks 6, 12, 16, 20 and 24 for R6/2(CAG)90 and on weeks 4, 7, 9, 11 and 13 for R6/2(CAG)200 mice. In males, grip strength decreased for R6/2 as compared to wild type mice: R6/2(CAG)90 males (Fig. 1E) [F(age × genotype)4,85 = 34 810, P < 0.001] and R6/2(CAG)200 males (Fig. 1G) [F(age × genotype)4,70 = 9.305, P < 0.001]. In females, the grip strength of wild type and R6/2 mice only changed differently with age for the R6/2(CAG)90 females (Fig. 1F) [F(age × genotype)4,88 = 3.781, P = 0.007] but not for R6/2(CAG)200 females (Fig. 1H) [F(age × genotype)4,59 = 1.567, P = 0.193]. However, grip strength was different between wild type mice and R6/2(CAG)200 females (Fig. 1H) [F(genotype)1,59 = 29.841, P < 0.001] and the R6/2(CAG)200 female grip strength changed with age (Fig. 1H) [F(age)4,59 = 37.802, P < 0.001].
To assess changes in balance and co-ordination, mice were tested for their ability to walk on an accelerating rotarod during weeks 6, 12, 16, 20 and 24 for R6/2(CAG)90 and during weeks 4, 8, 10, 12 and 14 for R6/2(CAG)200 mice. There was no difference in the latency to fall between R6/2(CAG)90 and wild type littermates at 6 weeks of age (Fig. 1I) [F(genotype)1,186 = 1.887, P = 0.178] or R6/2(CAG)200 and wild type littermates at 4 weeks (Fig. 1J) [F(genotype)1,163 = 1.468 P = 0.234]. In both cases, performance deteriorated with disease progression: R6/2(CAG)90 (Fig. 1I) [F(age × genotype)4,186 = 3.447, P = 0.010] and R6/2(CAG)200 (Fig. 1J) [F(age × genotype)4,163 = 4.225, P = 0.003].
Transcriptional dysregulation presents earlier in R6/2(CAG)90 than in R6/2(CAG)200 mice
These physiological and behavioural measures indicated that disease onset occurred later and progressed more slowly in the R6/2(CAG)90 as compared to the R6/2(CAG)200 mice. Transcriptional dysregulation is a well-defined molecular phenotype that has been extensively studied in post-mortem brains (Hodges et al., 2006) and mouse models of Huntington’s disease (Langfelder et al., 2016). To determine when transcriptional dysregulation could first be detected, we used qPCR to measure the levels of ‘genes of interest’, known to be highly dysregulated in Huntington’s disease mouse models (Benn et al., 2008), in the striatum, cortex and cerebellum of R6/2(CAG)90 and R6/2(CAG)200 mice at 4 and 8 weeks of age (Fig. 2).
Figure 2.

Striatal, cortical and cerebellar genes of interest were dysregulated earlier in R6/2(CAG)90 than R6/2(CAG)200 mice. (A, B) Comparison of the levels of striatal transcripts, as measured by qPCR, between R6/2(CAG)90 and R6/2(CAG)200 mice at (A) 4 weeks and (B) 8 weeks of age. R6/2(CAG)90 transcript levels were decreased compared to those of wild type littermates at 4 weeks of age, whereas the R6/2(CAG)200 and wild type levels were comparable. At 8 weeks of age, the transcripts were decreased to similar levels in both R6/2 lines. (C, D) Comparison of the levels of cortical transcripts, as measured by qPCR, between R6/2(CAG)90 and R6/2(CAG)200 mice at (C) 4 weeks and (D) 8 weeks of age. R6/2(CAG)90 transcript levels were decreased compared to those of wild type littermates at 4 weeks of age, whereas the R6/2(CAG)200 and wild type levels were comparable. At 8 weeks of age, the Pgam2, Grm2 and Hrh3 transcripts were also decreased in the R6/2(CAG)200 mice, whereas BdnfIV and Hrt1a, were still expressed at levels similar to wild type. (E, F) Comparison of the levels of cerebellar transcripts, as measured by qPCR, between R6/2(CAG)90 and R6/2(CAG)200 mice at (E) 4 weeks and (F) 8 weeks of age. At 4 weeks of age, R6/2(CAG)90 Igfbp5, Kcnk2 and Pcp4 transcript levels were dysregulated compared to those of wild type littermates, whereas the R6/2(CAG)200 and wild type levels were comparable. At 8 weeks of age, all transcripts were dysregulated to similar levels in both R6/2 lines. n = 8/genotype (4 male and 4 female). Statistical analysis was one-way ANOVA with Bonferroni post hoc correction ***P ≤ 0.001. The test statistic, degrees of freedom and P-values for the ANOVA are provided in Supplementary Table 3.
There was a dramatic reduction in the levels of the striatal genes: Cnr1, Darpp32, Drd2, Pde10a and Penk1 in R6/2(CAG)90 mice at 4 weeks of age, at which point they remained at wild type levels in R6/2(CAG)200 mice (Fig. 2A). By 8 weeks, all five genes were decreased to greater than 50% of wild type levels and dysregulated to a comparable extent in both the R6/2(CAG)90 and R6/2(CAG)200 lines (Fig. 2B). A similar pattern was evident for the cortical genes, with the expression levels of BdnfIV, Pgam2, Grm2, Hrh3 and Hrt1a decreasing at an earlier age in R6/2(CAG)90 than R6/2(CAG)200 mice (Fig. 2C and D). For the cerebellum, changes in Igbp5, Kcnk2 and Pcp4 occurred earlier in R6/2(CAG)90 mice (Fig. 2E and F) but this could not be determined for Nr4a2 and Uchl1 as measurement of expression levels at 4 and 8 weeks of age did not capture the age at which dysregulation first occurred for these two genes (Fig. 2E and F). Therefore, dysregulation of striatal, cortical and cerebellar transcripts occurred earlier in R6/2(CAG)90 than R6/2(CAG)200 mice, in contrast to the physiological and behavioural phenotypes which had a later age of onset.
Huntingtin aggregation can be detected earlier in the brains of R6/2(CAG)90 than R6/2(CAG)200 mice
We next used the Seprion ELISA assay to compare HTT aggregation levels in R6/2(CAG)90 and R6/2(CAG)200 lysates from striatum, cortex, hippocampus and cerebellum at 2, 4 and 8 weeks of age (Fig. 3A–D). In all brain regions from the R6/2(CAG)90 mice, aggregation could be detected as early as 2 weeks of age, and the aggregate load remained higher at 4 weeks than for R6/2(CAG)200 mice. However, by 8 weeks, the level of HTT aggregation was comparable between the two R6/2 lines (Fig. 3A–D). We next compared the aggregation levels in brain between the R6/2(CAG)90 and R6/2(CAG)200 mice at end-stage disease, at 24 and 14 weeks of age, respectively. These were relatively comparable for the cortex and cerebellum, but end-stage aggregate levels were higher in the striatum and hippocampus from 14-week-old R6/2(CAG)200 mice than for the R6/2(CAG)90 line (Fig. 3E–H). Therefore, HTT aggregates formed at an earlier age in the R6/2(CAG)90 lines but accumulated faster in the brains of the R6/2(CAG)200 mice.
Figure 3.

Huntingtin aggregates were detected earlier in the brains of R6/2(CAG)90 than R6/2(CAG)200 mice. (A–D) Seprion-ligand ELISA analysis of aggregated HTT in the (A) striatum, (B) cortex, (C) hippocampus and (D) cerebellum of R6/2(CAG)90 and R6/2(CAG)200 mice at 2, 4 and 8 weeks of age. Aggregated HTT was detected at 2 weeks of age in all brain regions from R6/2(CAG)90 mice but not until 4 weeks in R6/2(CAG)200 mice. In all brain regions, the level of HTT aggregation was higher in R6/2(CAG)90 mice than in R6/2(CAG)200 mice at 4 weeks of age. By 8 weeks of age, the level of HTT aggregation was comparable between R6/2(CAG)90 and R6/2(CAG)200 mice for all brain regions. (E–H) Seprion-ligand analysis of aggregated HTT in the (E) striatum, (F) cortex, (G) hippocampus and (H) cerebellum of R6/2(CAG)90 and R6/2(CAG)200 mice from 8 weeks of age until end-stage disease at 24 and 14 weeks of age respectively. (A–D) n = 6/genotype. (E–H) n = 8/genotype. The absorbance values cannot be compared between (A–D) and (E–H) as these experiments were not performed at the same time. Statistical analysis was two-way ANOVA with Bonferroni post hoc correction ***P ≤ 0.001. The test statistic, degrees of freedom and P-values for the ANOVA are provided in Supplementary Table 4. (I, J) Western blot analysis of soluble and aggregated exon 1 HTT protein in brain lysates from R6/2(CAG)90 mice at 4, 8, 16 and 24 weeks of age and from R6/2(CAG)200 mice at 4, 8 and 14 weeks of age, immunoprobed with either (I) 4C9 or (J) MW8 antibodies. ATP5B was used as a loading control. Aggregated HTT was prominent in the stacking gel for R6/2(CAG)90 mice at 4 weeks, but not from R6/2(CAG)200 mice until 8 weeks of age. The migration of soluble exon 1 HTT was retarded by the expanded polyQ tracts and the levels of this soluble protein diminished with age in both lines as they were recruited into aggregates. The full-sized blots for the loading controls are shown in Supplementary Fig. 12. WT = wild type.
Next, cortical lysates from 4, 8, 16 and 24 week old R6/2(CAG)90 and 4-, 8-, and 14-week-old R6/2(CAG)200 mice were separated by SDS-PAGE to assess the soluble and aggregated state of the exon 1 HTT protein (Fig. 3I and J). The migration of exon 1 HTT is retarded by expanded polyQ tracts with the consequence that exon 1 HTT with 90Q migrated at ∼45 kDa and with 200Q at ∼90 kDa. In both cases, the level of soluble exon 1 HTT decreased with disease progression as it was recruited into aggregates. At 14 weeks of age, soluble exon 1 HTT could no longer be detected in the cortex of R6/2(CAG)200 mice, whereas in R6/2(CAG)90 at 24 weeks, trace amounts were still present (Fig. 3J). In keeping with the Seprion-ligand ELISA data, aggregated HTT could still be detected more readily in the stacking gel at 4 weeks of age in R6/2(CAG)90 lysates than in R6/2(CAG)200 lysates (Fig. 3I and J).
CAG repeats undergo somatic instability in R6/2 mice to varying extents that are brain region and tissue specific (Mangiarini et al., 1997). Examination of the western blots (Fig. 3I and J), together with those in Supplementary Fig. 1, suggested that the size of the exon 1 HTT protein might be slightly larger in older R6/2(CAG)90 brains as compared to those from younger mice. To investigate whether this might be due to somatic instability, we extracted DNA from available tissues: brainstem, cerebellum, liver, tibialis anterior, gastrocnemius, quadriceps and heart from R6/2(CAG)90 mice at 24 weeks of age and R6/2 (CAG)200 mice at 14 weeks of age and prepared GeneMapper capillary electrophoresis traces of the CAG repeat profile (Fig. 4A and B). Consistent with our previous data, we found greater instability in brainstem than cerebellum (Fig. 4 and Supplementary Fig. 2). Similarly, the absence of CAG instability in the three muscles and heart, in both the R6/2(CAG)90 and R6/2(CAG)200 mice, was consistent with previous data (Mangiarini et al., 1997). However, unlike R6/2(CAG)200 mice in which, as expected, the CAG repeat was very unstable in liver, we only detected a modest level of instability in this tissue in R6/2(CAG)90 mice (Fig. 4 and Supplementary Fig. 2). These data predict that the CAG expansions in specific brain regions in older mice would be larger than the 90 CAGs originally measured in tail DNA prior to weaning.
Figure 4.

Comparison of somatic CAG instability in tissues from R6/2(CAG)90 and R6/2(CAG)200 mice. Capillary electrophoresis traces for (A) R6/2(CAG)90 mice at 24 weeks of age and (B) R6/2(CAG)200 mice at 14 weeks of age. The mode CAG repeat length is indicated at the top of the trace in red and the red dashed line helps to visualize the extent to which the CAG repeat has been somatically unstable during the lifespan of each mouse. Each vertical column shows the traces obtained from the tissues of a single mouse. The mean, standard deviation and data points for the instability and expansion indices of each tissue are illustrated in Supplementary Fig. 2, and the numerical values for these measures are listed on the right hand side of the tables (±SD) in (A) and (B). Somatic CAG instability was detected in the brain stem from both models, but was only prominent in the liver from the R6/2(CAG)200 mice. n = 5/genotype. The mean CAG repeat size for R6/2(CAG)90 mice was 93.11 ± 0.86 (SD) and for R6/2(CAG)200 mice was 190.53 ± 3.17 (SD). Statistical analysis was one-way ANOVA with Bonferroni post hoc correction, ***P ≤ 0.001. The test statistic, degrees of freedom and P-values for the ANOVA are provided in Supplementary Table 5. WT = wild type.
The level of expression of the R6/2 transgene is higher in the brains of R6/2(CAG)90 than R6/2(CAG)200 mice
To further investigate the mechanism by which aggregation occurs earlier in the R6/2(CAG)90 compared to the R6/2(CAG)200 line, we measured the level to which the R6/2 transgene was expressed by qPCR. At 2 weeks of age, the R6/2 transgene was expressed at between 2.5- and 3-fold greater in the striatum, cortex and cerebellum from R6/2(CAG)90 as compared to R6/2(CAG)200 mice (Supplementary Fig. 3A). Expression in the cortex decreased from approximately 2.5-fold higher to between 1.5- and 2-fold higher at between 4 and 14 weeks of age (Supplementary Fig. 3B). The levels of endogenous Htt were equivalent to that in wild type mice for both the R6/2(CAG)90 and R6/2(CAG)200 mice over this period (Supplementary Fig. 3C).
Formation of huntingtin aggregates in neuronal nuclei occurs earlier in R6/2(CAG)90 compared to R6/2(CAG)200 mice
To investigate the temporal and spatial appearance of HTT aggregates in the brains of R6/2(CAG)90 and R6/2(CAG)200 mice, sections were immunoprobed with the MW8 antibody, which detects the C-terminus of the exon 1 HTT protein and readily detects HTT aggregates (Fig. 5). At 4 weeks of age, the level of immunostaining was greater in the R6/2(CAG)90 sections for both cortex (Fig. 5A) and striatum (Fig. 5B). In contrast, there was very little signal in the R6/2(CAG)200 cortex (Fig. 5A), and almost none detected in the R6/2(CAG)200 striatum (Fig. 5B). In the R6/2(CAG)90 hippocampus, immunostaining could be detected throughout the pyramidal layer (CA1–CA3) and dentate gyrus, whereas in the R6/2(CAG)200 animals, immunostaining was only prominent in the CA1 region (Fig. 5C and Supplementary Fig. 7A). In all cases, the immunostaining was predominantly nuclear, appearing as a diffuse signal in R6/2(CAG)90 brains, whereas a more punctate inclusion pattern was present in R6/2(CAG)200 sections (Fig. 5A–C). At 8 weeks of age, the nuclear staining pattern in R6/2(CAG)90 sections remained diffuse, whereas in R6/2(CAG)200 sections the inclusions had increased in both number and size (Fig. 5A–C). To illustrate the location of nuclei, sections from a 8-week-old R6/2(CAG)200 mice were immunoprobed with MW8 and counterstained with thionin (Supplementary Fig. 4).
Figure 5.

Aggregated HTT accumulated in neuronal nuclei in the brains of R6/2(CAG)90 at a younger age than in R6/2(CAG)200 mice. The pattern of immunostaining detected with the MW8 antibody on brain sections from R6/2(CAG)90 and R6/2(CAG)200 mice at 4 and 8 weeks of age is shown for the (A) cortex, (B) striatum and (C) hippocampus. The location of the centre panel images in the brain sections is indicated in the adjacent thumbnails, and the position of the thumbnails within the tissue section is illustrated in Supplementary Figs 6 and 7. The wild type control sections are shown in Supplementary Figs 8 and 9. n = 3/R6/2 genotype and n = 1/wild type control. Centre panels, scale bar = 20 μm; thumbnails, scale bar = 200 μm.
To investigate the nature of the diffuse nuclear immunostain, we then immunoprobed R6/2(CAG)90 and R6/2(CAG)200 sections from mice at 4 and 8 weeks of age with the 4H7H7 antibody that detects polyQ peptides. No signal was detected since the polyQ epitopes were buried in HTT aggregates (Supplementary Fig. 5). However, upon treatment with formic acid, which exposed the polyQ epitopes (rendering them available for antibody binding), the diffuse nuclear stain was now observed. Therefore, this represented an aggregated form of HTT, and was particularly evident in the brain sections from R6/2(CAG)90 mice (Supplementary Fig. 5).
Cytoplasmic aggregates accumulate more rapidly in the brains of R6/2(CAG)200 as compared to R6/2(CAG)90 mice
Cytoplasmic aggregates could be seen in cortical and striatal sections from R6/2(CAG)200 mice at 8 weeks of age (Fig. 5A and B), but appeared to be comparatively absent from the equivalent sections from R6/2(CAG)90 mice. To investigate the presence of cytoplasmic aggregates in more detail, we focused on the hilus, that lies within the cleft of the dentate gyrus within the hippocampus, an area in which cytoplasmic aggregates are particularly abundant in R6/2(CAG)200 mice. Aggregated HTT accumulated in the neuronal nuclei of the pyramidal cells from the CA1 to the CA3 as well as the granule cells of the dentate gyrus in R6/2(CAG)90 brains at 4 weeks of age, at which time, aggregates were only present in the CA1 region of R6/2(CAG)200 brains (Fig. 6A). At this age, cytoplasmic aggregates were not apparent in the hilus in either of the R6/2 lines upon immunoprobing with MW8. At 8 weeks of age, cytoplasmic aggregates were abundant in the hilus of R6/2(CAG)200 brains but were relatively sparse in the comparable regions from R6/2(CAG)90 brains (Fig. 6A, Supplementary Fig. 5D). We next compared HTT aggregation in older mice: 16 and 24 weeks for R6/2(CAG)90 and 14 weeks for R6/2(CAG)200 mice, where 24 weeks and 14 weeks both represent end-stage disease. The extent of cytoplasmic aggregation in the cortex, striatum and hippocampus (both dorsal to the CA1 pyramidal layer and in the hilus) was greater in end-stage brains from R6/2(CAG)200 than R6/2(CAG)90 mice (Fig. 6B).
Figure 6.

Cytoplasmic HTT aggregates accumulate more rapidly in the brains of R6/2(CAG)200 than in R6/2(CAG)90 mice. The pattern of immunostaining detected with the MW8 antibody on brain sections from R6/2(CAG)90 and R6/2(CAG)200 mice. (A) The hippocampal hilus of the dentate gyrus at 4 and 8 weeks of age. The location of the centre panel images in the brain sections is indicated in the adjacent thumbnails, and the position of the thumbnails within the tissue section is illustrated in Supplementary Figs 6 and 7. The wild type control sections are shown in Supplementary Figs 8 and 9. (B) The cortex, striatum, CA1 region of the hippocampus and hilus at 16 and 24 weeks of age for the R6/2(CAG)90 and 14 weeks of age for the R6/2(CAG)200 mice. The location of the images from within the tissue sections is illustrated in Supplementary Fig. 10. The wild type control sections are shown in Supplementary Fig. 11. n = 3/R6/2 genotype and n = 1/wild type control. (A) Centre panels, scale bar = 20 μm; thumbnails, scale bar = 200 μm. (B) scale bar = 20 μm.
To further investigate the distribution of soluble and aggregated HTT in the nucleus and cytoplasm, we prepared nuclear and cytoplasmic fractions from R6/2(CAG)90 hemispheres at 4, 8, 16 and 24 weeks of age and from R6/2(CAG)200 hemispheres at 4 and 8 weeks of age. The nuclear and cytoplasmic fractions were western blotted and immunoprobed with the S830 antibody (Fig. 7A). Soluble exon 1 HTT was detected in the cytoplasmic fractions and the levels decreased with age for both R6/2 lines, as the soluble protein was recruited into aggregates (Fig. 7A). Consistent with our previous data, soluble exon 1 HTT could not be detected in the nuclear fraction from R6/2(CAG)200 mice. However, we were able to detect a weak signal corresponding to soluble exon 1 HTT in the R6/2(CAG)90 nuclear fraction (Fig. 7A). Examination of the stacking gel showed that, consistent with the immunohistochemical analysis (Fig. 5), nuclear aggregation could be detected at a younger age in R6/2(CAG)90 than in R6/2(CAG)200 mice (Fig. 7A). This was further confirmed by Seprion ELISA, showing that the level of aggregated HTT was greater in the R6/2(CAG)90 nuclei at 4 weeks of age but then accumulated rapidly so that by 8 weeks of age the levels in the R6/2(CAG)200 nuclei, as measured by the Seprion ELISA were greater (Fig. 7B). The cytoplasmic fractions cannot be used to study aggregation, as a considerable proportion of the cytoplasmic aggregates are lost during the preparation of the fractions, as indicated by the lack of aggregate signal in the cytoplasmic stacking gel (Fig. 7A).
Figure 7.
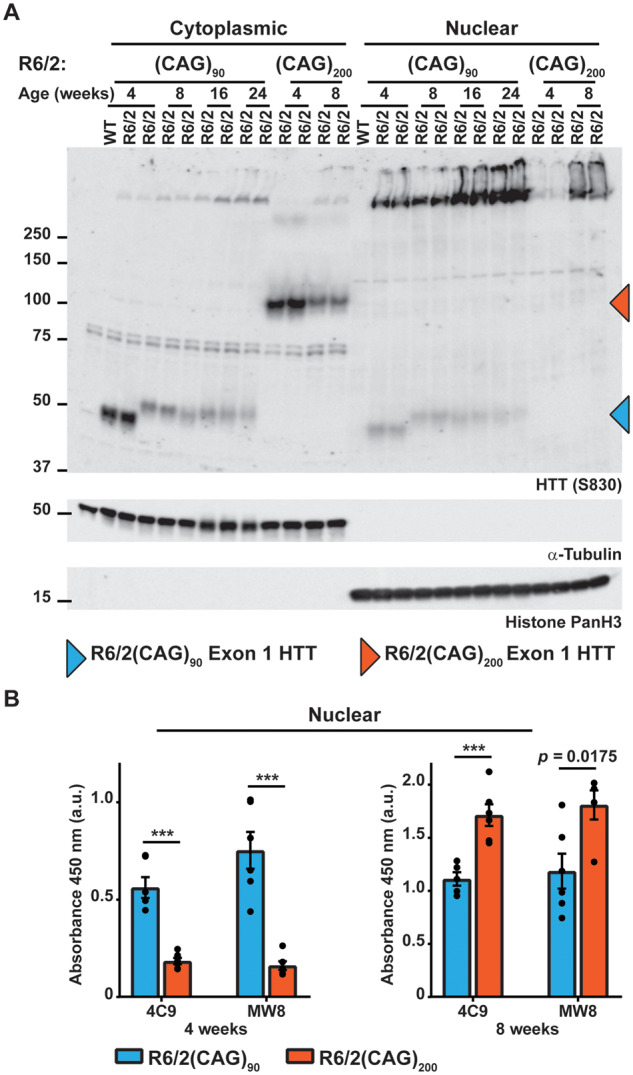
Soluble exon 1 HTT was detected in the nuclear fraction from R6/2(CAG)90 but not from R6/2(CAG)200 brains. (A) Western blot of cytoplasmic and nuclear fractions from R6/2(CAG)90 and R6/2(CAG)200 hemispheres at the ages indicated immunoprobed with the S830 antibody. A fragment that migrated as soluble exon 1 HTT was detected in the nuclear fraction of R6/2(CAG)90 but not R6/2(CAG)200 mice. S830 was used for the western blot presented here, as MW8 and 4C9 both detected cross-hybridising bands, which co-migrated with the R6/2(CAG)90 protein, making the presence of exon 1 HTT in the nuclear fraction harder to interpret. The purity of the nuclear and cytoplasmic fractions was indicated by immunoblotting with antibodies to α-tubulin and histone panH3 respectively. (B) Seprion ELISA analysis of HTT aggregation in nuclear fractions from R6/2(CAG)90 and R6/2(CAG)200 hemispheres at 4 and 8 weeks of age immunodetected with 4C9 or MW8 antibodies (n = 6/genotype). Statistical analysis was two-way ANOVA with Bonferroni post hoc correction. ***P < 0.001. The test statistic, degrees of freedom and P-values for the ANOVA are provided in Supplementary Table 6. WT = wild type.
Aggregated HTT in R6/2(CAG)90 and R6/2(CAG)200 mouse brains have different molecular properties
In order to further investigate differences in the HTT aggregates formed in the brains of the R6/2(CAG)90 and R6/2(CAG)200 brains, we separated the nuclear fractions from 4- and 8 -week-old mice by AGERA (Fig. 8A). At 4 weeks of age, the degree of aggregation was not only greater in R6/2(CAG)90 mice but the migration was more compact than in R6/2(CAG)200 mice. At 8 weeks of age, the level of aggregation was more comparable, but the migration of the aggregates was still visually more compact in R6/2(CAG)90 samples.
Figure 8.

HTT aggregates formed in R6/2(CAG)90 and R6/2(CAG)200 brains have different molecular properties. (A) Nuclear fractions from R6/2(CAG)90 and R6/2(CAG)200 hemispheres at 4 and 8 weeks of age were fractionated by AGERA and immunoprobed with either 4C9 or MW8 antibodies. (B) Cortical lysates from R6/2(CAG)90 and R6/2(CAG)200 mice were filtered through cellulose acetate filters and immunoprobed with either 4C9 or MW8 antibodies (wild type, n = 2; R6/2, n = 4/genotype/age). (C) Quantification of mutant huntingtin seeding activity (HSA) in brain extracts from the R6/2(CAG)90, R6/2 (CAG)200 and wild-type control mice (n = 4/genotype/age). Results for wild type mice are shown as an average Δt50 value. Cortical samples were from the same mice as had been used for the filter retardation assay in (B). (D) Effect of cortical homogenates from R6/2(CAG)90 and wild type mice at 2, 4, 8, 16 and 24 weeks of age on the Ex1Q48-CyPet and –YPet (1:1 mixture, 1.2 μM) co-aggregation. (E) Effect of cortical homogenates from R6/2(CAG)200 and wild type mice at 2, 4, 8 and 14 weeks of age on the Ex1Q48-CyPet and –YPet (1:1 mixture, 1.2 μM) co-aggregation. Statistical analysis was two-way ANOVA with Bonferroni post hoc correction. The test statistic, degrees of freedom and P-values for the ANOVA are provided in Supplementary Table 7. ***P < 0.001. WT = wild type.
We then used cortical samples to investigate HTT aggregate properties over the entire disease course of both R6/2 lines. The Seprion ELISA (Fig. 3B and F) and immunohistochemical analyses (Fig. 5A and Supplementary Fig. 5A) had been consistent in demonstrating that the aggregate load was greater in the R6/2(CAG)90 cortex at 4 weeks of age. At 8 weeks, although the Seprion ELISA assay suggested that aggregate levels were relatively comparable (Fig. 3A–H), the immunohistochemical staining pattern with MW8 was very different: appearing as a diffuse signal in the R6/2(CAG)90 nuclei and as inclusion bodies in the R6/2(CAG)200 nuclei. The filter retardation assay traps larger aggregates on filters, whilst allowing smaller aggregates to wash through (Scherzinger et al., 1999). Filtration of cortical lysates through cellulose acetate filters showed that aggregates from the R6/2(CAG)200 brains were trapped on the filters at both 8 and 14 weeks of age, whereas this was not the case from R6/2(CAG)90 brains (Fig. 8B). At all ages, up to 24 weeks of age, aggregates from the R6/2(CAG)90 cortices were never trapped on the cellulose acetate membrane (Fig. 8B). Finally, we used the FRET-based aggregate seeding assay (Ast et al., 2018) to assess the seeding competence of aggregates from the same cortices as had been used for the filter-trap assay (Fig. 8C–E). Aggregates from the R6/2(CAG)90 cortices were already seeding competent by 2 weeks of age (Fig. 8C and D), this had increased at 4 weeks but then did not increase any further up to late-stage disease at 24 weeks of age (Fig. 8D). The seeding competence of the R6/2(CAG)200 cortical lysates was similar to wild type at 2 weeks of age (Fig. 8C and E) and then increased considerably between 4 and 8 weeks (Fig. 8C and E). Therefore, the cortical aggregates from 2- and 4-week-old R6/2(CAG)90 mice were smaller and had a greater seeding competence than those from R6/2(CAG)200 mice.
Discussion
Here, we have used R6/2 transgenic mice expressing an exon 1 HTT transgene with (CAG)90 and (CAG)200 repeats to investigate the effects of polyQ expansions on the molecular and immunohistochemical properties of HTT aggregates and their phenotypic consequences. We showed that nuclear aggregation occurred earlier in R6/2(CAG)90 mice and that this correlated with the onset of transcriptional dysregulation. However, cytoplasmic aggregates accumulated more rapidly in the R6/2(CAG)200 mice, and more closely tracked with the progression of behavioural phenotypes and with end-stage disease. We found that aggregate species formed in the R6/2(CAG)90 brains have different properties to those in the R6/2(CAG)200 mice. Within the nucleus, they retained a diffuse punctate appearance throughout the course of the disease, and could be partially solubilized by detergents. There were a greater number of aggregate seeds in the brains of younger R6/2(CAG)90 mice than those from R6/2(CAG)200. Aggregates from R6/2(CAG)90 brains were more compact on AGERA gels and, unlike aggregates from R6/2(CAG)200 brains, did not become trapped after filtration through cellulose acetate membranes as the disease progressed. These data emphasize that understanding the relationship between HTT aggregation and the onset and progression of disease phenotypes in Huntington’s disease mouse models, requires a subcellular analysis using multiple complimentary approaches. Soluble HTT and its N-terminal fragments can only be detected in the cytoplasm on western blots in R6/2, BACHD and HdhQ150 mice (Benn et al., 2005; Landles et al., 2010; Gu et al., 2015), and therefore, we had not expected to find that an exon 1 HTT fragment migrated as a soluble protein in the nuclear fraction from the R6/2(CAG)90 brains. We have interpreted this as having been released from HTT aggregates for the following reason. The first 17 amino acids of HTT contain a very potent nuclear export signal (Cornett et al., 2005; Zheng et al., 2013), which effectively expels soluble exon 1 HTT from the nucleus in transgenic mice (Benn et al., 2005). This endogenous nuclear export signal is potent and was shown to override an exogenous nuclear localization sequences (NLS), both in cell culture (Cornett et al., 2005) and in vivo (Benn et al., 2005), with the consequence that, despite the addition of an nuclear localization sequence, an exon 1 HTT protein with 20 glutamines was cytoplasmic in transgenic mice (Benn et al., 2005). In contrast, HTT proteins with polyQ tracts in the mutant range accumulate in the nucleus because they form detergent insoluble aggregates. In keeping with this, the addition of an nuclear localization sequence to a HTT protein containing an expanded polyQ tract accelerates the appearance of aggregates in the nucleus, and drives all of the mutant HTT into these nuclear aggregate structures (Schilling et al., 2004; Benn et al., 2005; Gu et al., 2015), which can be solubilized with formic acid (Landles et al., 2010; Gu et al., 2015). Therefore, we infer that, unlike R6/2(CAG)200, the R6/2(CAG)90 brains contain an aggregate species in the nucleus, from which soluble HTT can be released upon exposure to mild detergents in the sample preparation.
Transcriptional dysregulation is a well characterised molecular phenotype for Huntington’s disease that has been extensively studied in mice (Luthi-Carter et al., 2000; Langfelder et al., 2016) and post-mortem brains (Hodges et al., 2006), demonstrating that mice usefully replicate this phenotype (Kuhn et al., 2007). Here, we have monitored the expression levels of specific transcripts, reproducibly altered in the brains of Huntington’s disease mouse models (Kuhn et al., 2007; Langfelder et al., 2016), as markers of transcriptional dysregulation. At 4 weeks of age, all striatal, cortical and some cerebellar transcripts were dysregulated in R6/2(CAG)90, but not in R6/2(CAG)200 mice. Therefore, the onset of transcriptional dysregulation correlated with the appearance of HTT aggregation and not with the presence of soluble exon 1 HTT which would have been shuttling between the nucleus and cytoplasm in both R6/2 lines. It was striking that the level of transcriptional dysregulation in both the striatum and cortex was comparable between R6/2(CAG)90 and R6/2(CAG)200 mice at 8 weeks of age, although the immunoprobing with MW8 revealed quite different nuclear structures: a diffuse signal for R6/2(CAG)90 and an inclusion body for R6/2(CAG)200.
The accumulation of cytoplasmic aggregates was much faster in R6/2(CAG)200 brains and correlated with disease progression. In fact, cytoplasmic aggregates remained relatively sparse in R6/2(CAG)90 brain regions, even at end-stage disease. In a previous study, end-stage disease occurred much earlier, and the range of neurological phenotypes was more extensive in R6/2 mice with aggregate pathology in both the nucleus and cytoplasm, as compared to those with comparable aggregation occurring in the nucleus only (Benn et al., 2005). In keeping with this, heterozygosity for HDAC4, a cytoplasmic protein that interacts with HTT (Mielcarek et al., 2013; Federspiel et al., 2019), delayed aggregation in the cytoplasm, improved behavioural phenotypes, and delayed end-stage disease in R6/2 mice, whilst the levels of nuclear aggregation and transcriptional dysregulation were unchanged (Mielcarek et al., 2013).
The work presented in this study contributes to a larger data set showing that the relationship between CAG repeat length and disease progression in R6/2 mice is complex, with phenotypes generally worsening with increasing CAG repeat length up to ∼150 CAGs, after which phenotypes improve as the CAG repeat length increases further (Dragatsis et al., 2009; Morton et al., 2009; Cummings et al., 2012; Morton et al., 2019). The level of huntingtin expression at both RNA and protein levels was lower in R6/2 mice with expansions in 400 CAG range as opposed to 150 CAGs (Dragatsis et al., 2009), consistent with the prediction that unusual DNA structures formed by super-long CAG repeats might impair transcription (Duzdevich et al., 2011). As CAG repeats expanded beyond 150 CAGs, the proportion of cytoplasmic HTT aggregates increased dramatically, presumably because exon 1 HTT with super-long CAG expansions can no longer diffuse into the nucleus. Therefore, the onset and progression of the phenotype is determined by the consequences of a given CAG repeat length on transgene expression, protein aggregation and the subcellular localization of aggregate pathology.
A number of factors could influence the difference in the subcellular location of the aggregates in the R6/2(CAG)90 and R6/2(CAG)200 lines. The kinetics of HTT aggregation are concentration and polyQ length dependent (Scherzinger et al., 1999), and given that we found that the transgene is more highly expressed in the R6/2(CAG)90 mice, both of these factors will influence the differential rate of aggregate formation between the R6/2(CAG)90 and R6/2(CAG)200 lines. (i) The probability of aggregates forming in a specific subcellular location will depend upon local exon 1 HTT concentrations, and possibly, how these are influenced by interactions with other proteins and the local proteostasis network. (ii) The concentration of exon 1 HTT in the nucleus will be determined by whether it is small enough to diffuse across the nuclear membrane, a size determined by the polyQ repeat length, which at the cellular level might have increased through the somatic expansion of the CAG repeat. Somatic expansions are more likely to result in the exclusion of exon 1 HTT from the nucleus in the R6/2(CAG)200 than the R6/2(CAG)90 mice. (iii) Once aggregates have formed in one subcellular location, the recruitment of soluble exon 1 HTT into these aggregates will deplete the levels available for aggregation elsewhere.
HTT aggregates formed in the nuclei of R6/2(CAG)90 mice could be distinguished from those in R6/2(CAG)200 mice by immunohistochemistry with MW8, appearing as a diffuse nuclear signal, as compared to a discrete inclusion body, throughout the course of disease in these two lines. This diffuse pattern of nuclear aggregation is similar to that previously published for knock-in mice with 92 glutamines (Wheeler et al., 2000), although at the time of publication, it was not understood that this represented an aggregated form of HTT. Our work demonstrates that the simple correlation of HTT aggregate load in the brain with disease phenotypes is likely to be misleading, and that this must be performed at a subcellular level. Here, we have identified distinct contributions from nuclear and cytoplasmic aggregates to molecular and behavioural phenotypes, and this should be extended to distinguish the consequences of aggregates in other subcellular regions e.g. the synapse. We have shown that aggregates formed from HTT proteins with different polyQ expansions also have different molecular properties as defined by filter retardation, gel electrophoresis and aggregate seeding potential. More sophisticated approaches will now be required to understand what structures these represent, and to distinguish the effects they might have on cellular function. Whilst we do not understand the impact of somatic CAG repeat expansion in generating the pathogenic length of polyQ tracts in Huntington’s disease patient brains, it is important that we understand the properties of HTT proteins with a range of polyQ expansions.
Supplementary Material
Acknowledgements
We thank Agnesska C. Benjamin, Nelly Jolinon and Hayley Lazell for genotyping mice and Alex Osmand for the biotinylated 4H7H7 antibody.
Funding
This work was supported by grants from the CHDI Foundation to G.P.B and E.E.W, Medical Research Council (MR/N00373X/1), UK Dementia Research Institute, which receives its funding from DRI Ltd, funded by the UK Medical Research Council, Alzheimer’s Society and Alzheimer’s Research UK. M.F. is funded by the UK Dementia Research Institute at UCL and Health Education England.
Competing Interests
C.L.B. is an employee of LoQus23 Therapeutics. The authors report no other competing interests.
Glossary
- AGERA =
agarose gel electrophoresis for resolving aggregates
- PBS =
phosphate buffer saline
- polyQ =
polyglutamine
- qPCR =
real-time quantitative PCR
- SDS =
sodium dodecyl sulphate
References
- Ast A, Buntru A, Schindler F, Hasenkopf R, Schulz A, Brusendorf L, et al. mHTT seeding activity: a marker of disease progression and neurotoxicity in models of Huntington’s disease. Mol Cell 2018; 71: 675–88 e6. [DOI] [PubMed] [Google Scholar]
- Bates GP, Dorsey R, Gusella JF, Hayden MR, Kay C, Leavitt BR, et al. Huntington disease. Nat Rev Dis Primers 2015; 1: 15005. [DOI] [PubMed] [Google Scholar]
- Benn CL, Fox H, Bates GP. Optimisation of region-specific reference gene selection and relative gene expression analysis methods for pre-clinical trials of Huntington’s disease. Mol Neurodegeneration 2008; 3: 17. [DOI] [PMC free article] [PubMed] [Google Scholar]
- Benn CL, Landles C, Li H, Strand AD, Woodman B, Sathasivam K, et al. Contribution of nuclear and extranuclear polyQ to neurological phenotypes in mouse models of Huntington’s disease. Hum Mol Genet 2005; 14: 3065–78. [DOI] [PubMed] [Google Scholar]
- Bobrowska A Donmez G Weiss A Guarente L Bates G.. SIRT2 Ablation has no effect on tubulin acetylation in brain, cholesterol biosynthesis or the progression of huntington's disease phenotypes in vivo. PLoS ONE 2012; 7: e34805. [DOI] [PMC free article] [PubMed] [Google Scholar]
- Ciosi M, Maxwell A, Cumming SA, Hensman Moss DJ, Alshammari AM, Flower MD, et al. A genetic association study of glutamine-encoding DNA sequence structures, somatic CAG expansion, and DNA repair gene variants, with Huntington disease clinical outcomes. EBioMedicine 2019; 48: 568–80. [DOI] [PMC free article] [PubMed] [Google Scholar]
- Cornett J, Cao F, Wang CE, Ross CA, Bates GP, Li SH, et al. Polyglutamine expansion of huntingtin impairs its nuclear export. Nat Genet 2005; 37: 198–204. [DOI] [PubMed] [Google Scholar]
- Cummings DM, Alaghband Y, Hickey MA, Joshi PR, Hong SC, Zhu C, et al. A critical window of CAG repeat-length correlates with phenotype severity in the R6/2 mouse model of Huntington’s disease. J Neurophysiol 2012; 107: 677–91. [DOI] [PMC free article] [PubMed] [Google Scholar]
- Davies SW, Sathasivam K, Hobbs C, Doherty P, Mangiarini L, Scherzinger E, et al. Detection of polyglutamine aggregation in mouse models. Methods Enzymol 1999; 309: 687–701. [DOI] [PubMed] [Google Scholar]
- DiFiglia M, Sapp E, Chase KO, Davies SW, Bates GP, Vonsattel JP, et al. Aggregation of huntingtin in neuronal intranuclear inclusions and dystrophic neurites in brain. Science 1997; 277: 1990–3. [DOI] [PubMed] [Google Scholar]
- Dragatsis I, Goldowitz D, Del Mar N, Deng YP, Meade CA, Liu L, et al. CAG repeat lengths > or =335 attenuate the phenotype in the R6/2 Huntington’s disease transgenic mouse. Neurobiol Dis 2009; 33: 315–30. [DOI] [PMC free article] [PubMed] [Google Scholar]
- Duzdevich D, Li J, Whang J, Takahashi H, Takeyasu K, Dryden DT, et al. Unusual structures are present in DNA fragments containing super-long Huntingtin CAG repeats. PLoS One 2011; 6: e17119. [DOI] [PMC free article] [PubMed] [Google Scholar]
- Federspiel JD, Greco TM, Lum KK, Cristea IM. Hdac4 interactions in Huntington’s disease viewed through the prism of multiomics. Mol Cell Proteomics 2019; 18: S92–S113. [DOI] [PMC free article] [PubMed] [Google Scholar]
- Flower M, Lomeikaite V, Ciosi M, Cumming S, Morales F, Lo K, et al. ; TRACK-HD Investigators. MSH3 modifies somatic instability and disease severity in Huntington’s and myotonic dystrophy type 1. Brain 2019; 142: 1876–86. [DOI] [PMC free article] [PubMed] [Google Scholar]
- Franich NR, Hickey MA, Zhu C, Osborne GF, Ali N, Chu T, et al. Phenotype onset in Huntington’s disease knock-in mice is correlated with the incomplete splicing of the mutant huntingtin gene. J Neurosci Res 2019; 97: 1590–605. [DOI] [PMC free article] [PubMed] [Google Scholar]
- GeM-HD Consortium. Identification of genetic factors that modify clinical onset of Huntington’s disease. Cell 2015; 162: 516–26. [DOI] [PMC free article] [PubMed] [Google Scholar]
- GeM-HD Consortium. CAG repeat not polyglutamine length determines timing of Huntington’s disease onset. Cell 2019; 178: 887–900 e14. [DOI] [PMC free article] [PubMed] [Google Scholar]
- Gonitel R, Moffitt H, Sathasivam K, Woodman B, Detloff PJ, Faull RL, et al. DNA instability in postmitotic neurons. Proc Natl Acad Sci USA 2008; 105: 3467–72. [DOI] [PMC free article] [PubMed] [Google Scholar]
- Gu X, Cantle JP, Greiner ER, Lee CY, Barth AM, Gao F, et al. N17 Modifies mutant Huntingtin nuclear pathogenesis and severity of disease in HD BAC transgenic mice. Neuron 2015; 85: 726–41. [DOI] [PMC free article] [PubMed] [Google Scholar]
- Gutekunst CA, Li SH, Yi H, Mulroy JS, Kuemmerle S, Jones R, et al. Nuclear and neuropil aggregates in Huntington’s disease: relationship to neuropathology. J Neurosci 1999; 19: 2522–34. [DOI] [PMC free article] [PubMed] [Google Scholar]
- Huntington’s Disease Collaborative Research Group. A novel gene containing a trinucleotide repeat that is expanded and unstable on Huntington’s disease chromosomes. Cell 1993; 72: 971–83. [DOI] [PubMed] [Google Scholar]
- Hockly E, Woodman B, Mahal A, Lewis CM, Bates G. Standardization and statistical approaches to therapeutic trials in the R6/2 mouse. Brain Res Bull 2003; 61: 469–79. [DOI] [PubMed] [Google Scholar]
- Hodges A, Strand AD, Aragaki AK, Kuhn A, Sengstag T, Hughes G, et al. Regional and cellular gene expression changes in human Huntington’s disease brain. Hum Mol Genet 2006; 15: 965–77. [DOI] [PubMed] [Google Scholar]
- Kennedy L, Evans E, Chen CM, Craven L, Detloff PJ, Ennis M, et al. Dramatic tissue-specific mutation length increases are an early molecular event in Huntington disease pathogenesis. Hum Mol Genet 2003; 12: 3359–67. [DOI] [PubMed] [Google Scholar]
- Kuhn A, Goldstein DR, Hodges A, Strand AD, Sengstag T, Kooperberg C, et al. Mutant Huntingtin’s effects on striatal gene expression in mice recapitulate changes observed in human Huntington’s disease brain and do not differ with mutant huntingtin length or wild-type huntingtin dosage. Hum Mol Genet 2007; 16: 1845–61. [DOI] [PubMed] [Google Scholar]
- Labbadia J, Cunliffe H, Weiss A, Katsyuba E, Sathasivam K, Seredenina T, et al. Altered chromatin architecture underlies progressive impairment of the heat shock response in mouse models of Huntington disease. J Clin Invest 2011; 121: 3306–19. [DOI] [PMC free article] [PubMed] [Google Scholar]
- Landles C, Sathasivam K, Weiss A, Woodman B, Moffitt H, Finkbeiner S, et al. Proteolysis of mutant huntingtin produces an exon 1 fragment that accumulates as an aggregated protein in neuronal nuclei in Huntington disease. J Biol Chem 2010; 285: 8808–23. [DOI] [PMC free article] [PubMed] [Google Scholar]
- Langfelder P, Cantle JP, Chatzopoulou D, Wang N, Gao F, Al-Ramahi I, et al. Integrated genomics and proteomics define huntingtin CAG length-dependent networks in mice. Nat Neurosci 2016; 19: 623–33. [DOI] [PMC free article] [PubMed] [Google Scholar]
- Lee JM, Chao MJ, Harold D, Abu Elneel K, Gillis T, Holmans P, et al. A modifier of Huntington’s disease onset at the MLH1 locus. Hum Mol Genet 2017; 26: 3859–67. [DOI] [PMC free article] [PubMed] [Google Scholar]
- Lee JM, Zhang J, Su AI, Walker JR, Wiltshire T, Kang K, et al. A novel approach to investigate tissue-specific trinucleotide repeat instability. BMC Syst Biol 2010; 4: 29. [DOI] [PMC free article] [PubMed] [Google Scholar]
- Livak KJ, Schmittgen TD. Analysis of relative gene expression data using real-time quantitative PCR and the 2(-Delta Delta C(T)) method. Methods 2001; 25: 402–8. [DOI] [PubMed] [Google Scholar]
- Luthi-Carter R, Strand A, Peters NL, Solano SM, Hollingsworth ZR, Menon AS, et al. Decreased expression of striatal signaling genes in a mouse model of Huntington’s disease. Hum Mol Genet 2000; 9: 1259–71. [DOI] [PubMed] [Google Scholar]
- Mangiarini L, Sathasivam K, Mahal A, Mott R, Seller M, Bates GP. Instability of highly expanded CAG repeats in mice transgenic for the Huntington’s disease mutation. Nat Genet 1997; 15: 197–200. [DOI] [PubMed] [Google Scholar]
- Mangiarini L, Sathasivam K, Seller M, Cozens B, Harper A, Hetherington C, et al. Exon 1 of the HD gene with an expanded CAG repeat is sufficient to cause a progressive neurological phenotype in transgenic mice. Cell 1996; 87: 493–506. [DOI] [PubMed] [Google Scholar]
- Manley K, Shirley TL, Flaherty L, Messer A. Msh2 deficiency prevents in vivo somatic instability of the CAG repeat in Huntington disease transgenic mice. Nat Genet 1999; 23: 471–3. [DOI] [PubMed] [Google Scholar]
- Mielcarek M, Inuabasi L, Bondulich MK, Muller T, Osborne GF, Franklin SA, et al. Dysfunction of the CNS-heart axis in mouse models of Huntington’s disease. PLoS Genet 2014; 10: e1004550. [DOI] [PMC free article] [PubMed] [Google Scholar]
- Mielcarek M, Landles C, Weiss A, Bradaia A, Seredenina T, Inuabasi L, et al. HDAC4 reduction: a novel therapeutic strategy to target cytoplasmic huntingtin and ameliorate neurodegeneration. PLoS Biol 2013; 11: e1001717. [DOI] [PMC free article] [PubMed] [Google Scholar]
- Mielcarek M, Toczek M, Smeets CJ, Franklin SA, Bondulich MK, Jolinon N, et al. HDAC4-myogenin axis as an important marker of HD-related skeletal muscle atrophy. PLoS Genet 2015; 11: e1005021. [DOI] [PMC free article] [PubMed] [Google Scholar]
- Morton AJ, Glynn D, Leavens W, Zheng Z, Faull RL, Skepper JN, et al. Paradoxical delay in the onset of disease caused by super-long CAG repeat expansions in R6/2 mice. Neurobiol Dis 2009; 33: 331–41. [DOI] [PubMed] [Google Scholar]
- Morton AJ, Skillings EA, Wood NI, Zheng Z. Antagonistic pleiotropy in mice carrying a CAG repeat expansion in the range causing Huntington’s disease. Sci Rep 2019; 9: 37. [DOI] [PMC free article] [PubMed] [Google Scholar]
- Moss DJH, Pardinas AF, Langbehn D, Lo K, Leavitt BR, Roos R, et al. Identification of genetic variants associated with Huntington’s disease progression: a genome-wide association study. Lancet Neurol 2017; 16: 701–11. [DOI] [PubMed] [Google Scholar]
- Neueder A, Dumas AA, Benjamin AC, Bates GP. Regulatory mechanisms of incomplete huntingtin mRNA splicing. Nat Commun 2018; 9: 3955. [DOI] [PMC free article] [PubMed] [Google Scholar]
- Neueder A, Landles C, Ghosh R, Howland D, Myers RH, Faull RLM, et al. The pathogenic exon 1 HTT protein is produced by incomplete splicing in Huntington’s disease patients. Sci Rep 2017; 7: 1307. [DOI] [PMC free article] [PubMed] [Google Scholar]
- Pinto RM, Dragileva E, Kirby A, Lloret A, Lopez E, St Claire J, et al. Mismatch repair genes Mlh1 and Mlh3 modify CAG instability in Huntington’s disease mice: genome-wide and candidate approaches. PLoS Genet 2013; 9: e1003930. [DOI] [PMC free article] [PubMed] [Google Scholar]
- Rubinsztein DC, Leggo J, Coles R, Almqvist E, Biancalana V, Cassiman JJ, et al. Phenotypic characterization of individuals with 30-40 CAG repeats in the Huntington disease (HD) gene reveals HD cases with 36 repeats and apparently normal elderly individuals with 36-39 repeats. Am J Hum Genet 1996; 59: 16–22. [PMC free article] [PubMed] [Google Scholar]
- Sathasivam K, Lane A, Legleiter J, Warley A, Woodman B, Finkbeiner S, et al. Identical oligomeric and fibrillar structures captured from the brains of R6/2 and knock-in mouse models of Huntington’s disease. Hum Mol Genet 2010; 19: 65–78. [DOI] [PMC free article] [PubMed] [Google Scholar]
- Sathasivam K, Neueder A, Gipson TA, Landles C, Benjamin AC, Bondulich MK, et al. Aberrant splicing of HTT generates the pathogenic exon 1 protein in Huntington disease. Proc Natl Acad Sci USA 2013; 110: 2366–70. [DOI] [PMC free article] [PubMed] [Google Scholar]
- Scherzinger E, Sittler A, Schweiger K, Heiser V, Lurz R, Hasenbank R, et al. Self-assembly of polyglutamine-containing huntingtin fragments into amyloid-like fibrils: implications for Huntington’s disease pathology. Proc Natl Acad Sci USA 1999; 96: 4604–9. [DOI] [PMC free article] [PubMed] [Google Scholar]
- Schilling G, Savonenko AV, Klevytska A, Morton JL, Tucker SM, Poirier M, et al. Nuclear-targeting of mutant huntingtin fragments produces Huntington’s disease-like phenotypes in transgenic mice. Hum Mol Genet 2004; 13: 1599–610. [DOI] [PubMed] [Google Scholar]
- Shelbourne PF, Keller-McGandy C, Bi WL, Yoon SR, Dubeau L, Veitch NJ, et al. Triplet repeat mutation length gains correlate with cell-type specific vulnerability in Huntington disease brain. Hum Mol Genet 2007; 16: 1133–42. [DOI] [PubMed] [Google Scholar]
- Swami M, Hendricks AE, Gillis T, Massood T, Mysore J, Myers RH, et al. Somatic expansion of the Huntington’s disease CAG repeat in the brain is associated with an earlier age of disease onset. Hum Mol Genet 2009; 18: 3039–47. [DOI] [PMC free article] [PubMed] [Google Scholar]
- Telenius H, Kremer HPH, Thellmann J, Andrew SE, Almqvist E, Anvret M, et al. Molecular analysis of juvenile Huntington disease: the major influence on (CAG)n repeat length is the sex of the affected parent. Hum Mol Genet 1993; 2: 1535–40. [DOI] [PubMed] [Google Scholar]
- Tome S, Manley K, Simard JP, Clark GW, Slean MM, Swami M, et al. MSH3 polymorphisms and protein levels affect CAG repeat instability in Huntington’s disease mice. PLoS Genet 2013; 9: e1003280. [DOI] [PMC free article] [PubMed] [Google Scholar]
- Vonsattel JP, DiFiglia M. Huntington disease. J Neuropathol Exp Neurol 1998; 57: 369–84. [DOI] [PubMed] [Google Scholar]
- Weiss A, Klein C, Woodman B, Sathasivam K, Bibel M, Regulier E, et al. Sensitive biochemical aggregate detection reveals aggregation onset before symptom development in cellular and murine models of Huntington’s disease. J Neurochem 2007; 0: 071106212705008–58. [DOI] [PubMed] [Google Scholar]
- Wexler NS, Lorimer J, Porter J, Gomez F, Moskowitz C, Shackell E, et al. Venezuelan kindreds reveal that genetic and environmental factors modulate Huntington’s disease age of onset. Proc Natl Acad Sci USA 2004; 101: 3498–503. [DOI] [PMC free article] [PubMed] [Google Scholar]
- Wheeler VC, White JK, Gutekunst CA, Vrbanac V, Weaver M, Li XJ, et al. Long glutamine tracts cause nuclear localization of a novel form of huntingtin in medium spiny striatal neurons in HdhQ92 and HdhQ111 knock- in mice. Hum Mol Genet 2000; 9: 503–13. [DOI] [PubMed] [Google Scholar]
- Woodman B, Butler R, Landles C, Lupton MK, Tse J, Hockly E, et al. The Hdh(Q150/Q150) knock-in mouse model of HD and the R6/2 exon 1 model develop comparable and widespread molecular phenotypes. Brain Res Bull 2007; 72: 83–97. [DOI] [PubMed] [Google Scholar]
- Zheng Z, Li A, Holmes BB, Marasa JC, Diamond MI. An N-terminal nuclear export signal regulates trafficking and aggregation of Huntingtin (Htt) protein exon 1. J Biol Chem 2013; 288: 6063–71. [DOI] [PMC free article] [PubMed] [Google Scholar]
Associated Data
This section collects any data citations, data availability statements, or supplementary materials included in this article.
Supplementary Materials
Data Availability Statement
The authors confirm that all the data supporting the findings of this study are available within the article and its Supplementary material. Raw data will be shared by the corresponding author on request. The custom repeat instability R script can be accessed and run online on request.