Abstract
Objective
This study aimed to elucidate the molecular mechanism underlying the involvement of abnormal DNA methylation in the development of glioma and identify potential new targets for glioma therapy.
Methods
The GSE79122 chip achieved from the Gene Expression Omnibus (GEO) database containing 69 glioma samples and 9 normal samples was analyzed. Methylation-specific polymerase chain reaction (MS-PCR or MSP), reverse transcription-PCR, and Western blot analysis were used to confirm the methylation level and expression level of the interleukin receptor-associated kinase (IRAK3) gene in glioma cells, 36 glioma samples, and the corresponding normal samples. In vitro, the proliferation, apoptosis rate, migration, and invasion abilities of glioma cells were detected by Cell Counting Kit-8 assay, Transwell assay, enzyme-linked immunosorbent assay, and flow cytometry, respectively. Besides, the xenograft assay of nude mice was used to confirm the effect of the IRAK3 on glioma in vivo.
Results
Microarray analysis showed that the IRAK3 was one of the most hypermethylated genes in glioma, and the related mitogen-activated protein kinase (MAPK) signaling pathway was activated. More experiments supported the higher methylation level and lower expression level of the IRAK3 in glioma tissues and cell lines. The viability, migration, and invasion ability of glioma cells significantly reduced and the apoptosis rate increased with the overexpression and demethylation of the IRAK3 in vitro. Besides, treatment with the MAPK signaling pathway inhibitor PD325901 alone or the overexpression or demethylation of the IRAK3 had a similar effect as the overexpression or demethylation of the IRAK3 alone in glioma cells. In vivo, xenotransplantation experiments in nude mice confirmed that the overexpression and demethylation of the IRAK3 and suppression of the MAPK signaling pathway inhibited the development of glioma.
Conclusion
IRAK3 inhibited the development of glioma progression through the MAPK signaling pathway.
Keywords: glioma, IRAK3, MAPK signaling pathway, methylation
Introduction
Glioma, also known as glioblastoma, is one of the most common primary malignant brain tumors. The average incidence rate of glioma is 6.6 in 100,000 individuals.1 Despite improvements in neurosurgery and radiotherapy/chemotherapy, most patients die within 15 months of diagnosis,1 and less than 1% patients survive for 10 years or even more.2 Recently, the molecular mechanisms of glioma have gained increasing attention so as to find some better methods to defeat this disease. Previous studies evaluated that long-term survivors of glioma often displayed some favorable molecular characteristics, such as the hypermethylation of O(6)-methylguanine DNA methyltransferase (MGMT) promoter,3 which is known as a meaningful predictive biomarker for the favorable prognosis of the chemotherapeutic drugs.4 Therefore, this study proposed that epigenetic regulation might play a key role in the development of glioma, which deserves further research for understanding this cancer.
DNA methylation is an epigenetic modification involved in many biological processes, especially gene expression regulation.5 The DNA methylation patterns of normal cells are controlled well by a balance between methylation and demethylation. However, this balance is always disturbed in cancer cells through ectopic, deficient, or excessive methylation, leading to abnormal biological activities.6 Hypermethylation of CpG islands on specific promoters inhibiting the transcription of downstream tumor suppressor genes has been discovered in many cancers, which may provide clinicians a new strategy for patients with cancer.7 For instance, the promoter region of SEPT9 is hypermethylated in colorectal cancer. Hence, the SEPT9 gene methylation assay might become a potential option for the early detection and screening of colorectal cancer.8 CpG islands also display aberrant hypermethylation at a large number of loci and define the subgroup of glioma.9,10 However, the underlying molecular events of DNA methylation and glioma development remain poorly understood.
Recently, technical advances in genome-wide expression analysis have enabled an improved understanding of the diagnosis and prognosis of many types of tumors.11 Genome-wide DNA methylation analysis allows comprehensive DNA methylation profiling of the whole genome, helping in the effective identification of novel genes that have a potential value in clinical practice.12 Previous studies have reported many specific methylation signature genes in different types of cancers, such as thyroid cancer,13 lung squamous cell carcinoma,14 hepatocellular carcinoma,15 prostate cancer,16 and so on, using DNA methylation analysis.
This study aimed to examine the genome-wide DNA methylation profiling of glioma tissues, revealing the hypermethylation of several genes in glioma. Then, one of these hypermethylated genes, IRAK3, was selected to conduct a comprehensive analysis. Subsequently, a relationship between IRAK3 and MAPK signaling pathway was demonstrated by using DNA methyltransferase inhibitor, overexpression of IRAK3 and MAPK signaling pathway inhibitor which can disrupt the development of gliomas in vitro and in vivo. The findings might provide some clues for the regulatory role of DNA methylation and the underlying application of targeted treatment in glioma.
Methods
Tissue Samples
Glioma tissues and adjacent normal tissues were collected from patients with primary glioma (n = 36) admitted to the Zhangye People’s Hospital Affiliated to Hexi University. Sample collection and use was performed according to the approval of the ethics committee of the Affiliated Hospital of Shandong University. Written informed consent was provided by every patient with glioma. All samples were frozen in liquid nitrogen and stored at –80°C. All human specimens were obtained with the approval by the Institutional Ethics Committee of Zhangye People’s Hospital Affiliated to Hexi University.
Cell Culture
Human gliocyte cell line (HEB) and glioma cell lines (SHG-44, U251, GOS-3, HS683, and SF-539) were obtained from Bena Culture Collection (Beijing, China). HEB, U251, HS683, and SF-539 cells were grown in 90% high-sugar Dulbecco’s modified Eagle’s medium (DMEM) with 10% fetal bovine serum (FBS). SHG-44 cells were grown in 90% RPMI-1640 medium (containing NaHCO3 1.5 g/L, glucose 2.5 g/L, and sodium pyruvate 0.11 g/L) with 10% FBS. The GOS-3 cells were grown with 90% minimum essential medium (with Earle’s Balanced Salts) with 10% FBS and 4 mM/L glucose. All cells were cultured at 37°C under a humidified atmosphere with 5% CO2.
Cell Transfection
pcDNA3.1–interleukin receptor–associated kinase (pcDNA3.1-IRAK3) was obtained from GenePharma (Shanghai, China), and 5-aza-dC ((5-aza-2ʹ-deoxycytidine, 5-aza-dC) and signaling pathway inhibitor PD325901 were obtained from Sigma-Aldrich (MO, USA). U251 cells were seeded in six-well plates at 1 × 10⁶ cells/well and cultured at 37°C and 5% CO2 until the cell confluence reached 40%–60%. Transfections were executed using Lipofectamine 2000 (Invitrogen, CA, USA) following the manufacturer’s protocols. The medium was changed with the complete medium after 6 h of transfection.
Genome-Wide DNA Methylation Analysis
For DNA methylation profiling, Infinium HumanMethylation 450K BeadChip (illuminaga_rnaseqv2.1.0.0) was obtained from the Gene Expression Omnibus (GEO) database. The DNA methylation data of chip number GSE79122, which contained 69 glioma tissues (36 glioblastomas, 17 diffuse astrocytomas, and 16 anaplastic astrocytomas) and 9 control brain tissues, were analyzed. The Infinium Methylation (Abbiotec, CA, USA) and Illumina BeadStudio software (Genetech Biotech, Taipei, Taiwan) were used to measure the methylation profiles of modified DNA and loci CpG. The methylated signal intensity at particular CpG loci and 450K BeadChip assay were presented as β values and percentage, respectively.
Quantitative RT-PCR
Total cellular RNA was extracted using PureLink (Invitrogen) following the manufacturer’s protocol. RT was performed on 2 µg total cellular RNA using a High-Capacity cDNA Reverse Transcription Kit with RNase Inhibitor (Applied Biosystems) purchased from Thermo Fisher Scientific (MA, USA). Subsequently, quantitative reverse transcription-polymerase chain reaction (RT-PCR) was performed using Arcturus Paradise Plus qRT-PCR Kit (Applied Biosystems; Thermo Fisher Scientific). Comparative expression values were calculated by the 2–ΔΔCt method. GAPDH was used for internal reference. All primer sequences involved are listed in Table 1.
Table 1.
qRT-PCR Primers
| Gene | Accession Number | Sequence (5ʹ-3ʹ) | |
|---|---|---|---|
| IRAK3 | NM_007199 | Forward | ACCCAAACTAACTGATTTTGCCA |
| Reverse | AGAGAAATTCCGAGGGCAGG | ||
| MEK1 | NM_002755 | Forward | CGACCTCCCATGGCAATTTT |
| Reverse | AACAGAGACAGGCATGGGAA | ||
| C-fos | NM_005252 | Forward | GCCATCTCGACCAGTCCG |
| Reverse | TCTAGTTGGTCTGTCTCCGC | ||
| GAPDH | NM_008084 | Forward | TAAATACGGACTGCAGCCCT |
| Reverse | GAGGTCAATGAAGGGGTCGT |
DNA Methylation Assay
Genomic DNA in glioma tissues and cells was extracted and treated with bisulfite using CpGenome DNA Modification Kit (Chemicon, CA, USA) following the manufacturer’s protocol. All unmethylated cytosine residues in DNA were converted into uracil without changing the state of methylated cytosine. The IRAK3 methylation level in glioma was identified using methylation-specific PCR (MSP). The MSP primers are listed in Table 2.
Table 2.
Methylation-Specific Primers
| Gene | Sequence (5ʹ-3ʹ) |
|---|---|
| IRAK3 forward | 5ʹTCGGGATAGTGGTTAATATTTC3ʹ |
| IRAK3 reverse | 5ʹTTTTTTTCGTTTTTCGTAAAA3ʹ |
| IRAK3 forward | 5ʹ AGTTTGGGATAGTGGTTAATATTTT 3ʹ |
| IRAK3 reverse | 5ʹ TTTTTTTCATTTTTCATAAAAAAA 3ʹ |
Enzyme-Linked Immunosorbent Assay
The human interleukin (IL)-6 enzyme-linked immunosorbent assay kit (Sangon Biotech, Shanghai, China) was used to test the IL-6 level in the glioma cell culture medium. The glioma cell culture medium was centrifuged at 4000 rpm for 20 min to remove cells and polymers. The supernatant fluid stored at –20°C was preserved in the supernatant fluid at –20°C. A normal glioma cell culture medium was used as the control.
Western Blot Analysis
Lysis buffer RIPA (Thermo Fisher Scientific) and N-PER (Thermo Fisher Scientific) were used to extract proteins from glioma cells and tissues, respectively. Then, 50 μg total protein per sample was separated using 12% SDS-PAGE and transferred to polyvinylidene fluoride membranes (Thermo Fisher Scientific). The membranes were probed with primary anti-IRAK3 antibody (ab8116, Abcam, MA, USA), anti-MEK1 (phospho S298) antibody [EPR3338] (ab96379), anti-ERK1 + ERK2 antibody [ERK-7D8] (ab54230), anti-c-Fos (phospho T232) antibody (ab17933), and anti-GAPDH antibody [6C5] (ab8245, Abcam) as control. The number of binding proteins was measured using AlphaEaseFC software (Genetic Technologies, FL, USA).
Cell Counting Kit-8 Assay
U251 cells were seeded in 96-well plates and allowed to adhere for 0–72 h at 37°C. Then, these cells were transfected with pcDNA3.1-IRAK3 and treated with 5-aza-dC or PD325901. After 0–72 h, Cell Counting Kit-8 (Dojindo, Kumamoto, Japan) was used to test the cell viability at respective time points. To summarize, 10 mL of the triazolium substrate was added to each well and co-incubated with cells at 37°C for 1 h. The absorbance was measured at 450 nm, and the results were normalized to untreated cells at respective time points.
Cell Migration and Invasion Assay
Both cell migration and invasion were performed using the Transwell assay. For cell migration assay, 6 × 10⁴ U251 cells were seeded in a serum-free medium in the upper chamber, which contained a polyethylene terephthalate membrane (with 6.5 mm in diameter and 8 μm in pore size). The bottom chamber was prepared with 10% FBS as a chemoattractant. After incubating at 37°C for 24 h, nonmigrated cells were scraped from the upper surface of the membrane with a cotton swab, and the cells migrating to the bottom chamber were fixed with paraformaldehyde and stained with crystal violet. Finally, the stained cells were counted under a microscope at × 400 magnification in five randomly selected fields for quantification.
For cell invasion assay, 5 × 10⁴ U251 cells were suspended in 200 mL of serum-free DMEM and then treated using the same procedure as for the migration assay following the manufacturer’s protocol, but the chambers (8 mm, BD Biosciences, San Jose, CA, USA) were plated with BD BioCoat Matrigel.
Flow Cytometry
Each treatment of U251 cells was washed with phosphate-buffered saline and resuspended in 500 μL of Annexin V binding buffer. After staining with Alexa Fluor 647 Annexin V and 7-AAD Viability Staining Solution for 15 min in the dark at room temperature, these cells were analyzed using multicolor flow cytometer. Data were analyzed using Kaluza software.
Xenograft Studies
Male BALB/c nude mice (4 weeks) were maintained under pathogen-free conditions. All the mice were kept in a temperature-controlled, air-conditioned conventional animal house with a 12 h light–dark cycle and given free access to food and water. Besides, animal health and behaviour were monitored every two days. All experiments were approved by the Ethics Committee of Zhangye People’s Hospital to guarantee that all studies involving experimental animals were performed in full compliance with National Institutes of Health Guidelines for the Care and Use of Laboratory Animals. The U251 (5 × 10⁶ cells/100 μL) cells were transfected with pcDNA3.1-IRAK3 and then transferred to mice (n=12). Normal U251 cells were transferred to mice in the 5-aza-dC and PD325901 groups, and then 5-aza-dC and PD325901 were subcutaneously injected, respectively, into the posterior flank of nude mice. After 7, 14, 21, and 28 days’ culture, the mice were sacrificed and the tumor size was measured. The tumor volume was measured using a caliper following the formula (length × width2)/2.
Statistical Analysis
All data were collected from three independent experiments and presented as mean ± standard deviation. Statistical analyses were performed using GraphPad software. Differences between groups were analyzed using Student' t-test or chi-square test. Statistical significance was set at P <0.05.
Results
Genome Methylation Profile in Glioma
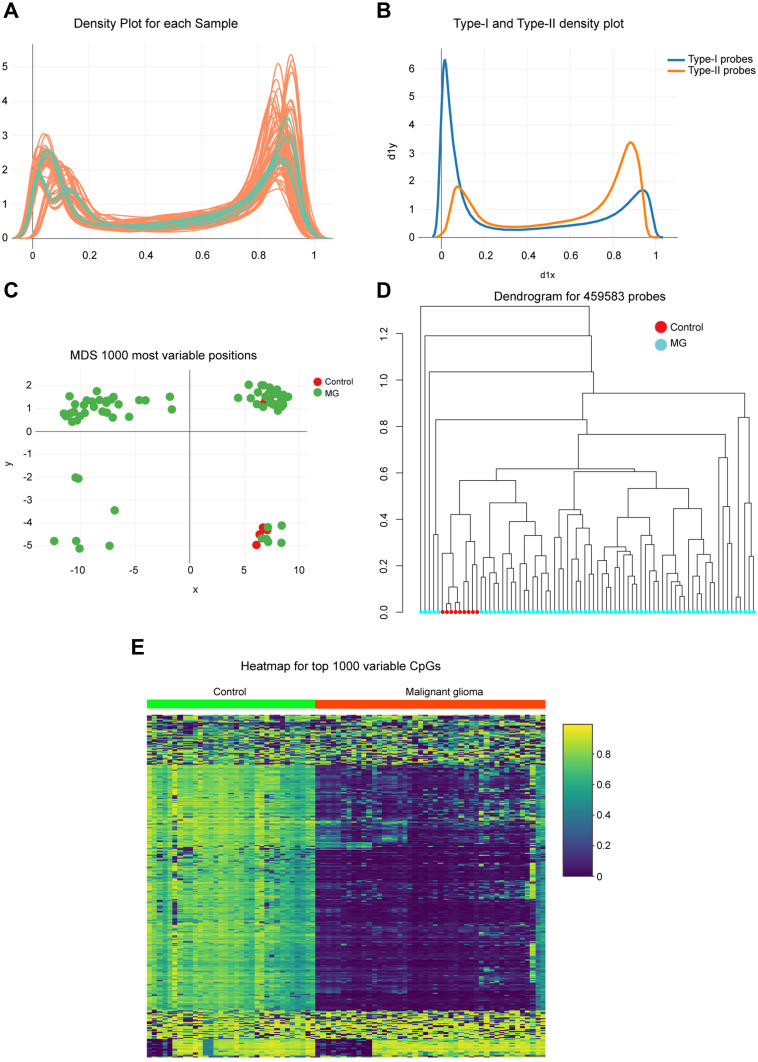
A total of 69 glioma tissues and 9 adjacent normal sample data, publicly available at GEO, were analyzed to reveal the global DNA methylation patterns of glioma. First, density plots of β values generated from each sample were used, identifying a poor performance of methylated signals for raw data (Figure 1A). Infinium Type I and Type II probe assays also showed somewhat different distribution of β value ranging from 0 (unmethylated sites) to 1 (fully methylated sites) (Figure 1B). Therefore, these data were regulated by normalization procedures to reduce the potential impact later. Multidimensional scaling (MDS) plot and dendrogram exhibited a differential clustering between tumor and normal groups, which distinguished glioma from adjacent normal tissues (Figure 1C and D). Further, heatmap of the top 1000 differentially methylated CpG sites indicated a visible difference in DNA methylation profiles between the tumor and normal tissue samples, and general hypermethylation occurred in glioma. (Figure 1E).
Figure 1.
Genome-wide methylation data were obtained from the GEO database for 69 available glioma/9 adjacent mucosa. (A) Density of methylated DNA intensity by each sample. (B) Type I and Type II assays showed variant β value distributions. The differences between probe types were regulated by normalization procedures, which showed that 0 represented unmethylated sites while 1 represented fully methylated sites. (C) Multidimensional scaling plot showing differential clustering of control versus tumor tissues. (D) Dendrogram produced for 459,583 probes in normal and tumor tissues. (E) Heatmap of top 1000 differentially methylated imprinted CpG sites.
Abbreviation: MG, malignant glioma.
Distribution of Genomic Regions for Differentially Methylated CpG Sites
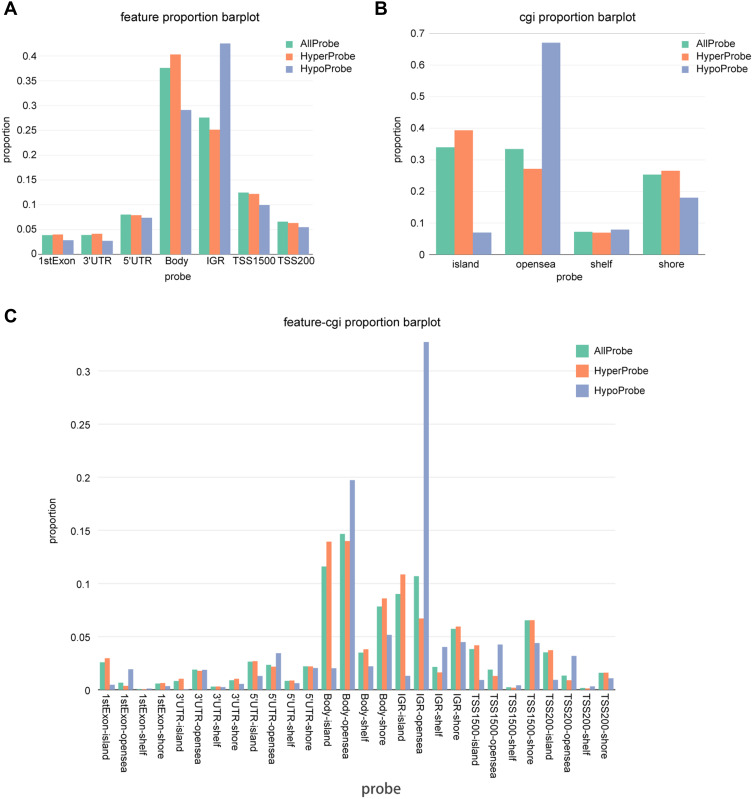
Based on the position relative to gene [1st exon, 3′ untranslated region (UTR), 5′ UTRs, body, transcription start sites 1500 bp (TSS1500) and TSS200] as well as CpG islands and neighborhood content (shores, shelves, islands, and open sea), the distribution of genomic regions for the differentially methylated CpG sites was exhibited. More than 25% and 30% methylation differences occurred in body/IGR and CpG island/open sea, respectively, which was obviously higher than that in other regions (Figure 2A and B). From the perspective of both genetics and epigenetics, gene and CpG content regions were combined for more analyses, which showed that CpG sites in genetic body-island/open sea and IGR-island/open sea were differentially methylated between glioma and adjacent normal samples (Figure 2C).
Figure 2.
Distribution of top 1000 differentially methylated imprinted CpG sites. (A) Distribution of top 1000 differentially methylated imprinted CpG sites according to CpG islands (island, open sea, shelf, and shore). (B) Distribution of top 1000 differentially methylated imprinted CpG sites according to the position relative to genes (1st exon, 3′ UTRs or 5′ UTRs, body, IGR, TSS1500, and TSS200). (C) Combined genetic and epigenetic annotation information revealed the distribution of the top 1000 differentially methylated imprinted CpG sites.
IRAK3 Was Hypermethylated in Glioma
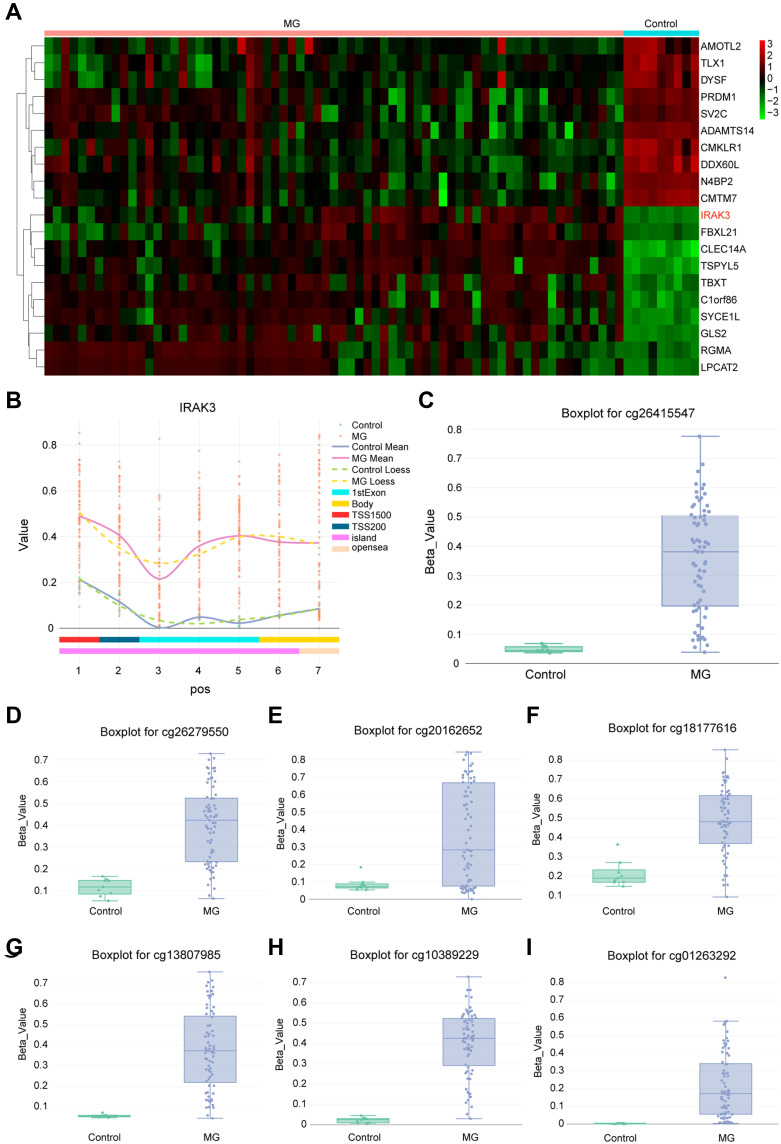
The heatmap was used to present the top 10 hypermethylation genes in glioma compared with normal tissues so as to figure out the most characteristic gene with methylation change in tumors, indicating that the IRAK3 was hypermethylated the most in glioma (Figure 3A). Then, the methylation differential distribution of the IRAK3 was upregulated at each site (Figure 3B). Furthermore, the β value of CpG sitesIRAK3, such as cg 26,415,547, cg 26,279,550, cg 20,162,652, cg 18,177,616, cg 13,807,985, cg 10,389,229, cg 01263292, and so on, on the IRAK3 was significantly higher in the tumor group than in the normal group, indicating that IRAK3 was hypermethylated in the tumor group due to CpGs (Figure 3C–I). The aforementioned results showed that the IRAK3 CpG sites were highly methylated in glioma tissues than in normal tissues.
Figure 3.
DNA methylation analysis of tumor tissues and normal tissues and analysis of methylation degree for seven CpG sites of IRAK3. (A) The expression of the top 20 candidate genes was analyzed. IRAK3 was hypermethylated significantly in tumor tissues compared with normal tissues. (B) The number of IRAK3–methylated CpG islands in each isosite. (C–I) Seven CpG sites for IRAK3, which are presented in the boxplot, displayed a decreased methylation in the tumor group. The boxplot for cg 26,415,547 (C), cg 26,279,550 (D), cg 20,162,652 (E), cg 18,177,616 (F), cg 13,807,985 (G), cg 10,389,229 (H), and cg 01263292 (I).
Abbreviation: MG, malignant glioma.
MAPK Signaling Pathway Expression Level and State in Glioma
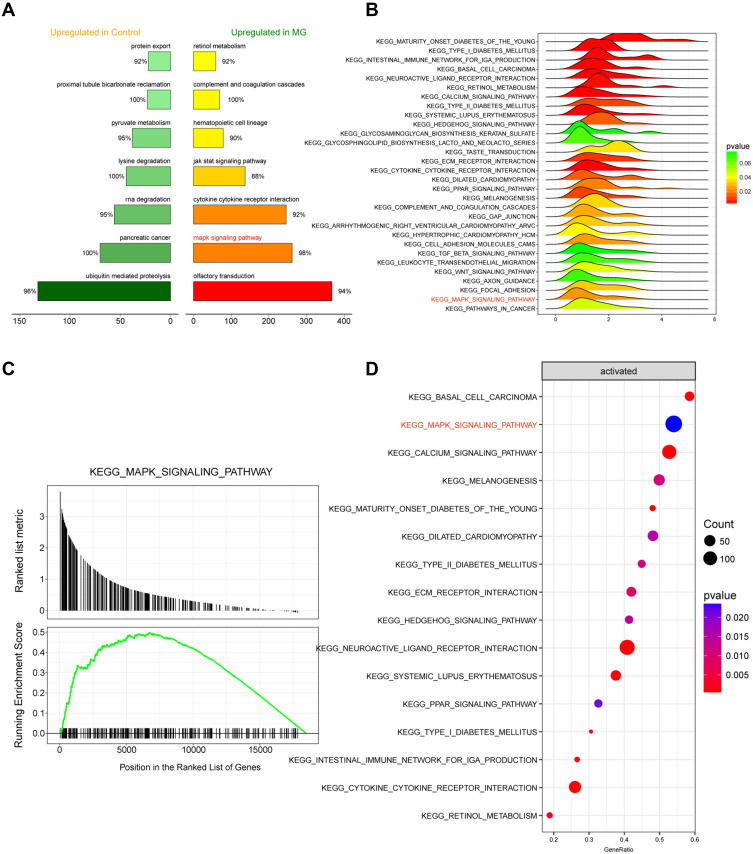
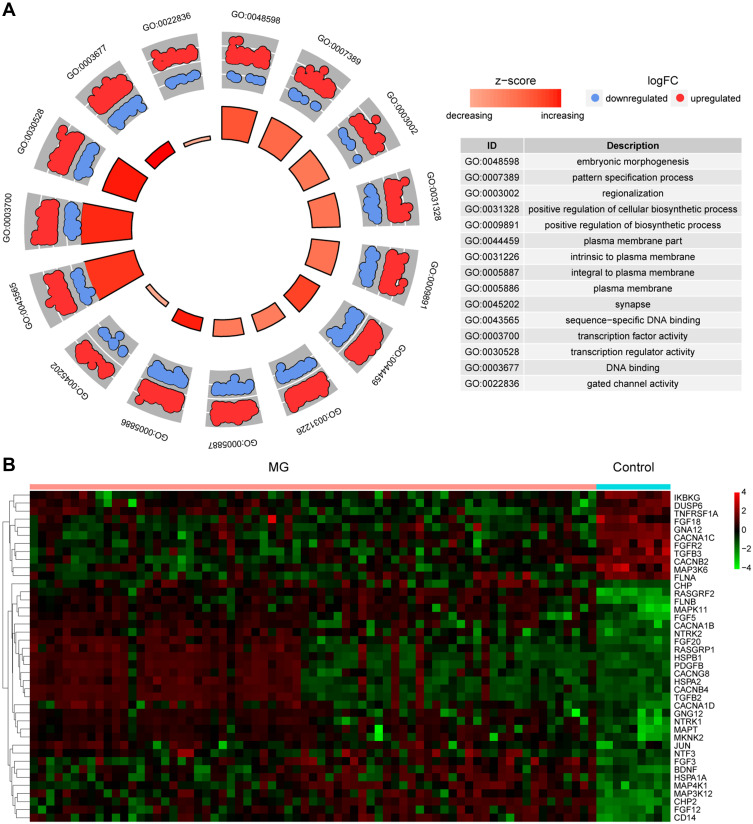
For the identification of glioma-related signaling pathways that might be influenced by aberrant DNA methylation, the top 7 IRAK3-related signaling pathways in glioma and normal tissues and the top 30 signaling pathway-related genes enriched in the glioma were listed (Figure 4A and B). The results suggested that the MAPK signaling pathway was highly expressed and activated (Figure 4C and D). Based on the differential genes in the disease data, the distribution of upregulated genes and downregulated genes in the GO-related pathway was enriched (Figure 5A). The expression level of MAPK signaling pathway-related genes in glioma is shown in Figure 5B. The results of Figures 4 and 5 manifested that IRAK3-related MAPK signaling pathway was highly activated in glioma. However, whether any correction existed with the development of glioma remained to be verified.
Figure 4.
Analysis of the IRAK3-related signaling pathway. (A) The top 7 signaling pathways with the highest and lowest correlation with glioma. (B) The top 30 signaling pathway–related genes enriched in the glioma; the MAPK signaling pathway was highly expressed. (C) The MAPK signaling pathway was activated in glioma. (D) The status of the top 16 enriched signaling pathways in glioma.
Abbreviation: MG, malignant glioma.
Figure 5.
Analysis of the IRAK3-related gene expression level. (A) Based on the differential genes in the disease data, the distribution of upregulated genes and downregulated genes in the GO-related pathway was enriched. (B) The expression level of top 40 MAPK signaling pathway–related genes.
Abbreviation: MG, malignant glioma.
Methylation and Expression Level of the IRAK3 in Glioma Tissues and Cells
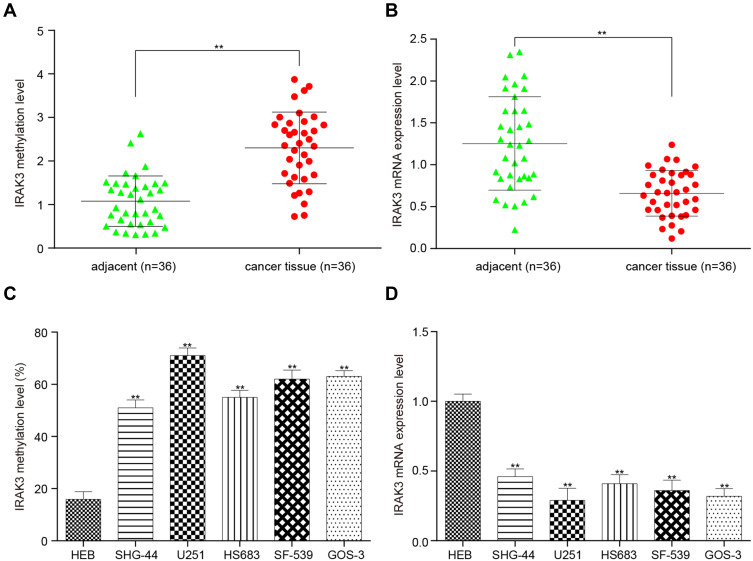
The impact of hypermethylation on the expression of IRAK3 in glioma tissues and cells was elucidated. The IRAK3 was highly methylated and less expressed in glioma tissues than in adjacent normal tissues (Figure 6A and B). Next, the IRAK3 in five glioma cell lines (SHG-44, U251, HS683, SF-539, and GOS-3) also showed hypermethylation and less expression compared with normal gliocytes (Figure 6C and D). U251 cells were selected for subsequent experiments because the methylation level of the IRAK3 in U251 cells was the highest (Figure 6C).
Figure 6.
Methylation level and expression level of the IRAK3 in glioma tissues and cells. (A) The IRAK3 was highly methylated in glioma tissues compared with adjacent tissues. (B) The IRAK3 was less expressed in glioma tissues than in adjacent tissues. (C) The IRAK3 in the five glioma cells (SHG-44, U251, HS683, SF-539, and GOS-3) was hypermethylated compared with U251 glioma cells. (D) The IRAK3 was less expressed in the five glioma cells than in normal glioma cells. The difference was significant (**P < 0.01).
Overexpression or Demethylation of the IRAK3 Inhibited the Development of Glioma Cells
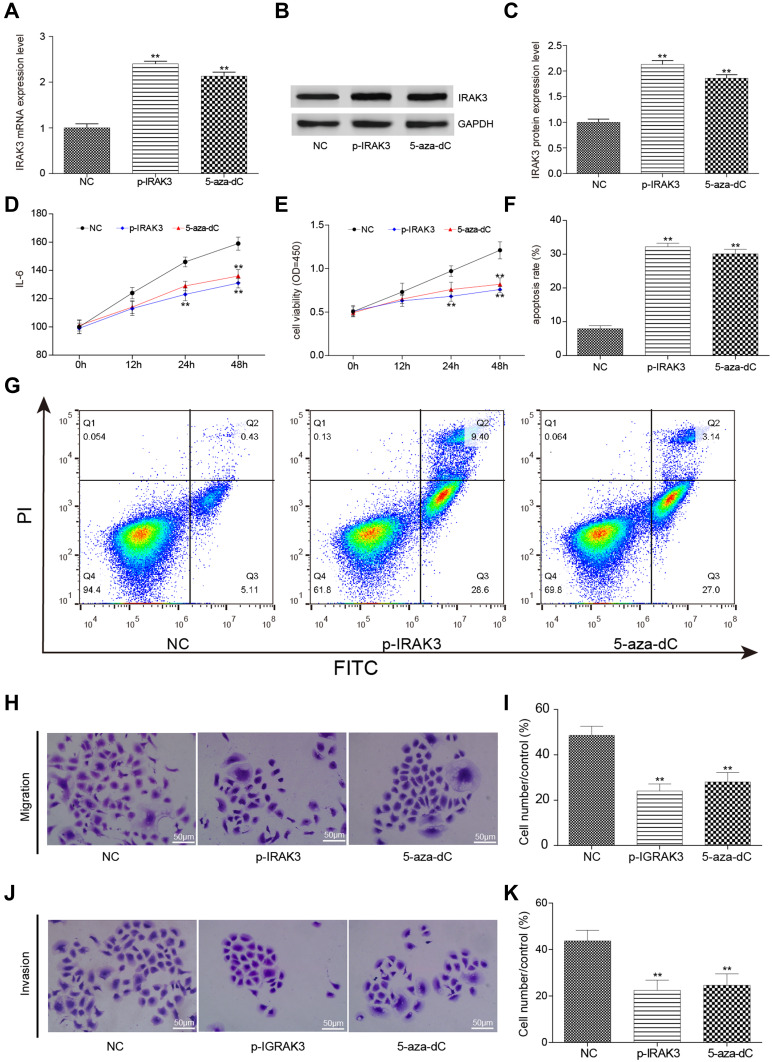
A systematic test with the overexpression or demethylation of the IRAK3 was conducted to understand whether the correction of abnormal IRAK3 methylation and expression affected the development of glioma. After using pcDNA3.1-IRAK3 to overexpress or 5-aza-dC to demethylate the IRAK3, the protein expression level of the IRAK3 in glioma U251 cells increased in the tumor group compared with the normal group (Figure 7A–C). IL-6, an inflammatory factor secreted by the MAPK signaling pathway [PMID: 26,247,025] so that its level in the culture medium could be used to represent the status of MAPK signaling pathway activation, decreased in the pcDNA3.1-IRAK3 and 5-aza-dC groups compared with the control groups (Figure 7D). Surprisingly, the viability of glioma cells significantly decreased while the apoptosis rate increased (Figure 7E–G), and the migration and invasiveness capability decreased in the pcDNA3.1-IRAK3 and 5-aza-dC groups (Figure 7H–K), which elucidated the association between IRAK3 and the development of glioma. The aforementioned results verified that the overexpression or demethylation of the IRAK3 inhibited the development of glioma cells in vitro.
Figure 7.
Effect on glioma cells after the overexpression and demethylation of the IRAK3. (A) The expression level of the IRAK3 was significantly higher in the glioma U251 cells of the pcDNA3.1-IRAK3 and 5-aza-dC groups than in the control group. (B and C) The protein expression level of the IRAK3 significantly increased in the pcDNA3.1-IRAK3 and 5-aza-dC groups compared with the control group. (D) The expression level of the inflammatory factor IL-6 significantly decreased in the pcDNA3.1-IRAK3 and 5-aza-dC groups compared with the control group. (E) The activity significantly decreased in the pcDNA3.1-IRAK3 and 5-aza-dC groups compared with the control group. (F and G) The apoptosis rate significantly increased in the pcDNA3.1-IRAK3 and 5-aza-dC groups compared with the control group. (H and I) The migration capability was significantly lower in the pcDNA3.1-IRAK3 and 5-aza-dC groups compared with the control group. (J and K) The invasiveness capability was significantly lower in the pcDNA3.1-IRAK3 and 5-aza-dC groups than in the the control group. All the mentioned differences were significant (**P < 0.01). The IRAK3 had a suppressive effect on glioma cells in vitro.
MAPK Signaling Pathway Suppression Alone or Combined with the Overexpression or Demethylation of the IRAK3 Inhibited the Development of Glioma Cells
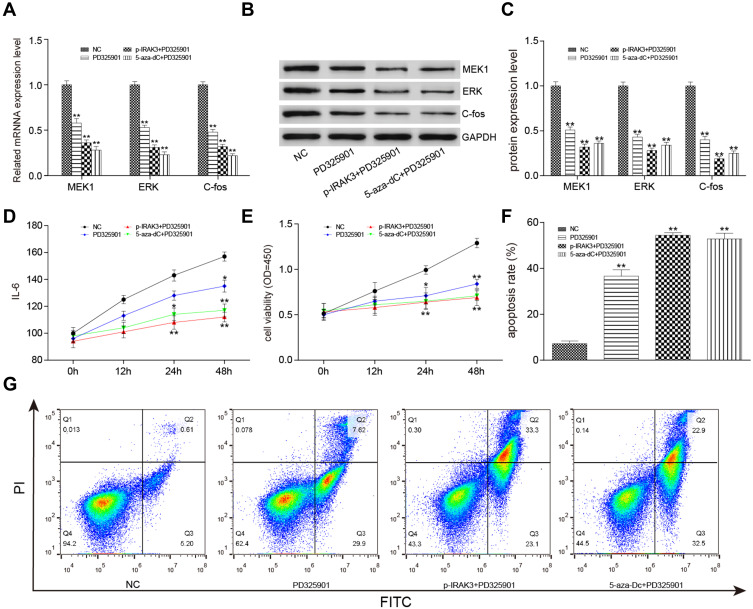
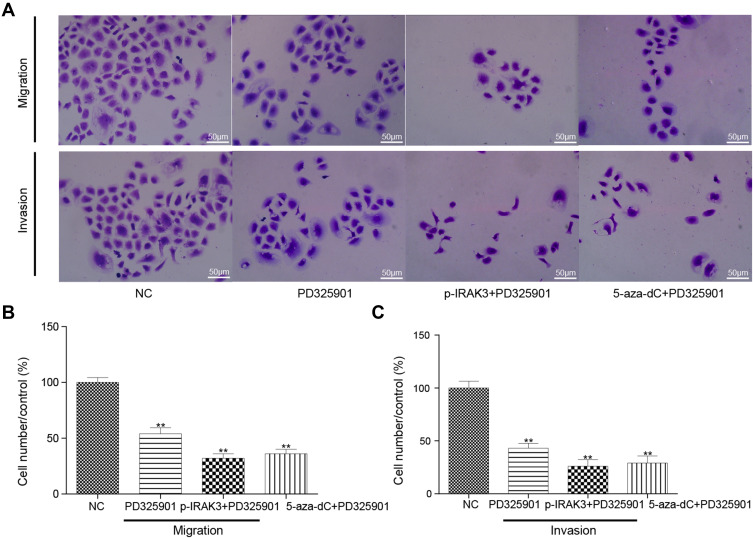
The MAPK signaling pathway inhibitors PD325901, pcDNA3.1-IRAK3, and 5-aza-dC were used alone or in combination in vitro to confirm the influence of the IRAK3 and MAPK signaling pathways on glioma. In PD325901, pcDNA3.1-IRAK3+PD325901, and 5-aza-dC+PD325901 groups, the mRNA and protein expression levels of the MAPK signaling pathway-related genes, such as MEK1, ERK, and c-Fos, as well as the level of IL-6 decreased in glioma (Figure 8A–D). The cell viability significantly decreased, the apoptosis rate increased (Figure 8E–G), and the migration and invasiveness capability significantly decreased in PD325901, p-IRAK3+PD325901, and 5-aza-dC+PD325901 groups (Figure 9A–C). The aforementioned results verified that the MAPK signaling pathway suppression alone or combined with the overexpression or demethylation of IRAK3.
Figure 8.
Effect on glioma cells after treatment with the MAPK signaling pathway inhibitor PD325901, pcDNA3.1-IRAK3, and 5-aza-dC. (A) The expression level of MAPK signaling pathway–related genes expression level was significantly lower in the PD325901, pcDNA3.1-IRAK3, and 5-aza-dC groups than in the control group. (B and C) The expression level of MAPK signaling pathway–related proteins significantly decreased in the PD325901, pcDNA3.1-IRAK3, and 5-aza-dC groups compared with the control group. (D) The level of inflammatory factor IL-6 was significantly lower in the PD325901, pcDNA3.1-IRAK3, and 5-aza-dC groups than in the control group. (E) The activity significantly decreased in the PD325901, pcDNA3.1-IRAK3, and 5-aza-dC groups compared with the control group. (F and G) The apoptosis rate significantly increased in the PD325901, pcDNA3.1-IRAK3, and 5-aza-dC groups compared with the control group. All the mentioned differences were significant (*P < 0.05, **P < 0.01).
Figure 9.
Effect on the migration and invasiveness capability of glioma cells after treatment with the MAPK signaling pathway inhibitor PD325901, pcDNA3.1-IRAK3, and 5-aza-dC. (A and B) The migration capability was significantly lower in the PD325901, pcDNA3.1-IRAK3, and 5-aza-dC groups than in the control group. (A and C) The invasiveness capability was significantly lower in the PD325901, pcDNA3.1-IRAK3, and 5-aza-dC groups than in the control group. All the mentioned differences were significant (**P < 0.01).
MAPK Signaling Pathway Suppression Alone or Combined with the Overexpression or Demethylation of the IRAK3 Inhibited Glioma in vivo
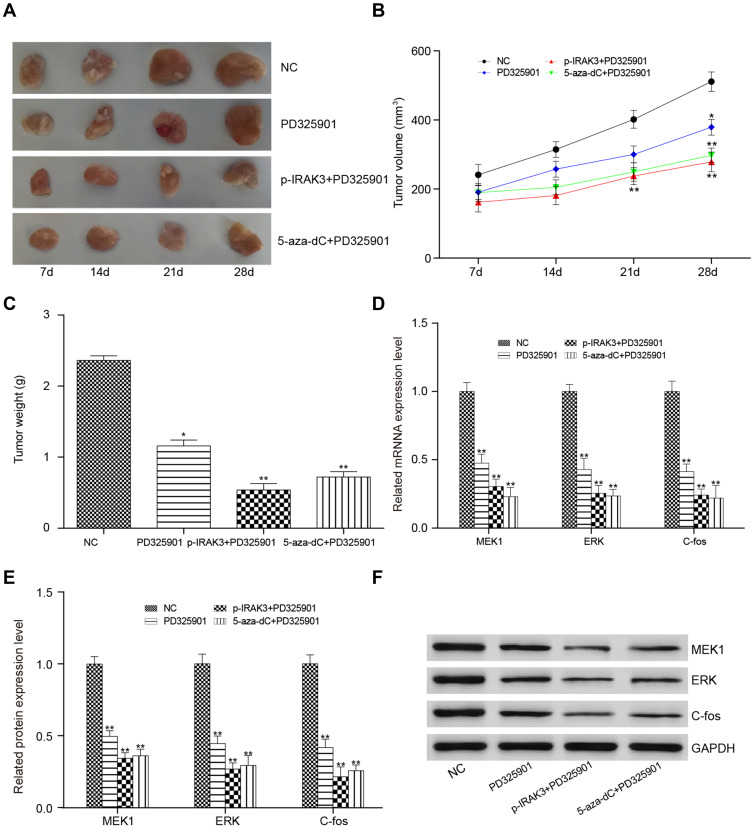
Finally, whether MAPK signaling pathway suppression alone or combined with the overexpression or demethylation of the IRAK3 had a suppressive effect on glioma in vivo was studied. After transplanting glioma U251 cells treated with PD325901, pcDNA3.1-IRAK3 + PD325901, or 5-aza-dC + PD325901, the tumorigenesis significantly decreased compared with that in the control group mice (Figure 10A–C). Finally, mRNA and protein expression levels of the MAPK signaling pathway-related genes in xenograft glioma were detected; they were found to be significantly decreased in the PD325901, pcDNA3.1-IRAK3 + PD325901, or 5-aza-dC + PD325901 group (Figure 10D–F).
Figure 10.
Effect on mice after treatment with the MAPK signaling pathway inhibitor PD325901, pcDNA3.1-IRAK3, and 5-aza-dC. (A) The tumor in the transplantation PD325901, p- IRAK3 + PD325901, and 5-aza-dC + PD325901 treatment groups after 7, 14, 21, and 28 days. (B) The tumor volume was smaller in the PD325901, pcDNA3.1-IRAK3+PD325901, and 5-aza-dC+PD325901 groups compared with the control group. (C) The tumor weight followed the same trend as the volume. (D) The expression level of the IRAK3 was lower in the transplantation PD325901, pcDNA3.1-IRAK3 + PD325901, and 5-aza-dC + PD325901 treatment groups compared with the transplantation control group. (E and F) The protein expression level of IRAK3 was lower in the transplantation PD325901, pcDNA3.1-IRAK3 + PD325901, and 5-aza-dC + PD325901 treatment groups than in the transplantation control group. All the mentioned differences were significant (*P < 0.05, **P < 0.01).
Discussion
According to the World Health Organization, the overall survival of patients with cancer has increased significantly over the years with the improvement in diagnosis and treatment. However, glioma is still a highly fatal disease.1 Therefore, this study aimed to elucidate the detail of its progression mechanisms and search for new therapeutic strategies. One recent study reported that the use of MGMT promoter methylation test in hospitals had a strong influence on the prognosis of glioma,17 suggesting a significant clinical application prospect of DNA epigenetic regulation. Hence, the main focus of the present study was on the relationship between DNA methylation and glioma IRAK3.
IRAK3 belongs to the IL receptor-associated kinase (IRAK) family involved in inhibiting Toll-like receptor signaling by changing the activity of other members of the IRAK family to decrease inflammatory response.18,19 Increasing evidence supported that the expression of IRAK3 in tumor-associated macrophages led to compromised immune surveillance of cancer cells when it profitably prevented excessive inflammation contributing to cancer development. Therefore, the growth of transplantable cancer cells could be inhibited by enhancing host immune responses in IRAK3-deficient mice.20 A small number of studies showed that tumor cell-intrinsic IRAK3 could also support the progression of tumor cells in colorectal and lung cancers depending on the dysfunctional innate immune system indirectly. Interestingly, the expression of IRAK-M in colorectal and lung cancers correlated with poor prognosis in patients with these cancers.21,22 However, little is known about the molecular mechanism of the IRAK3 in glioma. This study revealed the downregulation of IRAK3 glioma tissues and cells through DNA methylation analysis, which seemed to be contrary to the previous findings on other cancers. This study investigated whether a special signaling pathway existed that connected IRAK3 and glioma progression.
An ongoing study has validated that all members of the IRAK family mediate the activation of MAPK and nuclear factor-κB (NF-κB) signaling pathways.23 Meanwhile, IRAK3, a general negative regulator, was confirmed to inhibit MAPK and NF-κB activation.24,25 Likewise, these results identified that the MAPK signaling pathway was highly activated in glioma, and its related gene expression level was downregulated after overexpression of the IRAK3. In fact, upstream genomic events and/or different extracellular stimuli could activate the MAPK signaling pathway mediating a wide range of cellular processes.26 The activation of the MAPK signaling pathway often led to abnormal cell growth and tumorigenesis. The predominant effect relied on the signal intensity and the context or tissue in which the signal occurred.27,28 Zhang et al revealed that aberrant DNA methylation in the promoters of MMP/TIMP axis genes upregulated the MAPK signaling pathway, promoting the progression of tumor cells. Correction of the abnormal DNA epigenotypes attenuated the migration and invasion of tumor cells in vitro and reduced tumorigenicity in vivo.29 Intriguingly, these results were consistent with those of the present study.
Considering the reverse expression pattern of IRAK3 between glioma and other cancers,21,22 different epigenetic modification was regarded as the major reason causing this distinction. In many cancers, the DNA methylation patterns became aberrant with tissue specificity, serving as diagnostic markers and therapeutic targets.30–32 Hence, based on the lower expression and the tumorigenic function of the IRAK3 in glioma, its epigenetic mechanism in the hypermethylation of the IRAK3 might be proposed as a therapeutic target for patients with glioma. Similar to this study, the demethylation of the IRAK3 suppressed the growth of glioma cells by DNA methyltransferase inhibitor treatment. However, multiple challenges still exist that require more researches for translating the advances of epigenetic drugs to the clinic, and one of the unresolved issues is target specificity. Broad-spectrum DNA methyltransferase inhibitor might lead to unintentional off-target effects of specific methylation on some genes required in normal cellsIRAK3.33,34 The combination treatment with other cancer treatment drugs was expected to reduce the side-effects of epigenetic drugs.35,36 MAPK signaling pathway/MEK inhibitor PD325901 is considered a potent, selective small-molecule agent demonstrating antitumor activity in preclinical models of many cancers.37–40 The experiment using the combination of DNA methyltransferase inhibitor (5-aza-dC) and PD325901 was conducted to finger out the underlying clinical value of the demethylation of the IRAK3 in glioma, revealing that 5-aza-dC increased the inhibition of glioma in vitro and in vivo by PD325901.
Undoubtedly, a number of important questions still need further exploration. First, the methylation level of the IRAK3 in a certain subtype of gliomas or other cancers is poorly understood. Whether the hypermethylation of IRAK3 might serve as a biomarker for clinical diagnosis needs to be determined. Second, previous studies always focused on the relationship among IRAK3, innate immune system, and microenvironment in other cancers where IRAK3 was upregulated rather than downregulated.21,22 Further studies should determine whether the immunological microenvironment in glioma tissues is different from other cancer tissues, which leads to IRAK3 downregulation.
Conclusions
In conclusion, this study demonstrated an epigenetic regulation of IRAK3 in glioma and revealed that the downregulation of IRAK3 affected the MAPK signaling pathway and therefore influenced the glioma proliferation, apoptosis rate, migration, and invasion abilities. Together, IRAK3 represented a potentiality for the development of targeted therapeutic strategies in the future.
Acknowledgment
We thank Sangon Biotech, Shanghai, China for their technique supports.
Disclosure
The authors report no conflicts of interest for this work.
References
- 1.Ostrom QT, Gittleman H, Farah P, et al. CBTRUS statistical report: primary brain and central nervous system tumors diagnosed in the United States in 2006–2010. Neuro Oncol. 2013;15(Suppl 2):ii1–ii56. doi: 10.1093/neuonc/not151 [DOI] [PMC free article] [PubMed] [Google Scholar]
- 2.Tykocki T, Eltayeb M. Ten-year survival in glioblastoma. A systematic review. J Clin neurosci. 2018;54:7–13. doi: 10.1016/j.jocn.2018.05.002 [DOI] [PubMed] [Google Scholar]
- 3.Reifenberger G, Weber RG, Riehmer V, et al. Molecular characterization of long-term survivors of glioblastoma using genome- and transcriptome-wide profiling. Int J Cancer. 2014;135(8):1822–1831. doi: 10.1002/ijc.28836 [DOI] [PubMed] [Google Scholar]
- 4.Wick W, Osswald M, Wick A, et al. Treatment of glioblastoma in adults. Ther Adv Neurol Disord. 2018;11:1756286418790452. doi: 10.1177/1756286418790452 [DOI] [PMC free article] [PubMed] [Google Scholar]
- 5.Li E, Zhang Y. DNA methylation in mammals. Cold Spring Harb Perspect Biol. 2014;6(5):a019133. doi: 10.1101/cshperspect.a019133 [DOI] [PMC free article] [PubMed] [Google Scholar]
- 6.Marzese DM, Hoon DS. Emerging technologies for studying DNA methylation for the molecular diagnosis of cancer. Expert Rev Mol Diagn. 2015;15(5):647–664. doi: 10.1586/14737159.2015.1027194 [DOI] [PMC free article] [PubMed] [Google Scholar]
- 7.Tahara T, Arisawa T. DNA methylation as a molecular biomarker in gastric cancer. Epigenomics. 2015;7(3):475–486. doi: 10.2217/epi.15.4 [DOI] [PubMed] [Google Scholar]
- 8.Li Y, Song L, Gong Y, et al. Detection of colorectal cancer by DNA methylation biomarker SEPT9: past, present and future. Biomark Med. 2014;8(5):755–769. doi: 10.2217/bmm.14.8 [DOI] [PubMed] [Google Scholar]
- 9.Noushmehr H, Weisenberger DJ, Diefes K, et al. Identification of a CpG island methylator phenotype that defines a distinct subgroup of glioma. Cancer Cell. 2010;17(5):510–522. doi: 10.1016/j.ccr.2010.03.017 [DOI] [PMC free article] [PubMed] [Google Scholar]
- 10.Kloosterhof NK, de Rooi JJ, Kros M, et al. Molecular subtypes of glioma identified by genome-wide methylation profiling. Genes Chromosomes Cancer. 2013;52(7):665–674. doi: 10.1002/gcc.22062 [DOI] [PubMed] [Google Scholar]
- 11.D’Angelo G, Di Rienzo T, Ojetti V. Microarray analysis in gastric cancer: a review. World J Gastroenterol. 2014;20(34):11972–11976. doi: 10.3748/wjg.v20.i34.11972 [DOI] [PMC free article] [PubMed] [Google Scholar]
- 12.Bibikova M, Le J, Barnes B, et al. Genome-wide DNA methylation profiling using Infinium® assay. Epigenomics. 2009;1(1):177–200. doi: 10.2217/epi.09.14 [DOI] [PubMed] [Google Scholar]
- 13.Yim JH, Choi AH, Li AX, et al. Identification of tissue-specific DNA methylation signatures for thyroid nodule diagnostics. Clin Cancer Res. 2019;25(2):544–551. doi: 10.1158/1078-0432.CCR-18-0841 [DOI] [PMC free article] [PubMed] [Google Scholar]
- 14.Wang X, Shang W, Chang Y, et al. Methylation signature genes identification of the lung squamous cell carcinoma occurrence and recognition research. J Comput Biol. 2018;25(10):1161–1169. doi: 10.1089/cmb.2018.0069 [DOI] [PubMed] [Google Scholar]
- 15.Sun X-J, Wang M-C, Zhang F-H, et al. An integrated analysis of genome-wide DNA methylation and gene expression data in hepatocellular carcinoma. FEBS Open Bio. 2018;8(7):1093–1103. doi: 10.1002/2211-5463.12433 [DOI] [PMC free article] [PubMed] [Google Scholar]
- 16.Aref-Eshghi E, Schenkel LC, Ainsworth P, et al. Genomic DNA methylation-derived algorithm enables accurate detection of malignant prostate tissues. Front Oncol. 2018;8:100. doi: 10.3389/fonc.2018.00100 [DOI] [PMC free article] [PubMed] [Google Scholar]
- 17.Lee A, Youssef I, Osborn VW, et al. The utilization of MGMT promoter methylation testing in United States hospitals for glioblastoma and its impact on prognosis. J Clin Neurosci. 2018;51:85–90. doi: 10.1016/j.jocn.2018.02.009 [DOI] [PubMed] [Google Scholar]
- 18.Kobayashi K, Hernandez LD, Galán JE, et al. IRAK-M is a negative regulator of toll-like receptor signaling. Cell. 2002;110(2):191–202. doi: 10.1016/S0092-8674(02)00827-9 [DOI] [PubMed] [Google Scholar]
- 19.Flannery S, Bowie AG. The interleukin-1 receptor-associated kinases: critical regulators of innate immune signalling. Biochem Pharmacol. 2010;80(12):1981–1991. doi: 10.1016/j.bcp.2010.06.020 [DOI] [PubMed] [Google Scholar]
- 20.Xie Q, Gan L, Wang J, et al. Loss of the innate immunity negative regulator IRAK-M leads to enhanced host immune defense against tumor growth. Mol Immunol. 2007;44(14):3453–3461. doi: 10.1016/j.molimm.2007.03.018 [DOI] [PMC free article] [PubMed] [Google Scholar]
- 21.Kesselring R, Glaesner J, Hiergeist A, et al. IRAK-M expression in tumor cells supports colorectal cancer progression through reduction of antimicrobial defense and stabilization of STAT3. Cancer Cell. 2016;29(5):684–696. doi: 10.1016/j.ccell.2016.03.014 [DOI] [PubMed] [Google Scholar]
- 22.Standiford TJ, Kuick R, Bhan U, et al. TGF-β-induced IRAK-M expression in tumor-associated macrophages regulates lung tumor growth. Oncogene. 2011;30(21):2475–2484. doi: 10.1038/onc.2010.619 [DOI] [PMC free article] [PubMed] [Google Scholar]
- 23.Janssens S, Beyaert R. Functional diversity and regulation of different interleukin-1 receptor-associated kinase (IRAK) family members. Mol Cell. 2003;11(2):293–302. doi: 10.1016/S1097-2765(03)00053-4 [DOI] [PubMed] [Google Scholar]
- 24.Sung N-Y, Yang M-S, Song D-S, et al. Procyanidin dimer B2-mediated IRAK-M induction negatively regulates TLR4 signaling in macrophages. Biochem Biophys Res Commun. 2013;438(1):122–128. doi: 10.1016/j.bbrc.2013.07.038 [DOI] [PubMed] [Google Scholar]
- 25.Shibolet O, Podolsky DK. TLRs in the Gut.IV. Negative regulation of toll-like receptors and intestinal homeostasis: addition by subtraction. Am J Physiol Gastrointest Liver Physiol. 2007;292(6):G1469–G1473. doi: 10.1152/ajpgi.00531.2006 [DOI] [PubMed] [Google Scholar]
- 26.Yang S-H, Sharrocks AD, Whitmarsh AJ. MAP kinase signalling cascades and transcriptional regulation. Gene. 2013;513(1):1–13. doi: 10.1016/j.gene.2012.10.033 [DOI] [PubMed] [Google Scholar]
- 27.Whelan JT, Hollis SE, Cha DS, et al. Post-transcriptional regulation of the Ras-ERK/MAPK signaling pathway. J Cell Physiol. 2012;227(3):1235–1241. doi: 10.1002/jcp.22899 [DOI] [PubMed] [Google Scholar]
- 28.Burotto M, Chiou VL, Lee J-M, et al. The MAPK pathway across different malignancies: a new perspective. Cancer. 2014;120(22):3446–3456. doi: 10.1002/cncr.28864 [DOI] [PMC free article] [PubMed] [Google Scholar]
- 29.Zhang S, Zhong B, Chen M, et al. Epigenetic reprogramming reverses the malignant epigenotype of the MMP/TIMP axis genes in tumor cells. Int J Cancer. 2014;134(7):1583–1594. doi: 10.1002/ijc.28487 [DOI] [PubMed] [Google Scholar]
- 30.Okugawa Y, Grady WM, Goel A. Epigenetic alterations in colorectal cancer: emerging biomarkers. Gastroenterology. 2015;149(5):1204–1225 e12. doi: 10.1053/j.gastro.2015.07.011 [DOI] [PMC free article] [PubMed] [Google Scholar]
- 31.Costa-Pinheiro P, Montezuma D, Henrique R, et al. Diagnostic and prognostic epigenetic biomarkers in cancer. Epigenomics. 2015;7(6):1003–1015. doi: 10.2217/epi.15.56 [DOI] [PubMed] [Google Scholar]
- 32.Walter RFH, Rozynek P, Casjens S, et al. Methylation of L1RE1, RARB, and RASSF1 function as possible biomarkers for the differential diagnosis of lung cancer. PLoS One. 2018;13(5):e0195716. doi: 10.1371/journal.pone.0195716 [DOI] [PMC free article] [PubMed] [Google Scholar]
- 33.Maleszewska M, Kaminska B. Deregulation of histone-modifying enzymes and chromatin structure modifiers contributes to glioma development. Future Oncol. 2015;11(18):2587–2601. doi: 10.2217/fon.15.171 [DOI] [PubMed] [Google Scholar]
- 34.Nebbioso A, Tambaro FP, Dell’Aversana C, et al. Cancer epigenetics: moving forward. PLoS Genet. 2018;14(6):e1007362. doi: 10.1371/journal.pgen.1007362 [DOI] [PMC free article] [PubMed] [Google Scholar]
- 35.Zahnow CA, Topper M, Stone M, et al. Inhibitors of DNA methylation, histone deacetylation, and histone demethylation: a perfect combination for cancer therapy. Adv Cancer Res. 2016;130:55–111. [DOI] [PubMed] [Google Scholar]
- 36.Liu M, Zhang L, Li H, et al. Integrative epigenetic analysis reveals therapeutic targets to the DNA methyltransferase inhibitor guadecitabine (SGI-110) in hepatocellular carcinoma. Hepatology. 2018;68(4):1412–1428. doi: 10.1002/hep.30091 [DOI] [PMC free article] [PubMed] [Google Scholar]
- 37.Wainberg ZA, Alsina M, Soares HP, et al. A Multi-Arm Phase I Study of the PI3K/mTOR inhibitors PF-04691502 and gedatolisib (PF-05212384) plus Irinotecan or the MEK inhibitor PD-0325901 in advanced cancer. Target Oncol. 2017;12(6):775–785. doi: 10.1007/s11523-017-0530-5 [DOI] [PMC free article] [PubMed] [Google Scholar]
- 38.Jousma E, Rizvi TA, Wu J, et al. Preclinical assessments of the MEK inhibitor PD-0325901 in a mouse model of neurofibromatosis type 1. Pediatr Blood Cancer. 2015;62(10):1709–1716. doi: 10.1002/pbc.25546 [DOI] [PMC free article] [PubMed] [Google Scholar]
- 39.Bian Y, Han J, Kannabiran V, et al. MEK inhibitor PD-0325901 overcomes resistance to CK2 inhibitor CX-4945 and exhibits anti-tumor activity in head and neck cancer. Int J Biol Sci. 2015;11(4):411–422. doi: 10.7150/ijbs.10745 [DOI] [PMC free article] [PubMed] [Google Scholar]
- 40.Boasberg PD, Redfern CH, Daniels GA, et al. Pilot study of PD-0325901 in previously treated patients with advanced melanoma, breast cancer, and colon cancer. Cancer Chemother Pharmacol. 2011;68(2):547–552. doi: 10.1007/s00280-011-1620-1 [DOI] [PubMed] [Google Scholar]


