

Abstract
Purpose
To employ quantitative fundus autofluorescence (qAF) imaging in rhesus macaques to noninvasively assess retinal pigment epithelial (RPE) lipofuscin in nonhuman primates (NHPs) as a model of aging and age-related macular degeneration (AMD).
Methods
The qAF imaging was performed on eyes of 26 rhesus macaques (mean age 18.8 ± 8.2 years, range 4–27 years) with normal-appearing fundus or with age-related soft drusen using a confocal scanning laser ophthalmoscope with 488 nm excitation and an internal fluorescence reference. Eyes with soft drusen also underwent spectral-domain optical coherence tomography imaging to measure drusen volume and height of individual drusen lesions. The qAF levels were measured from the perifoveal annular ring (quantitative autofluorescence 8 [qAF8]) using the Delori grid, as well as focally over individual drusen lesions in this region. The association between qAF levels and age, sex, and drusen presence and volume were determined using multivariable regression analysis.
Results
Mean qAF levels increased with age (P < 0.001) and were higher in females (P = 0.047). Eyes with soft drusen exhibited reduced mean qAF compared with age-matched normal eyes (P = 0.003), with greater drusen volume showing a trend toward decreased qAF levels. However, qAF levels are focally increased over most individual drusen (P < 0.001), with larger drusen appearing more hyperautofluorescent (R2 = 0.391, P < 0.001).
Conclusions
In rhesus macaques, qAF levels are increased with age and female sex, but decreased in eyes with soft drusen, similar to human AMD. However, drusen lesions appear hyperautofluorescent unlike those in humans, suggesting similarities and differences in RPE lipofuscin between humans and NHPs that may provide insight into drusen biogenesis and AMD pathogenesis.
Keywords: autofluorescence, fundus autofluorescence, lipofuscin, primate, macaque, rhesus macaque, maculopathy, age-related macular degeneration, AMD
Diseases of the macula, such as age-related macular degeneration (AMD) and diabetic macular edema, are leading causes of visual impairment in developed countries.1 Animal models of macular conditions can further detail the mechanisms of their pathogenesis and reveal new insights into developing novel interventions. Nonhuman primates (NHPs) are a compelling animal model for studying macular diseases as they are the only mammals beside humans to possess a true macula. NHPs, such as rhesus macaques, exhibit some forms of inherited retinal degenerations,2–4 and spontaneously develop age-related soft drusen similar to those in human AMD.5–8 Soft drusen are subretinal deposits that form between the retinal pigment epithelium (RPE) and basal lamina, appearing clinically as yellow-white elevations with indistinct borders ranging from 30 to 1000 µm.9 Preclinical testing in NHPs can accelerate the translation of novel interventions to human trials, including pharmacologic agents or gene therapies.10–13 However, developing therapies for non-neovascular AMD and other age-related maculopathies for which no treatments currently exists require disease biomarkers or endpoints to demonstrate efficacy, preferably through means that are noninvasive and nonterminal, such as live ocular imaging technologies.
Quantitative fundus autofluorescence (qAF) is an imaging modality that has the potential to monitor changes in the RPE.14–16 Lipofuscin accumulates in the RPE,17 and its well-characterized fluorophore, A2E, exhibits a unique autofluorescence (AF) signal with the commonly used 488-nm blue laser excitation stimulus. By comparing to an internal reference fluorescence standard in the device, qAF imaging allow repeatable, quantitative measurements of fundus AF for an eye, which can be followed over time to assess changes from interventions or disease progression.15 In humans, normative values for qAF intensities have been established for healthy eyes,18–20 and increases with age until 75 to 80 years, then appears to decrease.21 Changes in qAF have also been shown in disease states, including early to late AMD;22,23 macular dystrophies, such as Stargardt disease,24 Best disease,25 bull's eye maculopathies,26 and pseudoxanthoma elasticum;27 as well as retinitis pigmentosa.28,29 Because qAF may serve as a measure of macular disease status or response to therapies, we sought to study qAF signals over the lifespan of adult rhesus macaques and in eyes with age-related soft drusen.
Methods
Study Animals
Rhesus macaques (Macaca mulatta) of different ages underwent complete ophthalmic examinations as part of a study to identify animals with ophthalmic abnormalities at the California National Primate Research Center (CNPRC). Animals with healthy eyes and aged animals with drusenoid lesions were included in this study, whereas those with any other ophthalmic abnormalities or underwent any systemic or surgical interventions were excluded. Study protocols at CNPRC followed guidelines of the Association for Research in Vision and Ophthalmology (ARVO) Statement for the Use of Animals in Ophthalmic and Vision Research, complied with National Institutes of Health (NIH) guide for the Care and Use of Laboratory Animals, and were approved by the University of California, Davis Institutional Animal Care and Use Committee. Macaques were sedated with intramuscular injection of ketamine, midazolam, and dexmedetomidine. Mydriasis was achieved with tropicamide (Bausch and Lomb, Tampa, FL, USA) and phenylephrine (Paragon Biosciences, Northbrook, IL, USA), and cycloplegia was achieved with cyclopentolate (Akorn, Lake Forest, IL, USA). All macaques underwent a comprehensive eye examination including portable slit lamp examination, indirect ophthalmoscopy, rebound tonometry (TonoVet; Icare, Vantaa, Finland), A-scan biometry (Sonomed 300A+ PacScan Plus A-Scan; Carleton Optical, Buckinghamshire, UK), and external anterior segment photography (Rebel T3; Canon, Tokyo, Japan). Fundus imaging included color fundus photography (Figs. 1A, 1B) (CF-1; Canon, Tokyo Japan), spectral-domain optical coherence tomography (SD-OCT) (Figs. 1C, 1D), qualitative fundus AF, and qAF imaging (Figs. 1E–1H) using the Spectralis HRA+OCT device (Heidelberg Engineering, Heidelberg, Germany) with a modified chin-rest to accommodate the facial contour of macaques. An artificial tear solution (GenTeal; Alcon, Geneva, Switzerland) was used to maintain the ocular surface during entirety of imaging. Ophthalmic and general health of the animals were reviewed.
Figure 1.

Multimodal imaging with qAF in rhesus macaques. (A–B) Color fundus photographs, (C–D) SD-OCT, (E–F) blue-peak qAF, and (G–H) qAF measurements of rhesus macaque eyes with normal fundus (A,C,E,G) or age-related soft drusen (B,D,F,H). Soft drusen appear as dome-shaped deposits between the RPE and Bruch's membrane (arrow) on SD-OCT. The dashed yellow lines in (E) and (F) represent the location of the SD-OCT images depicted in panels (C) and (D), respectively. For qAF8 measurements, the selected eight middle segments of the Delori grid pattern are labeled as: (1) temporal, (2) superotemporal, (3) superior, (4) superonasal, (5) nasal, (6) inferonasal, (7) inferior, and (8) inferotemporal octants. Vessels are automatically segmented and excluded, and qAF measurements were normalized to the internal standard shown at the top of panels (G) and (H). The color-coded scale is based on qAF units. Scale bars = 500 µm.
Ophthalmic Imaging
Animals underwent confocal scanning laser ophthalmoscopy and SD-OCT in near-infrared reflectance mode (820 nm) using the Spectralis HRA+OCT system (Heidelberg Engineering). SD-OCT images were captured as 20° x 20° volume scans consisting of 193 horizontal raster B-scans and 1024 A-scans per B-scan, centered on the fovea, in high-resolution mode with 25 scans averaged for each B-scan using the Heidelberg eye tracking Automatic Real-Time software. Then the device was turned to qAF mode to capture 30° x 30° qAF images with excitation light of 488 nm and a long-pass barrier filter transmitting between 500 and 680 nm, calibrated with an internal master fluorescent reference.19 Photobleaching was performed once before qAF imaging by exposing the retina to 488-nm blue excitation light for 30 seconds. The qAF images were captured from the central macula, with intensity adjusted using an internal fluorescence reference to enable quantification of AF and normalizing AF units given minor variations in laser power and detector sensitivity in-between imaging sessions, with sensitivity kept at 90% for each imaging session. The variations in axial length and loss of light through ocular medium were accounted for by adjusting the age at the time the animal was imaged. The details of qAF imaging methodology have been described previously.14,18
The qAF8 Measurements
In each eye, three series of 12 successive images were acquired in rapid succession with the animal under sedation. The mean image of each of the three sequences was computed using Heidelberg's proprietary qAF module. These image sets were then graded independently by two readers (KL and TT) who were masked to the identity of each animal. Image quality was determined qualitatively by both graders, with discrepancies reconciled by open arbitration, and images deemed uninterpretable excluded from analyses. The qAF values were acquired via fitting the Delori grid pattern centered at the fovea with the largest extant of the grid tangential to the optic disc margin as described by Delori et al.14 to measure mean gray levels (GLs) of the fundus as compared with the reference. The method accounts for factors that may vary marginally from session-to-session, including laser off-set, laser power, and detector sensitivity. Retina vessels were automatically segmented from the areas selected and excluded from analysis. The mean qAF8 value for each image was computed as the average of the eight perifoveal middle segments of the Delori grid placed over qAF maps (Figs. 1G, 1H). Color-coded qAF maps demonstrate the Delori grid overlay, with vessels automatically segmented and excluded from analysis, and qAF measurements normalized to the internal standard at the top of Figures 1G and 1H. Black is an absence of qAF, light blue/teal is approximately 250 to 350 qAF units for the average in healthy humans,18 and white is the theoretical maximal at 1200 qAF units although pathological states in humans reach approximately 800 to 900 qAF units.30 The final mean qAF8 value was the arithmetic mean of up to three mean images per eye and averaged between the two independent graders.
Focal qAF Measurements
For measuring focal qAF levels over individual drusen, we exported AF images into ImageJ version 1.52p (National Institutes of Health, Bethesda, MD, USA) to measure the gray values at the apex of lesions located within the perifoveal middle ring of the Delori grid corresponding to the qAF8 area, then normalized to the reference similar to methods previously described.31 Briefly, individual drusen lesions were identified and labeled manually from SD-OCT images by another masked grader (YW), and gray values were measured at each point above drusen lesions in the perifoveal ring, as well as the standard reference for that image by a second grader (YS). Focal qAF levels were calculated using the equation described by Delori et al.14 The zero signal GL0, which is a measurement of base GL by the detector, was set to 12 to reflect mean GLs in standard darkroom imaging conditions. The reference calibration factor was set to 231 for the Spectralis imaging device. The scaling factor was adjusted based on average age-dependent axial lengths and corneal curvatures.32 Finally, the transmission of ocular media was adjusted based on age of the macaque using a 3:1 age ratio for rhesus macaques to humans.33
Drusen Volume and Height Measurements
Soft drusen in macaques were identified from funduscopy and confirmed on SD-OCT as dome-shaped sub-RPE mounds as previously reported (Fig. 1D).7 Drusen volumes were measured from SD-OCT images across the central 5-mm circular regions centered on the fovea, using the Duke Optical Coherence Tomography Retinal Analysis Program (DOCTRAP, version 62.0, Duke University, Durham, NC, USA) employed in previous human and NHP studies.34–40 Briefly, segmentation boundaries along the RPE and Bruch's membrane were automatically determined from every horizontal B-scan using DOCTRAP, followed by manual refinement by a masked grader (YW). Individual drusen lesions were identified and labeled as described earlier. Abnormal thickening of the RPE-drusen complex more than two standard deviations greater than mean age-matched normative data (16.5 + 2.7 µm) as reported7 were used to generate drusen maps and measure drusen heights and volume.41
Immunohistochemistry
Immunohistochemistry was performed on rhesus macaque eyes as described previously.13 Briefly, eyes were fixed with 4% paraformaldehyde (PFA) on necropsy, and anterior segments, lens, and vitreous were dissected out within 30 minutes of collection. The remaining posterior eye cups were fixed with 4% PFA for 2 hours at room temperature and washed with phosphate buffered saline (PBS) 4 times for 15 minutes. Followed by cryoprotection with 30% sucrose overnight at 4°C, tissues were embedded in optimal cutting temperature compound and cryosectioned at 18-µm thickness. Consecutive sections enabled comparison of native AF with fluorescence immunolabeling using anti-C5b9 antibody (ab55811; Abcam, Cambridge, MA, USA) to label druse contents, and anti-RPE65 antibody (mab5428; Millipore, Burlington, MA, USA) to label RPE cells. For AF detection, the section was mounted with mounting media after washing with PBS 3 times for 5 minutes. For immunohistochemistry, sections were blocked with 10% normal donkey serum for 30 minutes, then incubated in primary antibody for 1 to 2 hours at room temperature, followed by detection with Alexa Fluor-conjugated secondary antibodies (Thermo Fisher Scientific, Waltham, MA, USA). Images were captured using a confocal microscope (FV1000; Olympus America, San Jose, CA, USA).
Statistics
The mean qAF8 was transformed to logarithmic scale for multivariable regression analysis. A two-level hierarchical generalized linear model (primary unit of analysis was an eye, secondary was the animal) was fitted with log of qAF8 serving as the dependent variable, and demographic (age, sex) and ocular findings (no lesion, punctate lesions, soft drusen) as independent factors. Interocular agreement coefficient was calculated using the Bland-Altman method for differences (log [qAF right eye] – log [qAF left eye]). Intersession repeatability was calculated as (10CR – 1)*100% where the coefficient of repeatability (CR) was calculated as + 1.96 * [log (qAF81) – log (qAF82)]. Three calculations were made for the combination of three sessions per eye. Intraclass correlation coefficients were used to determine the intergrader reliability.42,43 Data were downloaded and managed in Microsoft Excel (Microsoft Corporation, Redmond, WA, USA); statistical analyses were performed using Stata 16 (Stata Corp, College Station, TX, USA). Significance was set as P value < 0.05.
Results
Study Eyes
Forty-three (43) eyes of 26 animals had qAF images of adequate quality for analysis after excluding eyes with poor image quality or significant lens opacity based on slit lamp examination. The mean age of the animals was 18.8 ± 8.2 years, with 65.4% females (Table). Mean axial length was 19.85 ± 0.67 mm, which trended to long lengths with age as expected (linear regression coefficient, β1 = 0.027, P = 0.062), and was not significantly different between males and females (19.85 ± 0.63 mm vs. 19.84 ± 0.70 mm; P = 0.99). Most control eyes showed no visible lesions on SD-OCT (Figs. 1C, 1E), whereas some eyes exhibited soft drusen as seen on funduscopy and appeared as dome-shaped sub-RPE deposits on SD-OCT (Figs. 1B, 1D).
Table.
Factors Associated with qAF in Adult Rhesus Macaques
| Univariate Regression | Multivariable Regression | |||||||
|---|---|---|---|---|---|---|---|---|
| Variable | n (%) | qAF8* Mean (SD) | Β | 95% CI | P Value | Adjusted Β | 95% CI | P Value |
| Age (per year) | 1.02 | 1.01–1.03 | 0.003 | 1.03 | 1.02–1.04 | <0.001 | ||
| 1–9 years | 8 (18.6%) | 63.6 (22.5) | ||||||
| 10–18 years | 10 (23.3%) | 78.6 (21.1) | ||||||
| 19–28 years | 25 (58.1%) | 100.6 (32.1) | ||||||
| Sex | ||||||||
| Male | 13 (30.2) | 73.8 (28.3) | Reference | Reference | ||||
| Female | 30 (69.8) | 95.0 (31.1) | 1.30 | 1.03–1.64 | 0.029 | 1.25 | 1.01–1.57 | 0.047 |
| Laterality | ||||||||
| Left eye | 24 (55.8) | 84.0 (31.5) | Reference | |||||
| Right eye | 19 (44.2) | 94.4 (31.5) | 1.15 | 0.92–1.47 | 0.229 | |||
| Drusen | ||||||||
| No drusen | 37 (86.0%) | 92.8 (31.6) | Reference | Reference | ||||
| Soft drusen | 6 (14.0%) | 59.8 (16.9) | 0.70 | 0.51–0.95 | 0.021 | 0.68 | 0.47–0.99 | 0.045 |
| Axial length (per mm) | 1.13 | 0.95–1.34 | 0.168 | |||||
The qAF values were transformed to log base 10 for normalization during multilevel regression and the coefficients are retransformed in above models.
CI, confidence interval.
qAF8 in Aging and Eyes with Drusen
Overall, qAF8 values were variable between individual animals, with mean qAF8 of 88.6 ± 31.6 across the study population, and increased with age (P < 0.001; Table) by a factor of 1.03 per year (Fig. 2A). We did not observe an inflection point as seen in older human subjects,44 but female animals showed greater qAF intensity than male counterparts similar to human studies (P = 0.047; Table; Fig. 2B).19 The qAF signal was slightly elevated in the nasal region, but the difference was consistent across the octants (Fig. 2C). Neither eye laterality nor axial length were associated with qAF8 intensity (P = 0.229).
Figure 2.

The qAF in macaques with aging and age-related soft drusen. (A) Scatterplot showing the relationship of qAF8 levels with age, including eyes with soft drusen. The dotted line and shaded region represent the regression line and 95% confidence interval. (B) Box-and-whisker plot comparing qAF8 levels in male and female macaques, with the central line showing the median value, the top and bottom box edges showing the 75th and 25th percentiles, and whiskers marking the 95th and 5th percentiles. (C) Bar graphs comparing mean qAF values of the eight segments of the Delori grid based on location. The error bars represent the 95% confidence interval of the respective means. (D) Box-and-whisker plot comparing age-matched normal eyes and eyes with soft drusen. (E) Scatterplot showing possible association of qAF8 levels with drusen volume. The dotted line and shaded region represent the Deming regression line and 95% prediction interval.
Among geriatric macaques, eyes with soft drusen had decreased qAF8 values after adjusting for age and sex (P = 0.045; Table; Fig. 2A), with an average reduction of 41% compared with age-matched control eyes without drusen (P = 0.003; Fig. 2D). In eyes with soft drusen, greater drusen volume also showed a trend toward lower qAF8 levels but did not reach statistical significance (R2 = 0.572, P = 0.204).
Focal qAF of Soft Drusen Lesions
Although the mean qAF8 values were lower in eyes with drusen, the individual drusen lesions themselves appeared hyperautofluorescent based on focal qAF measurements over drusen lesions compared with the surrounding perifoveal region background (Fig. 3A). The most hyperautofluorescent lesions corresponded in location to the largest drusen measured from SD-OCT (Fig. 3B). Focal qAF levels measured over perifoveal drusen lesions identified from SD-OCT drusen maps (Figs. 3C, 3D) appeared greater than the isoeccentric region of the macula (P < 0.001; Fig. 3E), and were associated with drusen height (R2 = 0.391, P < 0.001; Fig. 3F). On immunohistochemistry of soft drusen from two animals that underwent necropsy, RPE exhibited AF at 488-nm excitation, whereas druse contents did not, suggesting that the AF source was from the RPE rather than drusen deposits themselves (Supplementary Fig. S1).
Figure 3.

Relationship of qAF with soft drusen size in macaques. Representative (A,C) qAF images and (B,D) topographic maps of soft drusen in macaque eyes (n = 6) measured from semiautomatically segmented SD-OCT images, without (A–B) and with (C–D) an overlay of drusen lesion locations (yellow asterisks) to enable comparison of qAF signals with drusen height. (E) Box-and-whisker plot comparing qAF8 levels with qAF levels over drusen, with the central line showing the median value, the top and bottom box edges showing the 75th and 25th percentiles, and whiskers marking the 95th and 5th percentiles. (F) Scatterplot showing the relationship between qAF over drusen with drusen height. The dotted line and shaded area represent the Deming regression line and 95% prediction interval. Scale bars = 500 µm.
Reliability of qAF Measurements
In animals in which both eyes underwent qAF measurements (16 animals and 32 eyes), the interocular agreement coefficient was ± 23.8% of mean qAF8. The intergrader agreement based on intraclass correlation coefficient was excellent at 0.934 for mean qAF8. Intersession repeatability was acceptable with a CR of ± 4.11% qAF units between the first and second session, ± 4.82% between sessions two and three, and ± 4.76 between sessions one and three. Bland-Altman plots show minimal differences between qAF imaging sessions with mean bias values approximating zero (Fig. 4).
Figure 4.
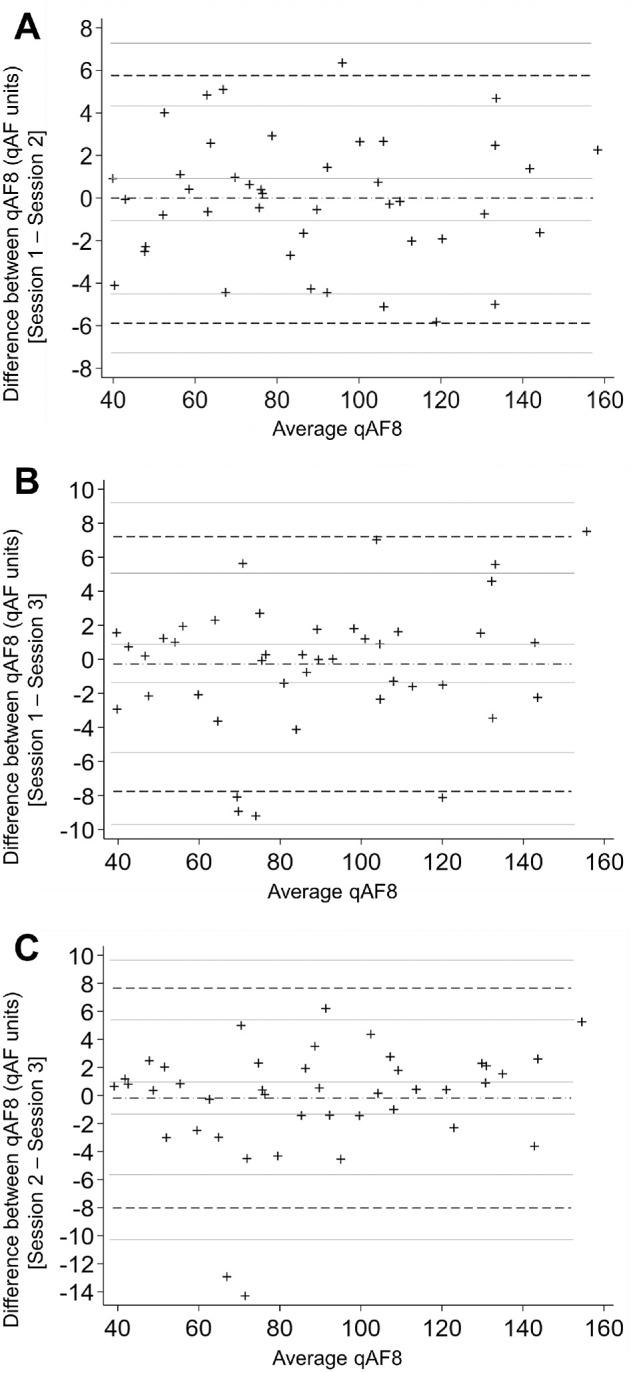
Intersession repeatability of qAF measurements in macaques. Bland-Altman plots of qAF8 measurements; x-axes show the average of qAF8 between the two sessions, and y-axes show the difference in qAF8 between the two sessions. The dashed-dot horizontal line represents mean bias, and dash horizontal lines represent lower limit of agreement (LOA) and upper LOA; the gray lines represent the 95% confidence intervals (CI). (A) Session 1 compared with session 2: mean bias −0.066 (95% CI −0.98, 0.85), lower LOA: −5.88 (95% CI, −7.46, −4.30), upper LOA: 5.75 (4.17, 7.33); (B) session 1 compared with session 3: mean bias −0.27 (95% CI −1.46, 0.92), lower LOA: −7.76 (95% CI, −9.82, −5.70), upper LOA: 7.21 (5.15, 9.27); and (C) session 2 compared with session 3: mean bias −0.18 (95% CI −1.43, 1.06), lower LOA: −8.02 (95% CI, −10.18, −5.86), upper LOA: 7.66 (5.50, 9.81).
Discussion
In this study, we provided normative values for qAF levels in adult rhesus macaques, and found that qAF8 levels increased with age, consistent with qAF studies in humans up to age 75 years, and in macaque eyes measuring gray values from conventional AF images.14,18,19,23,31,44 We also found that female animals had higher qAF8 intensities than males, similar to humans.18,19 Although females may have smaller eyes than males, as in human emmetropes,45 in which the excitation light may be delivered over a smaller area, the qAF protocol used in our system accounts for axial length differences. Also, axial lengths were similar between males and females in our cohort of animals, and axial length showed no association with qAF8 on regression analysis. In macaque eyes with drusen, mean qAF8 levels were reduced compared with age-matched normals, as seen in early and intermediate AMD patients.22,23 Together these results suggest that decreased RPE lipofuscin may be associated with AMD or AMD-like features in both humans and macaques.
Lipofuscin is deposited in the RPE as a metabolic by-product of the visual cycle and accumulates with normal aging. However, the role of lipofuscin as a contributing factor to AMD development and progression has been a subject of controversy.46,47 The qAF appears to increase with age, female sex, and smoking, which are all risk factors associated with AMD.18,19 Accumulation of A2E, a major component of lipofuscin, leads to RPE toxicity.48,49 However, although increased AF has been observed in eyes with exudative AMD and borders of geographic atrophy,50,51 qAF levels are decreased in early and intermediate AMD, particularly in eyes with reticular pseudodrusen—a major risk factor for advanced atrophic AMD.22,23
Interestingly, although focal measurements over individual drusen lesions show variable AF in both macaques7 and humans,52–54 we found that macaque drusen generally appear hyperautofluorescent compared with surrounding areas, with higher focal qAF levels associated with larger drusen. By contrast, human drusen are usually hypoautofluorescent with a surrounding ring of hyperautofluorescence, at least when observed using conventional fundus cameras different from the scanning laser ophthalmoscopy–based AF imaging employed in this study.53 This distinction may be attributed to differences seen on histology showing hypertrophic RPE overlying macaque drusen as compared with RPE atrophy overlying drusen in humans55–57 because we did not detect significant AF signal within drusen contents using similar wavelengths on ex vivo histological sections taken from these animals. Our findings are also consistent with studies using SD-OCT imaging, in which soft drusen in macaques demonstrate homogenous internal reflectivity, whereas those in humans exhibit greater heterogeneity in reflectivity with variable internal substructures.8,58,59 Thus our data suggests both localized and global impact on lipofuscin distribution in eyes with drusen and AMD in primate species. As the pathogenesis of AMD is complex and multifactorial, including oxidative stress,60 lipid accumulation,61,62 immune dysregulation,63,64 and vascular changes,65,66 the role of lipofuscin accumulation among these factors remains unclear. Future biochemical measurements and more robust histological correlations may help further explore the relationship between qAF signal, lipofuscin accumulation, and soft drusen biogenesis in rhesus macaques.
We previously described a distinct phenotype of fine, punctate retinal lesions that are attributed to accumulation of lipid droplets within individual RPE cells in a process known as lipoidal degeneration.7 In longitudinal studies, these punctate lesions did not appear to be precursors to soft drusen or increase the risk for drusen development. In our study, we found a subset of eyes with these punctate lesions, which exhibited similar qAF8 levels to age-matched eyes without fundus findings, and supports our hypothesis that lipoidal degeneration is not related to soft drusen or AMD.8
NHPs are potentially important animal models of AMD because they possess a true macula similar to humans and spontaneously develop soft drusen that has similar components and ultrastructure67 and share similar genetic susceptibility loci.68–70 However, despite reported drusen prevalence of up to 47% in some colonies,5–7,71 macaques do not develop advanced, atrophic AMD, or risk features for atrophy, such as reticular pseudodrusen.7 Factors that may account for this reduced susceptibility in macaques include differences in genetics, diet, environmental exposures, pigmentation, and aging.34 Rhesus monkeys age at an approximate rate of 3:1 compared with humans.72 However, aged macaques in our cohort did not exhibit the decline in qAF intensity seen in human eyes after age 75 to 80 years,9,12,13,17,30 even though we sampled animals near the end of their lifespan. This difference in age-related qAF changes may explain in part the less severe phenotype of age-related maculopathy in macaques compared with human AMD.
It is important to note that although lipofuscin may be the primary fluorophore contributing to the AF signal, qAF intensity is not a direct measure of lipofuscin concentration. Differences in AF signal may arise from stacking of RPE cells,73 or by differential distribution of lipofuscin within individual RPE cells.74 In pathologic conditions, RPE may exhibit different fluorophore compositions, including melanolipofuscin or other phagosomes.75 The qAF signal may also be increased by photooxidation of lipofuscin bisretinoids.11 Aged rhesus monkeys lacking lutein and zeaxanthin in their diet exhibit greater AF, presumably due to increased oxidative stress from reduced blue-light filter and antioxidant properties of these macular xanthophylls.31 The qAF levels may also be attenuated by subretinal deposits, macular xanthophylls, or RPE melanin pigment.17,76 Our study showed that mean qAF8 in macaques was 88.6 ± 31.6, which are significantly lower than human qAF levels that range from 400 in whites, to 290 in blacks, and 260 in Asians as described by Greenberg et al.18 Although these values suggest that the difference in qAF levels between macaques and humans may be related to differences in pigmentation, the association may not be causative. For example, although melanin content in RPE-choroid tissues are 10-fold higher in macaques than humans,77 much of this difference is likely due to differences within choroidal melanocytes,34 and reflected fluorescence from choroidal layers is generally minimal at shorter wavelengths. RPE melanosomes are located apical to lipofuscin granules and may attenuate the AF signal, but does not vary significantly with race or between macaques and humans. Further studies are necessary to better understand the qAF differences between race and primate species.
Conclusions
The current study is limited by a small sample size of animals and limited image quality of some eyes that were excluded from the study. However, our data had a low within-eye CR at ± 5.09% to 5.78% for mean qAF8, which demonstrates greater reliability than human studies that typically range from 9% to 24%.18,19 We also did not account for AF signal attenuation due to nuclear sclerosis or other media opacities,78 although eyes with visible ocular pathology were excluded. Finally, we focused on the perifoveal region for quantifying average qAF8, even though only a portion of the drusen lesions may be in the same region. Future longitudinal studies to spatially correlate qAF signals with drusen evolution over time may provide additional insight into soft drusen pathogenesis in this NHP model of AMD.
Supplementary Material
Acknowledgments
Supported by the California National Primate Research Center pilot grant program and base grant NIH P510D011107. Glenn C. Yiu is supported by NIH K08 EY026101, NIH R21 EY031108, the E. Matilda Ziegler Foundation for the Blind, the Barr Foundation for Retinal Research, ARVO Foundation, and the Macula Society. Ala Moshiri is supported by NIH K08 EY027463, NIH U24 EY029904, and the Barr Foundation for Retinal Research. Sara M. Thomasy is supported by NIH R01 EY016134, NIH U01 ES027288, and NIH U24 EY029904. Tu M. Tran is supported by Fight for Sight SS-19-001. Sina Farsiu is supported in part by the Unrestricted Research to Prevent Blindness Grant to Duke University and the National Institutes of Health Core Grant, P30EY005722. No funding organizations had any role in the design or conduct of this research. The content is solely the responsibility of the authors and does not necessarily represent the official views of the funding agencies. The authors alone are responsible for the content and writing of the article.
Disclosure: T.M. Tran, None; S. Kim, None; K.H. Lin, None; S.H. Chung, None; S. Park, None; Y. Sazhnyev, None; Y. Wang, None; D. Cunefare, None; S. Farsiu, None; S.M. Thomasy, None; A. Moshiri, None; G. Yiu, None
References
- 1. Flaxman SR, Bourne RRA, Resnikoff S, et al.. Global causes of blindness and distance vision impairment 1990-2020: a systematic review and meta-analysis. Lancet Glob Health. 2017; 5: e1221–e1234. [DOI] [PubMed] [Google Scholar]
- 2. Moshiri A, Chen R, Kim S, et al.. A nonhuman primate model of inherited retinal disease. J Clin Invest. 2019; 129: 863–874. [DOI] [PMC free article] [PubMed] [Google Scholar]
- 3. Peterson SM, McGill TJ, Puthussery T, et al.. Bardet-Biedl syndrome in rhesus macaques: a nonhuman primate model of retinitis pigmentosa. Exp Eye Res. 2019; 189: 107825. [DOI] [PMC free article] [PubMed] [Google Scholar]
- 4. McBride JL, Neuringer M, Ferguson B, et al.. Discovery of a CLN7 model of Batten disease in non-human primates. Neurobiol Dis. 2018; 119: 65–78. [DOI] [PMC free article] [PubMed] [Google Scholar]
- 5. Monaco WA, Wormington CM.. The rhesus monkey as an animal model for age-related maculopathy. Optom Vis Sci. 1990; 67: 532–537. [DOI] [PubMed] [Google Scholar]
- 6. Stafford TJ, Anness SH, Fine BS. Spontaneous degenerative maculopathy in the monkey. Ophthalmology. 1984; 91: 513–521. [DOI] [PubMed] [Google Scholar]
- 7. Yiu G, Tieu E, Munevar C, et al.. In vivo multimodal imaging of drusenoid lesions in rhesus macaques. Sci Rep. 2017; 7: 15013. [DOI] [PMC free article] [PubMed] [Google Scholar]
- 8. Yiu G, Chung SH, Mollhoff IN, et al.. Long-term evolution and remodeling of soft drusen in rhesus macaques. Invest Ophthalmol Vis Sci. 2020; 61: 32. [DOI] [PMC free article] [PubMed] [Google Scholar]
- 9. Spaide RF, Curcio CA.. Drusen characterization with multimodal imaging. Retina. 2010; 30: 1441–1454. [DOI] [PMC free article] [PubMed] [Google Scholar]
- 10. Zhao T, Zhang J, Zhang Y, et al.. Vascular endothelial growth factor receptor 2 antibody, BC001, attenuates laser-induced choroidal neovascularization in rhesus monkeys (Macaca mulatta). J Ocul Pharmacol Ther. 2015; 31: 611–616. [DOI] [PubMed] [Google Scholar]
- 11. Todorich B, Yiu G, Hahn P. Current and investigational pharmacotherapeutic approaches for modulating retinal angiogenesis. Expert Rev Clin Pharmacol. 2014; 7: 375–391. [DOI] [PubMed] [Google Scholar]
- 12. Lai CM, Shen WY, Brankov M, et al.. Long-term evaluation of AAV-mediated sFlt-1 gene therapy for ocular neovascularization in mice and monkeys. Mol Ther. 2005; 12: 659–668. [DOI] [PubMed] [Google Scholar]
- 13. Yiu G, Chung SH, Mollhoff IN, et al.. Suprachoroidal and subretinal injections of AAV using transscleral microneedles for retinal gene delivery in nonhuman primates. Mol Ther Methods Clin Dev. 2020; 16: 179–191. [DOI] [PMC free article] [PubMed] [Google Scholar]
- 14. Delori F, Greenberg JP, Woods RL, et al.. Quantitative measurements of autofluorescence with the scanning laser ophthalmoscope. Invest Ophthalmol Vis Sci. 2011; 52: 9379–9390. [DOI] [PMC free article] [PubMed] [Google Scholar]
- 15. Reiter GS, Told R, Baratsits M, et al.. Repeatability and reliability of quantitative fundus autofluorescence imaging in patients with early and intermediate age-related macular degeneration. Acta Ophthalmol. 2019; 97: e526–e532. [DOI] [PubMed] [Google Scholar]
- 16. Allingham MJ, Nie Q, Lad EM, et al.. Semiautomatic segmentation of rim area focal hyperautofluorescence predicts progression of geographic atrophy due to dry age-related macular degeneration. Invest Ophthalmol Vis Sci. 2016; 57: 2283–2289. [DOI] [PMC free article] [PubMed] [Google Scholar]
- 17. Sparrow JR, Yoon KD, Wu Y, Yamamoto K. Interpretations of fundus autofluorescence from studies of the bisretinoids of the retina. Invest Ophthalmol Vis Sci. 2010; 51: 4351–4357. [DOI] [PMC free article] [PubMed] [Google Scholar]
- 18. Greenberg JP, Duncker T, Woods RL, Smith RT, Sparrow JR, Delori FC. Quantitative fundus autofluorescence in healthy eyes. Invest Ophthalmol Vis Sci. 2013; 54: 5684–5693. [DOI] [PMC free article] [PubMed] [Google Scholar]
- 19. Wang Y, Tran T, Firl K, et al.. Quantitative fundus autofluorescence in smokers compared to non-smokers. Exp Eye Res. 2019; 184: 48–55. [DOI] [PubMed] [Google Scholar]
- 20. Eandi CM, Nassisi M, Lavia C, Alovisi C, de Sanctis U. Macular pigment density and quantitative fundus autofluorescence in young healthy subjects. Invest Ophthalmol Vis Sci. 2017; 58: 2284–2290. [DOI] [PubMed] [Google Scholar]
- 21. Ach T, Huisingh C, McGwin G Jr., et al.. Quantitative autofluorescence and cell density maps of the human retinal pigment epithelium. Invest Ophthalmol Vis Sci. 2014; 55: 4832–4841. [DOI] [PMC free article] [PubMed] [Google Scholar]
- 22. Gliem M, Muller PL, Finger RP, McGuinness MB, Holz FG, Charbel Issa P. Quantitative fundus autofluorescence in early and intermediate age-related macular degeneration. JAMA Ophthalmol. 2016; 134: 817–824. [DOI] [PubMed] [Google Scholar]
- 23. Orellana-Rios J, Yokoyama S, Agee JM, et al.. Quantitative fundus autofluorescence in non-neovascular age-related macular degeneration. Ophthalmic Surg Lasers Imaging Retina. 2018; 49: S34–S42. [DOI] [PubMed] [Google Scholar]
- 24. Burke TR, Duncker T, Woods RL, et al.. Quantitative fundus autofluorescence in recessive Stargardt disease. Invest Ophthalmol Vis Sci. 2014; 55: 2841–2852. [DOI] [PMC free article] [PubMed] [Google Scholar]
- 25. Duncker T, Greenberg JP, Ramachandran R, et al.. Quantitative fundus autofluorescence and optical coherence tomography in best vitelliform macular dystrophy. Invest Ophthalmol Vis Sci. 2014; 55: 1471–1482. [DOI] [PMC free article] [PubMed] [Google Scholar]
- 26. Duncker T, Tsang SH, Lee W, et al.. Quantitative fundus autofluorescence distinguishes ABCA4-associated and non-ABCA4-associated bull's-eye maculopathy. Ophthalmology. 2015; 122: 345–355. [DOI] [PMC free article] [PubMed] [Google Scholar]
- 27. Gliem M, Muller PL, Birtel J, et al.. Quantitative fundus autofluorescence in pseudoxanthoma elasticum. Invest Ophthalmol Vis Sci. 2017; 58: 6159–6165. [DOI] [PubMed] [Google Scholar]
- 28. Schuerch K, Woods RL, Lee W, et al.. Quantifying fundus autofluorescence in patients with retinitis pigmentosa. Invest Ophthalmol Vis Sci. 2017; 58: 1843–1855. [DOI] [PMC free article] [PubMed] [Google Scholar]
- 29. Jauregui R, Park KS, Duong JK, Sparrow JR, Tsang SH.. Quantitative comparison of near-infrared versus short-wave autofluorescence imaging in monitoring progression of retinitis pigmentosa. Am J Ophthalmol. 2018; 194: 120–125. [DOI] [PMC free article] [PubMed] [Google Scholar]
- 30. Duncker T, Tsang SH, Woods RL, et al.. Quantitative fundus autofluorescence and optical coherence tomography in PRPH2/RDS- and ABCA4-associated disease exhibiting phenotypic overlap. Invest Ophthalmol Vis Sci. 2015; 56: 3159–3170. [DOI] [PMC free article] [PubMed] [Google Scholar]
- 31. McGill TJ, Renner LM, Neuringer M. Elevated fundus autofluorescence in monkeys deficient in lutein, zeaxanthin, and omega-3 fatty acids. Invest Ophthalmol Vis Sci. 2016; 57: 1361–1369. [DOI] [PMC free article] [PubMed] [Google Scholar]
- 32. Fernandes A, Bradley DV, Tigges M, Tigges J, Herndon JG. Ocular measurements throughout the adult life span of rhesus monkeys. Invest Ophthalmol Vis Sci. 2003; 44: 2373–2380. [DOI] [PubMed] [Google Scholar]
- 33. Davis RT, Leathers CW. Behavior and Pathology of Aging in Rhesus Monkeys. New York: Alan R. Liss, Inc.; 1985. [Google Scholar]
- 34. Yiu G, Vuong VS, Oltjen S, et al.. Effect of uveal melanocytes on choroidal morphology in rhesus macaques and humans on enhanced-depth imaging optical coherence tomography. Invest Ophthalmol Vis Sci. 2016; 57: 5764–5771. [DOI] [PMC free article] [PubMed] [Google Scholar]
- 35. Yiu G, Wang Z, Munevar C, et al.. Comparison of chorioretinal layers in rhesus macaques using spectral-domain optical coherence tomography and high-resolution histological sections. Exp Eye Res. 2018; 168: 69–76. [DOI] [PMC free article] [PubMed] [Google Scholar]
- 36. Yiu G, Vuong VS, Tran S, et al.. Vascular response to sildenafil citrate in aging and age-related macular degeneration. Sci Rep. 2019; 9: 5049. [DOI] [PMC free article] [PubMed] [Google Scholar]
- 37. Willoughby AS, Vuong VS, Cunefare D, et al.. Choroidal changes after suprachoroidal injection of triamcinolone acetonide in eyes with macular edema secondary to retinal vein occlusion. Am J Ophthalmol. 2018; 186: 144–151. [DOI] [PMC free article] [PubMed] [Google Scholar]
- 38. Chiu SJ, Li XT, Nicholas P, Toth CA, Izatt JA, Farsiu S. Automatic segmentation of seven retinal layers in SDOCT images congruent with expert manual segmentation. Optics Express. 2010; 18: 19413–19428. [DOI] [PMC free article] [PubMed] [Google Scholar]
- 39. Lee JY, Chiu SJ, Srinivasan PP, et al.. Fully automatic software for retinal thickness in eyes with diabetic macular edema from images acquired by cirrus and Spectralis systems. Invest Ophthalmol Vis Sci. 2013; 54: 7595–7602. [DOI] [PMC free article] [PubMed] [Google Scholar]
- 40. Smit-McBride Z, Nguyen J, Elliott GW, et al.. Effects of aging and environmental tobacco smoke exposure on ocular and plasma circulatory microRNAs in the rhesus macaque. Mol Vis. 2018; 24: 633–646. [PMC free article] [PubMed] [Google Scholar]
- 41. Folgar FA, Yuan EL, Sevilla MB, et al.. Drusen volume and retinal pigment epithelium abnormal thinning volume predict 2-year progression of age-related macular degeneration. Ophthalmology. 2016; 123: 39–50.e1. [DOI] [PubMed] [Google Scholar]
- 42. Vuong VS, Moisseiev E, Cunefare D, Farsiu S, Moshiri A, Yiu G. Repeatability of choroidal thickness measurements on enhanced depth imaging optical coherence tomography using different posterior boundaries. Am J Ophthalmol. 2016; 169: 104–112. [DOI] [PMC free article] [PubMed] [Google Scholar]
- 43. Wong SS, Vuong VS, Cunefare D, Farsiu S, Moshiri A, Yiu G. Macular fluid reduces reproducibility of choroidal thickness measurements on enhanced depth optical coherence tomography. Am J Ophthalmol. 2017; 184: 108–114. [DOI] [PMC free article] [PubMed] [Google Scholar]
- 44. Armenti S, Bokhour A, Lo D, Smith T.. Quantitative fundus autofluorescence in pseudophakic patients. Invest Ophthalmol Vis Sci. 2015; 56: 2824. [Google Scholar]
- 45. Bhardwaj V, Rajeshbhai GP. Axial length, anterior chamber depth-a study in different age groups and refractive errors. J Clin Diagn Res. 2013; 7: 2211–2212. [DOI] [PMC free article] [PubMed] [Google Scholar]
- 46. Sparrow JR. Quantitative fundus autofluorescence. JAMA Ophthalmol. 2017; 135: 403. [DOI] [PubMed] [Google Scholar]
- 47. Smith RT. Quantitative fundus autofluorescence-reply. JAMA Ophthalmol. 2017; 135: 403–404. [DOI] [PubMed] [Google Scholar]
- 48. Davies S, Elliott MH, Floor E, et al.. Photocytotoxicity of lipofuscin in human retinal pigment epithelial cells. Free Radic Biol Med. 2001; 31: 256–265. [DOI] [PubMed] [Google Scholar]
- 49. Sparrow JR, Nakanishi K, Parish CA. The lipofuscin fluorophore A2E mediates blue light-induced damage to retinal pigmented epithelial cells. Invest Ophthalmol Vis Sci. 2000; 41: 1981–1989. [PubMed] [Google Scholar]
- 50. Holz FG, Bellman C, Staudt S, Schutt F, Volcker HE. Fundus autofluorescence and development of geographic atrophy in age-related macular degeneration. Invest Ophthalmol Vis Sci. 2001; 42: 1051–1056. [PubMed] [Google Scholar]
- 51. Spaide RF. Fundus autofluorescence and age-related macular degeneration. Ophthalmology. 2003; 110: 392–399. [DOI] [PubMed] [Google Scholar]
- 52. von Ruckmann A, Fitzke FW, Bird AC. Fundus autofluorescence in age-related macular disease imaged with a laser scanning ophthalmoscope. Invest Ophthalmol Vis Sci. 1997; 38: 478–486. [PubMed] [Google Scholar]
- 53. Delori FC, Fleckner MR, Goger DG, Weiter JJ, Dorey CK. Autofluorescence distribution associated with drusen in age-related macular degeneration. Invest Ophthalmol Vis Sci. 2000; 41: 496–504. [PubMed] [Google Scholar]
- 54. Lois N, Owens SL, Coco R, Hopkins J, Fitzke FW, Bird AC. Fundus autofluorescence in patients with age-related macular degeneration and high risk of visual loss. Am J Ophthalmol. 2002; 133: 341–349. [DOI] [PubMed] [Google Scholar]
- 55. Curcio CA, Zanzottera EC, Ach T, Balaratnasingam C, Freund KB. Activated retinal pigment epithelium, an optical coherence tomography biomarker for progression in age-related macular degeneration. Invest Ophthalmol Vis Sci. 2017; 58: BIO211–BIO226. [DOI] [PMC free article] [PubMed] [Google Scholar]
- 56. Tan ACS, Pilgrim MG, Fearn S, et al.. Calcified nodules in retinal drusen are associated with disease progression in age-related macular degeneration. Sci Transl Med. 2018; 10: eaat4544. [DOI] [PMC free article] [PubMed] [Google Scholar]
- 57. Zhang Q, Chrenek MA, Bhatia S, et al.. Comparison of histologic findings in age-related macular degeneration with RPE flatmount images. Mol Vis. 2019; 25: 70–78. [PMC free article] [PubMed] [Google Scholar]
- 58. Veerappan M, El-Hage-Sleiman AM, Tai V, et al.. Optical coherence tomography reflective drusen substructures predict progression to geographic atrophy in age-related macular degeneration. Ophthalmology. 2016; 123: 2554–2570. [DOI] [PMC free article] [PubMed] [Google Scholar]
- 59. Sleiman K, Veerappan M, Winter KP, et al.. Optical coherence tomography predictors of risk for progression to non-neovascular atrophic age-related macular degeneration. Ophthalmology. 2017; 124: 1764–1777. [DOI] [PMC free article] [PubMed] [Google Scholar]
- 60. Datta S, Cano M, Ebrahimi K, Wang L, Handa JT. The impact of oxidative stress and inflammation on RPE degeneration in non-neovascular AMD. Prog Retin Eye Res. 2017; 60: 201–218. [DOI] [PMC free article] [PubMed] [Google Scholar]
- 61. Curcio CA. Soft drusen in age-related macular degeneration: biology and targeting via the oil spill strategies. Invest Ophthalmol Vis Sci. 2018; 59: AMD160–AMD181. [DOI] [PMC free article] [PubMed] [Google Scholar]
- 62. Jun S, Datta S, Wang L, Pegany R, Cano M, Handa JT. The impact of lipids, lipid oxidation, and inflammation on AMD, and the potential role of miRNAs on lipid metabolism in the RPE. Exp Eye Res. 2019; 181: 346–355. [DOI] [PMC free article] [PubMed] [Google Scholar]
- 63. Ambati J, Atkinson JP, Gelfand BD. Immunology of age-related macular degeneration. Nat Rev Immunol. 2013; 13: 438–451. [DOI] [PMC free article] [PubMed] [Google Scholar]
- 64. Anderson DH, Radeke MJ, Gallo NB, et al.. The pivotal role of the complement system in aging and age-related macular degeneration: hypothesis re-visited. Prog Retin Eye Res. 2010; 29: 95–112. [DOI] [PMC free article] [PubMed] [Google Scholar]
- 65. Lee SC, Tran S, Amin A, et al.. Retinal vessel density in exudative and nonexudative age-related macular degeneration on optical coherence tomography angiography. Am J Ophthalmol. 2020; 212: 7–16. [DOI] [PMC free article] [PubMed] [Google Scholar]
- 66. Snyder K, Yazdanyar A, Mahajan A, Yiu G. Association between the cilioretinal artery and choroidal neovascularization in age-related macular degeneration: a secondary analysis from the age-related eye disease study. JAMA Ophthalmol. 2018; 136: 1008–1014. [DOI] [PMC free article] [PubMed] [Google Scholar]
- 67. Umeda S, Suzuki MT, Okamoto H, et al.. Molecular composition of drusen and possible involvement of anti-retinal autoimmunity in two different forms of macular degeneration in cynomolgus monkey (Macaca fascicularis). FASEB J. 2005; 19: 1683–1685. [DOI] [PubMed] [Google Scholar]
- 68. Francis PJ, Appukuttan B, Simmons E, et al.. Rhesus monkeys and humans share common susceptibility genes for age-related macular disease. Hum Mol Genet. 2008; 17: 2673–2680. [DOI] [PMC free article] [PubMed] [Google Scholar]
- 69. Singh KK, Krawczak M, Dawson WW, Schmidtke J. Association of HTRA1 and ARMS2 gene variation with drusen formation in rhesus macaques. Exp Eye Res. 2009; 88: 479–482. [DOI] [PubMed] [Google Scholar]
- 70. Pahl L, Spangenberg A, Schubert S, Schonmann U, Schmidtke J, Stuhrmann M. Characterization of the 10q26-orthologue in rhesus monkeys corroborates a functional connection between ARMS2 and HTRA1. Exp Eye Res. 2012; 98: 75–78. [DOI] [PubMed] [Google Scholar]
- 71. Olin KL, Morse LS, Murphy C, et al.. Trace element status and free radical defense in elderly rhesus macaques (Macaca mulatta) with macular drusen. Proc Soc Exp Biol Med. 1995; 208: 370–377. [DOI] [PubMed] [Google Scholar]
- 72. Davis RT, Leathers CW.. Behaviour and Pathology of Aging in Rhesus Monkeys. New York: Alan R. Liss, Inc.; 1985. [Google Scholar]
- 73. Zanzottera EC, Ach T, Huisingh C, Messinger JD, Spaide RF, Curcio CA. Visualizing retinal pigment epithelium phenotypes in the transition to geographic atrophy in age-related macular degeneration. Retina. 2016; 36(suppl 1): S12–S25. [DOI] [PMC free article] [PubMed] [Google Scholar]
- 74. Ach T, Tolstik E, Messinger JD, Zarubina AV, Heintzmann R, Curcio CA. Lipofuscin redistribution and loss accompanied by cytoskeletal stress in retinal pigment epithelium of eyes with age-related macular degeneration. Invest Ophthalmol Vis Sci. 2015; 56: 3242–3252. [DOI] [PMC free article] [PubMed] [Google Scholar]
- 75. Feeney L. Lipofuscin and melanin of human retinal pigment epithelium. Fluorescence, enzyme cytochemical, and ultrastructural studies. Invest Ophthalmol Vis Sci. 1978; 17: 583–600. [PubMed] [Google Scholar]
- 76. Curcio CA, Messinger JD, Sloan KR, McGwin G, Medeiros NE, Spaide RF. Subretinal drusenoid deposits in non-neovascular age-related macular degeneration: morphology, prevalence, topography, and biogenesis model. Retina. 2013; 33: 265–276. [DOI] [PMC free article] [PubMed] [Google Scholar]
- 77. Durairaj C, Chastain JE, Kompella UB. Intraocular distribution of melanin in human, monkey, rabbit, minipig and dog eyes. Exp Eye Res. 2012; 98: 23–27. [DOI] [PMC free article] [PubMed] [Google Scholar]
- 78. Charng J, Tan R, Luu CD, et al.. Imaging lenticular autofluorescence in older subjects. Invest Ophthalmol Vis Sci. 2017; 58: 4940–4947. [DOI] [PMC free article] [PubMed] [Google Scholar]
Associated Data
This section collects any data citations, data availability statements, or supplementary materials included in this article.