

Abstract
Data in 2016 and 2017 has shown that most of Malaysia’s river water quality was in Water Quality Index Class II and Class III. The implementation of the Movement Control Order (MCO) has restricted business activities, human movements as well as anthropogenic activities. The sudden decline in human activities has directly impacted the river water quality. Several observations conducted by reporters of local newspapers, reports released by the Department of Environment (DoE) and Ministry of Environment and Water have shown positive changes in water river quality.
Keywords: Movement control order (MCO), COVID-19, Anthropogenic activities, Malaysia
Graphical abstract
Highlights
-
•
The Malaysian government has enforced Movement Control Order (MCO) beginning march 18, 2020 due to novel coronavirus (COVID-19) Pandemic.
-
•
Out of 477 monitored rivers in 2016, 47% of the rivers were classified as clean. However, only 46% of rivers were classified as clean, and the remaining were classified as slightly polluted (43%) and polluted (11%).
-
•
With restriction of business activities, human movements and anthropogenic activities during MCO, the level of river water quality has improved.
1. Introduction
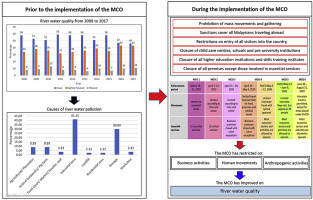
The Malaysian government has enforced the Movement Control Order (MCO) due to novel coronavirus (COVID-19) Pandemic. The enforcement began on March 18, 2020 when the number of infected patients increased to 790. The implementation of the Movement Control Order (MCO) is the restrictive activities order under the Prevention and Control of Infectious Diseases Act 1988 and the Police Act 1967. The government has implemented several levels of Movement Control Order (MCO): (1) the Movement Control Order (MCO, (2) the Conditional Movement Control Order (CMCO), the Recovery Movement Control Order (RMCO), and (3) the Enhanced Movement Control Order (EMCO) enforcement in areas with COVID-19 transmission during the Movement Control Order (MCO). There are six basic restrictions under Movement Control Order (MCO) [1]:
-
•
Prohibition of mass movements and gathering across the country, including religious, sports, social and cultural activities.
-
•
Sanctions cover all Malaysians traveling abroad.
-
•
Restrictions on entry of all tourists and visitors into the country.
-
•
Closure of all child care centres, government and private schools, including others primary, secondary, and pre-university institutions.
-
•
Closure of all public and private higher education institutions (HEI) and skills training institutes nationwide.
-
•
Closure of all government and private premises except those involved in essential services.
In fact, during an interview aired over RTM1 on April 25, 2020, the prime minister, Tan Sri Muhyiddin Yassin said that the country’s economy suffered a loss of RM2.4 billion daily as business was suspended during Movement Control Order (MCO). However, the implementation of MCO turned out to be a blessing in disguise for the environment. The decline in human and industrial activities has made the rivers cleaner and clearer than before [2].
“Water quality is a term used here to express the suitability of water to sustain various uses or processes” [3]. 98% of the water use originates from the rivers and 70% of the water resources are for the agricultural industry [4]. The quality of river water has a significant impact on human life. Humans use rivers for irrigation in agriculture, daily necessities such as drinking water, transportation, for generating electricity through hydroelectric dams and for leisure activities. Due to urbanization and modernization, river water pollution is a severe problem in Malaysia and has an adverse impact on the sustainability of water resources [5]. The Department of Environment (DOE) has classified the water quality index based on 5 classifications (I, II, III, IV and V) as shown in Table 1 .
Table 1.
Water quality index classification.
| Parameter | Unit | CLASS |
||||
|---|---|---|---|---|---|---|
| I | II | III | IV | V | ||
| Ammoniacal Nitrogen | mg/l | < 0.1 | 0.1–0.3 | 0.3–0.9 | 0.9–2.7 | > 2.7 |
| Biochemical Oxygen Demand | mg/l | < 1 | 1–3 | 3–6 | 6–12 | > 12 |
| Chemical Oxygen Demand | mg/l | < 10 | 10–25 | 25–50 | 50–100 | > 100 |
| Dissolved Oxygen | mg/l | > 7 | 5–7 | 3–5 | 1–3 | < 1 |
| pH | – | > 7 | 6–7 | 5–6 | < 5 | > 5 |
| Total Suspended Solid | mg/l | < 25 | 25–50 | 50–150 | 150– 00 | > 300 |
| Water Quality Index (WQI) | < 92.7 | 76.5–92.7 | 51.9–76.5 | 31.0–51.9 | < 31.0 | |
The purpose of this paper is to review the river water quality before the implementation of the Movement Control Order (MCO) due to the COVID-19 pandemic and during the implementation of MCO in Malaysia. The key data from 2008 - 2017 were obtained from the Department of Environment (DoE) (http://www.doe.gov.my) used to analyze the state of river water quality prior to the implementation of the Movement Control Order (MCO). Some of the information used is from major Malaysian newspapers. In addition, articles from the newspapers were also used in the preparation of portions of river water quality conditions during the implementation of the Movement Control Order (MCO) in Malaysia.
2. Before the Movement Control Order (MCO)
In Malaysia, rivers are vital for nature and human society. Even, major cities have been established and flourished along rivers. However, major river management issues are linked to water quality [6].
Data released by the Department of Environment (DoE) in 2017 showed that there were 579 rivers in 2008, but currently, there are only 477 rivers [7]. According to the Malaysian Environmental Quality Report 2016, out of 477 monitored rivers, only 47% of the rivers were classified as clean and the rest were slightly polluted (43%) and polluted (10%) [8]. Subsequent monitoring in 2017 showed that the percentage of clean rivers was declining. A total of 219 (46%) of the 477 supervised rivers were categorized as clean, 207 (43%) were slightly polluted and 51 (11%) were polluted [9]. The data released by the Department of Environment (DoE) (2017) were analyzed as shown in Fig. 1 and Fig. 2 . Fig. 1 represents three categories of river water quality and Fig. 2 represents river water quality by states from 2008 to 2017. Also, as attached in the Supplementary data section, Table 4, Tables 5 and 6 show a more detailed river water quality status.
Fig. 1.
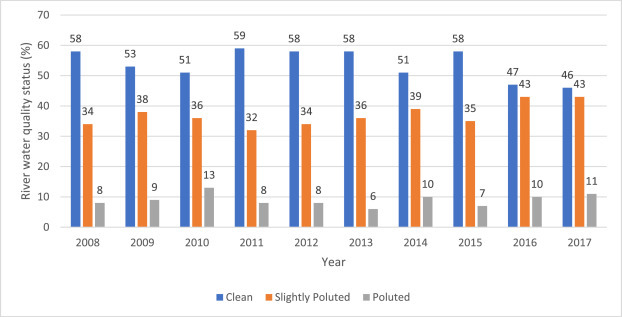
River water quality from 2008 to 2017.
Fig. 2.
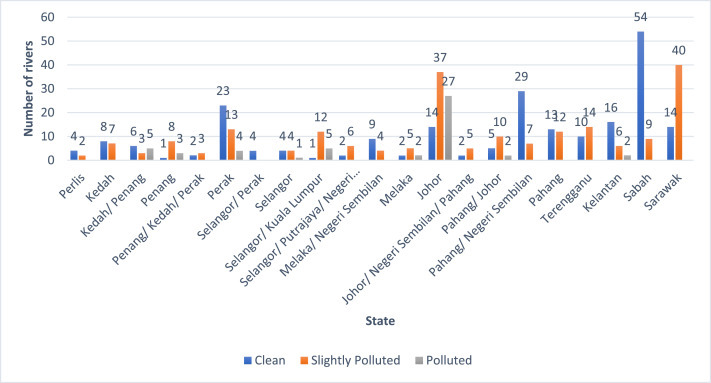
River water quality by states from 2008 to 2017.
Based on a comparison of data in 2016 and 2017, there was an increase in Class II (76.5–92.7), but this increase was less than 1%. Overall, most of the quality of rivers in Malaysia were in Class II (76.5–92.7) (64.15% in 2017 and 63.52 in 2016) and Class III (51.9–76.5) (31.45% in 2017 and 31.66% in 2016). There were 2 rivers in Perak, Sg. Nyior that has been in Class II (76.5–92.7) in 2016 has changed to Class I (>92.7) in 2017 and Sg. Jana that has been in Class I (>92.7) in 2016 has been changed to Class II (76.5–92.7) in 2017. Sg. Tukang Batu in Melaka that changed from Class IV (31–51.9) to Class V (<31) in 2017 even though the percentage is less than 1%. Even ongoing monitoring is conducted on water quality in Malaysia, however, the improvement in the river water quality did not increase significantly.
According to statistics released by the Department of Environment (DoE) in 2009, the major causes of pollution to the 52 rivers are related to anthropogenic activities. Specifically, the sources of contamination are caused by industrial areas, sewages, workshops, residential areas, animal husbandry activities, example pig farms, agricultural activities, landfills, plantation activities, market, food court and hawker stalls (refer to Table 2 ) [10]. These anthropogenic influences cause elevated concentrations of heavy metals, mercury, coliforms and nutrient loads (Khatri and Tyagi, 2015). Another report released by the Department of Environment (DoE) (2018) was almost identical. The main pollution loads were from 5 main sources, namely manufacturing industries, agricultural-based industries, sewage treatment plant, piggery and wet market. Specifically, a total of 653 tonnes/day of Biochemical Oxygen Demand pollution load, 835 tonnes/day of Suspended Solids Load pollution load and 205.3 tonnes/day of Ammoniacal Nitrogen Load were released in 2018 (refer to Fig. 3 ).
Table 2.
Causes of pollution.
| State | River | Causes of pollution |
|---|---|---|
| Kedah | Sg. Korok | Industrial area and agricultural activities |
| Sg. Petani | Industrial area | |
| Penang | Sg. Dondang | Rubber factory, sewage and workshop |
| Sg. Jelutong | Sewage, industrial area, workshop and food court | |
| Sg. Ara | Industrial area and residential area | |
| Sg. Rambai | Pig farm and sewage | |
| Sg. Air Melintas | Pig farm | |
| Sg. Kereh | Pig farm | |
| Sg. Seluang | Industrial area | |
| Sg. Cempedak | Industrial area | |
| Sg. Jawi | Sewage, pig farm and industrial area | |
| Sg. Tengah | Industrial area | |
| Perak | Sg. Seluang | Agricultural activities and sewage |
| Sg. Lidin | Sewage, industrial area and workshop | |
| Selangor | Sg. Batang Nilai | Agricultural area |
| Sg. Rambai | Agricultural activities and animal husbandry activities | |
| Sg. Kundang | Landfill | |
| Sg. Buloh | Industrial area, agricultural activities, animal husbandry activities and sewage | |
| Selangor/Kuala Lumpur | Sg. Bunos | Sewage |
| Sg. Damansara | Sewage and industrial area | |
| Sg. Jinjang | Sewage and residential area | |
| Sg. Keroyong | Industrial area | |
| Sg. Keroh | Sewage | |
| Sg. Penchala | Industrial area | |
| Melaka | Sg. Tuang | Pig farm |
| Sg. Air Salak | Industrial area and sewage | |
| Sg. Chin-Chin | Industrial area | |
| Sg. Merlimau | Industrial area, agricultural activities and sewage | |
| Negeri Sembilan/Johor | Sg. Kelamah | Industrial area |
| Sg. Sarang Buaya | Plantation and sewage | |
| Johor | Sg. Simpang Kanan | Industrial area and sewage |
| Sg. Ayer Merah | Industrial area | |
| Sg. Lenga | Industrial area | |
| Sg. Serai | Industrial area | |
| Sg. Air Baloi | Plantation, animal husbandry activities and sewage | |
| Sg. Segget | Sewage | |
| Sg. Bala | Industrial area and sewage | |
| Sg. Pandan | Sewage and industrial area | |
| Sg. Plentong | Sewage and industrial area | |
| Sg. Sebulung | Sewage and industrial area | |
| Sg. Sengkuang | Sewage and industrial area | |
| Sg. Tampoi | Sewage and industrial area | |
| Sg. Danga | Sewage | |
| Sg. Buloh | Industrial area | |
| Sg. Latoh | Industrial area | |
| Sg. Masai | Sewage and landfill | |
| Sg. Perembi | Industrial area | |
| Sg. Tukang Batu | Industrial area | |
| Sg. Kempas | Sewage and industrial area | |
| Pahang | Sg. Sepayang | Industrial area |
| Terengganu | Sg. Ramsan | Industrial area |
| Kelantan | Sg. Alor Lintah | Sewage, market and hawker stalls |
| Sarawak | Sg. Adong | Industrial area |
| Sabah | Sg. Pang Burong 1 | Industrial area |
Fig. 3.
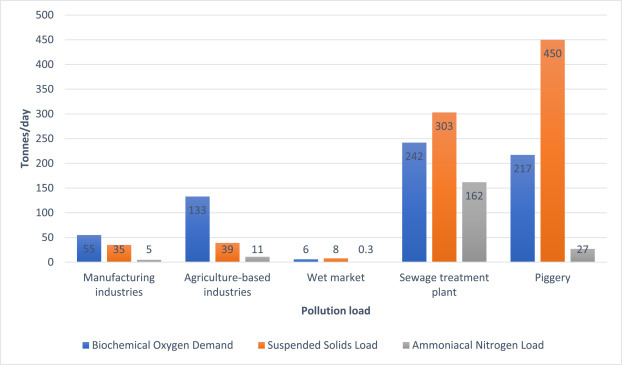
Assessment on pollution load.
A research conducted by Refs. [11] showed that the polluting industries were 928 (40%) food and beverage factories, 324 (14.1%) rubber-producing premises and 270 (11.4%) chemical producers. Due to Selangor, Johor, Penang, Kedah and Perak have the most industrial areas (refer to Fig. 4 ), the largest number of factories and the highest total projects approved in the manufacturing sector [12] (refer to Fig. 5 ) in Peninsular Malaysia, it is not surprising that the frequency of river water pollution is high [13]. also discussed that over 80% of the total volumes of industrial wastes in Malaysia originated from food and beverage processing, chemical products and agro-based industries.
Fig. 4.
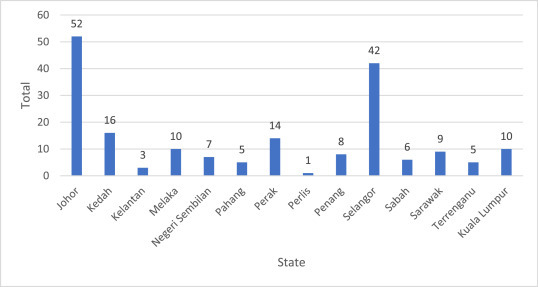
Total number of industrial areas by state.
Fig. 5.
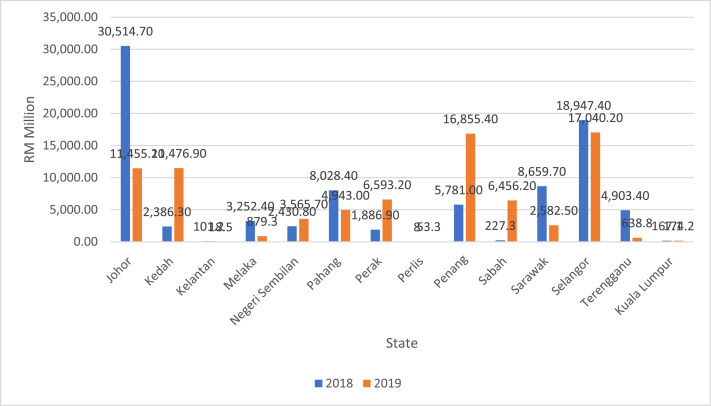
Projects approved in manufacturing sector by State in 2018 and 2019.
The effects of pollution on the ecosystem of the river is extremely alarming. Malaysia has rich aquatic ecosystems that supply vital resources such as water, food, medicine, commercial aquatic resources, energy, transport, as well as social development. Also, it provides flood control, erosion prevention and shoreline protection. However, the ubiquitous and abundant supplies of these resources have resulted in minimal concern about their conservation and sustainable exploitation [14].
There are several other incidents related to river water pollutions in 2018 and 2019 that affect the sustainability of cities, especially in relation to the environment, economic and social. These examples include rivers in Selangor, Johor, Penang and Perak.
For the first nine months of 2019 alone, the water treatment plant had forced to cease the operations four times due to incidents of contamination of raw water sources in the Semenyih River, Selangor. Water supply disruption affected 204 areas and 372,031 residents in Petaling, Hulu Langat, Kuala Langat and Sepang [15]. Also, Selangor Waters Management Authority (SWMA) detected diesel contamination at the water treatment plant at 5.45pm, July 21, 2019, causing the Sg. Selangor Phase 1 water treatment plant (SSP1) and SSP2 to be stopped at 8.15pm, while the water treatment plant SSP3 at 8pm. This is due to the diesel oil spill resulting from sand mining activities. The oil spill control works in the area began at 7.00pm to 12.00pm [16]. On December 26, 2019, 46 factories in Nilai were inspected by the Department of Environment (DoE) after the illegal dumping of toxic waste into the Indah Water Konsortium (IWK) sewerage by irresponsible parties. This incident has caused Sg. Semenyih water treatment plant was forced to cease operations and 366 areas with 328,957 people in Petaling, Hulu Langat, Kuala Langat and Sepang were affected [17].
On March 7, 2019, river pollution occurred in Sg. Kim-Kim, Pasir Gudang, Johor due to illegal chemical waste dumping. Due to this illegal waste has released toxic fumes, 6000 people were affected. In fact, 2775 residents have been hospitalized, as well as 111 schools and 92 kindergartens and nurseries have been closed [18]. Several toxic gases, such as acrylonitrile, xylene, methane and toluene were emitted following the interaction of the chemicals concerned with water and air. Sg. Kim Kim crisis was unique because it started with water pollution, then followed by air pollution [19].
According to Kata [20]; Penang is one of the most developed progressive states in Malaysia, but it lacks one important resource, clean water. Pitch black water with a thick oil layer on the surface of Sg. Tengah, Nibong Tebal believed to have been contaminated with effluent discharged from nearby farms and factories. The river used to be festive with the presence of fishermen from Kedah and Perak during webfoot octopus and mantis prawn seasons.
The presence of tourists began to decline as three rivers, Sg. Dipang, Sg. Kepar and Sg. Reas were polluted by waste disposal due to mining activity in the upstream areas. The direct release of water sludge into the river has caused the river to become turbid. These three rivers are known for their clear waters and fishing activities [21]. For the second case, Perak Water Board (LAP) has been ordered to shut down its Ayer Ganda Water Treatment Plant immediately, following the discovery of arsenic in treated water channeled to 1,500 people at Kampung Ayer Ganda, Gerik, in the state [22]. The third case in Perak, Sg. Raja Hitam in Manjung has been categorized under Class Four in river water quality and needs extensive treatment. The Perak Environmental Department had identified at least 6,000 causes of pollution that affect rivers in the state and among them were factory wastes and landfill sites [23].
3. During the Movement Control Order (MCO)
The implementation of the Movement Control Order (MCO) to stem the outbreak of COVID-19 since March 18, 2020 turned out to be a blessing in disguise for the environment [2]. Many rivers were reportedly much cleaner and clearer than before [24]. Although the government implemented a conditional Movement Control Order (MCO) on May 4, 2020 with most economic sectors allowed to conduct business activities, human movements and anthropogenic activities were still under control.
Sg. Kim Kim, a river infamous for having chemical waste pollution, has recently begun to recover. It is clearer and recovering after it was cleaned. The implementation of the Movement Control Order (MCO) has contributed to the recovery of river water. The factories and industries around have stopped operations during Movement Control Order (MCO) [25].
Rivers in Klang Valley were recovering during the Movement Control Order (MCO) [24]. Areas in Sentul and Kepong have seen marked improvements in their stretches of Sg. Gombak. Parts of Sg. Klang, from Melawati to Keramat, have also seen similar improvement in water quality. A total of 43% less waste is removed from Sg. Klang. From March 15, 2020 to April 15, 2020, 580 metric tonnes of rubbish were collected under the Selangor Maritime Gateway (SMG) project compared to an average of 900 to 1,200 metric tonnes per month over the last six months. Sg. Klang recorded Class III Water Quality Index (WQI) readings almost 90% of the time, compared to 2019 until March, 2020, whereby although the overall WQI stood at Class III as well, it was only for about 46 percent of the time [26]. Indah Water Konsortium’s (IWK) frontliners manage 8,147 sewage treatment plants (STPs) and a network of pumping stations to ensure that the sewerage system operates smoothly throughout the Movement Control Order (MCO). Despite restricted human activities, STPs continue to operate, maintain and adhere to global standards before discharging the effluent into rivers. For instance, there are 954 STPs with 9,800,000 population equivalents, which discharge equivalent to 2,200 million litres per day into Sg. Klang.
Sg. Melaka has become the talk of the town for its greener and cleaner water during the MCO period. Sg Melaka’s water was murky and with a teh tarik-like colour before [27]. This situation was due to no activities in the vicinity and along Sg Melaka during the MCO. Secondly, no activities are held at the river’s upstream area. Thirdly, all cruise boat activities along the river were no longer operating as usual and finally cruise boats using petrol were a source of pollution to the river [28]. Also [28], reported that a small tributary of the Sg. Klang, Sg. Gisir, that runs through Hulu Klang has also been noticeably cleaner since Movement Control Order (MCO) started.
The Star reported that the once pitch-black river, Sg. Pinang running along George Town is now jade green with algae. Another river, Sg. Pinang’s water quality was categorized at Class Four, just one step below the dead river category of Class Five. There were plans to make it Class Two for over 10 years ago. With the implementation of the Movement Control Order (MCO), the 3.5km river was healing [29].
On April 18, 2020, the Ministry of Environment and Water reported on river water quality status.
The report was based on the comparison of river water quality before Movement Control Order (MCO) (from 18 August 2019 to 17 March 2020) and during Movement Control Order (MCO) (from 18 March 2020 to 14 April 2020) at 29 water quality monitoring stations. Eight of the 29 water monitoring stations improved in water quality, eight did not show any apparent changes, and another 13 stations marked a slight decline in water quality (refer to Table 3 ). There was an increase in the river water quality index in Malaysia. Among them were Sg. Linggi in Negeri Sembilan, Sg. Muar and Sg. Johor in Johor, Sg. Pahang and Sg. Kuantan in Pahang, Sg. Besut in Terengganu, Sg. Kelantan in Kelantan, and Sg. Btg Sadong in Sarawak. In total, 2 rivers in Johor, 2 rivers in Pahang, 1 river in Kelantan, 1 river in Sarawak and 1 river in Terengganu have experienced an improvement in WQI (refer to Fig. 6 ). On average, there was a decrease in Chemical Oxygen Demand (COD) and Biological Oxygen Demand (BOD) during MCO, respectively, 5% and 6%, respectively. There was also a 1% decrease in Total Suspended Solids (TSS). There was also a decrease of around 50% in rubbish collected from Sg. Klang compared to in 2017 and 2018. In February to March 2018, rubbish collected was 21 m3 and 18 m3 for the year before [30].
Table 3.
Water quality index (WQI).
| Status | State | Station | River | |
|---|---|---|---|---|
| Improvement in WQI | Negeri Sembilan | CR13N | Sg. Linggi | |
| Johor | CR19J CR20J |
Sg. Muar Sg. Johor |
||
| Pahang | CR22C CR23C |
Sg. Pahang Sg. Kuantan |
||
| Terengganu | CR25T | Sg. Besut | ||
| Kelantan | CR26D | Sg. Kelantan | ||
| Sarawak | CR30Q | Sg. Btg Sadong | ||
| No apparent change in WQI | Kedah | CR02K | Terusan Mada | |
| Perak | CR06A | Sg. Perak | ||
| Selangor | CR08B | Sg. Langat | ||
| Kuala Lumpur | CR12W | Sg.Klang | ||
| Negeri Sembilan | CR14N | Sg. Muar | ||
| Melaka | CR17M | Sg. Kesang | ||
| Terengganu | CR24T | Sg. Paka | ||
| Sabah | CR27S | Sg. Tuaran | ||
| Slightly decline in WQI | Kedah | CR01K CR03K |
Terusan Mada Sg. Muda |
|
| Penang | CR04P | Sg. Kulim | ||
| Perak | CR05A | Sg. Bogak | ||
| Selangor | CR09B CR10B CR11B |
Sg. Semenyih Sg. Labu Sg. Langat |
||
| Negeri Sembilan | CR15N | Sg. Muar | ||
| Melaka | CR16M | Sg. Melaka | ||
| Johor | CR18J | Sg. Segamat | ||
| CR21J | Sg. Skudai | |||
| Sarawak | CR29Q | Sg. Sarawak | ||
| Sabah | CR31S | Sg. Moyog | ||
Fig. 6.
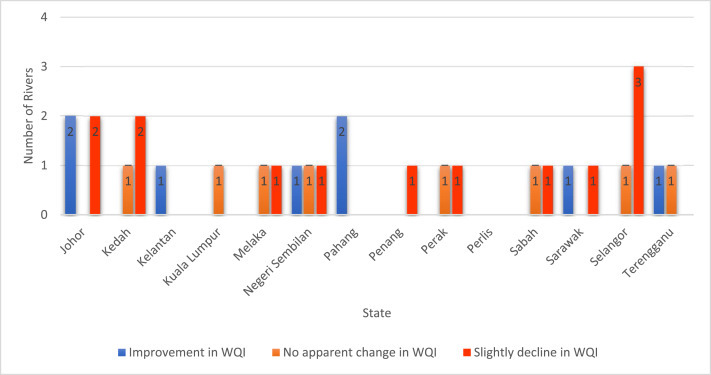
Water Quality Index (WQI) by state.
A study conducted by Ref. [31] showed that COVID-19 has both positive and negative effects on the environment. Among the positive effects are improvements in air quality, clean beaches and reduction of noise level. On the contrary, negative effects are associated with increasing in waste and reduction of waste recycling activities.
However, the implementation of the Movement Control Order (MCO) due to COVID-19 pandemic not only brought new norms into people’s lives, but also gave a ’fresh breath’ to the environment [32]. The implementation of the Movement Control Order (MCO) is a time for natural river water rehabilitation without anthropogenic activities. The factories may operate at a maximum level to cover losses after the Movement Control Order (MCO). If this happens, the river’s pollution burden will increase and it is feared that it will cause a shock to the natural system or the environment [33].
In addition to stringent law enforcement, public awareness is crucial to the importance of river water quality. Still, there were 160 cases of river pollution reported in which enforcement was taken during the Movement Control Order period from March 18 to May 4, 2020 [34]. Continuous river water pollution assistance should be done effectively and systematically.
4. Conclusion
53% of the river’s water quality in Malaysia was categorized as slightly polluted or polluted. High levels of pollution of river waters have occurred in states with large numbers of industrial areas and factories, such as in Selangor, Johor, Penang and Perak. The three most common anthropogenic activities that cause river water pollution are caused by industrial area, sewage, agricultural activities and animal husbandry activities. The word cloud water pollution is summarized in Fig. 7 .
Fig. 7.

Word cloud of water river pollution.
However, the spread of COVID-19 and the implementation of the Movement Control Order (MCO) have changed the landscape as well as economic, social and environmental activities in Malaysia. Due to limited human movement, anthropogenic activities have decreased. Some observations by local newspapers such as Berita Harian, The Rakyat Post, Malay Mail, The Star and MalaysiaKini found that some rivers like Sg. Kim Kim, Sg. Gombak, Sg. Klang, Sg. Melaka, Sg. Gisir and Sg. Pinang were clearer than before the implementation of the MCO. In fact, a report released by the Department of Environment (DoE) on April 18, 2020 shows that there was an increase in the river water quality index in Sg. Linggi in Negeri Sembilan, Sg. Muar and Sg. Johor in Johor, Sg. Pahang and Sg. Kuantan in Pahang, Sg. Besut in Terengganu, Sg. Kelantan in Kelantan, and Sg. Btg Sadong in Sarawak.
Overall, Malaysia has almost complete structures in controlling, enforcing, and also designing and formulating policies related to river water management. This includes governmental and non-governmental bodies, commissions and committees at the federal and state level, such as the National Water Services Commission, National Water Resources Council. This is supported by regulations and laws regarding river water such as Environmental Quality Act 1974 - ACT 127, Environmental Quality (Amendment) Act 2007 - ACT A1315, Environmental Quality (Amendment) Act 2012 - ACT A1441, Environmental Quality (Compounding Of Offences) (Amendment) Rules 1999 - P.U.(A) 12/99, and Environmental Quality (Compounding Of Offences) Rules 1978 - P.U.(A) 281/78. To ensure the sustainable use and development of water resources in Malaysia, the National Water Resources Policy 2010–2050 was officially launched on March 24, 2012. The policy is based on the 3 essential principles i.e. water resources security, water resources sustainability and collaborative governance.
Declaration of competing interest
The authors declare that they have no known competing interests or personal relationships that could have appeared to influence the work reported in this paper.
Footnotes
Supplementary data to this article can be found online at https://doi.org/10.1016/j.cscee.2020.100027.
Appendix A. Supplementary data
The following is the Supplementary data to this article:
References
- 1.The Malaysian National Security Council 2020. http://www.mkn.gov.my
- 2.Mohamed Radhi N.A. 2020. Can We Keep the Rivers Clean Post-MCO?https://www.nst.com.my/news/nation/2020/04/588724/can-we-keep-rivers-clean-post-mco New Straits Time. [Google Scholar]
- 3.Meybeck M., Kuusisto E., Mäkelä A., Mälkki E. Water quality. In: Bartram J., Ballance R., editors. World Health Organization & United Nations Environment Programme, Water Quality Monitoring : a Practical Guide to the Design and Implementation of Freshwater Quality Studies and Monitoring Programs/edited by Jamie Bartram and Richard Ballance. E & FN Spon; London: 1996. [Google Scholar]
- 4.Huang Y.F., Ang S.Y., Lee K.M., Lee T.S. Quality of water resources in Malaysia. In: Lee T.S., editor. Research and Practices in Water Quality. IntechOpen; London: 2015. [Google Scholar]
- 5.Afroz R., Rahman A. Health impact of river water pollution in Malaysia. Int. J.Adv.Appl. Sci. 2017;4(5):78–85. [Google Scholar]
- 6.Chan N.W. Managing urban rivers and water quality in Malaysia for sustainable water resources. Int. J. Water Resour. Dev. 2012;28(2):343–354. [Google Scholar]
- 7.New Straits Times . 2019. NST Leader: What’s up, Enforcers?https://www.nst.com.my/opinion/leaders/2019/07/506380/nst-leader-whats-enforcers [Google Scholar]
- 8.The Department of Environment (DoE) Laporan kualiti alam sekililing Malaysia 2016 [Malaysian environmental quality report 2016] 2016. https://www.doe.gov.my/portalv1/wp-content/uploads/2018/09/iv-EQR2016.pdf
- 9.The Department of Environment (DoE) Laporan kualiti alam sekililing Malaysia 2017 [Malaysian environmental quality report 2017] 2017. https://www.doe.gov.my/portalv1/wp-content/uploads/2018/09/Kualiti-Air-Sungai.pdf
- 10.The Malaysian Administrative Modernisation and Management Planning Unit . 2009. Sungai Yang Tercemar Mengikut Negeri Dan Punca Punca Pencemarannya Pada Tahun 2009 [Rivers Polluted by State and Their Sources of Pollution in 2009.http://www.data.gov.my/data/ms_MY/dataset/sungai-yang-tercemar-mengikut-negeri-dan-punca-punca-pencemarannya-pada-tahun-2009/resource/9f97906c-124e-4164-8ee9-862c6b462eda [Google Scholar]
- 11.Muyibi S., Ambali A.R., Eissa G.S. The impact of economic development on water pollution: trends and policy actions in Malaysia. Water Resour. Manag. 2008;22(4):485–508. [Google Scholar]
- 12.Malaysian Investment Development Authority (MIDA) 2020. Projects Approved by State, 2019 and 2018.https://www.mida.gov.my/home/projects-approved-by-state,-2019-and-2018/posts [Google Scholar]
- 13.Sany S.B.T., Tajfard M., Rezayi M., Rahman M.A., Hashim R. Chapter 20: the west coast of peninsular Malaysia. In: Sheppard C., editor. World Seas: an Environmental Evaluation. second ed. 2019. pp. 437–458. [Google Scholar]
- 14.Yusoff F.M., Shariff M., Gopinath N. Diversity of Malaysian aquatic ecosystems and resources. Aquat. Ecosys. Health Manag. 2006;9(2):119–135. [Google Scholar]
- 15.Air Selangor 2019. https://www.airselangor.com/press-release/insiden-pencemaran-bau-di-sumber-air-mentah-dan-menyebabkan-hentitugas-loji-rawatan-air-sungai-semenyih
- 16.Khazi H. Berita Harian; 2019. Water source pollution: LUAS continues to monitor situation in Sungai Selangor [Pencemaran sumber air: LUAS terus pantau situasi di Sungai Selangor]https://www.bharian.com.my/berita/kes/2019/07/587897/pencemaran-sumber-air-luas-terus-pantau-situasi-di-sungai-selangor [Google Scholar]
- 17.The Star DoE inspects 45 factories over pollution at Sg Semenyih water plant. 2019. https://www.thestar.com.my/news/nation/2019/12/26/doe-inspects-45-factories-over-pollution-at-sg-semenyih-water-plant
- 18.Chia R.G. Business Insider; 2019. Johor Gas Poisoning Victims Now at 2,775, but PM Mahathir Says the Situation Is ‘under Control’.https://www.businessinsider.my/johor-gas-poisoning-victims-now-at-2775-but-pm-mahathir-says-the-situation-is-under-control [Google Scholar]
- 19.The Sun Daily Public apathy, illegal factories main causes of river pollution. 2019. https://www.thesundaily.my/local/public-apathy-illegal-factories-main-causes-of-river-pollution-CX707271
- 20.Malaysia Kata. 2019. Penang Has Everything, except Clean Water.https://katamalaysia.my/environment/penang-has-everything-except-clean-water [Google Scholar]
- 21.Suara Perak Our river water is no longer clear [Air sungai kami tidak lagi jernih] 2018. https://www.suaraperak.com/air-sungai-kami-tak-lagi-jernih/
- 22.Kow G.C. 2019. Arsenic Pollution: Water Treatment Plant in Perak Ordered to Shut Down.https://www.malaysiakini.com/news/471908 [Google Scholar]
- 23.Mat Arif Z. New Straits Times; 2019. Sungai Raja Hitam Falls under Class Four, Needs Extensive Treatment.https://www.nst.com.my/news/nation/2019/03/469561/sungai-raja-hitam-falls-under-class-four-needs-extensive-treatment [Google Scholar]
- 24.Dorall A. 2020. Rivers in the Klang Valley Are Recovering without Human Interference during MCO.https://www.therakyatpost.com/2020/04/11/rivers-in-the-klang-valley-are-recovering-without-human-interference-during-mco [Google Scholar]
- 25.Noh M.F. 2020. Sg. Kim Kim Is Recovering during the MCO [Sungai Kim Kim Semakin Pulih Ketika PKP], Berita Harian.https://www.bharian.com.my/berita/nasional/2020/04/681836/sungai-kim-kim-semakin-pulih-ketika-pkp?_ga=2.25319741.1297871281.1589479458-484745269.1589479445 [Google Scholar]
- 26.Malay Mail . 2020. MCO Has Led to a Much Cleaner Klang River.https://www.malaymail.com/news/malaysia/2020/04/20/mco-has-led-to-a-much-cleaner-klang-river/1858635 [Google Scholar]
- 27.The Star Thanks to MCO, Sungai Melaka is green and clean. 2020. https://www.thestar.com.my/news/nation/2020/04/25/thanks-to-mco-sungai-melaka-is-green-and-clean
- 28.MalaysiaKini . 2020. CM Wants Sg Melaka to Be Kept Clean Post-MCO.https://www.malaysiakini.com/news/522454 [Google Scholar]
- 29.Lo T.C. 2020. Once Pitch-Black, Now Jade Green.https://www.thestar.com.my/news/nation/2020/04/27/once-pitch-black-now-jade-green The Star. [Google Scholar]
- 30.The Department of Environment (DoE) Kenyataan media, Status kualiti udara dan air sungai sepanjang tempoh perintah kawalan pergerakan [Media statement, Air and river water quality status throughout the duration of the movement control order] 2020. https://www.doe.gov.my/portalv1/wp-content/uploads/formidable/5/YBM-Media-KualitiUdaraSungai-18APril-FINAL1.pdf
- 31.Zambrano-Monserrate M.A., María Alejandra Ruano M.A., Sanchez-Alcalde L. Indirect effects of COVID-19 on the environment. Sci. Total Environ. 2020;728:138813. doi: 10.1016/j.scitotenv.2020.138813. [DOI] [PMC free article] [PubMed] [Google Scholar]
- 32.Sinar Harian The MCO gives a new breath to the environment [PKP beri nafas baharu kepada alam sekitar] 2020. https://www.sinarharian.com.my/article/79564/BERITA/Nasional/PKP-beri-nafas-baharu-kepada-alam-sekitar
- 33.Berita Harian . 2020. Can the People Adopt a New Norm for the Sake of the Environment [Mampukah Rakyat Amal Normal Baharu Demi Alam Sekitar]https://www.bharian.com.my/berita/nasional/2020/04/682092/mampukah-rakyat-amal-normal-baharu-demi-alam-sekitar [Google Scholar]
- 34.Bernama . 2020. 160 Cases of River Pollution during MCO - Tuan Ibrahim.https://www.bernama.com/en/general/news.php?id=1841294 [Google Scholar]
Associated Data
This section collects any data citations, data availability statements, or supplementary materials included in this article.