Abstract
Purpose
The present study investigated retinal glia and choroidal vessels in flatmounts and sections from individuals with clinically diagnosed Stargardt disease (STGD).
Methods
Eyes from three donors clinically diagnosed with STGD were obtained through the Foundation Fighting Blindness (FFB). Genetic testing was performed to determine the disease-causing mutations. Eyes were enucleated and fixed in 4% paraformaldehyde and 0.5% glutaraldehyde. After imaging, retinas were dissected and immunostained for glial fibrillary acidic protein, vimentin, and peanut agglutin. Following RPE removal, the choroid was immunostained with Ulex europaeus agglutinin lectin. For each choroid, the area of affected vasculature, percent vascular area, and choriocapillaris luminal diameters were measured. The retina from one donor was hemisected and cryopreserved or embedded in JB-4 for cross-section analysis.
Results
Genetic testing confirmed the STGD diagnosis in donor 1, whereas a mutation in peripherin 2 was identified in donor 3. Genetic testing was not successful on donor 2. Therefore, only donor 1 can definitively be classified as having STGD. All donors had areas of RPE atrophy within the macular region, which correlated with underlying choriocapillaris loss. In addition, Müller cells formed pre- and subretinal membranes. Subretinal gliotic membranes correlated almost identically with RPE and choriocapillaris loss.
Conclusions
Despite bearing different genetic mutations, all donors demonstrated choriocapillaris loss and Müller cell membranes correlating with RPE loss. Müller cell remodeling was most extensive in the donor with the peripherin mutation, whereas choriocapillaris loss was greatest in the confirmed STGD donor. This study emphasizes the importance of genetic testing when diagnosing macular disease.
Keywords: Stargardt disease, choriocapillaris degeneration, retinal gliosis, Müller cells, glia
Stargardt disease (STGD) is an autosomal recessive disease that causes juvenile macular degeneration. This is the most common juvenile macular dystrophy, affecting 1 in 10,000 men and women worldwide.1 STGD is caused by over 800 known mutations in the ABCA4 gene.2 Peripherin 2 (PRPH2) mutations result in varied degrees of retinal degeneration, including macular dystrophy that is very similar to and often misdiagnosed as STGD.3 Clinically, STGD is characterized by white or yellow retinal flecks primarily confined to the macula.4 It is thought that impaired all-trans retinal transport causes lipofuscin accumulation within the retinal pigment epithelium (RPE) and subsequent RPE and photoreceptor death.5,6
Recent studies have shown that Müller cells are activated, as evidenced by their expression of glial fibrillary acidic protein (GFAP), in the parafoveal region of eyes with STGD.6,7 Eagle and colleagues indicated, with eosin staining, that a potential glial scar was overlying areas of RPE and choroidal atrophy in a STGD-affected eye.6 No studies, however, have fully investigated the Müller cell changes in this disease. Müller cell remodeling has been observed in age-related macular degeneration as well as other retinal degenerations and detachments.8–13 Therefore, it seems likely that Müller cells also undergo significant changes in STGD. The suggestion that Müller cells are altered in STGD is also supported by a recent study, which demonstrated changes to the external limiting membrane (ELM) early in this disease.14 Optical coherence tomography (OCT) imaging demonstrated thickening of the ELM, which was reduced with age, in patients with STGD compared to age-matched controls. Lee and colleagues speculated that Müller cells could contribute to the thickened ELM.14
Previous reports in patients with STGD have demonstrated clinically and histologically that choriocapillaris (CC) loss is confined to areas subjacent to RPE loss,4,6,15 however, a recent OCT angiography (OCTA) study demonstrated flow deficits beyond the area of RPE atrophy.16 Changes to choroidal thickness, as measured by OCT, vary among patients with STGD potentially depending on the specific ABCA4 mutation.17 Another recent study using OCTA demonstrated that choroidal blood flow is reduced only in the atrophic area in patients with late onset STGD.18 Another OCTA study recently demonstrated a reduction in retinal and choroidal thickness as well as a disorganized retinal vasculature.19 The status of the deeper intermediate blood vessels in Sattler’s layer and large choroidal blood vessels in Haller’s layer in STGD is currently debated.
The present study investigates retinal Müller cell and choroidal changes in eyes from three donors clinically diagnosed with STGD. Choroids were analyzed in the flat perspective, whereas retinas were analyzed in both the flat and cross sectional perspective.
Methods
Donor Information, Eye Fixation, and Preparation
All procedures in this study adhered to the tenets of the Declaration of Helsinki regarding research involving human tissue and were approved by the institutional review boards of the Johns Hopkins Medical Institute (IRB000056984) and Cole Eye Institute (IRB14-057). Eyes were collected from three donors clinically diagnosed with STGD through the Foundation Fighting Blindness (FFB) Eye Donor Program. Eyes were enucleated 14 to 49 hours postmortem and fixed in 4% paraformaldehyde and 0.5% glutaraldehyde in Dulbecco's phosphate buffered saline (D-PBS). Donor 1 (FFB donor #863) was a 66 year old woman whose last clinical examination was 10 years prior to her death. Donor 2 (FFB donor #1012) was a 69 year old man. Donor 3 (FFB donor #878) was a 72 year old man. Aged control eyes (N = 3) were received from the National Disease Research Interchange (NDRI) and were fixed in 2% paraformaldehyde (PFA) after separating the retina and RPE/choroid. The retina and choroid were fixed overnight before washing and processing, as described previously.8,9
Ex Vivo Imaging
The eyes were bisected parallel to the ora serrata and the anterior chamber was removed before performing macroscopic imaging of the posterior pole. For fundus microscopy (FM), confocal scanning laser ophthalmoscopy (cSLO), and spectral domain optical coherence tomography (SD-OCT) imaging, globes were transferred to a D-PBS-filled plexiglass chamber. Imaging details were previously described.7,20 Clinical images were not taken of the control eyes.
Genotyping
Donor 1 was genetically tested prior to this study.7 DNA for donors 2 and 3 was extracted from fixed retinal tissue samples using the Gentra Systems PUREGENE DNA Purification Kit (Qiagen, Germantown, MD, USA). DNA from both donors were submitted to The Blueprint Genetics Macular Dystrophy Panel Plus analysis (Blueprint Genetics, San Francisco, CA, USA).
Flatmount Immunohistochemistry
Eyecups were imaged with the retina and RPE intact (Zeiss Stemi dissecting microscope and Qimaging CCD software). A piece of retina and choroid were cut from the posterior pole of each eyecup. The retina was dissected from the RPE/choroid and washed in tris-buffered saline (TBS) overnight. The RPE/choroid was incubated in the disodium salt of ethylenediaminetetraacetic acid for 1.5 hours and RPE was removed using a pipette before washing with TBS overnight. The retina and choroid were stained as wholemounts, as previously described.9,21,22 Briefly, tissues were blocked in 5% normal goat serum overnight before 72-hour incubation in primary antibodies and 48-hour incubation in secondary antibodies. Retinas were stained with chicken anti-glial fibrillary acidic protein (GFAP; 1:500; Millipore, Burlington, MA, USA), rabbit anti-vimentin (1:200; Abcam, Cambridge, MA, USA), and peanut agglutinin lectin-FITC (PNA; 1:500; Vector Laboratories, Burlingame, CA, USA). Choroids were stained with Ulex europaeus agglutinin-FITC (UEA lectin1:100; Genetex, Irvine, CA, USA). Images were collected on a Zeiss 710 confocal microscope. The choroids were imaged with Bruch's membrane proximal to the objective. Tiled Z stacks (5 × 7 with 10% overlap) were collected using the 5× objective lens with the submacular region centered in the oculars. Additional images were collected at 10× and 20×. The inner boundary of all Z stacks was the focal plane just above the CC, whereas the outer boundary was the end of labeling.
Analysis Using Image J
Once images of the Ulex europaeus agglutinin (UEA) lectin stained choroid were collected, they were analyzed using Image J software, as previously described.22 Briefly, for each choroid, the area of CC affected was measured using the tiled Z low magnification image (5×). Higher magnification images (20×) were then used to measure the percent vascular area (VA) in three different fields within the perimacular region and submacular region from each choroid. Supplementary Figure S1 shows the approximate location of measurements. The submacula is defined herein as the choroid below clinical macula (a 2.5 mm area surrounding the fovea), whereas the perimacula is the surrounding region within the arcade vessels. The CC diameter was measured using Image J (National Institutes of Health [NIH]) in high magnification images, as previously described.22 After setting the scale in the analyze menu, luminal diameter was measured on 10 randomly selected capillary segments that were not at bifurcations. The areas of RPE loss and glial membranes were measured in Image J using gross photographs and low magnification retinal images, respectively. The correlation coefficient between RPE loss and glial membranes as well as between glial membranes as CC loss was calculated using Excel (Microsoft, Redmond, WA, USA). In addition, the correlation coefficient was calculated for areas of CC and RPE loss.
Flatmount Cryopreservation and JB-4 Embedding and Histological Staining
After imaging, half of donor 3’s retina was cryopreserved using serial dilutions of sucrose,23 whereas the other half was fixed again in 25% Karnovsky's fixative and embedded for JB-4, as previously described.8 Embedded tissue was sectioned and imaged on the confocal (cryopreserved pieces) or stained with hematoxylin and eosin (H&E; JB-4 pieces).
Results
Genotypic Information
As previously reported, donor 1 had two heterozygous mutations in the ABCA4 gene (p.Gly1961Glu and IVS46 +2 C>G).7 Genetic information could not be collected for donor 2 due to poor DNA quality. Donor 3 had a heterozygous mutation (c.629C>G, p.Pro210Arg) in the PRPH2 gene. Thus, although all three donors were clinically identified with STGD, only one can be genetically classified as STGD.
Fundus Photographs and Postmortem Clinical Presentation by OCT
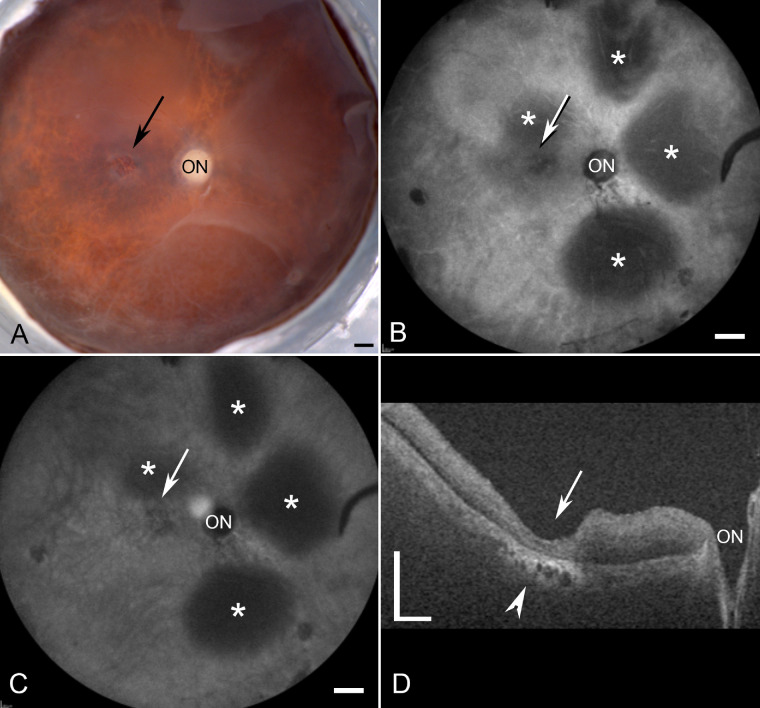
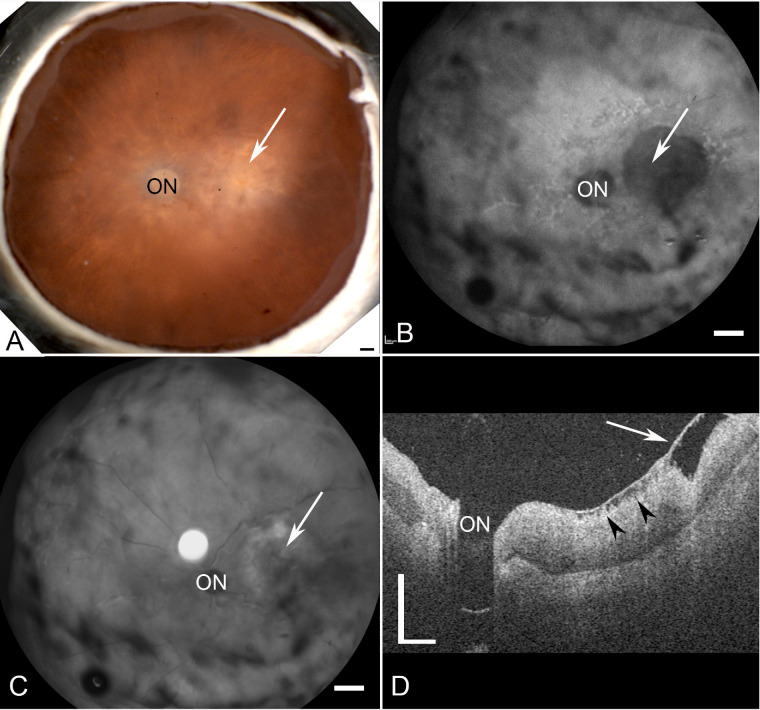
The fellow eye of donor 1 has been previously studied extensively along with the clinical presentation of this eye.7 As reported, donor 1 had a classic STGD phenotype with severe RPE loss and hyperpigmentation in the perimacular region. A gross image of donor 2 demonstrated a small parafoveal atrophic area (Fig. 1A, black arrow). Blue peak autofluorescence (AF-cSLO) imaging revealed hypofluorescence in the parafovea (Fig. 1B, white arrow). Parafoveal degeneration following RPE loss was also evident in this donor by cSLO-infrared (IR-cSLO) (Fig. 1C, white arrow). Although retinal detachments were visible in both modalities (see Figs. 1B, 1C, asterisks); these appear to be postmortem artifacts. OCT imaging demonstrated a thinned retina with poorly defined outer retinal lamina and choroidal thinning and degeneration in the submacular region (Fig. 1D, arrowhead). Fundus imaging of donor 3 revealed a large region of macular atrophy (Fig. 2A, white arrow). AF-cSLO imaging demonstrated hypofluorescence in this region, which included the macula and was found to have RPE loss (Fig. 2B, white arrow). IR-cSLO displayed hyporeflectance in the macula and hyper-reflectance in the perimacula (Fig. 2C, white arrow). OCT imaging demonstrated a thicker choroid with inner retinal thinning and degeneration in the macula (Fig. 2D, arrow). A prominent pre-retinal membrane was evident with apparent traction on the retina (Fig. 2D, arrowheads).
Figure 1.
Ex vivo imaging of donor 2 (FFB1012). (A) Gross image reveals a small area with RPE loss (arrow). (B, C) cSLO images demonstrate the optic nerve head (ON) and areas of focal degeneration around the fovea. Retinal detachments can be observed (asterisks). (D) OCT analysis reveals severe retinal thinning in the foveal region (arrow). Also evident is choroidal degeneration in this area (arrowhead). Scale bars indicate 1 mm A–C and 0.5 mm D.
Figure 2.
Ex vivo imaging of donor 3 (FFB878). (A) Fundus macroscopy reveals an area with RPE loss (arrow). (B, C) cSLO images demonstrate the optic nerve head (ON) and a large area with focal degeneration (arrow). (D) OCT analysis reveals a preretinal membrane overlying the foveal region (arrow) as well as areas inner retinal degeneration (arrowheads). Also evident is an overall thickening of the retina in this donor and reduced retinal lamination. Scale bars: indicate 1 mm A–C and 0.5 mm D.
Gross Observations and Histology of a Normal, Aged Control
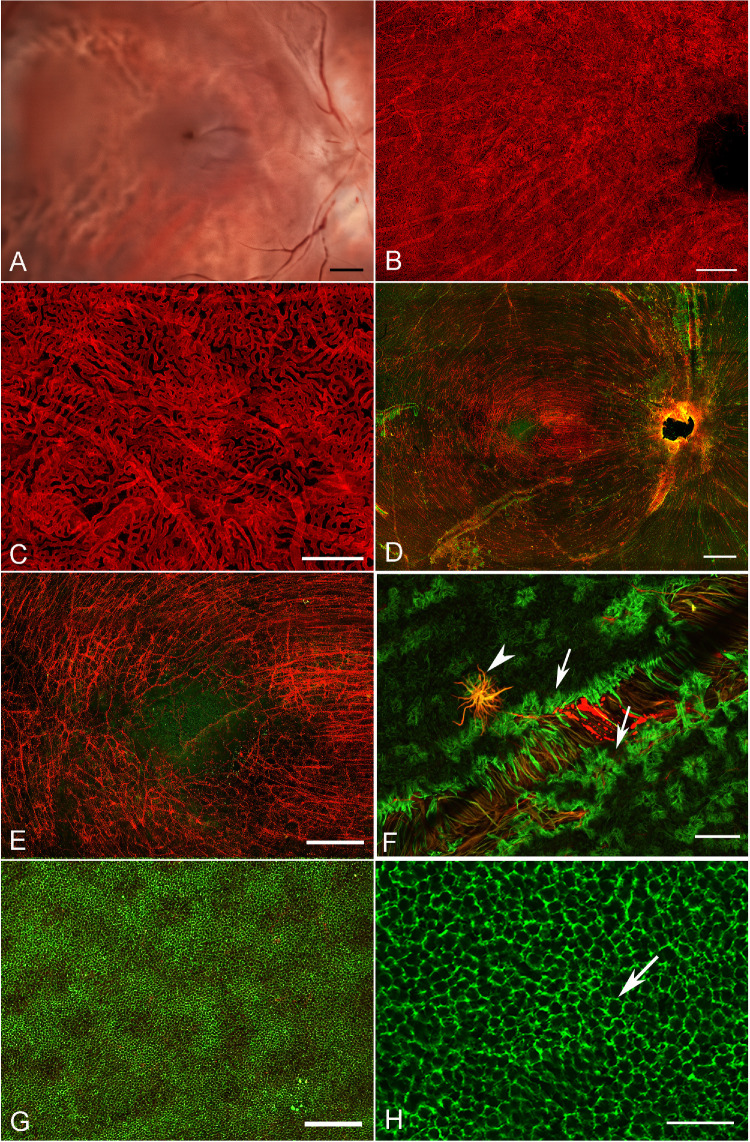
Gross imaging of the normal aged control eye with the retina removed demonstrates the normal, continuous appearance of the choroidal vessels (Fig. 3A). The homogenous pattern of the CC is further demonstrated by the UEA lectin labeled choroid (Figs. 3B, 3C). The percent VA in this normal was 76.3 +/− 1.12 in the submacular region and 77.7 +/− 1.6 in the perimacular region. These values fell within the normal range previously reported.22 The CC diameter was 16.5 +/− 2.3 µm. The retina, stained with GFAP (astrocytes and activated Müller cells) and vimentin (Müller cells) reveals the linear morphology of astrocytes as they align with the nerve fiber bundle in the posterior pole (Figs. 3D, 3E). The fovea is an avascular and astrocyte-free area (see Fig. 3E). Isolated glial cells were observed on the vitreo-retinal surface, primarily over large blood vessels (Figs. 3D–3F). When the same retina was imaged with the photoreceptors en face, the honeycomb pattern of the ELM is evident where Müller cells ensheath the inner segments and terminate to form the ELM (Figs. 3G, 3H).
Figure 3.
Histopathologic presentation of an aged control donor. (A) Gross image reveals a complete RPE monolayer which prevents visualization of the choroidal vessels. (B) UEA lectin staining after removal of RPE demonstrates the uniform CC pattern. (C) High magnification better reveals the CC patterns. The long vessels are intermediate blood vessels in Sattler's layer in this collapsed z-stack. (D) The corresponding retina, stained with GFAP (red; astrocytes and activated Müller cells) and vimentin (green, Müller cell processes) imaged with the nerve fiber layer up. (E) Higher magnification reveals the linear morphology of astrocytes along the nerve fiber bundles which terminate in the fovea. (F) High magnification of the retina with the ILM en face reveals isolated glial cells (arrowhead) extending through the ILM over large vessels as well as the normal Müller cell endfeet (arrows). (G) Low magnification of the same retina imaged with the photoreceptors en face demonstrates the honeycomb-like pattern created by the Müller cell processes forming the ELM. (H) Closer investigation of the retina with the photoreceptors en face demonstrates the honeycomb-like pattern of the ELM (arrow). Scale bars indicate: A, B, and D: 1 mm, C, G: 200 µm, E: 500 µm, F and H: 50 µm.
Gross Observations and Low Magnification Imaging of Retinal and Choroidal Changes
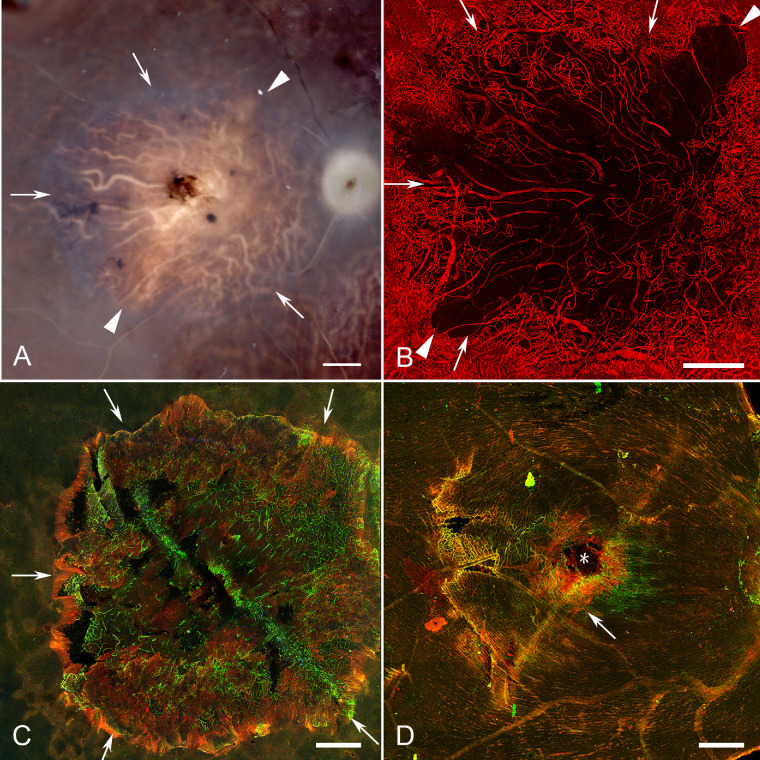
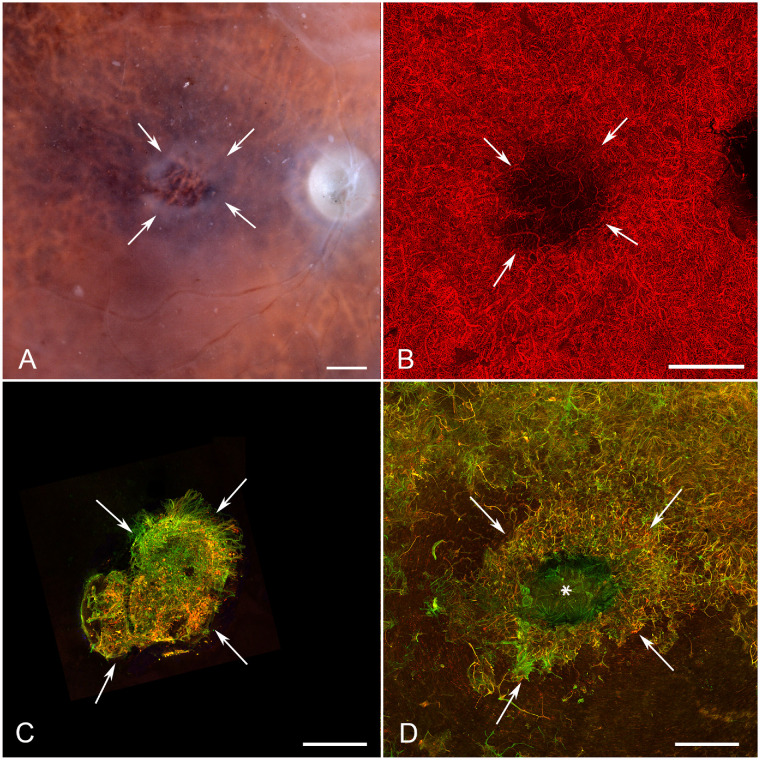
Gross photographs that were taken with the retina in place clearly demonstrated the areas of RPE atrophy where choroidal vessels were visible. Donor 1 had a large RPE atrophic area with a circular shape (Fig. 4A, arrows). The peripapillary region appeared to contain RPE, indicating sparing in this region. A large circular area with lateral projections and an opaque hypertrophic entity within the center was observed in the area of RPE atrophy (see Fig. 4A, arrows). UEA lectin labeling of the choroid revealed an almost identical area of vascular atrophy in the CC (arrows) with extensive loss corresponding to the large circular RPE atrophic area and in the projected areas (Fig. 4B, arrowheads). Very small areas of choroidal loss were evident in the areas with RPE sparing, but the most severe CC degeneration was in the RPE atrophy area (Fig. 4; Supplementary Fig. S2). Interestingly, using image thresholding even in areas with complete RPE atrophy, some areas of CC were quite dense. Imaging of the retina with the ELM en face demonstrated a GFAP/vimentin-double positive glial membrane anterior to the area of RPE and CC loss (Fig. 4C). The lateral projections were not present in the membrane and the glial membrane appeared to extend beyond the area of CC and RPE atrophy. Imaging of the retina with the internal limiting membrane (ILM) en face showed isolated glial processes on the vitreo-retinal surface (Fig. 4D, arrow).
Figure 4.
Histopathologic presentation of donor 1 (FFB 863). (A) Gross image reveals the area of RPE atrophy (defined by arrows), where choroidal vessels are visible. An island of surviving RPE is present in fovea. (B) UEA lectin staining demonstrates almost complete CC dropout in the atrophic region (arrows) with only a few intermediate and large blood vessels remaining. (C) Müller cell processes labeled with vimentin (green) and GFAP (red) occupy the area of atrophy when retinas are imaged with the ELM up. (D) When the retina was imaged with the ILM en face, isolated glial cells were observed on the vitreoretinal surface (arrow). Arrowheads indicate lateral projections of atrophy in A and B. Asterisk indicates the fovea in D. Scale bars indicate 1 mm.
As observed in gross photographs, donor 2 had a much smaller atrophic area within the submacular region than the other donors (Fig. 5A). UEA lectin demonstrated an area of CC loss corresponding to the RPE atrophic area (Fig. 5B, arrows; Supplementary Fig. S3). Areas with surviving CC were evident under complete RPE loss (Supplementary Fig. S3). Imaging of the retina with the ELM en face revealed a small glial membrane, positive for both vimentin and GFAP, which was almost identical to the area of RPE and CC atrophy (Fig. 5C, arrows). This membrane appeared to contain less GFAP than that of donor 1. This may be due to the size of the lesion and, potentially, the disease duration. The vitreo-retinal surface was covered by a large glial membrane, also positive for GFAP and vimentin (Fig. 5D, arrows). The only area not covered by the preretinal membrane was the foveal region (see Fig. 5D, asterisk).
Figure 5.
Histopathologic presentation of donor 2 (FFB 1012). (A) Gross image reveals a small area of RPE atrophy (defined by arrows), where choroidal vessels are visible. (B) UEA lectin staining demonstrates CC dropout in the atrophic region (arrows) with a few intermediate and large blood vessels remaining. (C) Müller cell processes (arrows) labeled with vimentin (green) and GFAP (red) are visible occupying the area of atrophy when retinas are imaged with the ELM up. (D) When the retina was imaged with the ILM en face, numerous GFAP and vimentin-positive glial cells were observed on the vitreoretinal surface creating a membrane. Only the fovea (asterisk) and limited areas of the perifoveal retina (bottom) were not covered by glia. Arrows define the atrophic area. Scale bars indicate 1 mm.
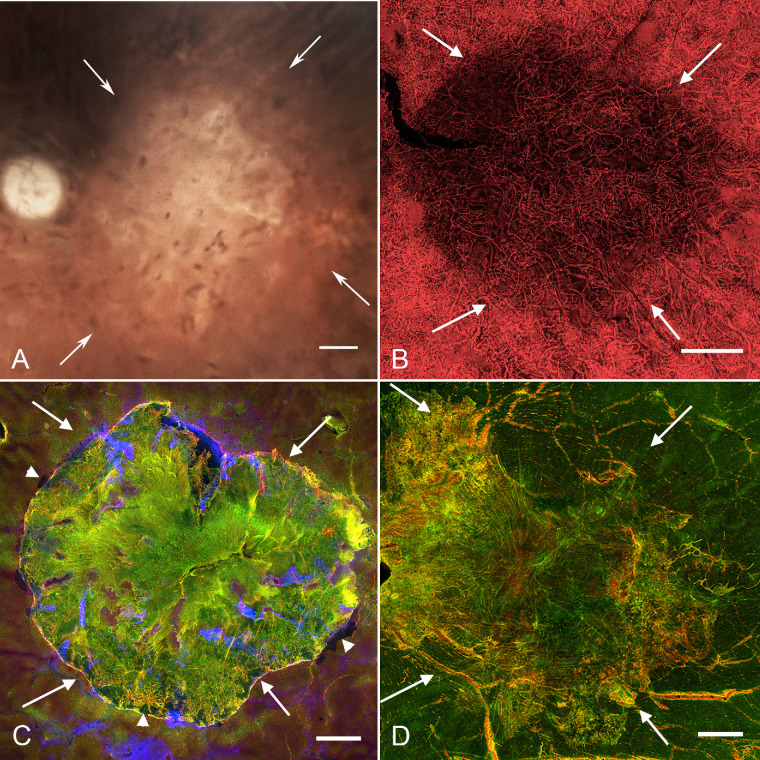
The gross photograph of donor 3’s eyecup after removing the retina confirmed the earlier gross observations of a large area of RPE atrophy (Fig. 6A, arrows). The choroid, stained with UEA lectin, had an area of CC loss almost identical to that of RPE atrophy (Fig. 6B, Supplementary Fig. S4). Diffuse RPE atrophy surrounding the atrophic area was also observed but was not associated with CC loss (Supplementary Fig. S4). The retina imaged with the ELM en face had a subretinal glial membrane with a sharp, intensely GFAP-positive border (Fig. 6C, arrows). Migrating RPE cells were observed in many areas at the border of the glial membrane (see Fig. 6C, arrowheads). Fingerlike projections of intact photoreceptors (PNA+) were observed extending into the membrane. When the retina was imaged with the ILM en face, a large, preretinal membrane composed of GFAP and vimentin-positive cells and processes was observed (Fig. 6D, arrows). This membrane was almost identical to the area of RPE loss. In fact, the areas of RPE loss, CC atrophy, and subretinal glial membranes were significantly correlated in all three eyes (see Supplementary Fig. S5).
Figure 6.
Histopathologic presentation of donor 3 (FFB 878). (A) Gross image reveals the area of RPE atrophy (defined by arrows), where choroidal vessels are visible. (B) UEA lectin staining demonstrates CC attenuation in the atrophic region (arrows). (C) Müller cell processes labeled with vimentin (green) and GFAP (red) occupy the area of atrophy (arrows) when retinas are imaged with the ELM en face. Arrowheads indicate migrating RPE at the border of the glial membrane. (D) When the retina was imaged with the ILM en face, a large, dense glial membrane was observed (arrows) covering an area very similar but slightly larger than the atrophic area. Scale bars indicate 1 mm.
Preretinal Glia
As shown in Figure 5D and Figure 6D, donors 2 and 3 had glial membranes on the vitreo-retinal surface. The glial cells on the vitreo-retinal surface in donor 2 were not very dense and did not appear to create a substantial membrane (see Fig. 5D). Donor 3 had a preretinal membrane comprised of GFAP and vimentin double-positive cells, which roughly corresponded with the central area of RPE atrophy in the fundus photographs but the membrane appeared slightly larger than the area than RPE atrophy (see Figs. 6A, 6D). Higher magnification imaging demonstrated the complexity and density of donor 3’s glial membrane (Fig. 7). This multilayered structure contained both processes and suspected individual astrocytes (GFAP-positive) and Müller cells (GFAP and vimentin double-positive). Although most cells and processes were positive for both vimentin and GFAP, some expressed only one or the other. In some areas, glial processes created whorls where they exited or entered the retina (Fig. 7A, arrowheads).
Figure 7.
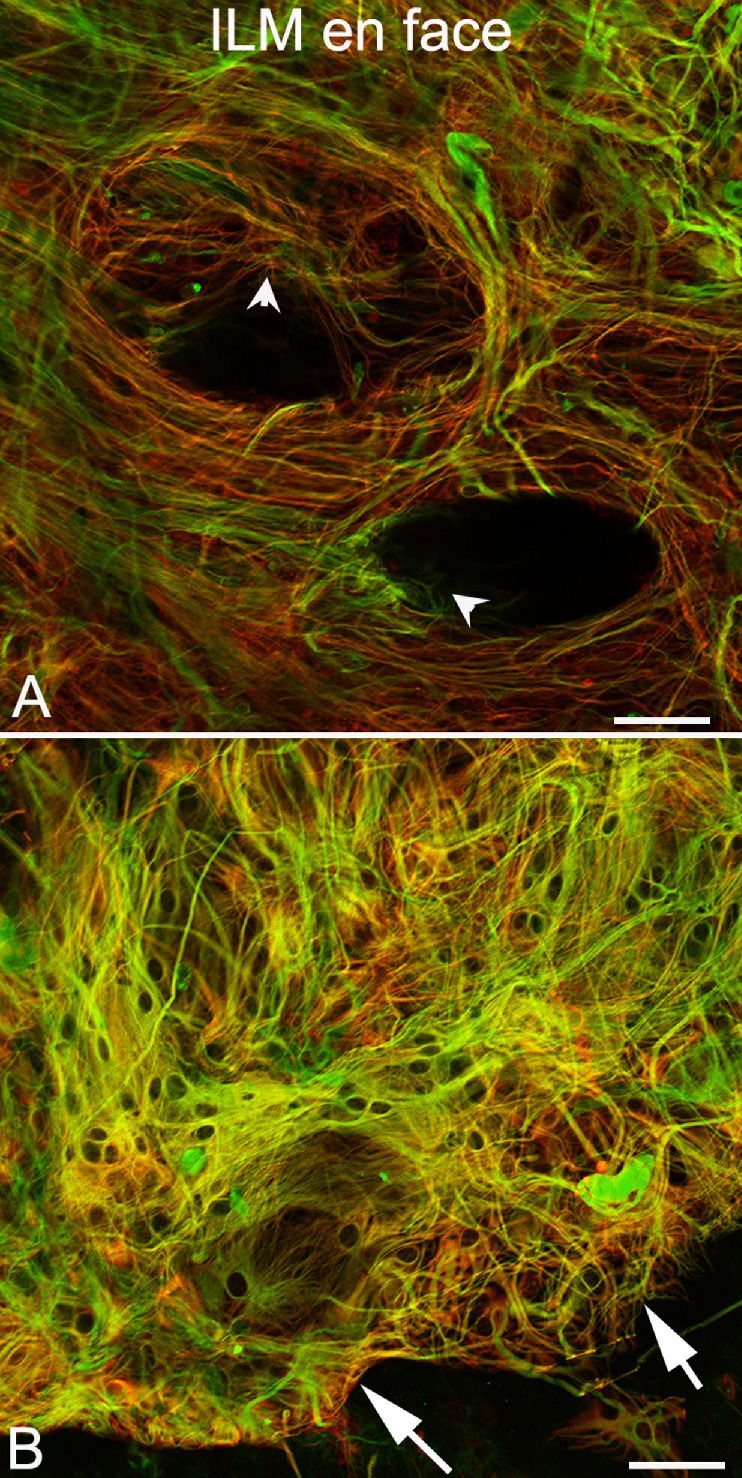
Preretinal glia in donor 3. Imaging of the retina shown in Figure 6, with GFAP (red) and vimentin (green), at higher magnification demonstrates that Müller cells and astrocytes on the vitreoretinal surface form a complex structure. (A) In one area, cells have long processes, which form swirls with some cells diving into the retina (arrowheads) where they make contact with retinal cells. (B) In other areas, individual cells appear overlapping one another on the vitreoretinal surface. Arrows indicate the clear border of this preretinal membrane, which correlates with the border of RPE atrophy.
Subretinal Glia
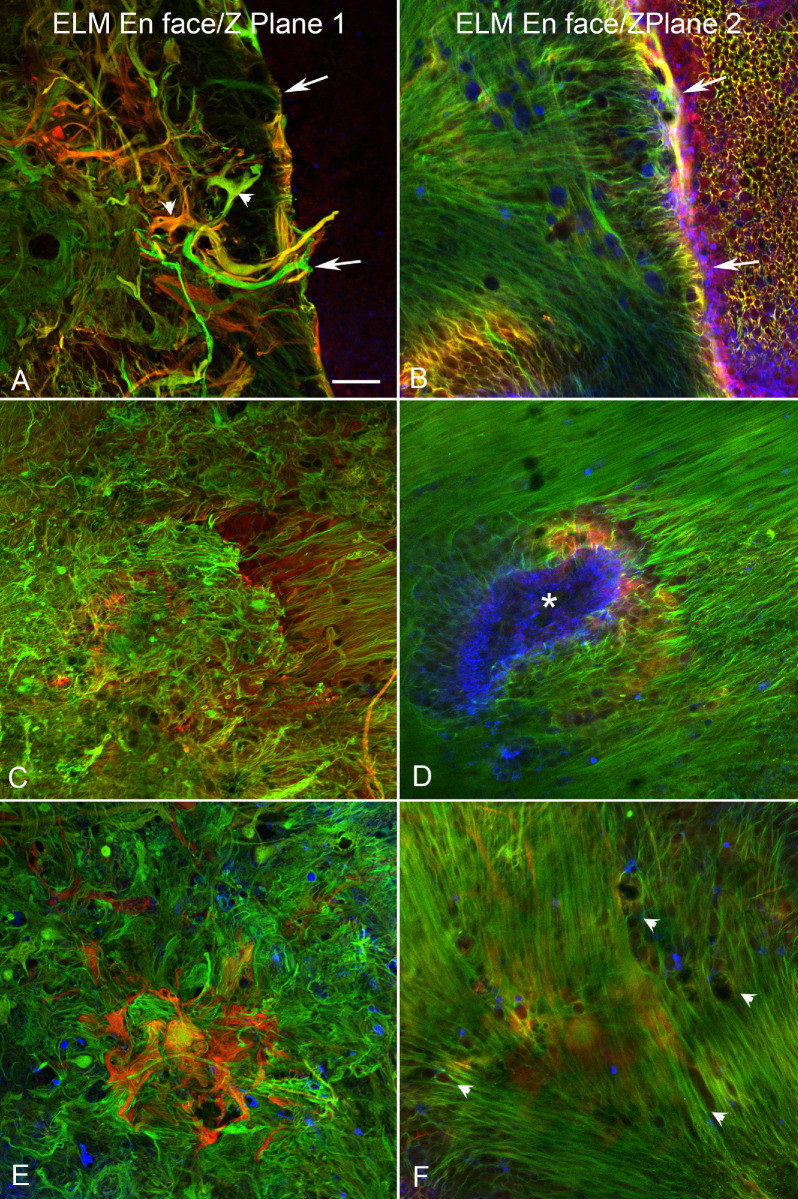
All three retinas had glial cells occupying the subretinal space that were positive for both GFAP and vimentin (see Figs. 4C, 5C, 6C). Comparison to gross photographs demonstrated that these glial membranes closely matched the areas of RPE atrophy. Indeed, the areas of RPE loss, CC attenuation, and glial membranes were significantly correlated in all three eyes (see Supplementary Fig. S5). All subretinal glial structures had succinct, well-defined borders, as did the atrophic area. Even at low magnification, it was apparent that these glial cells created membrane or scar-like structures corresponding to the identified regions of atrophy. Higher magnification demonstrated that these structures were multilayered. These structures appeared to consist primarily of glial processes, although some individual cells were observed (Fig. 8). Based on the co-expression of GFAP and vimentin, these membranes likely consist of Müller cells and processes. Although the processes at the confocal plane posterior to the ELM were extremely disorganized (Figs. 8A, 8C, 8E, plane 1), there was a more organized pattern at the ELM focal plane (Figs. 8B, 8D, 8F, plane 2). Müller cells at this focal plane appeared to extend across the outer retinal surface. In some areas, these cells had an elongated ELM-like appearance but processes did not terminate at this point. Rather, they continued into the subretinal space.
Figure 8.
Subretinal membrane in donor 3 is complex and multilayered. The retina of donor 3, stained with GFAP (red) and vimentin (green) and imaged with the ELM en face is shown at higher magnification. (A) Vimentin/GFAP-double-positive Müller cells have thick processes, which create a sharp border around the atrophic area (arrows). Some individual cells are also observed (arrowheads). (B) In the focal plane of the ELM (13.8 µm away), an intact ELM is observed to the right of the glial membrane border (arrows). Rather than terminating and making junctions to create a honeycomb-like pattern, glial processes within the atrophic area extend along the retinal surface (i.e. lateral). Connections appear to exist between the Müller cell processes. (C) Toward the center of the atrophic area, the Müller cells are very dense and appear disorganized. (D) In the focal plane of the ELM, Müller cells are surrounding isolated PNA-positive surviving cone segments (blue, asterisk). (E) In the center of the Müller cell membrane external to the ELM, GFAP and vimentin-positive cells appear disorganized, creating a dense structure. (F) At the ELM focal plane, Müller cell processes extend horizontally across the posterior retinal surface and having the appearance of fibroblastic scar (arrowheads). Scale bar indicates 50 µm for all images.
Donor 3 had surviving PNA-positive outer segments visible in finger-like projections throughout the outer retinal atrophic zone (see Fig. 6C, blue staining). At higher magnification, these did not appear to be photoreceptor segments based on their size but rather PNA-positive debris. Interestingly, some PNA-positive structures were observed at the ELM focal plane internal to the membrane in the center of the atrophic area (see Fig. 8D, blue staining, asterisk). The Müller cell process pattern was disrupted in this area with the observed processes appearing to extend toward the PNA-positive debris or segments.
Cross-Sectional Analysis of Retinas
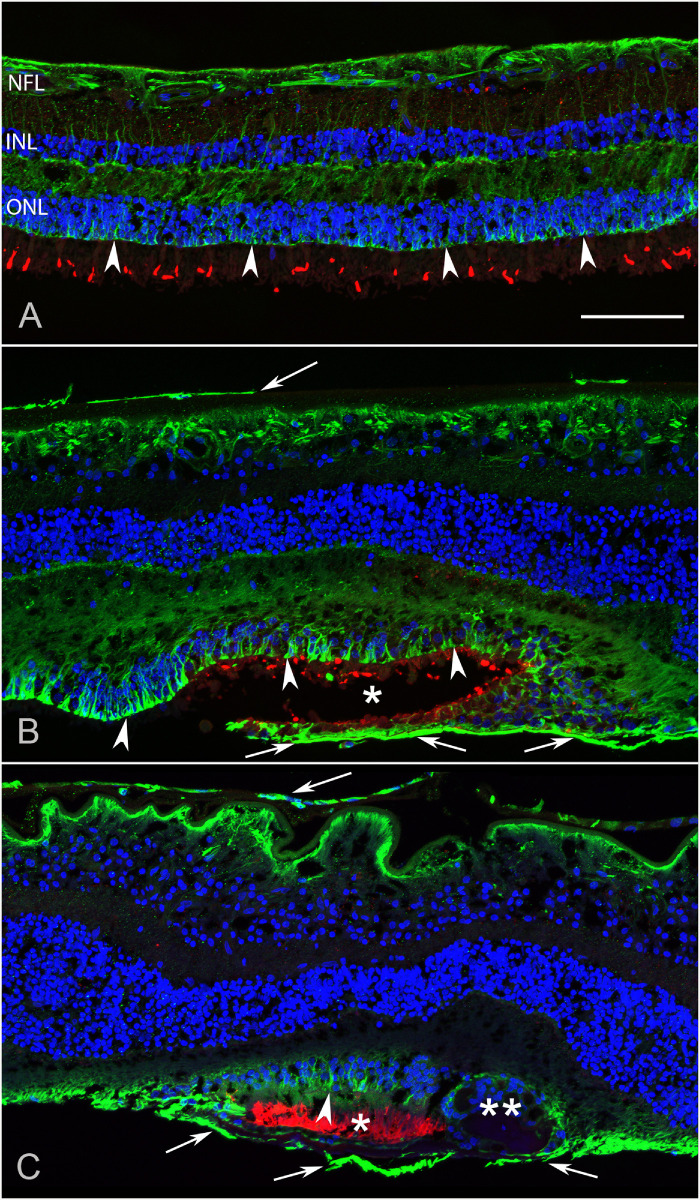
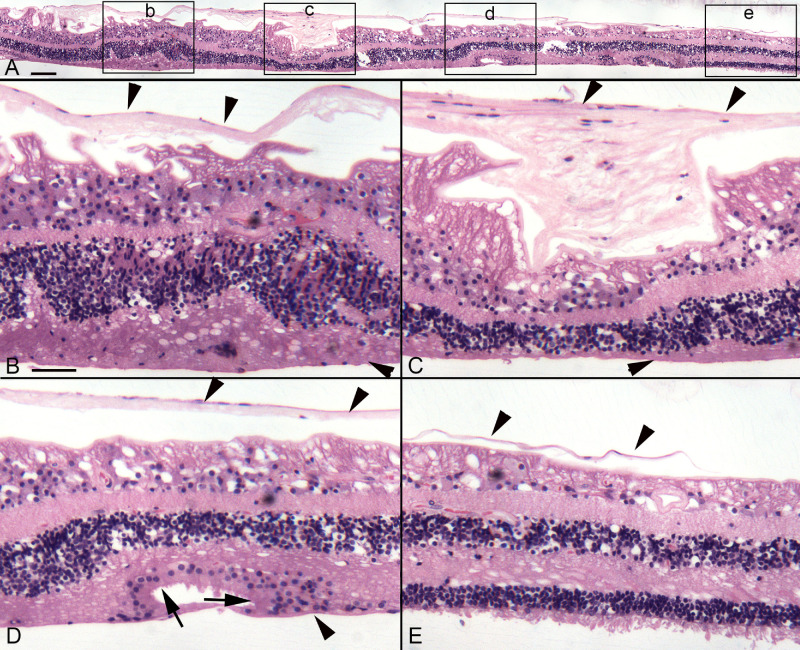
The retina from donor 3 was hemisected after imaging, with half being flat embedded in JB-4 for better cross-sectional cytological detail, whereas the other half was cryopreserved and sectioned for additional confocal imaging. JB-4 sections and imaging of the cryosections confirmed that glial membranes were present both on the vitreal side of the ILM and external to the ELM within the subretinal space (Figs. 9, 10). Cross- sectional analysis of the cryopreserved half of donor 3’s flatmount retina demonstrated areas with preserved photoreceptors were surrounded by vimentin-positive Müller cell processes (Figs. 9B, 9C, asterisks). A continuous ELM (arrowheads) was observed with vimentin staining in these structures, suggesting they could be outer retinal tubulations (ORTs). In some sections, a second smaller and more circular area of preserved photoreceptors was observed surrounded by Müller cell processes, again suggesting tubulations or rosette-like profiles (see Fig. 9C). JB-4 sections of this same retina stained with H&E demonstrated similar structures where the ELM appeared to be present (Fig. 10D). A thick glial membrane was evident external to the surviving photoreceptors. The large glial membrane on the vitreo-retinal surface was observed and appeared to exert traction on the retina below (see Fig. 10).
Figure 9.
Cross section analysis of donor 3’s retina. The flatmount retina of donor 3 was cryopreserved and sectioned to analyze the retinal structure. (A) In the nonaffected area, cone photoreceptor outer segments are visible when stained with PNA (red). Müller cell processes stained with vimentin (green) are linear and organized terminating at the ELM (arrowheads). All retinal layers are evident with DAPI staining of nuclei (blue). (B) At the border of the atrophic area, retinal lamination is severely affected with abnormal structures, containing Müller cells with intact ELM (arrowheads) creating almost a complete circle with surviving photoreceptors (asterisk). This may be a nascent outer retinal tubulations (ORTs). External to this structure a vimentin-positive membrane is evident (arrows). A preretinal membrane is also observed (arrow at the ILM). (C) In another area, there is a structure resembling an ORT in which Müller cells and an apparent intact ELM surround surviving photoreceptor outer segments (asterisk). Adjacent to this large structure is a smaller structure created by Müller cell processes with numerous nuclei inside (double asterisk). The subretinal glial membrane is also evident (arrows). The retina has a folded morphology, potentially due to traction on the retina from the preretinal glial membrane (arrows). NFL, nerve fiber layer; INL, inner nuclear layer; ONL, outer nuclear layer. Scale bars indicate: 100 µm.
Figure 10.
JB-4 sections of donor 3’s retina. The other half of the retina from donor 3 was embedded in JB-4, 2 µm sections cut, and stained with hematoxylin and eosin. (A) A panoramic image shows the retina from the atrophic area (left) to a relatively normal but thin area (right). Boxes indicate the areas shown at higher magnification in B to E. (B) Within the atrophic area, a large preretinal membrane is observed (down-facing arrowheads) and retinal lamination is affected as evident by stress fibers within the ganglion cell layer. The ONL is thickened in this area but cells are displaced as are those in the INL. (C) The preretinal glial membrane is thicker in this area, resulting in severe traction on the retina and loss of retinal lamination. The ONL is thinner and the INL is displaced. A membrane is also evident in the subretinal space (arrowhead). (D) Although stress marks are still evident in the ganglion cell layer, the retinal lamination is better than in other areas. An apparent ORT is evident in which the ELM is intact (arrows). (E) At the atrophic border, the ONL is thin but outer segments are present. Numerous cells are displaced from the INL, migrating through the outer plexiform layer. The preretinal membrane (up-facing arrowheads) is present but appears to be ending where the atrophy ends. Scale bars indicate: A: 100 µm, B–E: 50 µm.
Choroidal Flatmount Analysis
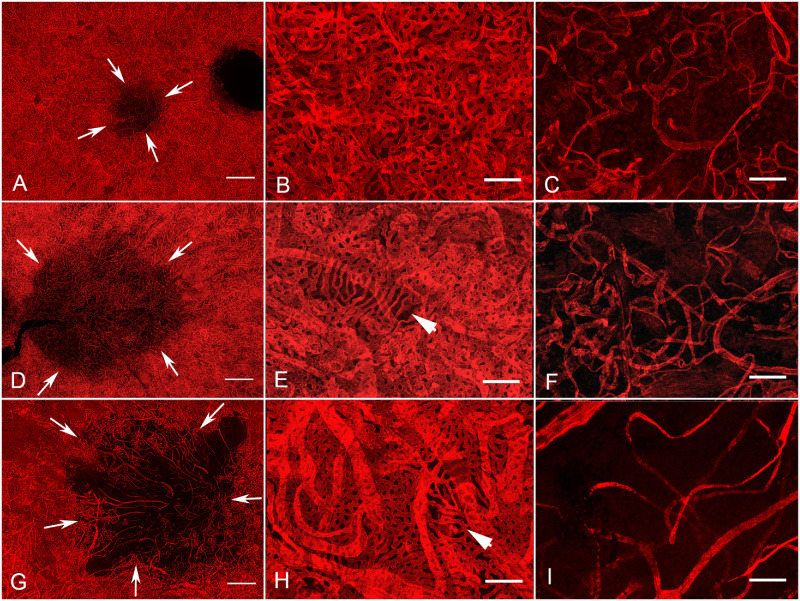
Choroidal images are shown in Figure 11 based on the severity of affected CC. Donor 2 had the smallest atrophic area (Fig. 11A; 3.3 mm2). Although the perimacular region was well preserved in this choroid (Figs. 11B, 12A), there was significant reduction in CC within the submacular region (Fig. 11C). This loss resulted in a significant decrease in the percent vascular area (VA, 22 +/− 3.1%) and, even more drastically, in the CC diameter compared to the perimacular region (see Fig. 12). Donor 3 had an affected area that was 23.1 mm2 (Figs. 11D; 12A). Although the CC in the perimacular region was conserved with 71.2% VA (+/− 5.2; Figs. 11E, 12B), there was a significant reduction to 22% VA (+/− 7.6) in the submacular region (Figs. 11F, 12B). CC diameter was also reduced in the submacular region compared to the perimacula but not as drastically as was observed in donor 2 (see Figs. 11F, 12C). Donor 1 had the largest area of CC loss (Figs. 11G, 12A). The CC was well preserved in the perimacular region with 80% (+/− 2.2) VA but the submacular CC was significantly reduced to 10.8%VA (+/− 1.8; see Fig. 12B). Although the CC diameter was reduced, this was not significantly different compared to the diameter in the perimacular region (Figs. 11H, 11I, 12C). Thus, whereas donor 2 had the smallest area of CC affected, the greatest reduction in CC diameter was observed in this donor. However, the numbers for donor 1’s CC diameters may be skewed because only intermediate and a few large blood vessels remained in the lesion area. It must be mentioned that the identification of CC versus intermediate versus large blood vessels is difficult when there is such widespread vascular loss, as in donor 1. When the percent VA was compared between the perimacular region (see Figs. 11B, 11E, 11H) and the submacular region (see Figs. 11C, 11F, 11I), there was a significant reduction in all three donor eyes (see Fig. 12B).
Figure 11.
Comparison of affected and non affected areas of UEA-stained choroid in donors clinically diagnosed with STGD. The choroids of all three donors clearly demonstrate the CC loss. Choroid images are shown here in order by the size of the affected area. (A) Low magnification image of donor 2 reveals a small area of CC loss (arrows). (B) In the perimacular region, CC density is normal and organized. (C) CC loss is evident in the submacular region. The CC, intermediate, and large vessels remaining are tortuous and disorganized. (D) The choroid of donor 3 has a larger area of CC loss (arrows). (E) Higher magnification of the perimacular, nonatrophic, region demonstrates a relatively normal CC pattern with one small area having some CC attenuation (arrowhead). (F) Higher magnification of the submacular, affected area reveals severe attenuation of the CC with only some intermediate vessels remaining. (G) Low magnification of donor 1 choroid reveals an even larger area of CC loss (arrows). (H) High magnification of the perimacular region reveals an intact CC except one small area (arrowhead). (I) High magnification of the affected area demonstrates the severity of CC loss in submacular choroid. This choroid has the fewest remaining viable vessels in submacula and those surviving appeared to be intermediate based on their diameter. Scale bars indicate: A, D, and G: 1 mM; B, C, E, F, H, and I: 100 µM.
Figure 12.
Analysis of choroidal changes in all eyes with clinically diagnosed STGD. (A) The area of CC loss in each donor choroid is shown in mm2. (B) The percent vascular area is shown for each choroid in both the submacular (SM; red) and perimacular (PM; blue) regions. (C) The average CC diameter collected from three fields within the perimacular (PM; blue) or submacular (SM; red) region of each choroid is shown. Error bars indicate the standard deviation in B and C (H700, aged control; FFB 1012, donor 2; FFB 878, donor 3; and FFB 863, donor 1).
Discussion
To our knowledge, this is the first report on flatmount analysis of STGD retinas and choroids. In each of the three donors clinically diagnosed with STGD, severe attenuation of the CC was observed in areas with RPE atrophy. Areas with an intact RPE monolayer had a CC with normal density and luminal diameter. RPE loss was accompanied by the extension of Müller cell processes into the subretinal compartment in all three donors’ eyes. Despite each being clinically diagnosed with STGD, genetic testing only confirmed this in donor 1. DNA from donor 2 was not of sufficient quality to determine the genetic mutation. Genetic testing demonstrated that donor 3 was misdiagnosed with STGD and rather suffered with macular degeneration resulting from the identified PRPH2 mutation. This report highlights the similarities in clinical features that can be caused by mutations in different genes. It also emphasizes the importance of verifying specific genetic causes of retinal degenerations.
Although CC loss was observed in each of the donor eyes studied, there was a difference in the severity and pattern of this loss. The variation in the area of affected CC could be due to the duration of disease or the etiology of the degeneration. Unfortunately, even though the ages were quite similar (66, 69, and 72 years old), the complete clinical history of the individual donors was not available so comparisons cannot be made among the different mutations, disease severity, and time since onset of the degenerations is unknown. It is possible that donor 1, with the largest lesion, had a longer disease progression due to the earlier onset of STGD. However, loss of CC, intermediate, and large blood vessels is in complete agreement with angiographic and OCTA clinical observations of STGD, where it is called the dark atrophy.18 Environmental factors could also contribute to disease progression and the rate of CC loss.
Donor 2 had the smallest area of CC loss but the CC diameter was the most severely affected. Unfortunately, without genetic information on this donor, the STGD diagnosis cannot be verified. Interestingly, donors with confirmed STGD and macular degeneration due to a mutation in PRPH2 had similar patterns of atrophy but were far different in severity of CC loss. In the STGD eye, there was loss of the intermediate and large vessels as well as CC, whereas only CC was affected in the eye with the PRPH2 mutation. In both cases, CC loss was most prominent in areas with RPE atrophy (see Supplementary Figs. S2–S4). If one looks at areas of RPE affected versus areas of CC loss, the areas of CC loss is slightly greater or almost equivalent (see Supplementary Fig. S2), perhaps suggesting that CC loss occurs before RPE degeneration. A short coming of our analysis is that the RPE area is based on gross images without considering the curvature of the eye. However, if one looks at the CC density versus area of RPE loss (Supplementary Figs. S2–S5), there are areas with fairly dense CC where RPE loss has already occurred. This is true even in donor 1 with the most advanced atrophy of all choroidal blood vessels (see Supplementary Fig. S3D). Support for RPE loss occurring first comes from geographic atrophy (GA) in which RPE atrophy appears to precede CC degeneration based on the same choroidal vascular technique used in the current study.24,25 An ultrastructural study by Biesemeier et al., however, found CC loss beyond the border of RPE atrophy.26 Recent OCTA studies suggest that there is loss of CC beyond the area of RPE atrophy in STGD16 and geographic atrophy,27–29 which they call flow deficits. However, it is not known if flow deficits represent actual CC loss, as measured herein, or simply a decrease in blood flow in those areas. Unfortunately, the sequence of events cannot be definitively determined from the histologic specimens. Only a histopathological investigation of postmortem eyes with recent OCTA and fundus autofluorescence (FAF) could answer which cell type dies first in these retinal degenerations.
The CC dependence on RPE-derived VEGF is well-documented in mice.30 Therefore, it is possible that, if RPE loss occurs first, CC attenuation results from the RPE death and subsequent decreases in VEGF. Although CC density was maintained in some areas of RPE loss, CC was also attenuated in donor 1’s peripapillary region, where RPE were spared. This observation suggests that A2E may also directly affect the choroidal vessels. Furthermore, A2E toxicity could explain why intermediate and large choroidal vessels were also affected only in donor 1, who should be a mildly affected STGD based on their genotype. Thus, two different mechanisms may contribute to CC death in STGD; reduced RPE-derived VEGF and A2E toxicity.
Extensive Müller cell remodeling was observed in each of the three eyes with clinically diagnosed STGD. The activation and gliotic response of Müller cells in the fellow eye of donor 1 in this study has recently been reported.7 Interestingly, this remodeling was not identical among the retinas. Donors 2 and 3 had preretinal membranes, whereas only isolated glial cells were observed on the vitreo-retinal surface of donor 1’s retina. Previous reports have demonstrated glial processes on the vitreo-retinal surface of both normal and diseased retinas.9,31,32 A majority of older retinas have only isolated glial cells overlying large blood vessels, whereas larger membranes are associated with disease.9 This observation was confirmed by the control shown herein. Interestingly, donor 2’s preretinal membrane was not evident on the OCT images. A similar observation was recently made regarding subclinical preretinal membranes in eyes with neovascular AMD.9 The membrane is likely too thin and close to the retina to be resolved. These subclinical membranes may be precursors to larger, clinically relevant epiretinal membranes of which Müller cells are a key component. Although the American Society of Retina Specialists estimates that epiretinal membranes occur in 2% of people over aged 50 years and 20% of those over 75 years, the occurrence of smaller, nonclinically relevant membranes is likely much higher. The preretinal membrane in donor 2 was observed panretinally and the RPE atrophy only occupied part of the posterior pole. Therefore, it does not seem likely that the preretinal membrane resulted from RPE degeneration. Rather, other factors, such as trauma or vitreal cytokines, may have contributed to the formation of this membrane. This donor also had multiple areas with apparent retinal detachment in the FM and SLO images (see Fig. 1). Although it cannot be ruled out that this detachment occurred postmortem, such detachment could outline areas of susceptibility and lead to tissue remodeling. Unfortunately, the entire ophthalmic history is unknown for these donors.
Although the mechanisms behind macular degeneration are not yet fully understood, peripherin 2 is important in the formation and maintenance of outer segments.33 Therefore, the defect stems from dysfunction in photoreceptors rather than in RPE as in STGD. Although it has recently been shown that photoreceptors die first in STGD, this is believed to be due to dysfunction in the RPE cells.16,34 The preretinal membrane in donor 3, the donor with a PRPH2 mutation, correlated closely with the area of RPE and photoreceptor loss. This suggests that both pre- and subretinal glial membrane formations occurred as a result of photoreceptor loss induced by the PRPH2 mutation. It is possible that subtle changes to photoreceptors in patients with PRPH2 mutations cause Müller cell activation and remodeling earlier in life despite the fact that clinical symptoms generally appear in the fifth decade of life.33 It has been suggested that oxidative stress, autophagy, and the release of toxic factors from dying cells all contribute to macular degenerations associated with PRPH2 mutations.33,35–37 These factors could all contribute to and/or result from Müller cell remodeling. This would explain why Müller cell remodeling was greater in the PRPH2 donor, even though the STGD degeneration probably occurred over a longer period of time. Whereas it is also possible that vitreal changes occur that could stimulate Müller cell membrane formation, this would not explain why the Müller cell membrane was confined to the posterior pole and matched the RPE degeneration area. Extensive preretinal membranes have also been reported in the eyes of donors with Choroideremia and retinitis pigmentosa as well as neovascular AMD (9; Edwards et al., IOVS, 2019; ARVO E-abstract; 60(9):4388). In neovascular AMD eyes, as in donor 3, the preretinal membranes were confined to the posterior pole and internal to the choroidal neovascularization.9 Together, this data further suggests that, at least in some retinal degenerations, changes within the retina stimulate preretinal membrane formation by Müller cells and astrocytes. Future studies will investigate membrane formation in rodents with retinal degenerations to determine the time course and potential inhibition of these membranes.
In contrast to preretinal membranes, subretinal glial membranes were observed in all three of the diseased eyes investigated. Moreover, these structures always correlated almost exactly with areas of RPE and CC atrophy. Thus, one could hypothesize that the Müller cell extension into the subretinal space is a direct result of the photoreceptor and/or RPE loss. Similar membranes have been reported in eyes with GA as well as other retinal degenerations.8,11–13 Müller cells have also been reported to create “glial seals” at the level of the ELM in rodents with retinal degenerations.38 It has been speculated that Müller cells respond to the loss of their ELM binding partner, photoreceptors, by extending their processes into the subretinal space and attempting to create a Müller cell-Müller cell ELM-like membrane. In STGD and PRPH2 macular degeneration retinas, as in GA retinas, the Müller cells appear to extend horizontally at the level of the ELM. In some areas, it appears as though the honeycomb-like structure normally seen by Müller cells at the ELM is elongated laterally. This, however, only represents one layer of the subretinal membrane observed in eyes with STGD, PRPH2 macular degeneration, and GA.8 The Müller cell processes also extend further into the subretinal space to the level of the RPE. As recently reported in GA retinas, the Müller cells at the border of the atrophic area are in direct contact with RPE cells.8 Also similar to GA, the Müller cell subretinal membranes have a distinct border. Rather than the membrane just stopping at the border, as seen in GA, the Müller cells in both the STGD and PRPH2 retinas reported herein appear to create a border by extending processes circumscribing the atrophic area. This was most evident in donor 3, which had the PRPH2 mutation. The glial membrane also appeared denser in this eye. Perhaps this is due to the fact that photoreceptors are affected primarily in this disease whereas the primary defect in STGD is in RPE cells. Although these Müller cells create a dense, multilayered structure, not enough samples were available to determine whether these cells create an ELM-like barrier or a thicker scar-like structure with extracellular matrix proteins. This will be the focus of future studies. If Müller cells are able to create an ELM by binding to one another, this may help prevent nutrients or toxins in the subretinal space from entering the retina. In this manner, it would protect the retina from further damage. On the other hand, if these Müller cell processes create a scar with extracellular matrix proteins (such as proteoglycans, collagen, and laminin) then the diffusion of therapeutics and migration of progenitors in stem cell therapy into the retina could also be significantly reduced. Therefore, it is imperative that future studies characterize these glial structures to determine how they may influence disease progression and treatment.
A recent study identified early thickening of the ELM in eyes with STGD before the loss of photoreceptors and suggested that these may reflect Müller cell changes.14 It is possible that this ELM thickening corresponds to the subretinal membranes reported herein. It is thought that photoreceptors die in STGD due to the accumulation of toxic bis-retinoids and lipofuscin resulting from an impaired retinoid cycle. RPE dysfunction appears to occur first due to accumulation of A2E.39 It is not known, however, whether A2E has any effect on Müller cells or CC. As mentioned above, the observation that CC was affected even in the peripapillary region where RPE were spared suggests that A2E may affect the choroidal vessels as well as RPE. Furthermore, A2E toxicity could explain the loss of CC, intermediate, and large vessels only in donor 1, who should be a mildly affected STGD based on their genotype. Perhaps A2E itself stimulates Müller cell changes and subretinal membrane formation and/or it is toxic to endothelial cells resulting in the significant loss of blood vessels in choroid posterior to RPE death. Early Müller cell remodeling could alter their function and metabolism, and have detrimental consequences for all retinal cells. Therefore, it is important that future studies investigate whether Müller cells are in fact affected early in STGD or secondary to photoreceptor death.
Another interesting observation is areas with surviving photoreceptors cells within the atrophic area in donor 3’s retina. In addition to finger-like projections containing surviving photoreceptor cells that were observed throughout the atrophic lesion, other structures were observed in cross section that appeared to be ORTs that have recently been reported in GA as well as STGD.40–44 The ELM in ORTs appeared to be intact with surviving photoreceptors present in the area and within the ORTs (see Fig. 10). In some areas, there appeared to be incomplete ORTs. It has been speculated that ORTs are created by Müller cells as a means of helping protect photoreceptors.41,44 Indeed, Müller cells are known to supply cone-specific chromophores (11-cis-retinol) and are present in a 1:1 ratio with cones in the fovea.45–47 Therefore, Müller cells may promote the survival of some cones in donors with the peripherin2 mutation.
In conclusion, this study demonstrates extensive loss of the CC in areas of RPE atrophy in eyes clinically diagnosed with STGD, regardless of the genetic mutation present. The bona fide STGD donor had the largest area of degeneration and the most substantial CC attenuation, even though they had a mild STGD genotype. It appears that this STGD donor had minimal intermediate choroidal vessels remaining and no CC below the lesion, whereas the PRPH2 donor had CC, and large and intermediate blood vessels remaining, suggesting that A2E may be toxic for choroidal endothelial cells. This report also characterized Müller cell remodeling in the retina of eyes with STGD and macular degeneration associated with a PRPH2 mutation. Although all donors demonstrated subretinal glial membranes, glial membranes on the vitreo-retinal surface were detected only in donors 2 and 3. Based on the confinement of the membrane to the posterior pole, anterior to RPE atrophy, it is hypothesized that the preretinal glial membrane observed on donor 3’s retina resulted from severe retinal remodeling. One might expect more extensive retinal remodeling in a disease like PRPH2 where the initial defect is in photoreceptors, the binding partner for Müller cells at the ELM. Future research will be aimed at better understanding the Müller cell response to retinal degenerations.
Supplementary Material
Acknowledgments
The authors thank Gayle Pauer for performing DNA isolation and Meghan J. DeBenedictis for helping with genetic testing. The authors also wish to thank the Foundation Fighting Blindness for setting up the Eye Tissue Repository as well as the donors and their families for their generous contribution to science. The collection is maintained with funds from the Cleveland Clinic.
Supported by the National Eye Institute RO1EY016151 (GL), RO1EY027750 (VLB), National Eye Institute P30 Core Grants to the Cleveland Clinic (P30EY025585), and the Wilmer Eye Institute Core grant (P30EY001765), unrestricted grants from Research to Prevent Blindness to Cole Eye Institute and the Wilmer Eye Institute, and The BrightFocus Foundation (VLB and MME). Also supported by the Cleveland Eye Bank Foundation Institute Grant. Donor eyes were obtained through the Foundation Fighting Blindness (FFB) Eye Donor Program.
Disclosure: M.M. Edwards, None; V.L. Bonilha, None; I.A. Bhutto, None; B.A. Bell, None; D.S. McLeod, None; J.G. Hollyfield, None; G.A. Lutty, None
References
- 1. Riveiro-Alvarez R, Aguirre-Lamban J, Lopez-Martinez MA, et al.. Frequency of ABCA4 mutations in 278 Spanish controls: an insight into the prevalence of autosomal recessive Stargardt disease. Br J Ophthalmol. 2009; 93: 1359–1364. [DOI] [PMC free article] [PubMed] [Google Scholar]
- 2. Allikmets R. A photoreceptor cell-specific ATP-binding transporter gene (ABCR) is mutated in recessive Stargardt macular dystrophy. Nat Genet. 1997; 17: 122. [DOI] [PubMed] [Google Scholar]
- 3. Boon CJ, van Schooneveld MJ, den Hollander AI, et al.. Mutations in the peripherin/RDS gene are an important cause of multifocal pattern dystrophy simulating STGD1/fundus flavimaculatus. Br J Ophthalmol. 2007; 91: 1504–1511. [DOI] [PMC free article] [PubMed] [Google Scholar]
- 4. Klien BA, Krill AE. Fundus flavimaculatus. Clinical, functional and histopathologic observations. Am J Ophthalmol. 1967; 64: 3–23. [PubMed] [Google Scholar]
- 5. Cideciyan AV, Aleman TS, Swider M, et al.. Mutations in ABCA4 result in accumulation of lipofuscin before slowing of the retinoid cycle: a reappraisal of the human disease sequence. Hum Mol Genet. 2004; 13: 525–534. [DOI] [PubMed] [Google Scholar]
- 6. Eagle RC Jr, Lucier AC, Bernardino VB Jr, Yanoff M. Retinal pigment epithelial abnormalities in fundus flavimaculatus: a light and electron microscopic study. Ophthalmology. 1980; 87: 1189–1200. [DOI] [PubMed] [Google Scholar]
- 7. Bonilha VL, Rayborn ME, Bell BA, Marino MJ, Fishman GA, Hollyfield JG. Retinal histopathology in eyes from a patient with Stargardt disease caused by compound heterozygous ABCA4 mutations. Ophthalmic Genet. 2016; 37: 150–160. [DOI] [PubMed] [Google Scholar]
- 8. Edwards MM, McLeod DS, Bhutto IA, Grebe R, Duffy M, Lutty GA. Subretinal glial membranes in eyes with geographic atrophy. Invest Ophthalmol Vis Sci. 2017; 58: 1352–1367. [DOI] [PMC free article] [PubMed] [Google Scholar]
- 9. Edwards MM, McLeod DS, Bhutto IA, Villalonga MB, Seddon JM, Lutty GA. Idiopathic preretinal glia in aging and age-related macular degeneration. Exp Eye Res. 2016; 150: 44–61. [DOI] [PMC free article] [PubMed] [Google Scholar]
- 10. Jones BW, Lewis GP.. Special issue on retinal remodeling. Exp Eye Res. 2016; 81: 123–137. [DOI] [PubMed] [Google Scholar]
- 11. Jones BW, Marc RE. Retinal remodeling during retinal degeneration. Exp Eye Res. 2005; 81: 123–137. [DOI] [PubMed] [Google Scholar]
- 12. Sethi CS, Lewis GP, Fisher SK, et al.. Glial remodeling and neural plasticity in human retinal detachment with proliferative vitreoretinopathy. Invest Ophthalmol Vis Sci. 2005; 46: 329–342. [DOI] [PubMed] [Google Scholar]
- 13. Jones BW, Pfeiffer RL, Ferrell WD, Watt CB, Marmor M, Marc RE. Retinal remodeling in human retinitis pigmentosa. Exp Eye Res. 2016; 150: 149–165. [DOI] [PMC free article] [PubMed] [Google Scholar]
- 14. Lee W, Noupuu K, Oll M, et al.. The external limiting membrane in early-onset Stargardt disease. Invest Ophthalmol Vis Sci. 2014; 55: 6139–6149. [DOI] [PMC free article] [PubMed] [Google Scholar]
- 15. Birnbach CD, Jarvelainen M, Possin DE, Milam AH. Histopathology and immunocytochemistry of the neurosensory retina in fundus flavimaculatus. Ophthalmology. 1994; 101: 1211–1219. [DOI] [PubMed] [Google Scholar]
- 16. Alabduljalil T, Patel RC, Alqahtani AA, et al.. Correlation of outer retinal degeneration and choriocapillaris loss in Stargardt disease using en face optical coherence tomography and optical coherence tomography angiography. Am J Ophthalmol. 2019; 202: 79–90. [DOI] [PMC free article] [PubMed] [Google Scholar]
- 17. Muller PL, Fimmers R, Gliem M, Holz FG, Charbel Issa P. Choroidal alterations in Abca4-related retinopathy. Retina. 2017; 37: 359–367. [DOI] [PubMed] [Google Scholar]
- 18. Pellegrini M, Acquistapace A, Oldani M, et al.. Dark atrophy: an optical coherence tomography angiography study. Ophthalmology. 2016; 123: 1879–1886. [DOI] [PubMed] [Google Scholar]
- 19. Arrigo A, Romano F, Aragona E, et al.. OCTA-based identification of different vascular patterns in Stargardt disease. Transl Vis Sci Technol. 2019; 8: 26. [DOI] [PMC free article] [PubMed] [Google Scholar]
- 20. Bagheri N, Bell BA, Bonilha VL, Hollyfield JG. Imaging human postmortem eyes with SLO and OCT. Adv Exp Med Biol. 2012; 723: 479–488. [DOI] [PubMed] [Google Scholar]
- 21. McLeod DS, Bhutto I, Edwards MM, Silver RE, Seddon JM, Lutty GA. Distribution and quantification of choroidal macrophages in human eyes with age-related macular degeneration. Invest Ophthalmol Vis Sci. 2016; 57: 5843–5855. [DOI] [PMC free article] [PubMed] [Google Scholar]
- 22. Seddon JM, McLeod DS, Bhutto IA, et al.. Histopathological insights into choroidal vascular loss in clinically documented cases of age-related macular degeneration. JAMA Ophthalmol. 2016; 134: 1272–1280. [DOI] [PMC free article] [PubMed] [Google Scholar]
- 23. Lutty GA, Merges C, Threlkeld AB, Crone S, McLeod DS. Heterogeneity in localization of isoforms of TGF-beta in human retina, vitreous, and choroid. Invest Ophthalmol Vis Sci. 1993; 34: 477–487. [PubMed] [Google Scholar]
- 24. McLeod DS, Grebe R, Bhutto I, Merges C, Baba T, Lutty GA. Relationship between RPE and choriocapillaris in age-related macular degeneration. Invest Ophthalmol Vis Sci. 2009; 50: 4982–4991. [DOI] [PMC free article] [PubMed] [Google Scholar]
- 25. McLeod DS, Taomoto M, Cao J, Zhu Z, Witte L, Lutty GA. Localization of VEGF receptor-2 (KDR/Flk-1) and effects of blocking it in oxygen-induced retinopathy. Invest Ophthalmol Vis Sci. 2002; 43: 474–482. [PubMed] [Google Scholar]
- 26. Biesemeier A, Taubitz T, Julien S, Yoeruek E, Schraermeyer U. Choriocapillaris breakdown precedes retinal degeneration in age-related macular degeneration. Neurobiol Aging. 2014; 35: 2562–2573. [DOI] [PubMed] [Google Scholar]
- 27. Borrelli E, Uji A, Sarraf D, Sadda SR. Alterations in the choriocapillaris in intermediate age-related macular degeneration. Invest Ophthalmol Vis Sci. 2017; 58: 4792–4798. [DOI] [PubMed] [Google Scholar]
- 28. Nassisi M, Shi Y, Fan W, et al.. Choriocapillaris impairment around the atrophic lesions in patients with geographic atrophy: a swept-source optical coherence tomography angiography study. Br J Ophthalmol. 2019; 103: 911–917. [DOI] [PubMed] [Google Scholar]
- 29. Thulliez M, Zhang Q, Shi Y, et al.. Correlations between choriocapillaris flow deficits around geographic atrophy and enlargement rates based on swept-source OCT imaging. Ophthalmol Retina. 2019; 3: 478–488. [DOI] [PMC free article] [PubMed] [Google Scholar]
- 30. Saint-Geniez M, Maharaj AS, Walshe TE, et al.. Endogenous VEGF is required for visual function: evidence for a survival role on muller cells and photoreceptors. PLoS One. 2008; 3: e3554. [DOI] [PMC free article] [PubMed] [Google Scholar]
- 31. Foos RY. Vitreoretinal juncture–simple epiretinal membranes. Albrecht Von Graefes Arch Klin Exp Ophthalmol. 1974; 189: 231–250. [DOI] [PubMed] [Google Scholar]
- 32. Foos RY. Vitreoretinal juncture; epiretinal membranes and vitreous. Invest Ophthalmol Vis Sci. 1977; 16: 416–422. [PubMed] [Google Scholar]
- 33. Stuck MW, Conley SM, Naash MI. PRPH2/RDS and ROM-1: historical context, current views and future considerations. Prog Retin Eye Res. 2016; 52: 47–63. [DOI] [PMC free article] [PubMed] [Google Scholar]
- 34. Gomes NL, Greenstein VC, Carlson JN, et al.. A comparison of fundus autofluorescence and retinal structure in patients with Stargardt disease. Invest Ophthalmol Vis Sci. 2009; 50: 3953–3959. [DOI] [PMC free article] [PubMed] [Google Scholar]
- 35. Kedzierski W, Bok D, Travis GH. Non-cell-autonomous photoreceptor degeneration in rds mutant mice mosaic for expression of a rescue transgene. J Neurosci. 1998; 18: 4076–4082. [DOI] [PMC free article] [PubMed] [Google Scholar]
- 36. Lohr HR, Kuntchithapautham K, Sharma AK, Rohrer B. Multiple, parallel cellular suicide mechanisms participate in photoreceptor cell death. Exp Eye Res. 2006; 83: 380–389. [DOI] [PubMed] [Google Scholar]
- 37. Vlachantoni D, Bramall AN, Murphy MP, et al.. Evidence of severe mitochondrial oxidative stress and a protective effect of low oxygen in mouse models of inherited photoreceptor degeneration. Hum Mol Genet. 2011; 20: 322–335. [DOI] [PubMed] [Google Scholar]
- 38. Hippert C, Graca AB, Barber AC, et al.. Muller glia activation in response to inherited retinal degeneration is highly varied and disease-specific. PLoS One. 2015; 10: e0120415. [DOI] [PMC free article] [PubMed] [Google Scholar]
- 39. Tanna P, Kasilian M, Strauss R, et al.. Reliability and repeatability of cone density measurements in patients with Stargardt disease and RPGR-associated retinopathy. Invest Ophthalmol Vis Sci. 2017; 58: 3608–3615. [DOI] [PMC free article] [PubMed] [Google Scholar]
- 40. Braimah IZ, Dumpala S, Chhablani J. Outer retinal tubulation in retinal dystrophies. Retina. 2017; 37: 578–584. [DOI] [PubMed] [Google Scholar]
- 41. Dolz-Marco R, Litts KM, Tan ACS, Freund KB, Curcio CA. The evolution of outer retinal tubulation, a neurodegeneration and gliosis prominent in macular diseases. Ophthalmology. 2017; 124: 1353–1367. [DOI] [PubMed] [Google Scholar]
- 42. Litts KM, Messinger JD, Dellatorre K, Yannuzzi LA, Freund KB, Curcio CA. Clinicopathological correlation of outer retinal tubulation in age-related macular degeneration. JAMA Ophthalmol. 2015; 133: 609–612. [DOI] [PubMed] [Google Scholar]
- 43. Litts KM, Messinger JD, Freund KB, Zhang Y, Curcio CA. Inner segment remodeling and mitochondrial translocation in cone photoreceptors in age-related macular degeneration with outer retinal tubulation. Invest Ophthalmol Vis Sci. 2015; 56: 2243–2253. [DOI] [PMC free article] [PubMed] [Google Scholar]
- 44. Schaal KB, Freund KB, Litts KM, Zhang Y, Messinger JD, Curcio CA. Outer retinal tubulations in advanced age-related macular degeneration: optical coherence tomographic findings correspond to histology. Retina. 2015; 35: 1339–1350. [DOI] [PMC free article] [PubMed] [Google Scholar]
- 45. Ahmad KM, Klug K, Herr S, Sterling P, Schein S. Cell density ratios in a foveal patch in macaque retina. Vis Neurosci. 2003; 20: 189–209. [DOI] [PubMed] [Google Scholar]
- 46. Das SR, Bhardwaj N, Kjeldbye H, Gouras P. Muller cells of chicken retina synthesize 11-cis-retinol. Biochem J. 1992; 285 (Pt 3): 907–913. [DOI] [PMC free article] [PubMed] [Google Scholar]
- 47. Mata NL, Radu RA, Clemmons RC, Travis GH. Isomerization and oxidation of vitamin a in cone-dominant retinas: a novel pathway for visual-pigment regeneration in daylight. Neuron. 2002; 36: 69–80. [DOI] [PMC free article] [PubMed] [Google Scholar]
Associated Data
This section collects any data citations, data availability statements, or supplementary materials included in this article.


