Summary
Unlike in metazoans, the stepwise biogenesis of microRNAs (miRNAs) occurs within the nucleus in plants. Whether or how the major steps in miRNA biogenesis are coordinated is largely unknown. Here, we show that the plant TREX-2 complex promotes multiple steps in miRNA biogenesis, including transcription, processing and nuclear export. Core subunits of TREX-2, THP1 and SAC3A, interact and co-localize with RNA Polymerase II to promote the transcription of MIR genes in the nucleoplasm. TREX-2 interacts with the microprocessor component SERRATE and promotes the formation of Dicing bodies in the nucleoplasm. THP1 also interacts and co-localizes with the nucleoporin protein NUP1 at the nuclear envelope. NUP1 and THP1 promote the nuclear export of miRNAs and AGO1. These results suggest that TREX-2 coordinates the transcription, processing and export steps in miRNA biogenesis to ensure efficient miRNA production.
Introduction
Multicellular organisms use gene silencing as a means to regulate gene expression and genome stability. Small RNAs associate with ARGONATUE (AGO) proteins and serve as sequence specificity determinants in gene silencing1, 2. In plants, the two main classes of small RNAs are microRNAs (miRNAs) and small interfering RNAs (siRNAs). MiRNAs are largely 21–22 nucleotides (nt) long, associate with AGO1, and regulate target gene expression through mRNA cleavage and translational repression3, 4. The crucial roles of miRNAs in diverse biological processes are reflected by the pleiotropic defects exhibited by mutants in miRNA biogenesis genes4.
In plants, miRNA biogenesis entails distinct steps: MIR genes are transcribed by DNA-dependent RNA polymerase II (Pol II) into primary miRNAs (pri-miRNAs); the pri-miRNAs undergo processing by a protein complex containing DICER-LIKE1 (DCL1), HYPONASTIC LEAVES1 (HYL1) and SERRATE (SE); the resulting miRNA/miRNA* duplexes are 2’-O-methylated at the 3’ ends by the small RNA methyltransferase HUA ENHANCER1 (HEN1); the miRNA strand is incorporated into AGO1 and the miRNA-AGO1 complexes, also known as miRISCs (miRNA-Induced Silencing Complexes), are exported to the cytoplasm3, 4. Factors that facilitate and/or regulate these steps have been identified. The transcription of MIR genes requires Mediator5, Elongator6, NEGATIVE ON TATA LESS2 (NOT2)7, and MOS4-ASSOCIATED COMPLEX (MAC) subunits PRL1, PRL2, MAC3 and MAC78–10, and CELL DIVISION CYCLE 5 (CDC5)11. Besides association with Pol II to promote transcription, NOT2, CDC5 and Elongator also associate with the dicing complex6, 7, 11. In fact, DCL1 is present at MIR genes (as determined by chromatin immunoprecipitation) in an Elongator-dependent manner6, suggesting that nascent pri-miRNAs undergo processing. Additionally, DCL1 and HYL1 are present both in the nucleoplasm and in nuclear dicing bodies (D-bodies)12. As pri-miR173 was found in D-bodies, D-bodies are thought to be sites of pri-miRNA processing10, 11.After pri-miRNA processing, the loading of miRNAs into AGO1 is aided by HEAT SHOCK PROTEIN 90 (HSP90), which forms a complex with AGO113. Two importin-beta family proteins, ENHANCED MIRNA ACTIVITY1 (EMA1) and TRANSPORTIN1 (TRN1), interact with AGO1 to inhibit or promote, respectively, the loading of miRNAs into AGO114, 15. Although AGO1 is a cytoplasmic protein at the steady state level, it undergoes nucleo-cytoplasmic shuttling and loads miRNAs in the nucleus; AGO1-miRNA complexes are exported to the cytoplasm via a nuclear export signal in AGO13.
The nuclear envelope serves as a barrier to restrict certain molecular processes to either the nucleus or the cytoplasm16. mRNAs and small RNAs produced in the nucleus are transported through nuclear pore complexes (NPCs) to the cytoplasm where they function17, 18. The evolutionarily conserved TREX-2 complex links transcription and mRNA export19. Yeast TREX-2 consists of Sac3, Thp1, Sem1 (Dss1), Sus1, and Cdc31 (Cen1)20 and is thought to be anchored to the inner side of the NPCs via the nucleoporin Nup1, which is localized to the nuclear pore basket21. Yeast TREX-2 directly associates with Mediator to coordinate transcription and mRNA export22, 23.
The role of TREX-2 in transcription and mRNA export is best understood in yeast, an organism that does not have miRNAs. It is unknown whether TREX-2 plays a role in miRNA biogenesis or export in plants or animals. Arabidopsis TREX-2 has been characterized in terms of its composition through yeast two-hybrid analyses24. It contains homologs of most yeast subunits except for that of Sus1, and these homologs are encoded by paralogous genes such as SAC3A, SAC3B, SAC3C, DSS1-(I), DSS1-(V), CEN1 and CEN224. However, the molecular and biological functions of plant TREX-2 are largely unknown. Here we show that mutants in the TREX-2 core component THP1 have defects in miRNA biogenesis and miRNA nuclear export. THP1 and another core TREX-2 component, SAC3A, physically interact with the miRNA transcriptional machinery Pol II, CDC5, and NOT2B. They also interact with SE and C-TERMINAL DOMAIN PHOSPHATASE-LIKE 1 (CPL1)/FIERY2 (FRY2) to promote HYL1 protein de-phosphorylation and D-body formation. THP1 co-localizes with Pol II and SE in the nucleoplasm and with NUP1 (also known as NUP136), a homolog of yeast Nup1, at the nuclear envelope. Reduction of THP1 or NUP1 function reduces the nuclear export of both miRNAs and AGO1, suggesting that TREX-2 promotes the export of miRISCs. In summary, TREX-2 coordinates miRNA biogenesis steps from transcription and processing to nuclear export.
Results
A mutation in THP1 causes a global reduction in miRNA accumulation
In order to identify players in miRNA biogenesis and/or activity, we performed an ethyl methanesulfonate (EMS) mutagenesis screen using the pSUC2: amiR-SUL (amS) line25. amS expresses the amiR-SUL artificial miRNA from the SUC2 promoter specific for phloem companion cells. Silencing of SULFUR (SUL, also known as CHLORINA42, a gene required for chlorophyll synthesis26) by amiR-SUL causes bleaching along the leaf veins. One mutant with reduced leaf bleaching, a phenotype indicative of compromised amiR-SUL activity, was isolated (Fig. 1a). We later found that the mutation was in the gene THP1 (see below), and named this mutant thp1–5 amS. Consistent with the phenotype, the abundance of amiR-SUL was reduced (Fig. 1b) and the expression of SUL was de-repressed (Fig. 1c) in this mutant. To determine whether endogenous miRNAs were also affected in this mutant, we performed RNA gel blot analyses to examine seven miRNAs in three biological replicates. All examined miRNAs showed reduced accumulation in the thp1–5 amS mutant (Fig. 1b). Consistent with this, the expression of miRNA target genes was increased (Fig. 1c). We also performed small RNA-seq with amS and thp1–5 amS to assess global changes of miRNAs in the mutant. Three biological replicates of each genotype were highly correlated (Extended Data Fig.1a). A significant global reduction in the levels of miRNAs (T-test, P Value < 2.2e-16) as well as those of 21 nt and 24 nt endogenous siRNAs was found in thp1–5 amS (Fig. 1d, Extended Data Fig. 1a,b and Supplementary Table 1). Consistently, the thp1–5 amS mutant exhibited severe developmental defects such as upwardly curved leaves, abnormal flowers, and reduced fertility (Fig. 1a,f, Extended Data Fig. 2a,b).
Figure 1. The thp1–5 mutant exhibits pleiotropic developmental defects and reduced miRNA levels.
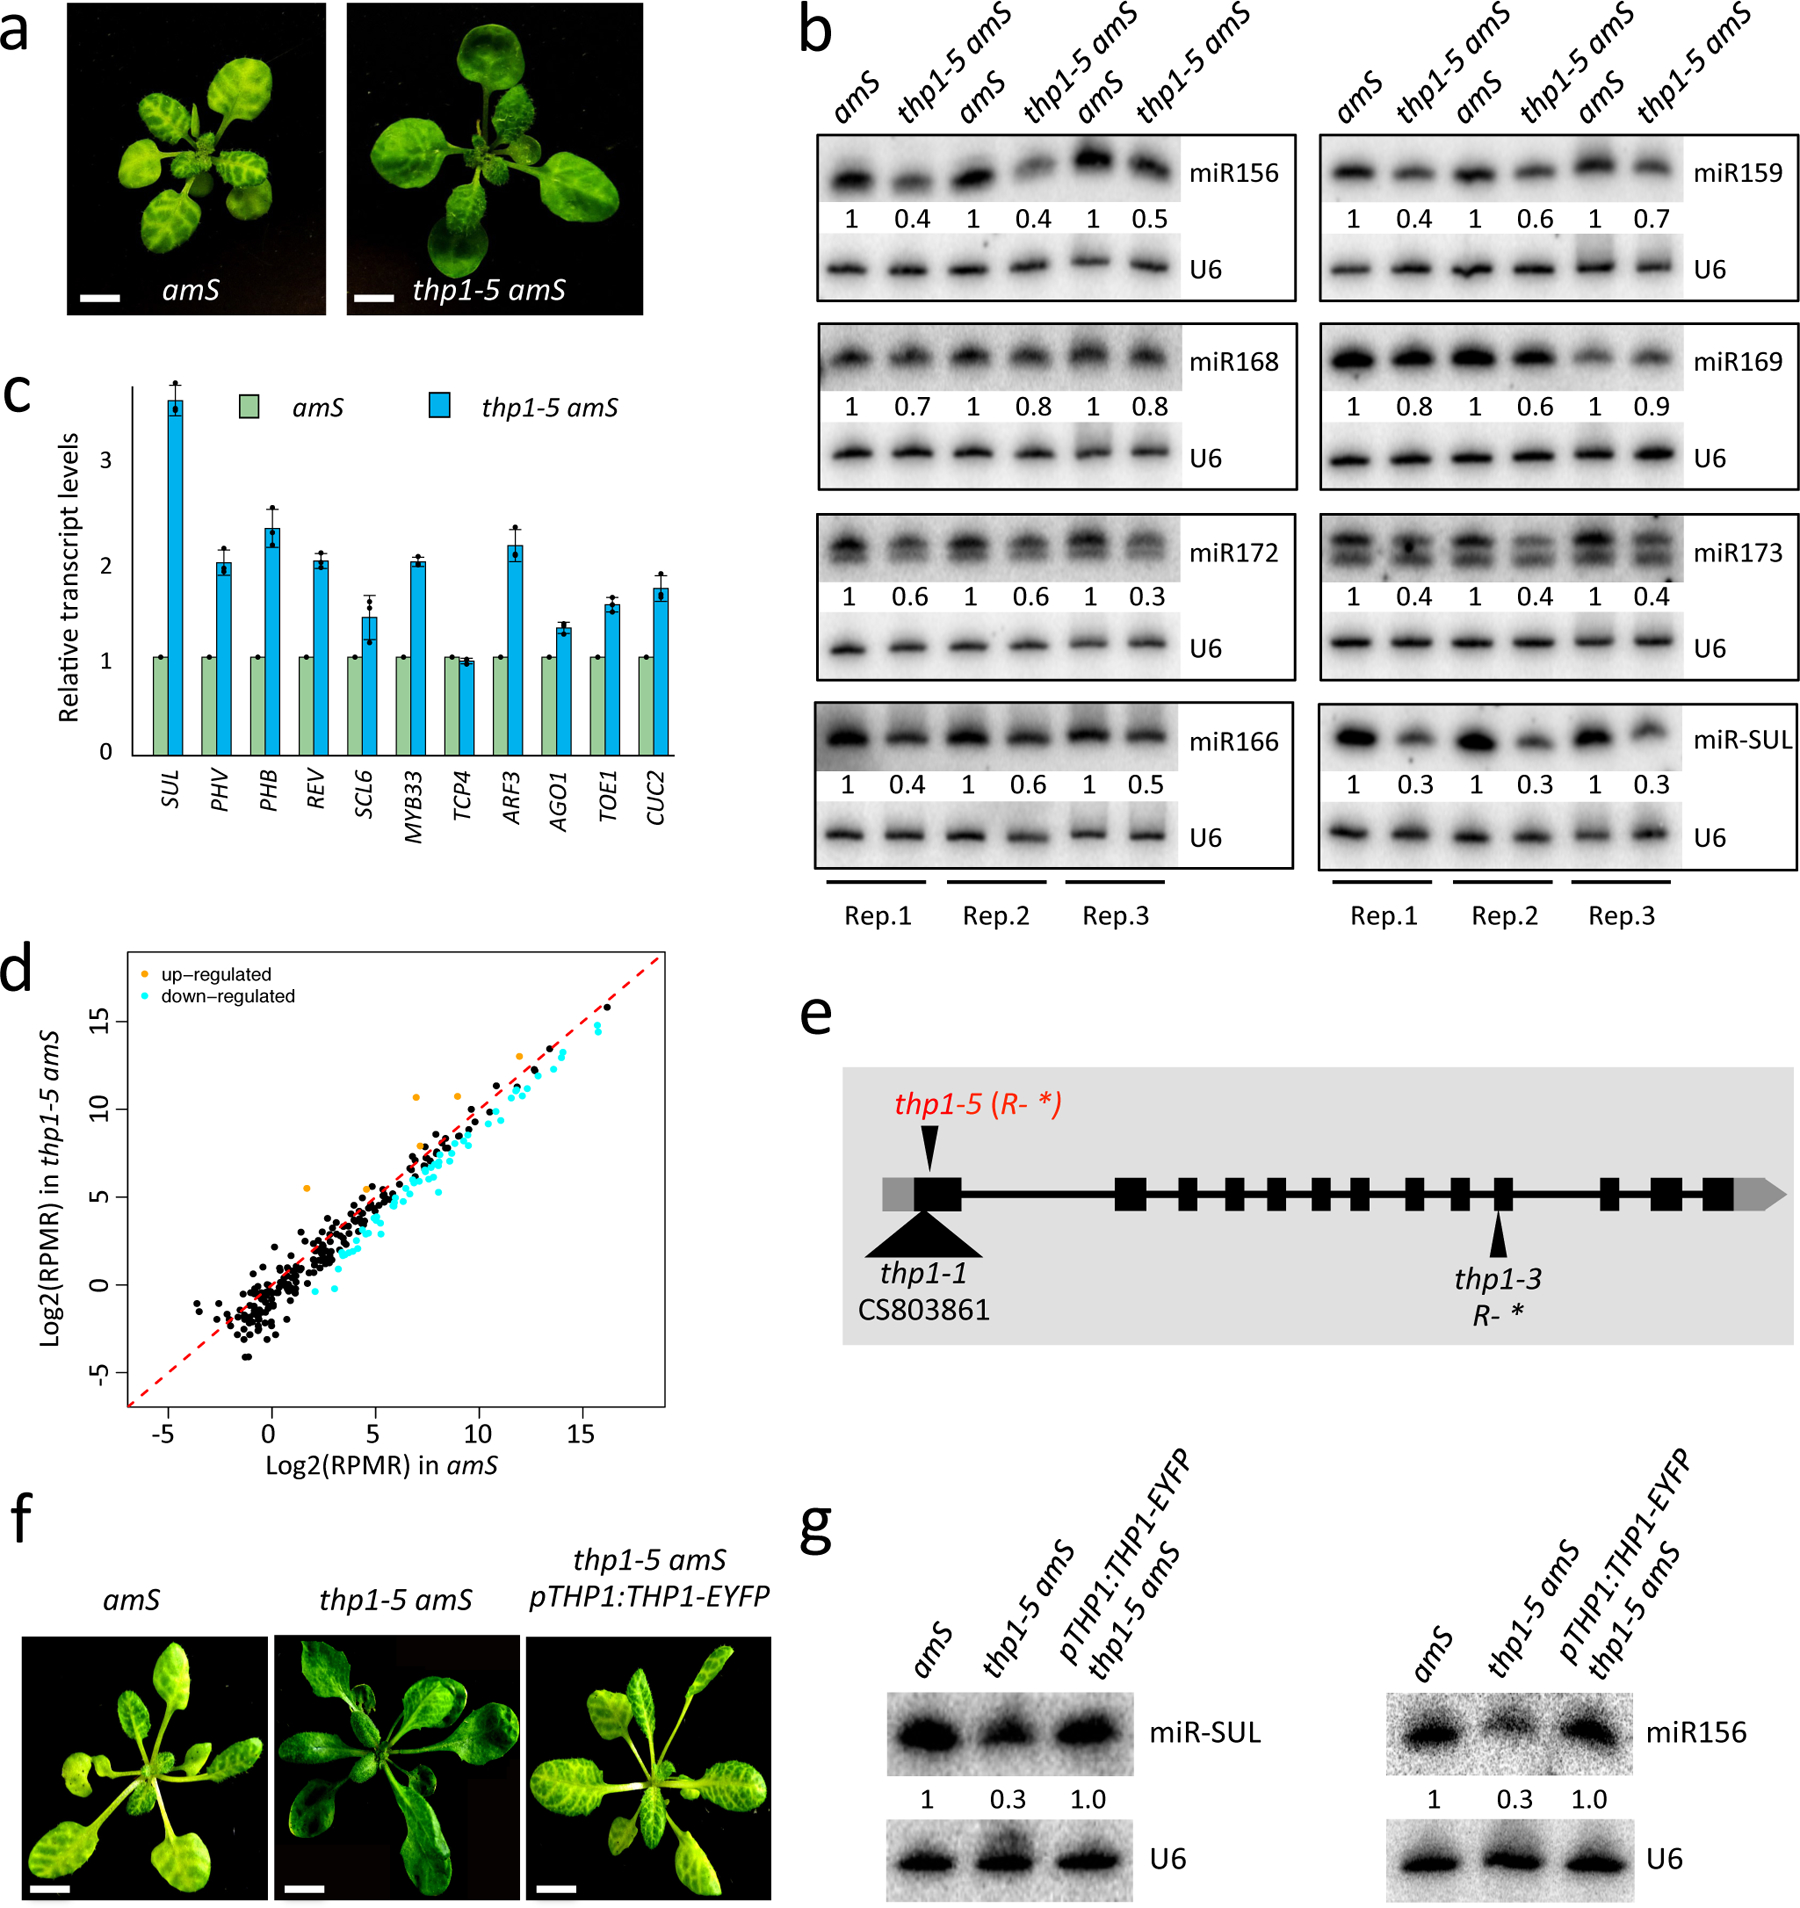
(a) 21-day-old pSUC2:amiR-SUL (amS) and thp1–5 amS plants with differences in the vein bleaching phenotype. Scale bar =10 mm. All plants of the same gentoypes exhibit similar phenotypes and one representative is shown. (b) RNA gel blot analysis of miRNAs from amS and thp1–5 amS. Replicate (Rep)1 and Rep 2 were from 12-day-old seedlings grown on 1/2 MS; Rep 3 was from 21-day-old seedlings grown in soil. The miRNA signals were quantified and normalized to those of U6, and values were relative to amS. (c) Determination of miRNA target mRNA levels in 12-day-old seedlings of amS and thp1–5 amS by quantitative RT-PCR (RT-qPCR). The housekeeping gene IPP2 was included as a control. Error bars indicate standard deviation from three biological replicates. (d) Abundance of miRNAs in amS and thp1–5 amS as determined by small RNA-seq. Each dot represents a miRNA. Small RNA libraries from three indepenent replicates for each background were generated from 12-day-old seedlings grown on MS plates. The normalization of small RNAs was against 45S rRNA reads and abundance was expressed as RPMR (reads per million of 45S rRNA reads). (e) A diagram of the THP1 gene. Two published thp1 mutants and thp1–5 are shown. The triangle represents T-DNA insertion. *, stop codon. (f) Morphological phenotypes of 25-day-old amS, thp1–5 amS and thp1–5 amS pTHP1:THP1-EYFP plants showing that the pTHP1:THP1-EYFP transgene rescued the thp1–5 amS mutant defects. Scale bar =10 mm. Note that the transgene was introduced into Col and a line with a single transgene insertion and a moderate level of the THP1-EYFP protein was chosen for crosses with thp1–5 amS. F3 plants that were homozygous for thp1–5, amS and the transgene were identified by genotyping and examined for phenotype. At least three different F3 homozygous plants showed similar phenotypes. (g) Small RNA gel blot analysis showing that the thp1–5 amS molecular defects were rescued by the pTHP1:THP1-EYFP transgene. Two independent repeats gave similar results.
The thp1–5 amS phenotypes were caused by a single, recessive, and nuclear mutation. To identify the mutated gene, we performed genome re-sequencing of pooled F2 homozygotes from the backcross between thp1–5 amS and amS. A G-to-A mutation that changes an arginine to a premature stop codon (R19*) in the open reading frame of AT2G19560 (THP1) was found (Fig. 1e). To determine whether this mutation was responsible for the defects of thp1–5 amS, we generated a construct whereby the THP1 native promoter drives THP1 fused with EYFP (pTHP1:THP1-EYFP) and introduced the construct into the thp1–5 amS mutant. The transgene fully complemented the vein bleaching, morphological and miRNA accumulation defects of the thp1–5 amS mutant (Fig. 1f,g). In addition, we obtained two other thp1 mutant alleles, thp1–1 and thp1–3 (Fig. 1e); these two mutants showed similar developmental and molecular defects to those of thp1–5 amS (Extended Data Fig. 2c,d).
To further interrogate the miRNA defects of thp1–5, we combined this mutation with mutations in known genes in miRNA biogenesis (HYL1, SE, HEN1, AGO1 and HASTY (HST)). We first introduced se-1, hyl1–2, hen1–8, ago1–27, and hst-6 mutations into amS through crosses. As expected, all these mutations suppressed the leaf bleaching phenotype of amS, with ago1–27 showing the least level of suppression (perhaps owing to its being a weak allele) (Extended Data Fig. 3a). Next, we crossed the thp1–5 amS mutant with these mutants. Interestingly, we were only able to obtain viable double mutant plants for ago1–27 thp1–5 amS. The ago1–27 thp1–5 amS mutant showed more severe developmental defects as well as weaker leaf bleaching than ago1–27 amS or thp1–5 amS mutants (Extended Data Fig. 3a). We examined the genetic segregation of plants homozygous for hyl1–2 amS, se-1 amS, hst-6 amS or hen1–8 amS and heterozygous for thp1–5. The progeny of these plants segregated 2:1 for thp1–5/+ and +/+, suggesting that double mutants between thp1–5 and these mutations were embryo lethal (Extended Data Fig. 3b). All null mutants in DCL1 are embryo lethal27; the embryo lethality of the above double mutants may be due to stronger defects in miRNA biogenesis than the respective single mutants.
SAC3 genes are required for miRNA biogenesis
THP1 is a subunit of TREX-2 and is conserved in yeast, animals and plants24. We wondered whether the role of THP1 in miRNA biogenesis reflected that of TREX-2. We first characterized Arabidopsis TREX-2 using immunoprecipitation followed by mass spectrometry (IP-MS). IP was performed with pTHP1:THP1-EYFP and Col (wild type, used here as a negative control) using GFP-trap. Three SAC3 proteins, SAC3A, SAC3B and SAC3C, and the nucleoporin NUP1 were recovered from the IP from pTHP1:THP1-EYFP with the most abundant peptide hits (Fig. 2a and Supplementary Table 2). We also examined direct protein-protein interactions between Arabidopsis TREX-2 components by yeast two-hybrid (Y2H) analyses. THP1 directly interacted with SAC3A, SAC3B, DSS1-(I), and DSS1-(V), but not CEN1 or CEN2; SAC3B interacted with CEN1 (Extended Data Fig. 4a). Thus, the IP-MS and Y2H analyses, together with a prior study24, showed that THP1, SAC3, DSS1, and CEN proteins are subunits of Arabidopsis TREX-2; and that multiple forms of TREX-2 with distinct paralogs of SAC3, DSS, or CEN proteins may exist (Fig. 2b). The absence of DSS1-(I) and DSS1-(V) in the THP1-EYFP IP-MS might be because the proteins are short (70–100 amino acids) or are not an integral component of TREX-2. Sus1 in yeast is considered a linker protein that associates with both the SAGA complex and TREX-2 in co-regulating gene transcription and mRNA turnover28. We did not find Arabidopsis SUS1 (also called ENY2) from our IP-MS. A recent study showed that SUS1 associates with Arabidopsis SAGA but not with TREX-229.
Figure 2. Arabidopsis TREX-2 is required for miRNA production.
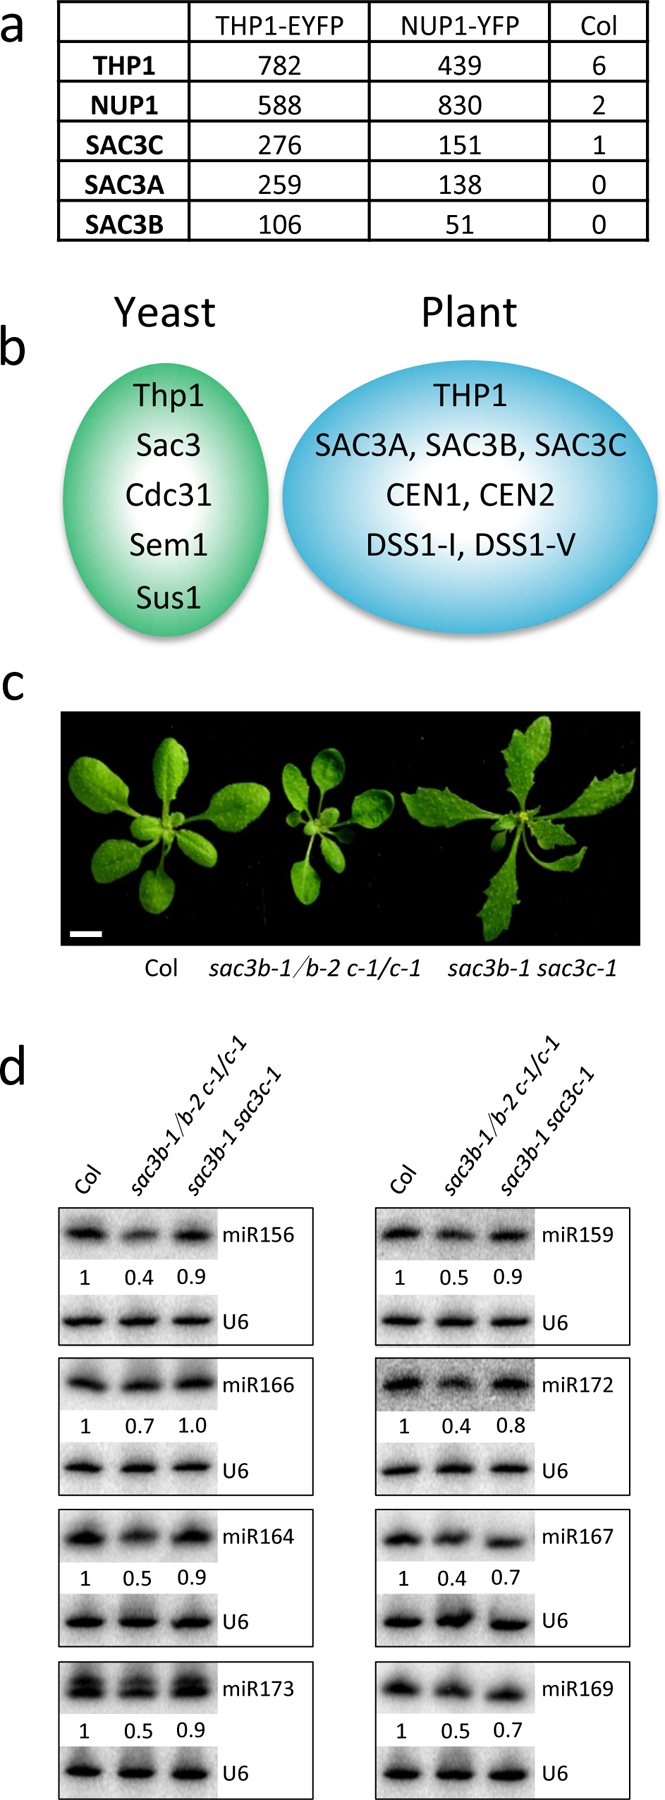
(a) IP-MS using THP1-EYFP (pTHP1:THP1-EYFP) and NUP1-YFP (pNUP1:NUP1-YFP) as baits in Arabidopsis. Wild-type plants (Col) without the transgenes served as the negative control. The numbers of recovered peptides corresponding to each of the proteins are shown. (b) A diagram of yeast and Arabidopsis TREX-2 components. (c) 21-day-old seedlings of Col, sac3b-1/sac3b-2 sac3c-1/sac3c-1 (sac3b-1/b-2 c-1/c-1) and sac3b-1 sac3c-1. Scale bar =10 mm. (d) Small RNA gel blot analysis to determine miRNA levels in Col, sac3b-1/sac3b-2 sac3c-1/sac3c-1 and sac3b-1 sac3c-1. Two independent repeats yielded similar results. U6 was used as an internal control. The numbers indicate relative abundance of the miRNAs.
We next examined whether the SAC3 genes are required for miRNA biogenesis. The single mutants sac3a-2, sac3b-1, sac3b-2 and sac3c-1 were reported to not show any morphological defects24. We obtained two mutant alleles for each SAC3 gene (Extended Data Fig. 4b), and interrogated levels of SAC3 transcripts in the mutants by RT-PCR using different pairs of primers along the genes (Extended Data Fig. 4c). Judging from the levels of transcripts from the mutant alleles, sac3a-2 appeared to be a stronger allele than sac3a-1; sac3b-2 might be a stronger allele than sac3b-1; and sac3c-1 might be stronger than sac3c-2. We generated double mutants of SAC3B and SAC3C genes. The sac3b-1 sac3c-1 double mutant showed morphological defects (Fig. 2c). We failed to obtain the sac3b-2 sac3c-1 double mutant but were able to obtain the sac3b-1/sac3b-2 sac3c-1/sac3c-1 mutant, suggesting that the sac3b-2 sac3c-1 double mutant with two strong alleles is embryo lethal. The developmental defects of sac3b-1/sac3b-2 sac3c-1/sac3c-1 were similar to those of the thp1–5 mutant (Figs. 1a,2c). We then determined miRNA levels in sac3 mutants by northern blotting. The levels of eight miRNAs were slightly reduced in sac3b-1 sac3c-1 but were more severely reduced in sac3b-1/sac3b-2 sac3c-1/sac3c-1 (Fig. 2d). In fact, the sac3b-1/sac3b-2 sac3c-1/sac3c-1 mutant was highly similar to the thp1–5 mutant in miRNA accumulation (Figs. 1b,2d). Taken together, these results show that Arabidopsis TREX-2 components THP1 and SAC3 are required for miRNA production.
TREX-2 associates with the transcription machinery and promotes MIR gene transcription
To determine which steps of miRNA biogenesis were affected in the thp1–5 amS mutant, we first examined MIR gene transcription. We measured pri-miRNA levels and found that all the interrogated pri-miRNAs showed reduced levels in thp1–5 amS as compared to amS (Fig. 3a). The reduction in pri-miRNA levels may be due to reduced transcription or RNA stability. We crossed the thp1–5 amS mutant with pMIR167a:GUS, a reporter of MIR167a promoter activity. Histochemical staining for GUS activity and RT-qPCR for measurement of GUS transcript levels revealed that GUS expression in thp1–5 was reduced as compared to WT, suggesting that THP1 promotes MIR gene transcription (Fig. 3b,c). However, TREX-2 is known to prevent the epigenetic silencing of transgenes and some endogenous loci30; thus, the reduction in pri-miR-SUL levels or pMIR167a:GUS expression in the thp1–5 amS mutant might be due to transcriptional silencing of the transgenes. This was unlikely, as the expression of the Bar gene in the same T-DNA as pSUC2:amiR-SUL was unaltered (Extended Data Fig. 5d).
Figure 3. TREX-2 promotes MIR gene transcription and associates with the transcription machinery.
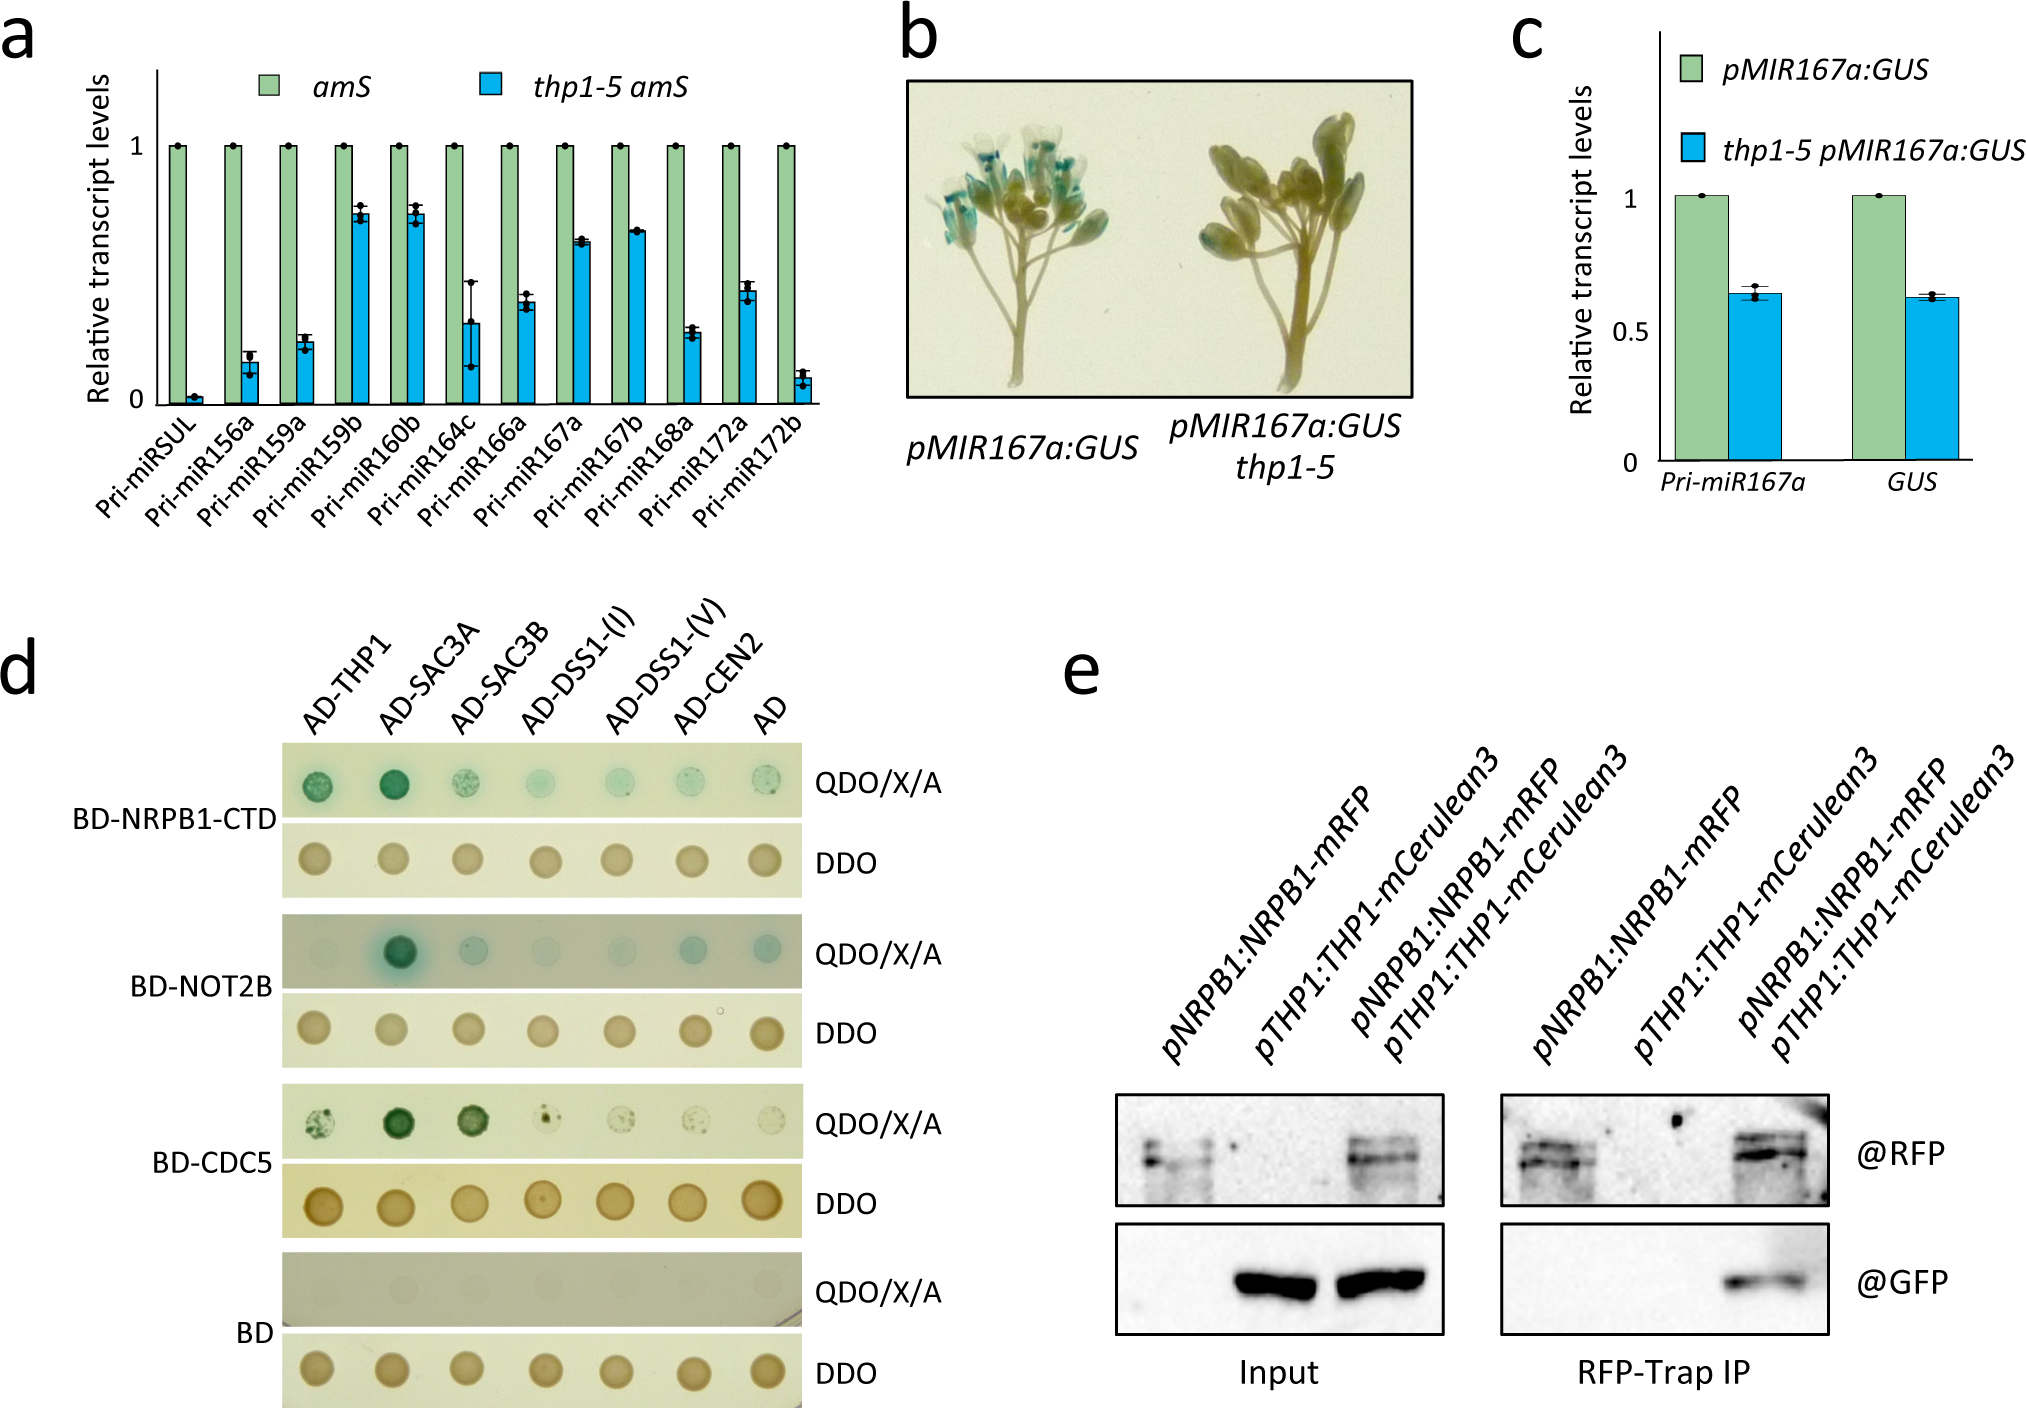
(a) RT-qPCR to determine pri-miRNA levels in amS and thp1–5 amS. IPP2 was used as an internal control. Error bars indicate standard deviation from three biological replicates. The experiment was repeated three times with similar results. (b) GUS staining of pMIR167a:GUS and thp1–5 pMIR167a:GUS inflorescences. Three independent repeats gave similar results. (c) Levels of GUS transcripts and pri-miR167a in pMIR167a:GUS and thp1–5 pMIR167a:GUS seedlings as determined by RT-qPCR. IPP2 was used as an internal control. Error bars indicate standard deviation from three independent replicates. (d) Yeast two-hybrid assays to test the interactions between TREX-2 components (THP1, SAC3A, SAC3B, DSS1-(I), DSS1-(V), and CEN2) and the C-terminal domain (CTD) of NRPB1, NOT2B and CDC5. The empty vectors GAL4-AD and GAL4-BD were included as controls. Diploid yeast cells from mating contained the bait and prey plasmids and grew on SD-Trp/-Leu (DDO) medium, and diploid yeast cells in which the bait and prey proteins interacted formed blue colonies on SD-Trp/-Leu/-His/-Ade+X-α-gal Aureobasidin A (QDO/X/A) medium. The experiment was repeated two times with similar results. (e) In vivo co-IP for validation of interactions between THP1 and NRPB1. Total protein extracts from inflorescences of pNRPB1:NRPB1-mRFP, pTHP1:THP1-mCerulean3 and pNRPB1:NRPB1-mRFP pTHP1:THP1-mCerulean3 plants were immunoprecipitated using RFP-Trap beads. The co-immunoprecipitated proteins were detected by western blotting using anti-GFP and anti-RFP antibodies, respectively. Two independent repeats gave similar results.
Since TREX-2 associates with Mediator to regulate inducible gene transcription in yeast22, to probe how Arabidopsis TREX-2 regulates MIR gene transcription, we performed Y2H assays to test the protein-protein interactions between TREX-2 subunits and several Mediator subunits, which were reported to affect MIR gene transcription5. No protein-protein interactions were detected between TREX-2 subunits and these Mediator subunits (Extended Data Fig. 5a). We then tested the interactions between TREX-2 subunits and other factors known to promote MIR gene transcription, such as Pol II, NOT2, and subunits of Elongator and MAC (Fig. 3d and Extended Data Fig. 5b). In these Y2H assays, TREX-2 subunits SAC3A and THP1 interacted with the C-terminal domain (CTD) of Pol II’s largest subunit NRPB1 as well as with CDC5 and NOT2B (Fig. 3d). We validated the THP1-Pol II interaction through reciprocal co-immunoprecipitation (co-IP) (Fig. 3e) and the SAC3A-Pol II interaction by Bimolecular Fluorescence Complementation (BiFC) (Extended Data Fig. 5c). Furthermore, we performed Pol ll chromatin immunoprecipitation (ChIP) and found that Pol ll occupancy at several MIR loci was reduced in thp1–5 amS mutant (Extended Data Fig. 5e). Taken together, these data suggest that TREX-2 associates with Pol II and recruits it to MIR loci to promote MIR gene transcription.
To determine the global impact of TREX-2 on gene expression, we performed mRNA sequencing with thp1–5, sac3b-1/sac3b-2 sac3c-1/sac3c-1 and wild type. Three biological replicates of each genotype were highly correlated (Extended Data Fig. 6a). Differentially expressed genes (DEGs) (fold change ≥2; p-value < 0.01) were identified in each mutant as compared to WT (Supplementary Table 3). A significant overlap was found for both down-regulated DEGs and up-regulated DEGs in the two mutants (Extended Data Fig. 6b; p-value = 0), indicating that THP1 and SAC3 act in the TREX-2 complex to regulate the same group of genes. 852 and 819 genes were commonly up-regulated and down-regulated, respectively (Extended Data Fig. 6a; Supplementary Table 3). The Gene Ontology terms enriched in the common DEGs (both up-regulated and down-regulated) included stress and stimulus responses. It is of note that ethylene signaling pathway genes were among the DEGs (Extended Data Fig. 6c,d), consistent with the enhanced ethylene response phenotype of thp1 mutants24, 31.
TREX-2 associates with SE and CPL1 and regulates HYL1 phosphorylation status
Our Y2H assays also revealed that TREX-2 subunits THP1 and SAC3A interacted with SE, and SAC3A and SAC3B interacted with both the full-length and C-terminal portion (AA484–967) of CPL1 (Fig. 4a). THP1 and SAC3A did not interact with the other components of the dicing complex, such as DCL1 or HYL1 (Extended Data Fig. 7a). The interactions between THP1 and SE were further validated by co-IP (Fig. 4b) and those between SAC3A and SE were further validated by BiFC (Extended Data Fig. 7b). Since CPL1 and SE are responsible for HYL1 protein de-phosphorylation and dephosphorylated HYL1 is the active form for miRNA processing32, 33, we next examined the ratio of phosphorylated/non-phosphorylated (P+/P−) HYL1 using phos-tag, which decreases the mobility of phosphorylated proteins in polyacrylamide gels. We found that the total HYL1 protein level was slightly increased in the thp1–5 amS mutant (Fig. 4c, Extended Data Fig. 7c,d). However, that of P+ HYL1 was dramatically increased and the P+/P− ratio was increased in the thp1–5 amS mutant (Fig. 4c), suggesting that inactive HYL1 (P+ HYL1) was at a higher level in the thp1–5 amS mutant. Active HYL1 (P− HYL1) forms nuclear foci known as D-bodies32, 33. We found that in roots of the thp1–5 mutant, the number of HYL1-containing D-bodies was greatly reduced as compared to WT (Fig. 4d,e). We also performed immunofluorescence to detect DCL1, another component of D-bodies, using anti-DCL1 antibody (Extended Data Fig. 8a,b). We found that the number of DCL1-containing D-bodies was also reduced in thp1–5 as compared to WT (Extended Data Fig. 8b,c). MIR gene transcription is considered to be coupled with pri-miRNA processing, as DCL1 can be detected at MIR loci6. To determine whether TREX-2 recruits DCL1 and HYL1 to MIR genes, we performed DCL1 and HYL1 ChIP. We found that, in thp1–5 amS, the occupancy of both DCL1 and HYL1 at MIR genes was greatly reduced (Fig. 4f, Extended Data Fig. 8d).
Figure 4. TREX-2 associates with and affects the microprocessor.
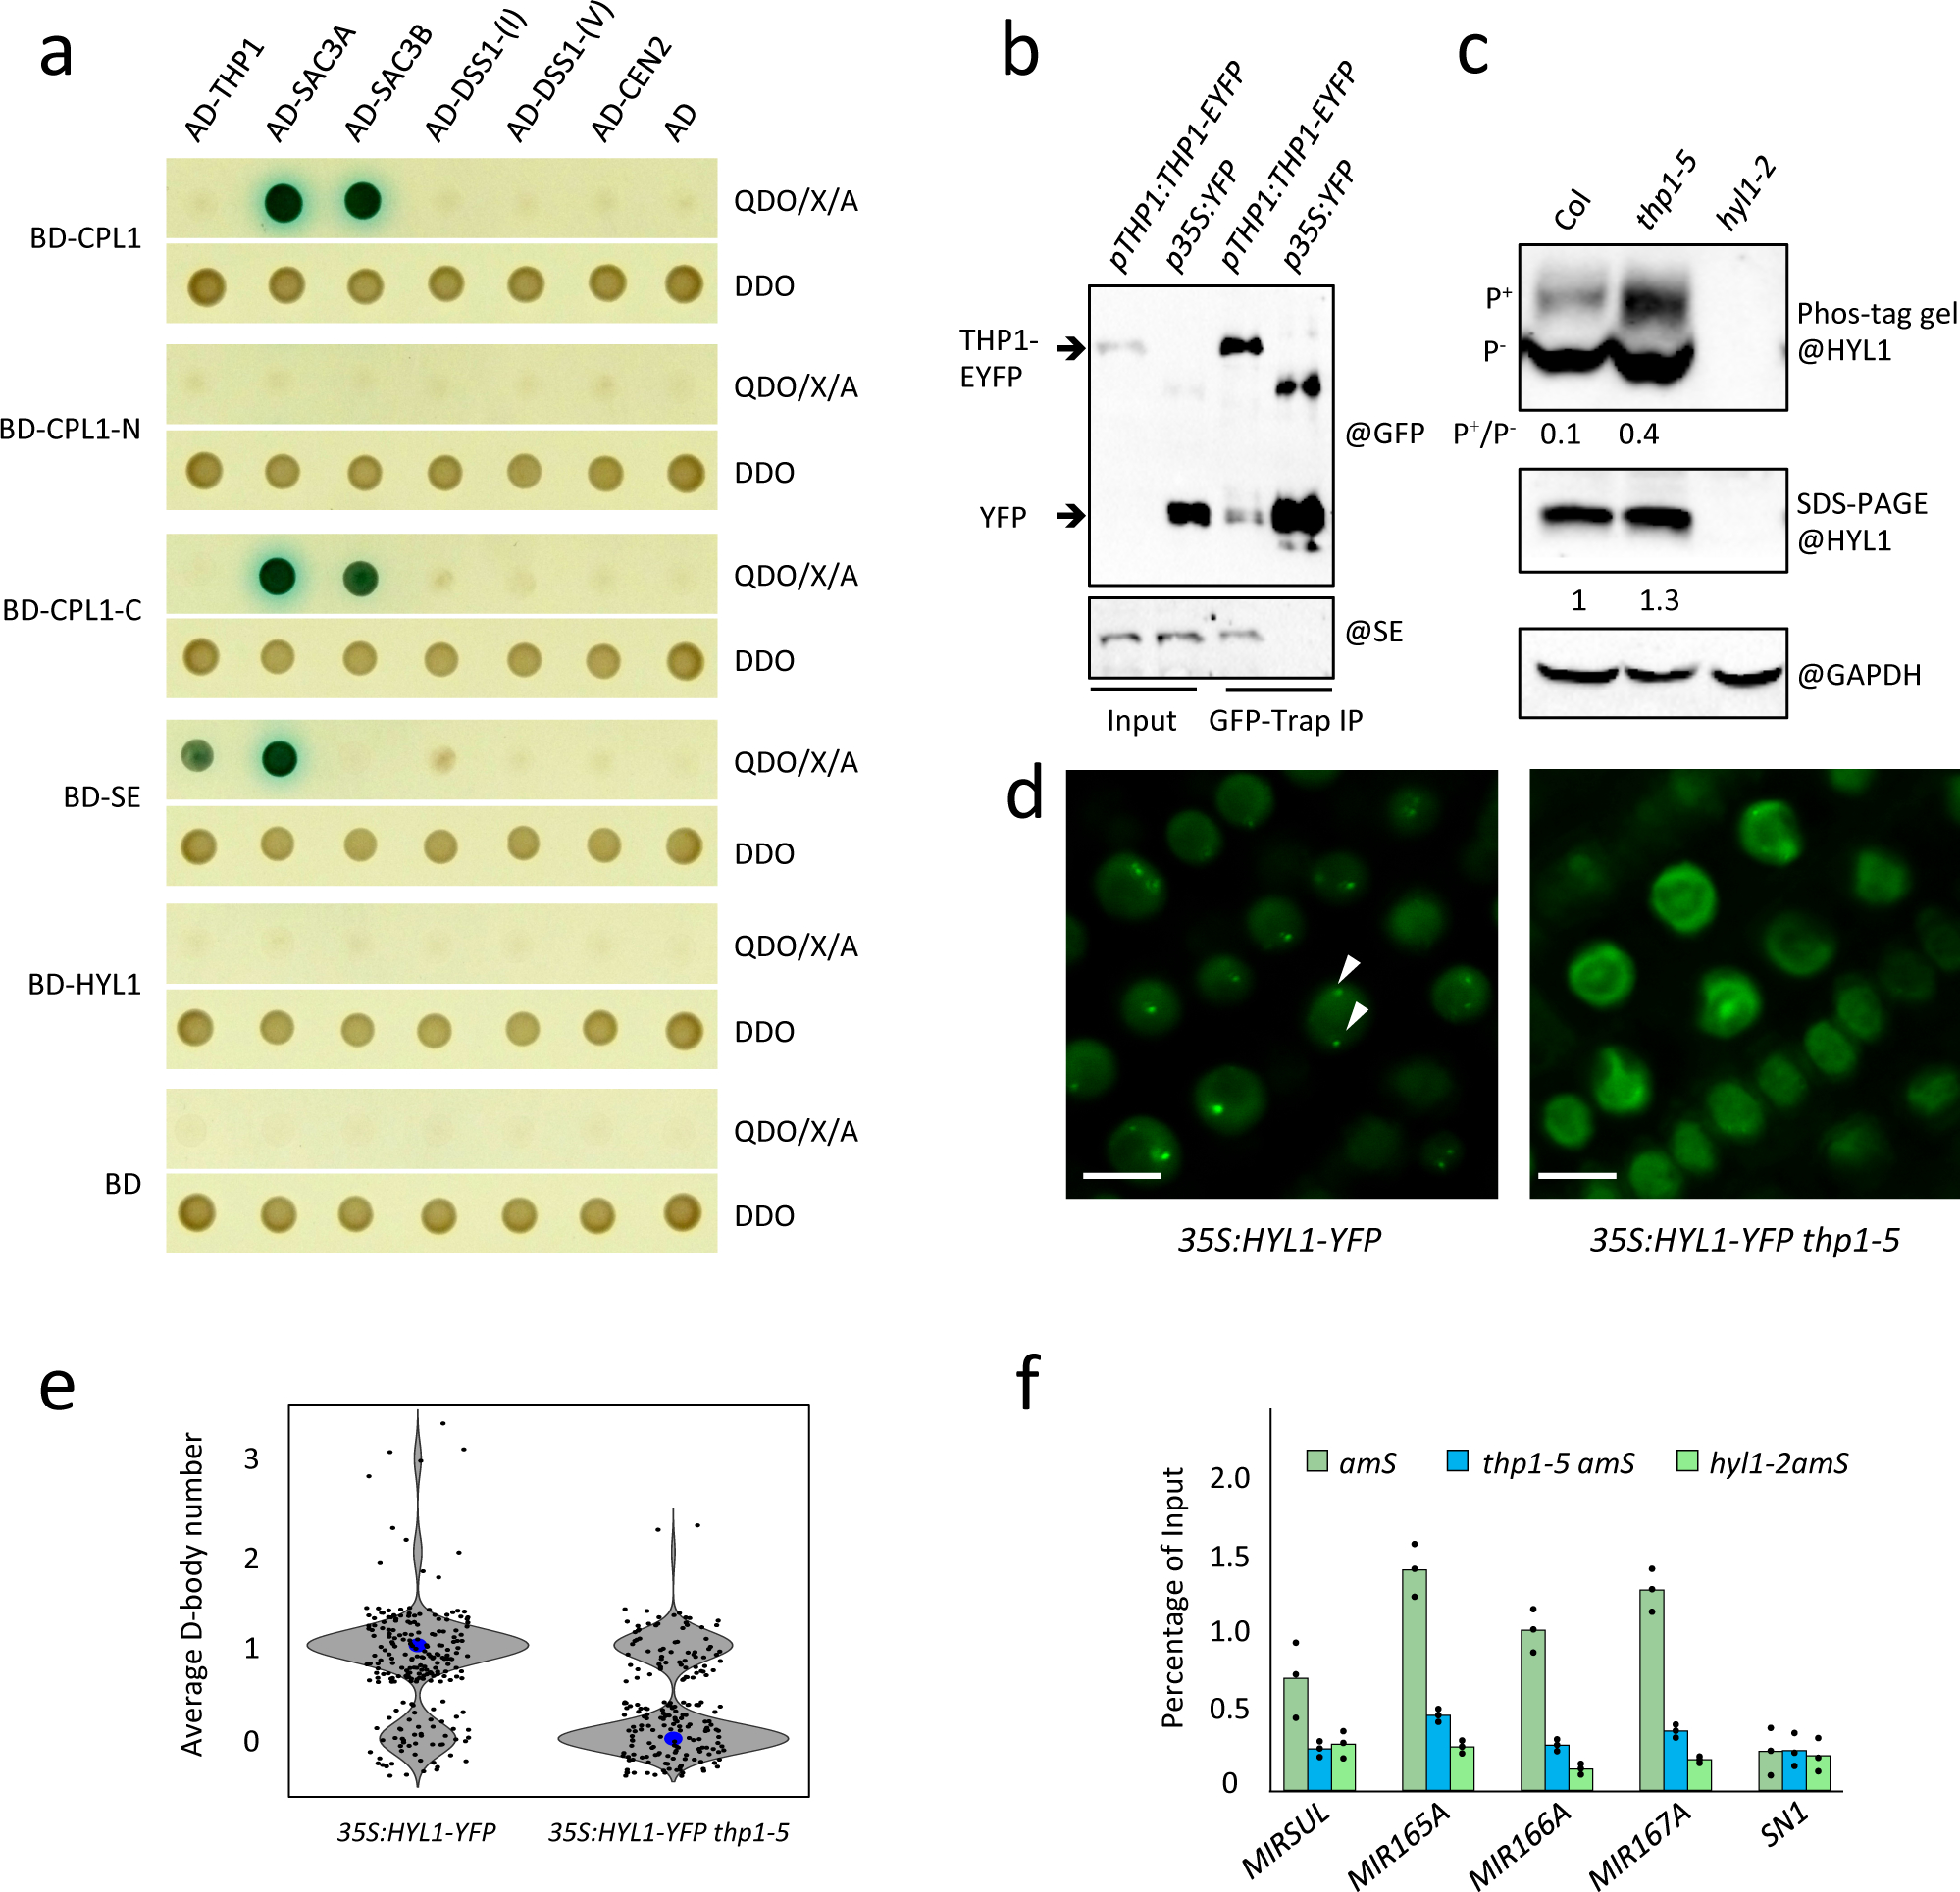
(a) Y2H assays to test interactions between TREX-2 components (THP1, SAC3A, SAC3B, DSS1-(I), DSS1-(V), and CEN2) and SE, CPL1, CPL1-N (amino acids 1–483 of CPL1), and CPL1-C (amino acids 484–967 of CPL1). The empty vectors GAL4-AD and GAL4-BD were included as controls. Diploid yeast cells from mating contained the bait and prey plasmids and grew on SD-Trp/-Leu (DDO) medium, and diploid yeast cells in which the bait and prey proteins interacted formed blue colonies on SD-Trp/-Leu/-His/-Ade+X-α-gal Aureobasidin A (QDO/X/A) medium. The experiment was repeated two times with similar results. (b) In vivo interactions between THP1 and SE as shown by co-IP. Total protein extracts from p35S:YFP and pTHP1:THP1-EYFP inflorescences were immunoprecipitated using GFP-Trap beads. The co-immunoprecipitated proteins were detected by western blotting using anti-GFP and anti-SE antibodies, respectively. Two independent repeats gave similar results. (c) Determination of HYL1 phosphorylation status. The upper panel is a phosphoprotein mobility shift gel (phos-tag) probed with anti-HYL1 antibodies. The different forms of HYL1 are as indicated (P+ = phosphorylated HYL1; P− = non-phosphorylated HYL1). Ratios between the phosphorylated and non-phosphorylated HYL1 forms are given. The middle and bottom panels are SDS-PAGE gels showing the overall levels of HYL1 and the levels of GAPDH (a loading control), respectively. The relative levels of HYL1 are as indicated. Three independent repeats gave similar results. (d) Images of nuclei in lateral root cells of 12-day-old seedlings of 35S:HYL1-YFP and thp1–5 35S:HYL1-YFP. Two D-bodies are indicated by white arrowheads. Scale bar =10 μm. (e) The average D-body numbers per nucleus in 35S:HYL1-YFP (n=230) and thp1–5 35S:HYL1-YFP (n=202). P-value= 1.91429E-18. The middle lines of each box indicate the median. The P values were determined by a paired two-sided T test. (f) ChIP-qPCR analyses to determine the occupancy of four MIR loci by HYL1 in 12-day-old seedlings of amS, thp1–5 amS and hyl1–2 amS. All samples were immunoprecipitated by HYL1 antibody. SN1 (located between At3g44000 and At3g44005 at nucleotides 15,805,617–15,805,773 of chromosome 3) was used as a negative control. Error bars indicate standard deviation from three technical replicates.
TREX-2 promotes the nuclear export of both miRNAs and AGO1
Yeast TREX-2 functions in mRNA export. In Arabidopsis, miRNAs are thought to be loaded into AGO1 in the nucleus and exported as miRISCs3. Although HASTY (HST) is the homolog of exportin 5, which exports pre-miRNAs from the nucleus to the cytoplasm in animal cells34, 35, the nucleo-cytoplasmic distribution of miRNAs is not affected in hst mutants, and the main miRNA defect in hst mutants is the global reduction in miRNA levels34. We examined whether the nucleo-cytoplasmic distribution of miRNAs was affected in the thp1–5 amS mutant. Nuclear and cytoplasmic fractions were isolated from amS and thp1–5 amS seedlings; the distribution of U6 and tRNAMET suggested that the fractionation was largely successful (Fig. 5a). Consistent with a global reduction in miRNA levels in the thp1–5 amS mutant, a reduction in miRNA levels was found in both nuclear and cytoplasmic fractions in the mutant as compared with amS (Fig. 5a). Unlike hst mutants34, the cytoplasmic/nuclear ratios of miRNAs were reduced in thp1–5 amS (Fig. 5a,b). This indicated that TREX-2 promotes the nuclear export of miRNAs.
Figure 5: Nucleo-cytoplasmic partitioning of miRNAs and AGO1, and TREX-2 protein localization.
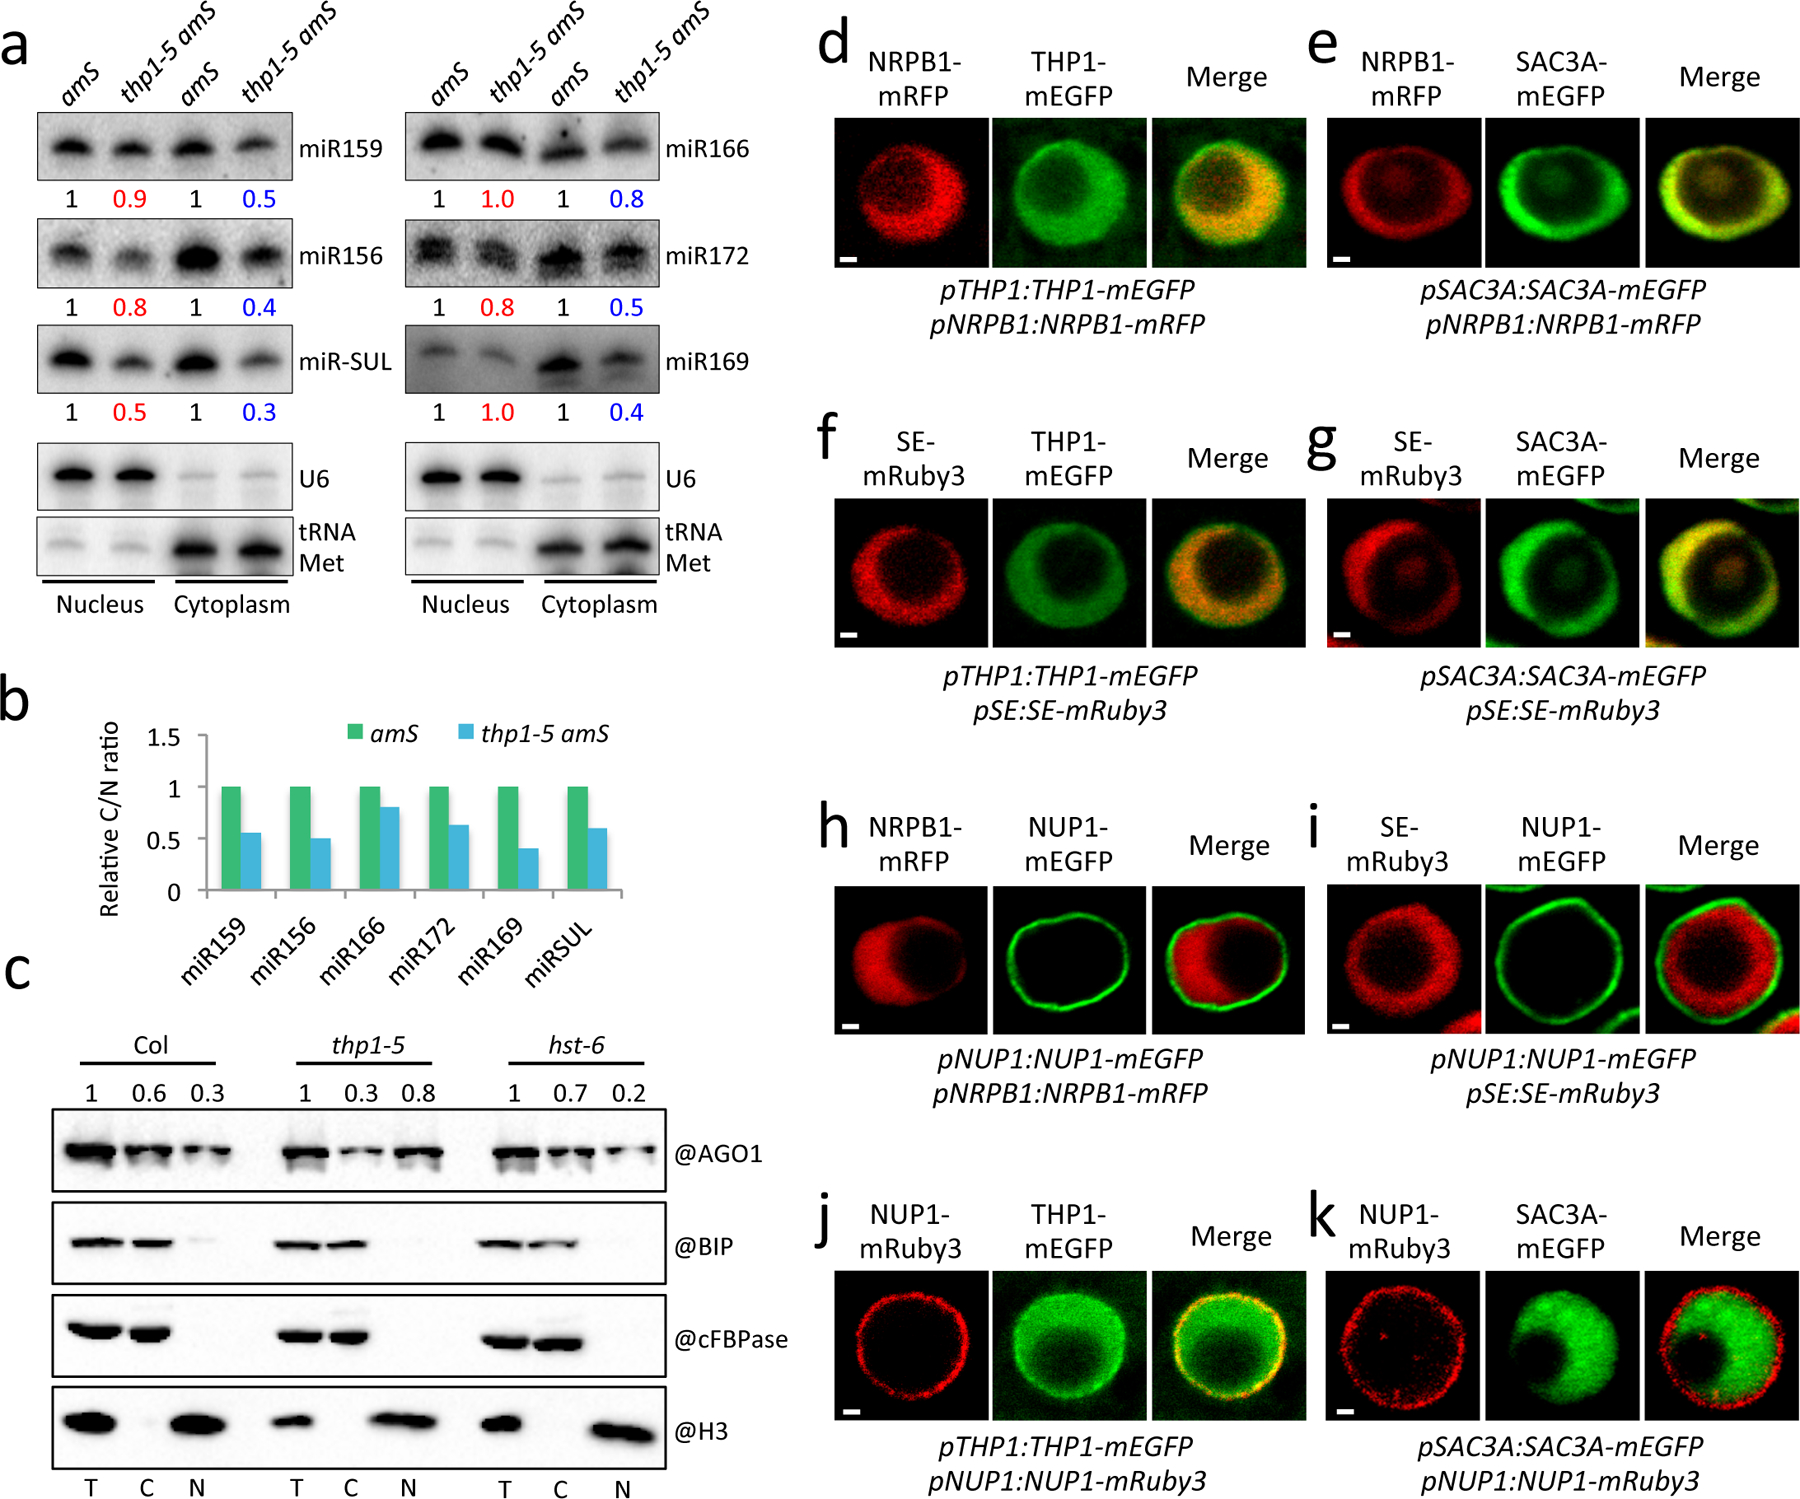
(a) Small RNA gel blot analysis to determine the nuclear and cytoplasmic accumulation of miRNAs in amS and thp1–5 amS. U6 and tRNA-Met served as nuclear and cytoplasmic RNA markers, respectively. They also served as the loading controls for the nuclear and cytoplasmic fractions for quantification of miRNA levels. The numbers represent relative levels of miRNAs. Two independent experiments gave similar results. (b) The cytoplasmic/nuclear ratios of miRNAs as determined in (a). (c) The nucleo-cytoplasmic partitioning of AGO1 in Col and thp1–5 and hst-6. The fractionated samples were subjected to protein gel blot assays using anti-AGO1, anti-cFBPase, anti-BIP and anti-H3 antibodies, respectively. H3 is a nuclear marker; cFBPase is a cytoplasmic marker; BIP is an ER marker to indicate the extent of endomembrane contamination in the nuclear fraction. The nuclear (N) and cytoplasmic (C) AGO1 signals were quantified and normalized to H3 and cFBPase, respectively, and values were relative to T (total extract). The experiment was repeated three times with similar results. (d) to (k) Protein co-localization analyses of NRPB1 (pNRPB1:NRPB1-mRFP) with THP1 (pTHP1:THP1-mEGFP) (d), NRPB1 with SAC3A (pSAC3A:SAC3A-mEGFP) (e), SE (pSE:SE-mRuby3) with THP1 (f), SE with SAC3A (g), NRPB1 with NUP1 (pNUP1:NUP1-mEGFP) (h), SE with NUP1 (i), NUP1 (pNUP1:NUP1-mRuby3) with THP1 (j) and NUP1 with SAC3A (k). All fluorescent protein fusion transgenic plants were generated in the Col background and crossed with each other. F1 plants were examined by confocal microscopy. Scale bar =1μm. At least three plants were examined and gave similar results.
We further performed mild formaldehyde fixation followed by nucleo-cytoplasmic fractionation to prevent the leakage of nucleoplasmic proteins or RNAs into the cytoplasm during fractionation. The conditions of formaldehyde fixation were optimized to avoid endomembrane contamination of the nuclear fraction (Extended Data Fig. 9b). HYL1 is a nucleoplasmic protein but tended to leak into the cytoplasm during fractionation in the absence of fixation; it was significantly enriched in the nuclear fraction using our improved method (Extended Data Fig. 9a). We used the improved fractionation method to examine the nucleo-cytoplasmic distribution of miRNAs in the thp1–5 mutant. We found that the examined miRNAs accumulated to higher levels in the nuclear fraction in the thp1–5 mutant as compared to wild type (Extended Data Fig. 9c,d). As miRNAs are thought to be exported together with AGO1, we further examined the nucleo-cytoplasmic distribution of AGO1. We found that AGO1 also accumulated to higher levels in the nucleus in thp1–5 as compared to Col and hst-6 (Fig. 5c, Extended Data Fig. 9b), suggesting that THP1, but not HST, is required for the nuclear export of AGO1. Taken together, these data strongly support that THP1 promotes the export of miRISCs complexes.
THP1 localizes both in the nucleoplasm and at the nuclear envelope and interacts with NUP1
Yeast TREX-2 localizes at the nuclear envelope22, but Arabidopsis TREX-2 associates with many nucleoplasmic proteins including Pol II and SE. This promoted us to examine the localization of Arabidopsis TREX-2 proteins. We generated transgenic lines harboring the transgenes pTHP1:THP1-mEGFP, pSAC3A:SAC3A-mEGFP, pNRPB1:NRPB1-mRFP, pSE:SE-mRuby3, pNUP1:NUP1-mEGFP and pNUP1:NUP1-mRuby3 individually and crossed them with one another to perform pairwise comparisons of expression patterns in the root tips of F1 seedlings. NRPB1 and SE co-localized with THP1 and SAC3A in the nucleoplasm (Fig. 5d,e,f,g), but the signals of THP1-mEGFP appeared broader than those of NRPB1 and SE (Fig. 5d,f). We suspected that the broader nuclear signals of THP1 could reflect THP1’s nuclear envelope localization since THP1 associated with NUP1 in vivo (Fig. 2a). Indeed, NUP1 signals were at the nuclear envelope (Fig. 5h,i) and THP1 co-localized with NUP1 at the nuclear envelope (Fig. 5j). NRPB1, SE, and SAC3A did not co-localize with the nuclear pore protein NUP1 (Fig. 5h,i,k), suggesting that these proteins were largely nucleoplasmic. To further examine the association between NUP1 and TREX-2, we performed IP-MS using NUP1-YFP as a bait. The NUP1 IP-MS revealed THP1 as the top hit, other than NUP1 itself (Fig. 2a and Supplementary Table 2). Conversely, NUP1 was the most frequently identified protein, other than THP1 itself, from the THP1 IP-MS (Fig. 2a and Supplementary Table 2). This finding, together with the absence of nuclear pore localization of SAC3A (Fig. 5k), strongly indicated that a complex containing NUP1 and THP1 exists at the nuclear pore. It is noted that SAC3A, SAC3B, and SAC3C were also among the hits from NUP1 IP-MS (Fig. 2a and Supplementary Table 2). Given that SAC3A is not localized to the nuclear envelope (Fig. 5k), we suspect that SAC3A was pulled down by NUP1 fortuitously: SAC3A might have associated with NUP1 through THP1 after the NUP1-THP1 complex is released from the nuclear pore during IP-MS. It was shown that SAC3B is localized at the nuclear envelope24. It remains to be determined whether SAC3C associates with the nuclear envelope. These results indicate that TREX-2 functions at the nucleoplasm where factors in miRNA biogenesis (Pol II and SE) are localized. Meanwhile, THP1 and NUP1 interact and co-localize at the nuclear envelope and may have other functions.
NUP1 promotes miRISC nuclear export
Given that THP1 and NUP1 co-localize and interact with each other, we wondered whether NUP1 plays a role in miRNA biogenesis. The null allele nup1–2 is male gametophytic lethal24, which precludes the analysis of nup1–2 homozygous mutants. During the generation of a series of pNUP1:NUP1-mEGFP transgenic lines, we noticed plants with developmental defects and suspected that they may be nup1 co-suppression lines (nup1-cs) (Fig. 6a and Extended Data Fig. 10a). We examined the levels of NUP1 transcripts in six pNUP1:NUP1-mEGFP transgenic lines, two with normal morphology and four with developmental defects. RT-PCR was performed with primers that detected both endogenous NUP1 transcripts and those from NUP1-mEGFP. As expected, the two lines with normal morphology had similar levels of NUP1 RNA as compared to Col, whereas the four lines with developmental defects had very low levels of NUP1 RNA (Extended Data Fig. 10b). Consistently, NUP1-mEGFP protein was only detectable in the two lines with normal morphology (Extended Data Fig. 10c). This suggested that the four lines with low NUP1 mRNA and no NUP1-mEGFP protein were nup1-cs lines. The strong nup1-cs lines showed abnormal flower development and greatly reduced fertility (Fig. 6a and Extended Data Fig. 10a), and we chose a weaker line that could produce some seeds for further experiments. We collected nup1-cs inflorescence tissue and performed small RNA sequencing together with Col and thp1–5 for comparison. We found that most miRNAs were similar in abundance between Col and nup1-cs, while a global reduction of miRNA levels was found in thp1–5 (Fig. 6b). RNA gel blot assays showed that miR166 and miR172 were similar in abundance between Col and the nup1-cs line (Extended Data Fig. 10d), suggesting that miRNA levels are not altered in nup1-cs.
Figure 6. NUP1 promotes the nuclear export of miRNAs and AGO1.
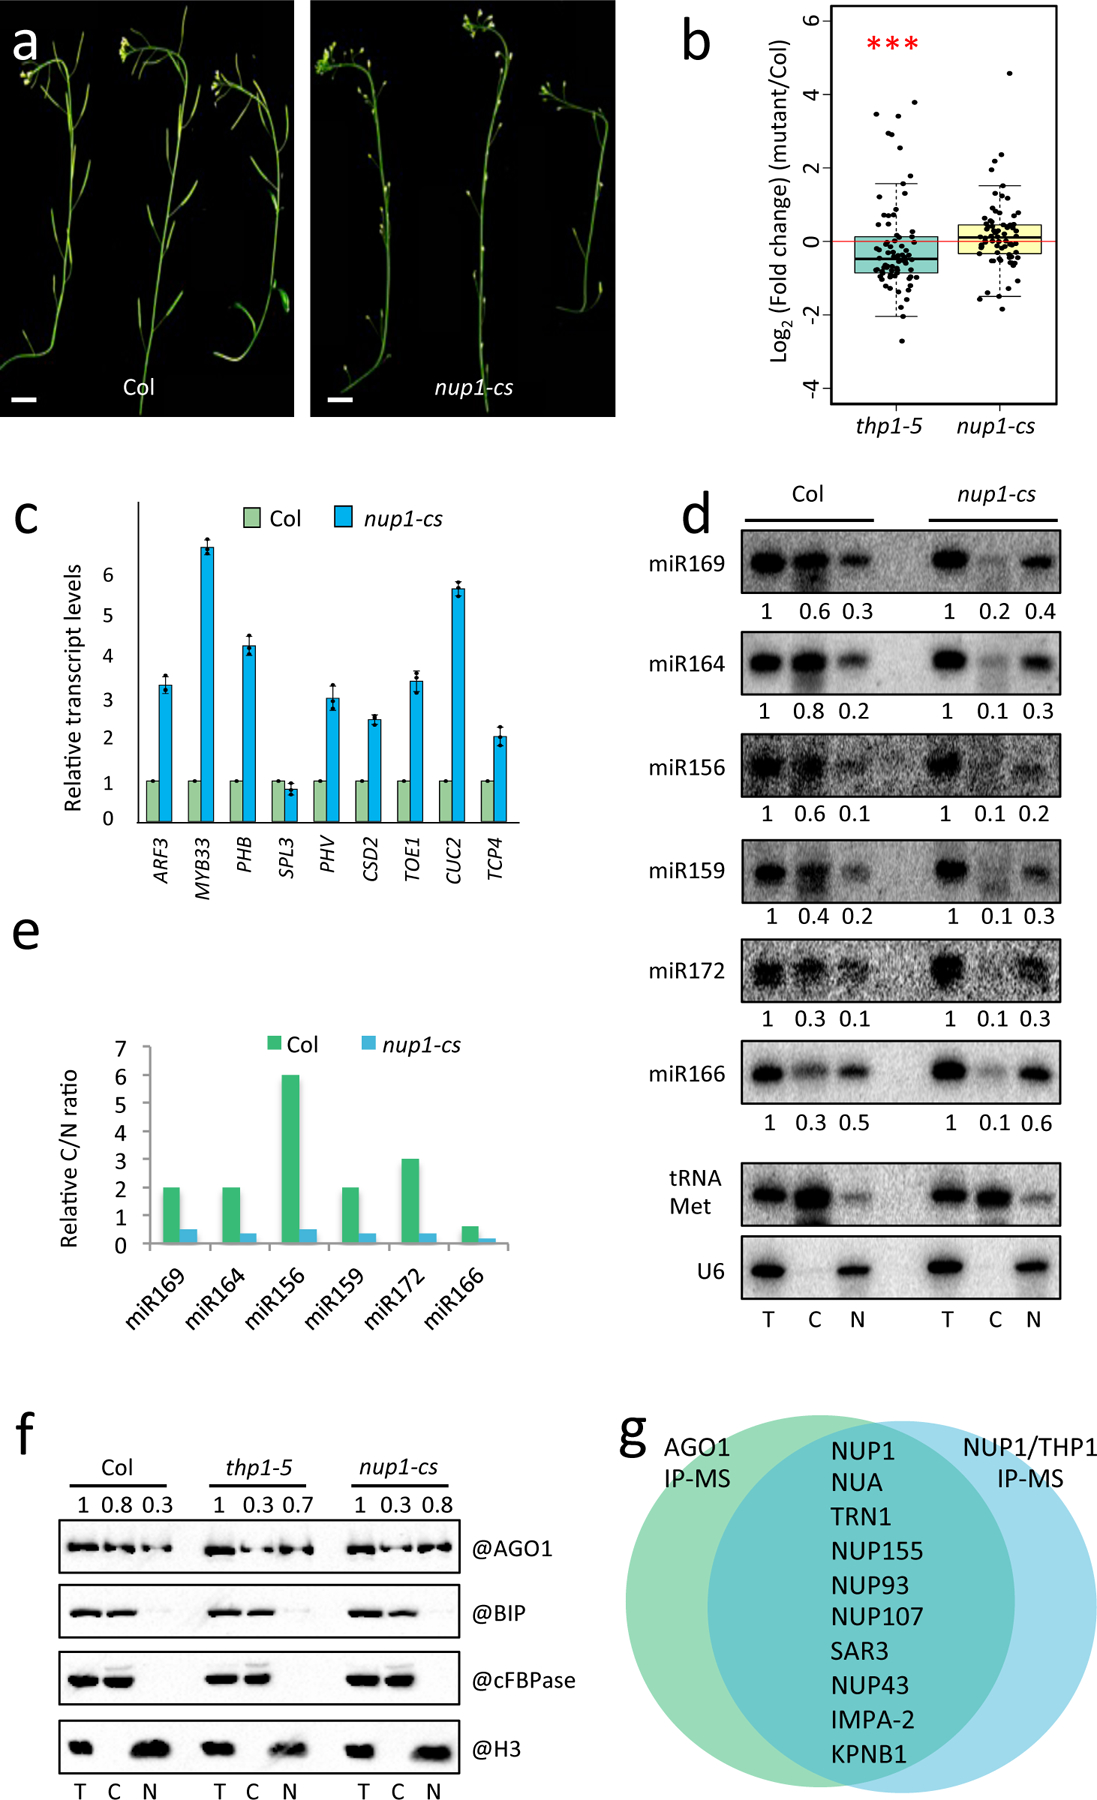
(a) Inflorescences from 45-day-old wild-type plants (Col) and nup1-cs (nup1 co-suppression) lines showing the sterility of the latter. Scale bar =10 mm. (b) Global changes in levels of 74 most abundant miRNAs in thp1–5 and nup1-cs inflorescences relative to wild type as determined by small RNA sequencing. The P values were determined by a paired two-sided Wilcoxon test. A significant reduction was found for thp1–5 but not nup1-cs. ***, P value=0.009267; n.s. P value=0.2214. The five horizontal lines of each box indicate the minimum, the first quartile, the median, the third quartile, and the maximum of the data from the bottom to the top. (c) Determination of miRNA target mRNA levels in Col and nup1-cs inflorescences by RT-qPCR. The housekeeping gene IPP2 was included as a control. Error bars indicate standard deviation from three biological replicates. (d) Small RNA gel blot analysis to determine the levels of miRNAs from total extract (T) and from the cytoplasmic (C) and nuclear (N) fractions in Col and nup1-cs. U6 and tRNA-Met served as nuclear and cytoplasmic RNA markers, respectively. They also served as the loading controls for the nuclear and cytoplasmic fractions for quantification of miRNA levels. The experiment was repeated two times with similar results. (e) The cytoplasmic/nuclear ratios of miRNAs as determined in (d). (f) Protein gel blot assays to determine the nucleo-cytoplasmic partitioning of AGO1 in Col, thp1–5 and nup1-cs. The fractions were subjected to protein gel blot analysis using anti-AGO1, anti-cFBPase, anti-H3 and anti-BIP antibodies, respectively. H3 is a nuclear marker and is also used in the quantification of AGO1 in the T and N samples. cFBPase is a cytoplasmic marker and is also used in the quantification of AGO1 in the T and C samples. BIP is an ER marker to indicate the lack of endomembrane contamination in the nuclear fractions. The experiment was repeated three times with similar results. (g) A diagram showing the nuclear pore proteins identified from NUP1 IP-MS, THP1 IP-MS and nuclear AGO1 IP-MS.
We then examined the transcript levels of several miRNA target genes in nup1-cs by RT-qPCR. Intriguingly, most miRNA targets were derepressed in nup1-cs as compared with Col (Fig. 6c), implying that miRNA activities were compromised in nup1-cs. Based on the evidence that NUP1 interacted and co-localized with THP1 at the nuclear envelope, we suspected that the nuclear export of miRNAs might be affected in nup1-cs. We examined the nucleo-cytoplasmic distribution of miRNAs and AGO1 in nup1-cs. We found that both examined miRNAs and the AGO1 protein showed increased levels in the nuclear fraction in nup1-cs (Fig. 6d,e,f, Extended Data Fig. 10e,f). This indicated that NUP1 also promotes the nuclear export of miRNAs and AGO1.
To probe the possible mechanism by which THP1 and NUP1 promote the nuclear export of miRISCs, we first isolated nuclei and then performed AGO1 IP-MS. We found that NUP1 was among the proteins identified in the nuclear AGO1 IP-MS (Fig. 6g and Supplementary Table 4). Besides NUP1, many other nucleoporins, exportins and importins were associated with nuclear AGO1. These proteins were also present in the lists of protein hits from IP-MS using NUP1-YFP or THP1-EYFP as the bait (Fig. 6g and Supplementary Table 2). These results suggested that miRISCs are exported through the nuclear pore and that THP1, importins and exportins are involved in the export.
Discussion
miRNA biogenesis is a multistep process in the nucleus culminating in the export of miRISCs to the cytoplasm. Although pri-miRNA processing is likely co-transcriptional, and several factors aid both the transcription and processing steps in miRNA biogenesis, it is not known whether subsequent steps in miRNA biogenesis, such as miRISC formation and miRISC export, are coordinated with the transcription and processing steps. In this study, we show that TREX-2 coordinates the transcription, processing, and miRNA export steps in miRNA biogenesis. We found that TREX-2 (1) interacts with the transcriptional machinery to promote MIR gene transcription, (2) interacts with the dicing complex component SE, and the phosphatase CPL1 to dephosphorylate the dicing complex component HYL1 and promote Dicing body formation, and recruits HYL1 and DCL1 to MIR loci, and (3) promotes miRISC export, maybe through its interactions with the NPC and exportins/importins including XPO1 (CRM1). Coordinating the transcription, processing and export steps in miRNA biogenesis may increase the efficiency of miRNA biogenesis.
TREX-2 is required for the coordination of MIR gene transcription and pri-miRNA processing
In human cells, both intronic and independently transcribed pri-miRNAs are co-transcriptionally processed by Drosha36, 37. Plant MIR genes are similar with protein coding genes in that their promoters contain the TATA-box motif and other transcription factor binding motifs38, 39. The transcription of MIR genes requires general and specific transcription regulators39. To date, many MIR transcription regulators, such as NOT2, DDL, Elongator, and MAC subunits PRL1/PRL2 and CDC5 have been shown to interact with both Pol II and the dicing complex7, 10, 11. Moreover, mutants with defects in D-body formation, such as those in MAC7, PP4R3, PRL1 and CDC5 genes, also exhibit reduced pri-miRNA levels that reflect defects in transcription7, 9–11, 40. These studies point to co-transcriptional processing of pri-miRNAs. In fact, DCL1 was found to associate with MIR gene promoters in an RNA-dependent manner6. In this study, we found that TREX-2 subunits THP1 and SAC3A interact with Pol II, NOT2B, CDC5 and promote MIR gene transcription. TREX-2 also interacts with the dicing complex component SE and promotes HYL1 dephosphorylation through CPL1. Furthermore, we showed that HYL1 is present at MIR loci. Therefore, our study further supports the conclusion that pri-miRNAs are co-transcriptionally processed.
HYL1 is a major component of the microprocessor and forms sub-nuclear foci known as D-bodies12, 41. The activity and dynamics (such as levels and nucleo-cytoplasmic shuttling) of HYL1 are highly regulated via phosphorylation/dephosphorylation32, 33, 42. Here, we show that TREX-2 regulates HYL1 activity, with the evidence being that (1) TREX-2 interacts with CPL1, a HYL phosphatase, and the ratio of phosphorylated/non-phosphorylated HYL1 is increased in thp1–5; (2) D-body formation is compromised in thp1–5; and (3) there is a reduction in HYL1’s occupancy at MIR gene loci in thp1–5. HYL1 protein phosphorylation is increased under ethylene treatment33. THP1 was also identified as EER5 (Enhanced Ethylene Response 5), which regulates the expression of a subset of ethylene-responsive genes31, 43. Thus, TREX-2 may also regulate HYL1 protein dynamics to influence miRNA biogenesis in response to environmental signals.
Yeast TREX-2 functions in mRNA export and promotes the transcription of highly inducible genes by targeting these genes to the NPCs (also known as gene gating)44. The interaction between TREX-2 and Mediator is required for gene gating and normal transcription in yeast22. Although plant TREX-2 may not directly interact with Mediator, the direct protein-protein interaction with Pol II and the role of TREX-2 in MIR gene transcription strongly support a direct role of TREX-2 in gene transcription. Unlike its counterpart in yeast, plant TREX-2 is not restricted to the nuclear pore. The nucleoplasm-localized TREX-2 may function in MIR gene transcription and pri-miRNA processing. Whether the plant TREX-2 causes gene gating is unknown. Further sub-nuclear studies to examine the spatial relationships among MIR loci, D-bodies and NPCs will provide insights.
TREX-2 and NUP1 promote the nuclear export of miRISCs
In animals, the two major processing steps in miRNA biogenesis (pri-miRNA to pre-miRNA and pre-miRNA to mature miRNA) occur in the nucleus and the cytoplasm, respectively, with Exportin 5 (Exp5) binding to and exporting pre-miRNAs35. In plants, the entire miRNA biogenesis process occurs within the nucleus, with miRISCs being exported to the cytoplasm. Arabidopsis HST is homologous to Exp5, and has been claimed to act in miRNA export in review papers2, 4, 45–47, although the original study on HST did not claim such a function34. It was shown that the abundance of miRNAs is lower in hst mutants, but the nucleo-cytoplasmic distribution of miRNAs is not altered34. Consistent with this, the nucleo-cytoplasmic partitioning of AGO1 was found to be unaffected in the hst-6 mutant in this study. It was reported that AGO1 and miRNAs are exported as a complex through the nuclear pore in a Leptomycin-B-inhibited and NES-dependent manner3. Our results revealed nuclear accumulation of both miRNAs and AGO1 in thp1–5 and nup1-cs, suggesting that THP1 and NUP1 promote the nuclear export of miRISCs, although evidence of direct association between miRISC and TREX-2 or NUP1 is lacking. A common set of nucleoporins and importins/exportins interacts with both THP1/NUP1 and AGO1 and may underlie the function of THP1/NUP1 in miRISC export. Particularly, the Arabidopsis CRM1 proteins XPO1A and XPO1B, which were proposed to be required for NES-dependent miRISC export3, were found in our THP1 and NUP1 IP-MS (Supplementary Table 4).
We note that amiRSUL was only reduced to 40% of wild-type levels in thp1–5 amS while the leaf bleaching phenotype was nearly completely suppressed. We suspect that the strong phenotype is contributed by both reduced levels of amiRSUL and inefficient miRNA nuclear export. Alternatively, THP1 also promotes the cell-to-cell trafficking of amiRSUL, for which no evidence is yet available.
In summary, our studies show that Arabidopsis TREX-2 associates with Pol II and the microprocessor in the nucleoplasm and couples the transcription and processing steps of miRNA biogenesis. In addition, THP1, together with NUP1, promotes the export of miRISCs to the cytoplasm through the nuclear pore (Fig. 7). The promotion of the transcription, processing, and export steps of miRNA biogenesis by TREX-2 could be explained by its dual localization in both the nucleoplasm and at the nuclear pore. Although SAC3A is only localized in the nucleoplasm (Fig. 5k), SAC3B is localized at the nuclear envelope24. Thus, it is possible that the nucleoplasmic TREX-2 consists of SAC3A and other subunits while the nuclear pore localized TREX-2 consists of SAC3B and other subunits. THP1 might be shuttling between the nucleoplasm and the nuclear pore to coordinate nucleoplasmic miRNA biogenesis with miRISC nuclear export.
Figure 7. mTREX-2 in miRNA biogenesis.
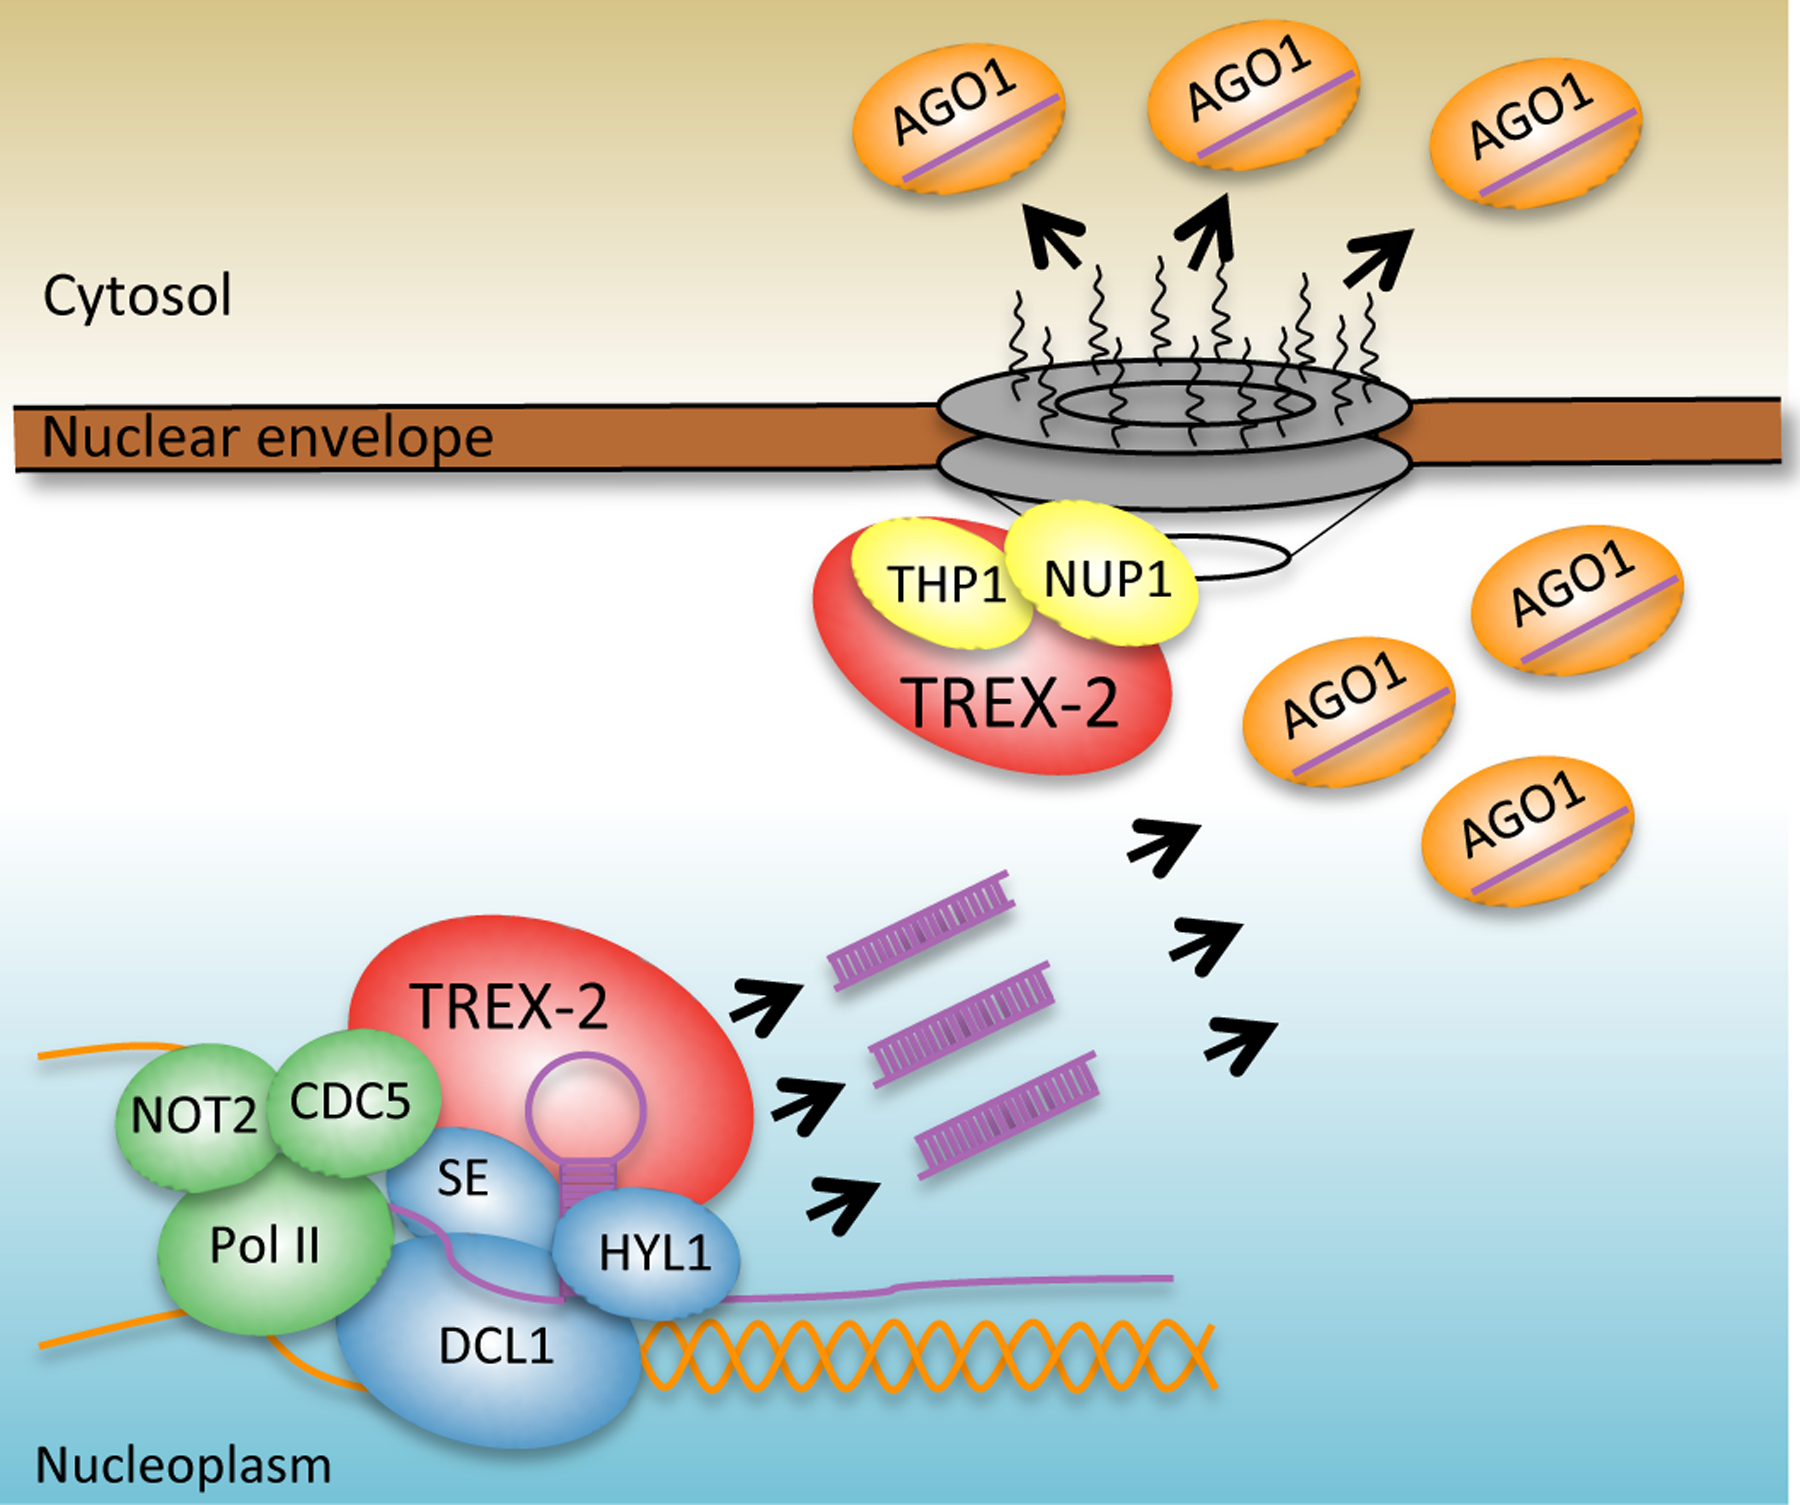
TREX-2 associates with Pol II and microprocessor (SE, DCL1 and HYL1) in the nucleoplasm to coordinate the transcription of MIR genes and the processing of pri-miRNAs. TREX-2 also interacts with NUP1 and promotes the export of miRISC to the cytoplasm.
Materials and methods
Plant materials and growth conditions
All Arabidopsis mutants and transgenic lines are in the Columbia (Col-0) ecotype. All plants were grown on soil or on ½ MS plates in growth rooms at 22°C under full-spectrum white fluorescent light under long-day (16 h light/8 h dark) or short-day (8 h light/16 h dark) conditions. The pSUC2:amiR-SUL line was from Dr. Detlef Weigel25. thp1–5 was isolated from our EMS mutagenesis screen with the pSUC2:amiR-SUL (amS) line; thp1–3 (essp1) and pNUP1:NUP1-YFP were from Dr. Yuhai Cui24; and thp1–1 (eer5–2, SAIL_82_A02) was from the Arabidopsis Biological Resource Center (ABRC). pMIR167a:GUS and p35S:HYL1-YFP were described9. sac3 single mutants were from ABRC, and the sac3 double and triple mutants were generated in this study. pTHP1:THP1-EYFP, pTHP1:THP1-mEGFP, pTHP1:THP1-mCerulean3, pNRPB1:NRPB1-mRFP, pSE:SE-mRuby3, pSAC3A:SAC3A-mEGFP, pNUP1:NUP1-mEGFP and pNUP1:NUP1-mRuby3 transgenic lines were generated in this study. To generate the plasmids of the above transgenes, full-length genomic regions of the genes including 1500 to 4000 bp promoter regions were amplified and cloned into the pTSK108 vector. The clones were verified by sequencing and the inserts with the different genes were transferred into the pGWB binary vectors48 or our newly created pGWB binary vectors (Supplementary Table 5) using LR Clonase II enzyme mix (Invitrogen) to generate the T-DNA constructs. The binary vectors were used in Agrobacterium-mediated transformation to produce transgenic plants in the Col background.
EMS mutagenesis and mutation mapping
EMS mutagenesis was performed as described49. The identification of the thp1–5 mutation through whole genome re-sequencing was as described9, 50. The thp1–5 amS mutant was backcrossed with the parental line amS line. Genomic DNA was extracted from 150 pooled F2 mutants and used in library construction. The library was paired-end sequenced on Illumina’s HiSeq 2000 at ~30x coverage, and the reads were mapped to the TAIR 10 genome. Three candidate mutations (the other two mutated genes are AT2G13540 and AT5G42090) with 100% mutation rate in the reads were EMS-typical C:G to T:A transitions that were predicted to cause nonsynonymous substitutions in the coding regions of genes. Linkage analysis was performed on 96 individual mutant plants in the F2 population of the backcross using three dCAPS (Derived Cleaved Amplified Polymorphic Sequences) markers to assess linkage between the mutations and the vein bleaching phenotype. Only the mutation in THP1 was found to be homozygous in all 96 plants, suggesting that this mutation was responsible for the phenotype.
Small RNA gel blot analysis and sequencing
Small RNA gel blot analysis was performed as described51. ~5–10 μg total RNA was extracted from seedlings or inflorescences, resolved on 15% urea-PAGE gels and transferred to nylon membranes. 5’ end 32P-labelled antisense DNA oligonucleotides were used to detect miRNAs. Oligonucleotide probes used are listed in Supplementary Table 6.
For small RNA-sequencing, small RNAs of 18–40 nucleotides (nt) were isolated from total RNA resolved on 15% urea-PAGE gels. Small RNA libraries were constructed following instructions from the NEBNext Multiplex Small RNA Library Prep Set for Illumina (E7300). The libraries were sequenced on Illumina Hiseq 2500. The resulting data were analyzed by a homemade pipeline pRNASeqTools v0.4 (https://github.com/grubbybio/RNASeqTools). The raw reads were trimmed to remove the 3’ adaptor sequences and filtered based on size (18–42 nt) and quality using cutadapt v1.9.1. Trimmed reads then were aligned to the Arabidopsis genome (Araport11) using ShortStack v3.452 with parameters ‘-bowtie_m 1000 -ranmax 50 -mmap u -mismatches 0’. Normalization was performed by calculating the RPMR (reads per million of 45S rRNA reads) value for each miRNA, and comparison was conducted by DESeq253.
PCR-based transcript analysis
To perform RT-PCR, total RNAs from 10-day-old seedlings or inflorescences were treated with DNase I (Roche) and purified. 5 μg purified RNA was reverse-transcribed using RevertAid Reverse Transcriptase (Thermo Fisher Scientific) with oligo-d(T) primers according to manufacturer’s instructions. Quantitative RT-PCR was carried out in triplicate using the iQ SYBRGreen Supermix (BioRad) on the BioRad CFX96 system. Primers used are listed in Supplementary Table 6.
Yeast two-hybrid assays
The Y2H assays were performed as described54 according to the Matchmaker Gold Y2H system user manual (Clontech). Constructs of the TREX-2 components were from Yuhai Cui’s lab24. pGBKT7-NRPB1-CTD, pGBKT7-CDC5, pGBKT7-NOT2B and pGBKT7-SE were from Yijun Qi’s lab6. Other full-length or truncated cDNAs were amplified and cloned into the pGBKT7 or pGADT7 vectors (Clontech), and verified by sequencing. For the Y2H assays, the pGBKT7 and pGADT7 plasmids with the genes to be tested were transformed into the Y2H Gold and Y187 yeast strains, respectively. The two yeast strains were mixed for mating, and the mating mixture was transferred to the DDO (lacking Trp and Leu) and QDO/X/A (lacking His, Ade, Trp, and Leu and containing X-α-gal and Aureobasidin A) media for selection of diploids and those with reporter gene expression, respectively.
Protein gel blot, Co-IP and IP-MS analyses
12-day-old seedlings or inflorescences were ground to a fine powder in liquid nitrogen and the powder was resuspended in IP buffer (50mM Tris-HCl, pH7.5, 150mM NaCl, 10% glycerol, 0.1% NP-40 and complete protease inhibitor (Roche)) and incubated for 30 min with gentle rotation at 4°C. The protein suspensions were centrifuged at 16,000g for 10 min to remove debris. The supernatant was incubated with GFP-Trap or RFP-Trap (ChromoTek) for 2h at 4°C, and then the beads were washed with IP buffer five times and boiled in SDS sample buffer (50 mM Tris-HCL at pH 6.8, 2% SDS, 10% glycerol, 0.1% bromophenol blue, 1% 2-mercaptoethanol). The proteins were resolved in 8%−12% SDS-PAGE gels and detected with corresponding antibodies.
For IP-MS, the same IP procedure was performed and the proteins were resolved in 5% SDS-PAGE gels. After Coomassie staining, the entire lane was subjected to mass spectrometry as described9.
ChIP assays
12-day-old Arabidopsis seedlings were crosslinked in buffer (0.4 M sucrose, 10 mM Tris-HCl pH8.0, 1 mM EDTA, 1 mM PMSF, 1% proteinase inhibitor cocktail, 1% formaldehyde) and crosslinking was stopped by 100 mM (final concentration) glycine, with both treatments carried out at room temperature under vacuum. The plant material was ground to a fine powder, which was resuspended in cold nuclei isolation buffer (0.25 M sucrose, 15 mM PIPES pH6.8, 5 mM MgCl2, 60 mM KCl, 15 mM NaCl, 1 mM CaCl2, 0.9 % Triton X-100, 1 mM PMSF, 1% proteinase inhibitor cocktail). The suspension was filtered and centrifuged at 11,000g for 20 min at 4°C. The pellet (nuclei) was resuspended in nuclei lysis buffer (50 mM HEPES pH7.5, 150 mM NaCl 1 mM EDTA, 1% SDS, 0.1% sodium deoxycholate, 1% Triton X-100, 1% proteinase inhibitor cocktail). The samples were sonicated with Ultrasonicator (Covaris S220) at the peak power 140 for 80 seconds (in a 130 μl tube) and were centrifuged at 13,800g at 4°C to pellet debris. The supernatant (sonicated chromatin) was collected and diluted with ChIP dilution buffer (50 mM HEPES pH7.5, 150 mM NaCl, 1 mM EDTA, 0.1% sodium deoxycholate, 1% Triton X-100, 1% proteinase inhibitor cocktail). The chromatin sample was precleared with salmon sperm DNA/protein A agarose beads followed by incubation with antibodies with gentle rotation overnight at 4°C. Protein A beads were added and incubated for 2 h at 4°C with shaking. The beads were washed by the low-salt wash buffer (150 mM NaCl, 20 mM Tris-HCl pH8.0, 0.2% SDS, 0.5% Triton X-100, 2 mM EDTA), high-salt wash buffer (500 mM NaCl, 20 mM Tris-HCl pH8.0, 0.2% SDS, 0.5% Triton X-100, 2 mM EDTA), and LiCl wash buffer (0.25 M LiCl, 1% sodium deoxycholate, 10 mM Tris-HCl pH8.0, 1% CA630, 1 mM EDTA) and twice with TE buffer (1 mM EDTA, 10 mM Tris-HCl pH8.0). The chromatin was eluted with elution buffer (1mM NaHCO3 and 1% SDS) and crosslinking was reversed. Removal of protein and RNA was achieved by adding 20 μl 5 M NaCl and 1.5 μl 18.9mg/ml proteinase K and 1 μl 1 mol/L RNase A per 500 μl. DNA was extracted by the Qiagen PCR purification Kit and eluted in 100 μl TE buffer, and 2–3 μl was used as the template for qPCR.
Bimolecular Fluorescence Complementation (BiFC) assays
BiFC assays were performed as described55. The THP1 and SAC3A cDNAs were amplified by RT-PCR and cloned into the pXY104 vector54. The NRPB1 and SE cDNAs were amplified and cloned into the pXY106 vector54. After their sequences were verified, the resulting cassettes, including the constitutive promoters and gene fusions, were introduced into Agrobacterium. For BiFC experiments, leaves of 3-week-old N. benthamiana plants were co-infiltrated with two Agrobacterium strains containing the appropriate constructs for the two proteins to be tested. After 36–48 h, signals of YFP were analyzed by confocal microscopy (Zeiss LSM800 and LSM880).
Nuclear-cytoplasmic fractionation
12-day-old seedlings were ground to a fine powder in liquid nitrogen and the powder was resuspended in lysis buffer (20 mM Tris-HCl, pH7.5, 20 mM KCl, 2 mM EDTA, 2.5 mM MgCl2, 25% Glycerol, 250 mM Sucrose, 5 mM DTT and protease inhibitor cocktail (Roche)) 2 ml/g. The resuspension was filtered through two layers of miracloth. The flow through was centrifuged at 1500g for 10 min at 4°C. The supernatant was centrifuged at 10,000g for 10 min at 4°C, and the supernatant was collected as the cytoplasmic fraction. The pellet from the 1500g spin was washed eight times with 8 ml of nuclear resuspension buffer 1 (NRB1) (20 mM Tris-HCl, pH7.4, 2.5 mM MgCl2, and 0.2% Triton X-100) and then resuspended with 500 μl of NRB2 (20 mM Tris-HCl, pH7.5, 10 mM MgCl2, 250 mM Sucrose, 0.5% Triton X-100, 5 mM beta-mercaptoethanol and protease inhibitor cocktail) and carefully overlaid on top of 500 μl NRB3 (20 mM Tris-HCl, pH7.5, 10 mM MgCl2, 1.7 M Sucrose, 0.5% Triton X-100, 5 mM beta-mercaptoethanol and protease inhibitor cocktail). The sample was centrifuged at 16,000g for 45 min at 4°C. The final nuclear pellet was used for RNA isolation using the Trizol method.
For the improved nucleo-cytoplasmic fractionation approach, 12-day-old seedlings were cross-linked in 0.5% formaldehyde/1X PBS buffer under vacuum for 15 min at room temperature. Crosslinking was stopped by the addition of glycine to a final concentration of 100 mM followed by incubation for 5 min under vacuum at room temperature. The plant material was washed in 1X PBS buffer and frozen in liquid nitrogen. The frozen tissue then underwent the same nucleo-cytoplasmic fractionation procedure as described above.
GUS staining
Inflorescences from Col-0 and thp1–5 harboring a homozygous pMIR167a:GUS transgene were vacuum infiltrated with the GUS staining solution (1 mM EDTA, 5 mM Potassium Ferricyanide, 5 mM Potassium Ferrocyanide, 100 mM Sodium Phosphate, 1% Triton-X-100, 1 mg/ml X-Gluc) for 10 min and then incubated at 37°C for 2 hours. Tissue clearing was performed with 70% ethanol for 2 days before imaging.
Immunofluorescence and confocal microscopy
For DCL1 immunofluorescence, inflorescence tissue was collected and fixed with 4% paraformaldehyde in 1X PBS for 20 min under vacuum. The tissue was quenched by 50 mM NH4Cl (in 1X PBS) and was washed three times with 1X PBS. The tissue was chopped on a glass slide in nuclei isolation buffer (500 mM sucrose, 100 mM KCl, 10 mM Tris-HCl, pH9.0, 10 mM EDTA, 4 mM spermidine, 1 mM spermine) and nuclei were isolated by filtering the tissue suspension through a 100 μm nylon mesh and centrifuging the filtrate at 500g for 3min. The nuclei were resuspended in 5% acrylamide-bisacrylamide (29:1) in nuclei isolation buffer. 2.5 μl of the suspension was spotted on a slide, covered with coverglass, and let air-dry at room temperature for 2 hours. The coverglass was removed and a hybridization chamber was formed around the spot containing the nuclei. The entire immunofluorescence procedure was performed in the hybridization chamber: the samples were treated with 0.5% Triton X-100 (10 min), 3% CA630 in 1X PBS (1 hour), 1X PBS (5 min for 3 times), 1% BSA (30 min at 37 °C), 1:100 primary antibody (3 hours at 37 °C), 1X PBS (8 min for 6 times), 1:300 secondary antibody (1 hour at 37 °C), 1X PBS (10 min for 6 times), 1:3000 DAPI staining (20 min at room temperature) and 1X PBS (5 min for 2 times). The hybridization chamber was removed, and the sample was mounted with vestashield and sealed with nail polish. Images were captured with a Zeiss 800 fluorescence confocal microscope.
To generate anti-DCL1 antibody, a recombinant protein of DCL1 (Amino acids 1–250)-GST was expressed, purified and used as the antigen to raise polyclonal antibodies in rabbits. The anti-serum was affinity-purified using a DCL1-GST-His conjugated column. The specificity of the antibody was validated by immunoblotting with wild-type and dcl1–9 plants.
For protein co-localization experiments, root tips from 5-day-old seedlings were directly examined for fluorescent signals under a Zeiss 800 fluorescence confocal microscope.
mRNA-seq library construction and data analysis
Three batches of 12-day-old Col-0, thp1–5 and sac3b-1/sac3b-2 sac3c-1/sac3c-1 seedlings were used for total RNA extraction. Polyadenylated RNA was isolated from total RNA using the Magnetic mRNA Isolation Kit (New England Biolabs). RNA-seq libraries were prepared using NEBNext mRNA Library Prep Reagent Set for Illumina (New England Biolabs) and sequenced on an Illumina Hiseq 2500 platform to generate high-quality single-end reads of 101bp in length. Data analysis was performed with the pRNASeqTools pipeline (https://github.com/grubbybio/RNASeqTools). The raw reads were aligned to the TAIR10 genome using HISAT256. Transcript levels were measured in reads per million total read counts. Differentially expressed genes were identified using DEseq2 with fold change of 2 and p < 0.01 as the parameters53. The p value of overlapped genes between two sets was calculated by SuperExactTest57. GO analysis was performed by agriGO58
Data availability
Raw sequence data generated during this study were deposited into the NCBI GEO database under the accession code GSE150473. The source data for Figures and Extended Data Figures are provided as Source Data files. The authors declare that any other supporting data is available from the corresponding author upon request.
Extended Data
Extended Data Fig. 1. Small RNA sequencing of thp1–5 amS.
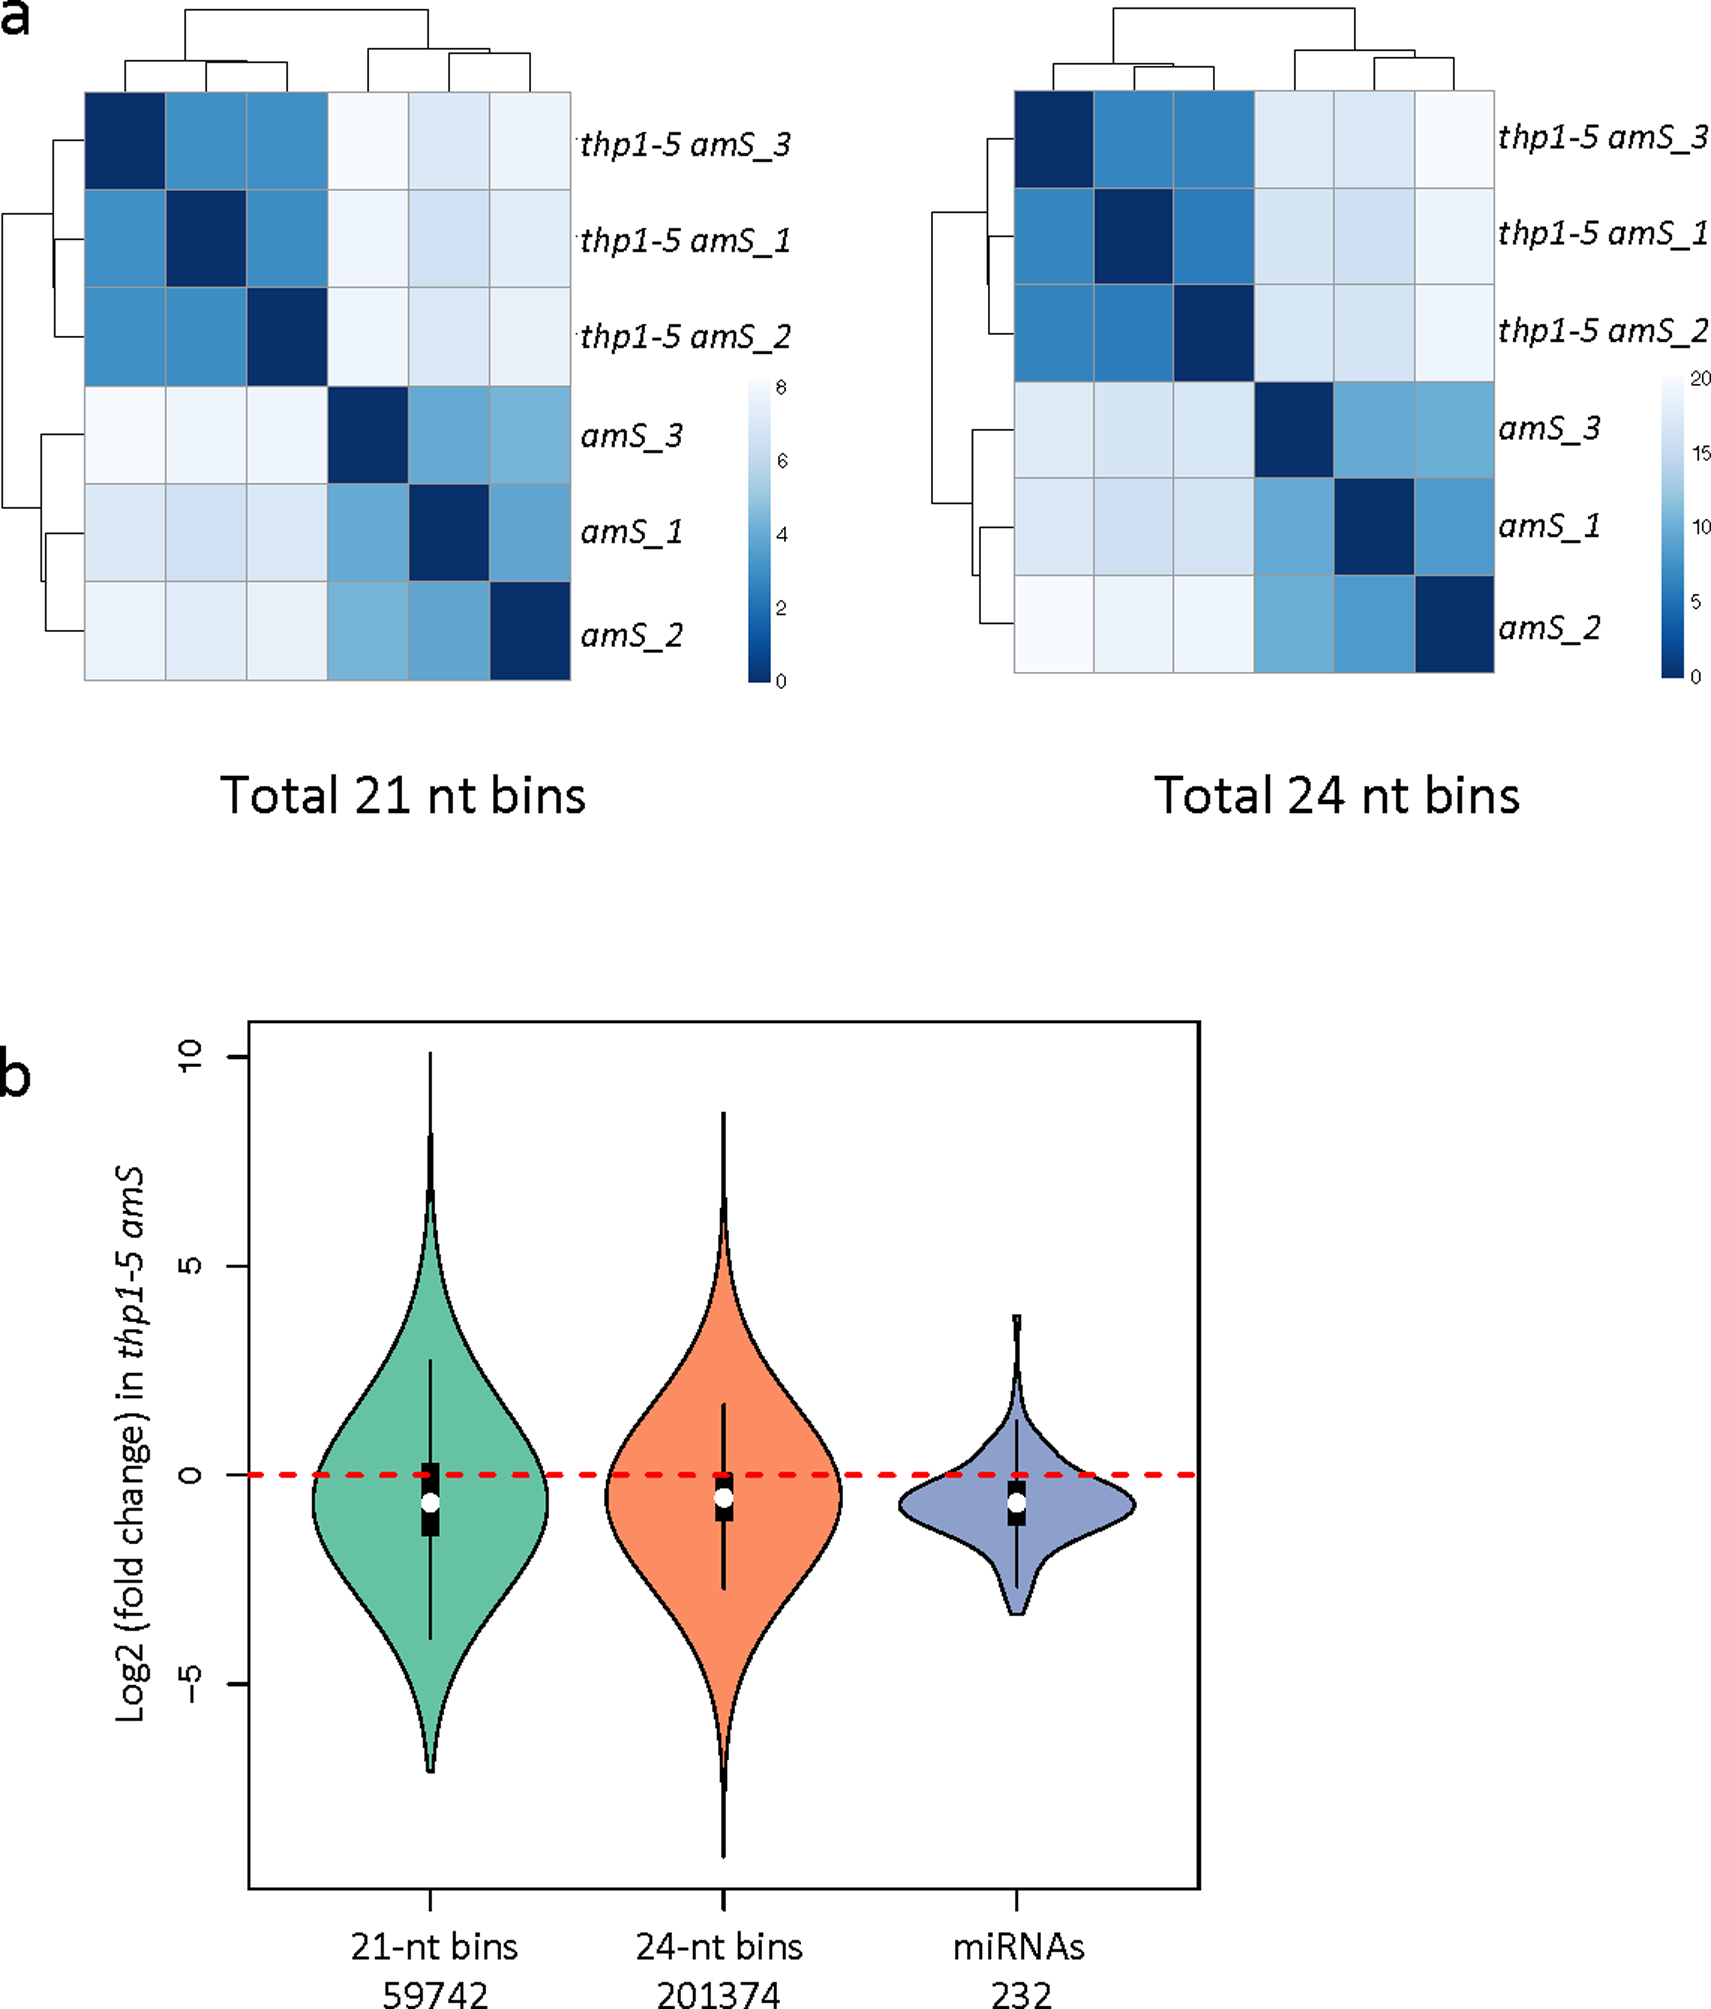
(a) Heatmaps to show reproducibility among amS and thp1–5 amS biological replicates. The whole genome was divided into 100-bp bins, and small RNA reads whose 5’ ends located in a bin were assigned to this bin. Color density indicates distance calculated by log-transformed normalized read counts assigned to each bin. (b) Distribution of fold changes for all detected miRNAs (n=232) and 21 nt (n=59742 windows of 100bp) and 24 nt (n=201374 windows of 100bp) small RNAs in thp1–5 amS relative to amS. The lower extreme, the lower hinge, the white dot, the upper hinge, and the upper extreme of the black box represent the minimum, the first quartile, the median, the third quartile, and the maximum of the data. The violin shape corresponds to the density of data. ***, P-value < 2.2e-16. P-values were determined by a paired two-sided Wilcoxon test.
Extended Data Fig. 2. Defects of thp1 mutants.
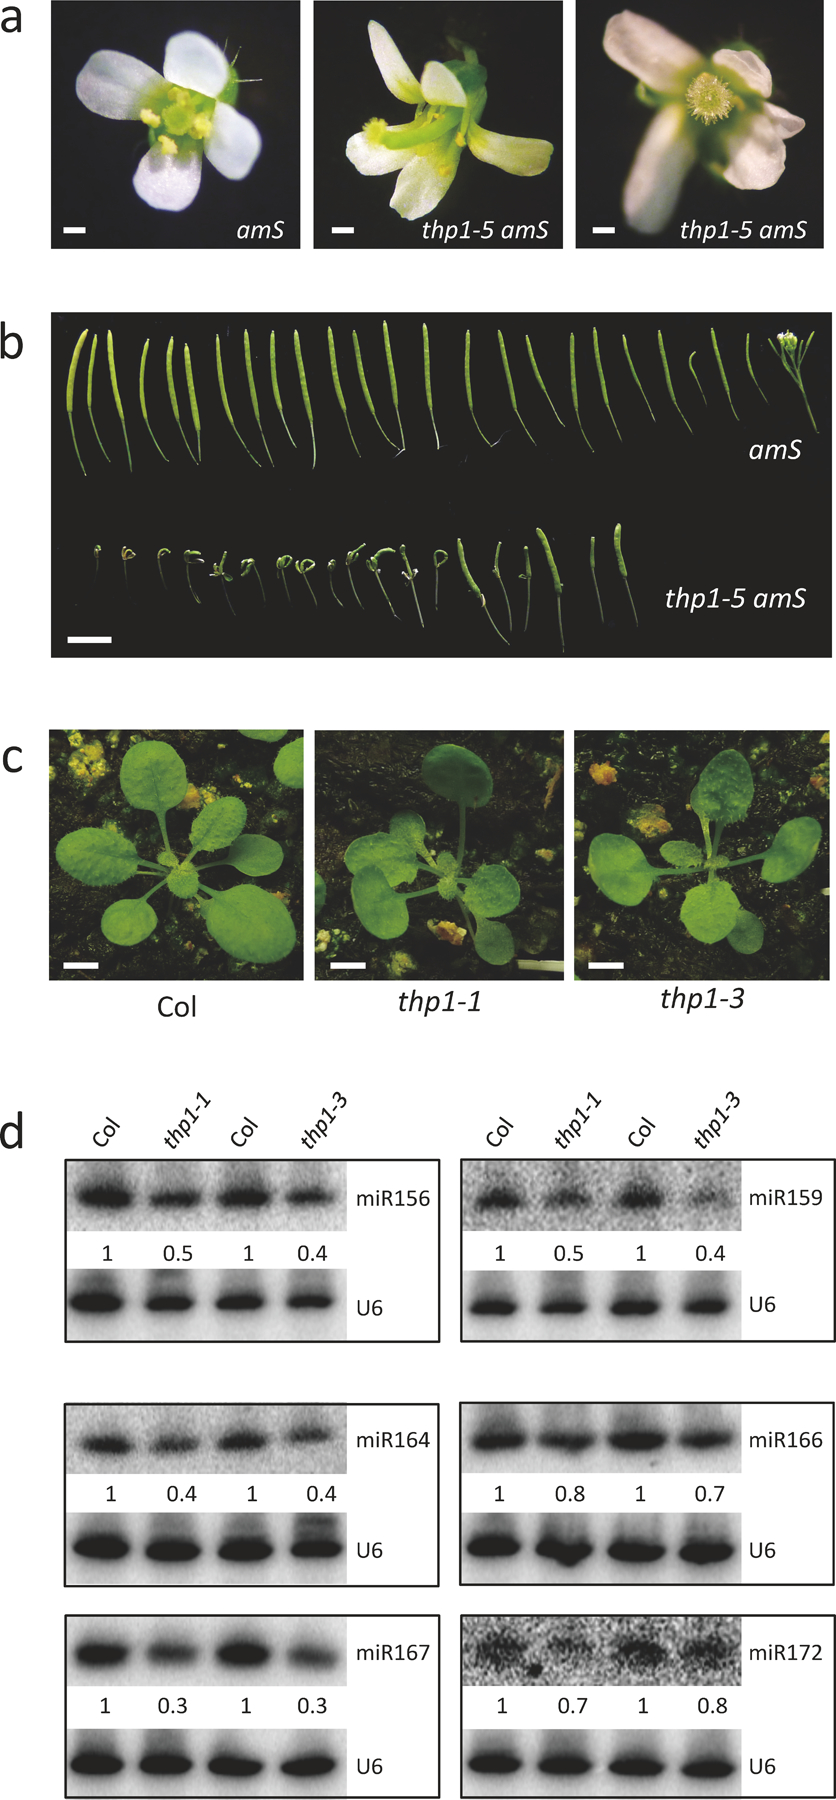
(a-b) Flowers (a) and siliques (b) of amS and thp1–5 amS plants. Note that the shoot terminates in thp1–5 amS but not in wild type (amS). Scale bar in (a) = 1 mm. Scale bar in (b) = 10 mm. (c) 21-day-old Col, thp1–1 and thp1–3 plants with differences in leaf shape. Scale bar = 10 mm. (d) RNA gel blot analysis of 6 miRNAs in Col, thp1–1 and thp1–3. The miRNA signals were quantified using U6 as a loading control, and values were relative to Col. These experiments were repeated three times with similar results.
Extended Data Fig. 3. Genetic interactions between mutants in THP1 and miRNA biogenesis genes.
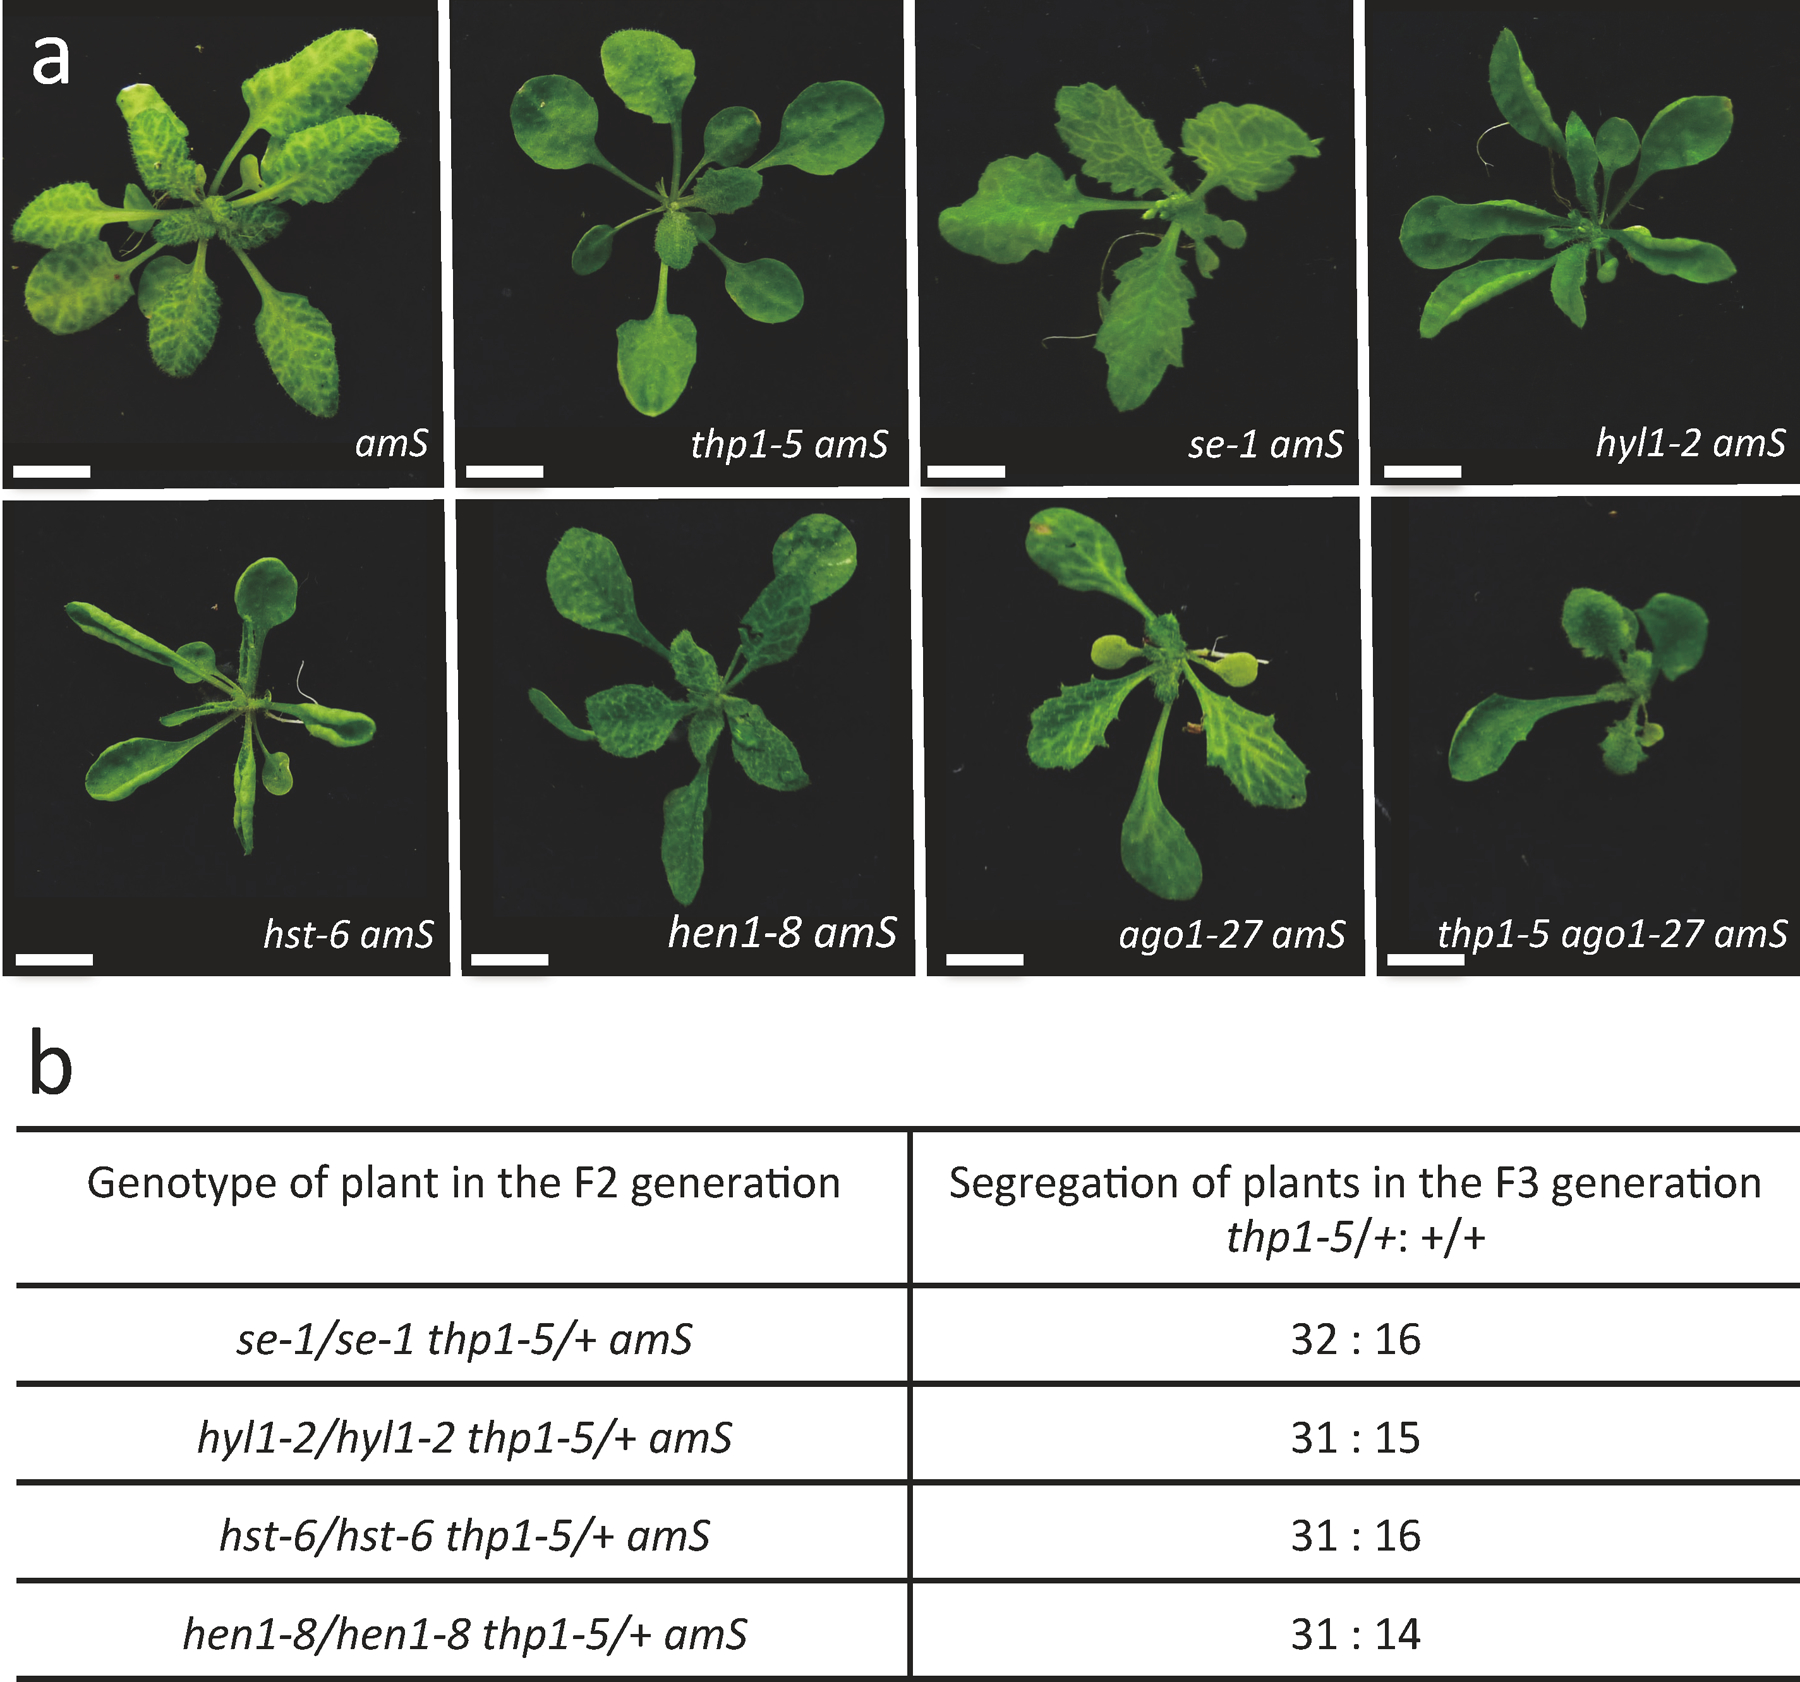
(a) Morphological phenotypes of 25-day-old amS, thp1–5 amS, se-1 amS, hyl1–2 amS, hst-6 amS, hen1–8 amS, ago1–27 amS, and thp1–5 ago1–27 amS plants. Scale bar = 10 mm. All plants with the same genotype exhibit the same phenotype and one representative for each genotype is shown. (b) Genetic segregation analyses. F2 plants of the indicated genotypes were selved and ~48 F3 plants were genotyped for the thp1–5 mutation. The ratios of thp1–5/+ : +/+ are around 2:1, indicating that thp1–5 homozygosity leads to embryo lethality.
Extended Data Fig. 4. Arabidopsis TREX-2 components and sac3 mutant alleles.
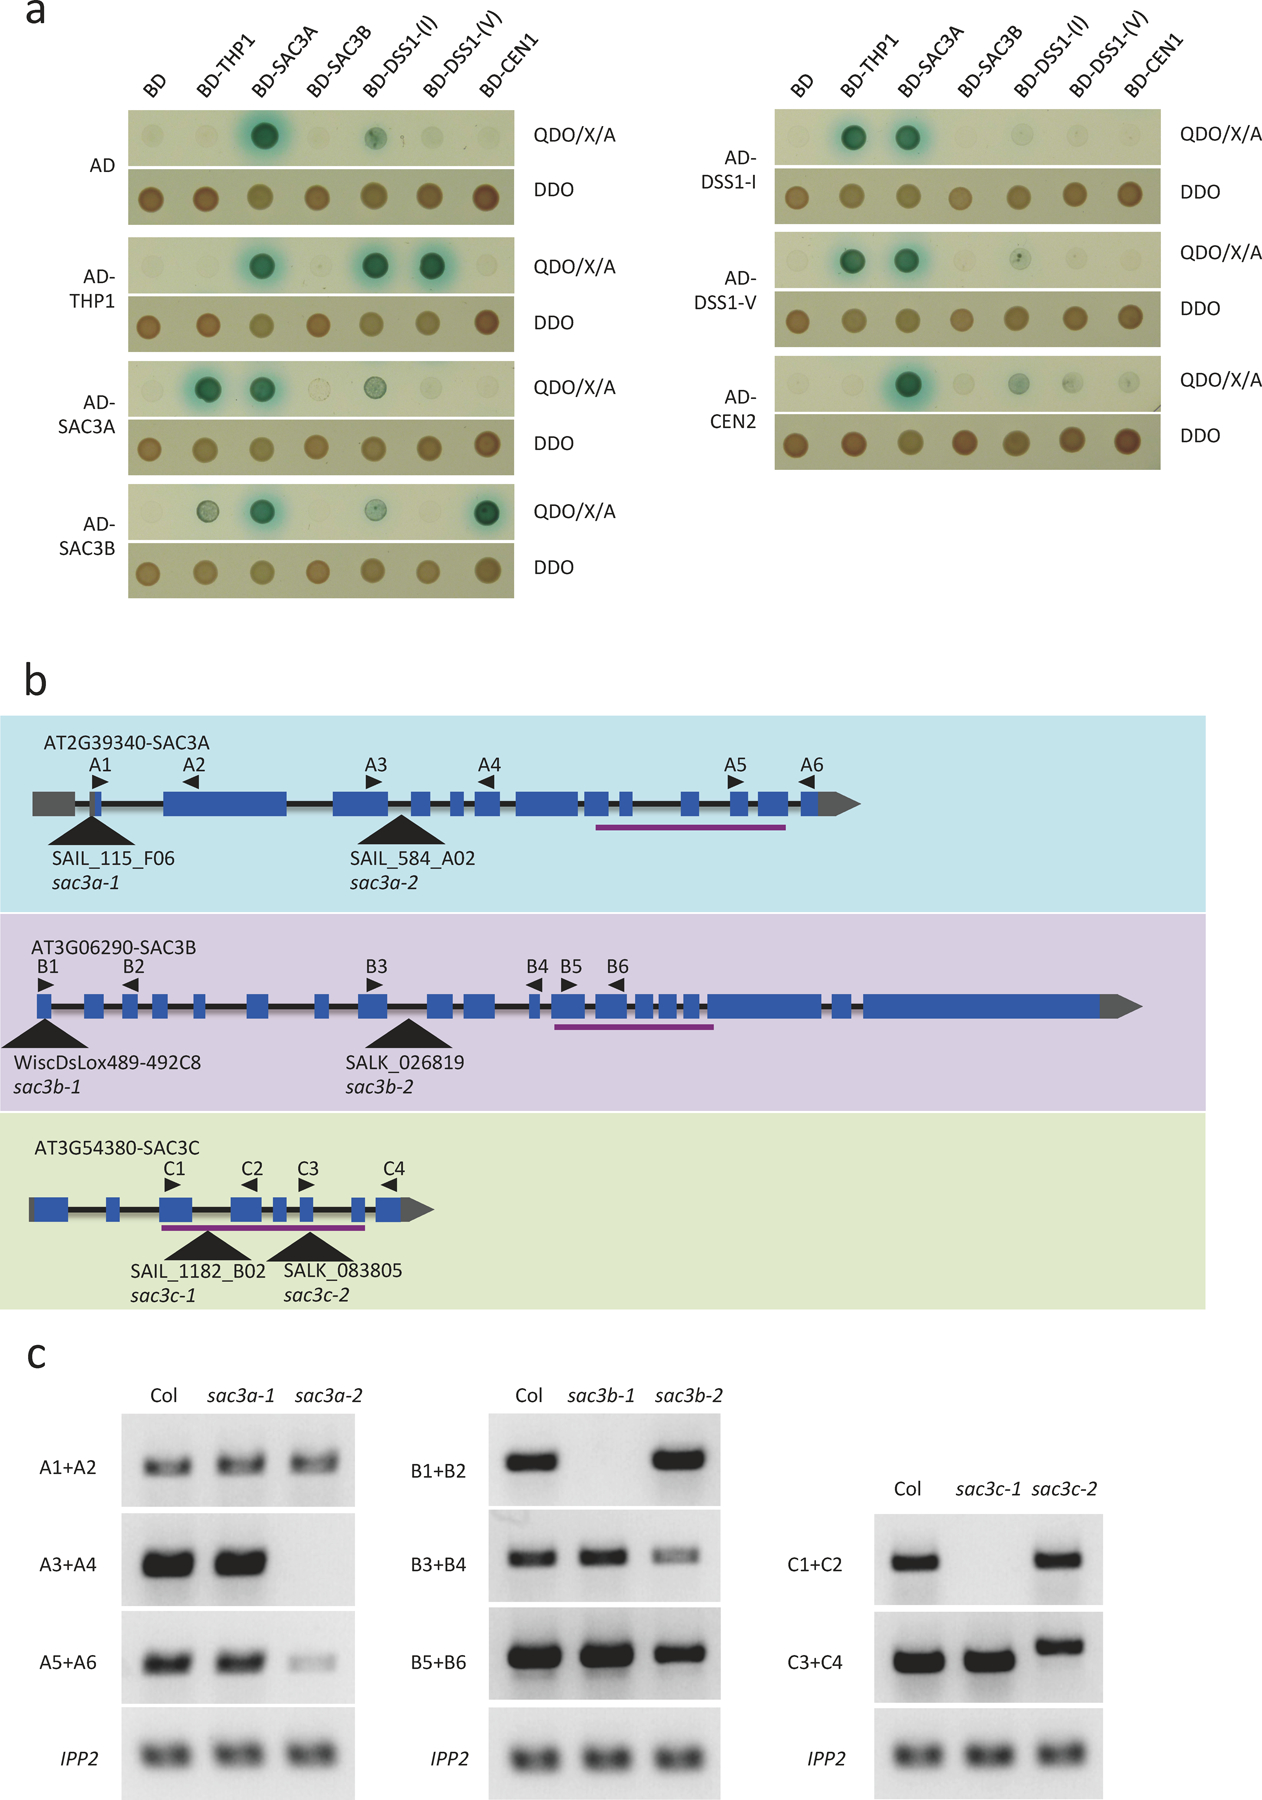
(a) Yeast two-hybrid assays to test interactions among TREX-2 components (THP1, SAC3A, SAC3B, DSSI-(I), DSSI-(V), CEN1, and CEN2). The empty vectors AD and BD were included as negative controls. After mating, diploid yeast cells containing both the bait and prey plasmids grew on SD-Trp/-Leu (DDO) medium, and diploid yeast cells in which the bait and prey proteins interacted grew into blue colonies on SD-Trp/-Leu/-His/-Ade+X-α-gal Aureobasidin A (QDO/X/A) medium. The experiment was repeated two times with similar results. (b) Diagrams of SAC3A, B, and C genes showing the different mutant alleles. Triangles indicate positions of T-DNA insertions. Black arrows indicate primers used for RT-PCR. Lines below the gene models indicate conserved protein domains in homologous proteins. (c) RT-PCR analyses of SAC3 gene expression in different sac3 mutants. The primers used are shown as black arrows in (b). The experiment was repeated two times with similar results.
Extended Data Fig. 5. TREX-2 associates with the transcription machinery.
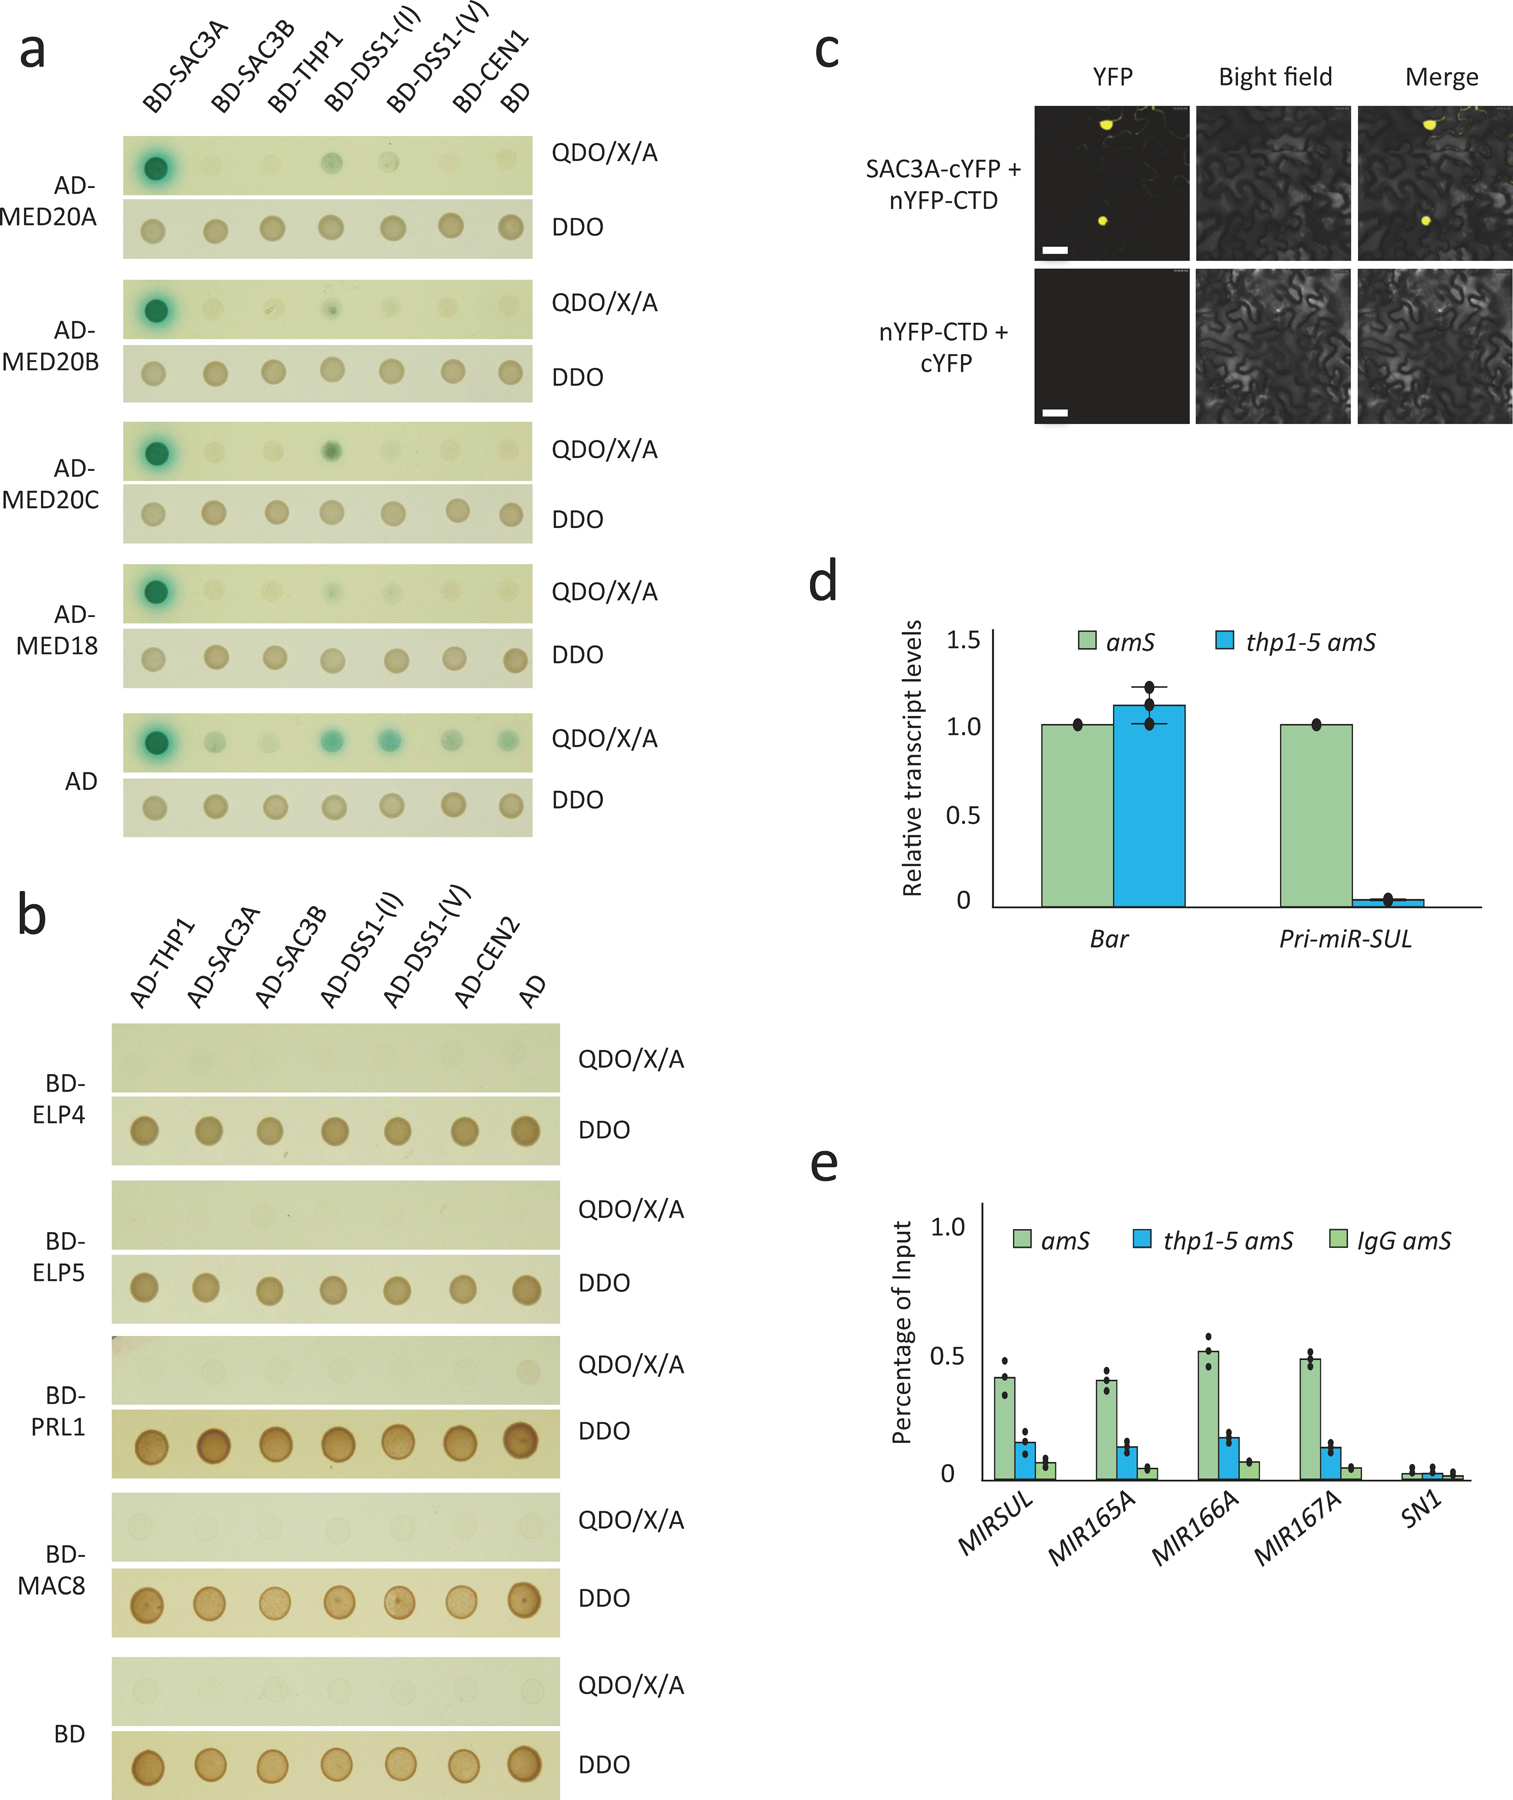
(a) Yeast two-hybrid assays to test interactions between TREX-2 components (THP1, SAC3A, SAC3B, DSS1-(I), DSS1-(V), and CEN1) and subunits of Mediator (MED20A, MED20B, MED20C and MED18). The empty vectors AD and BD were included as negative controls. After mating, diploid yeast cells containing both the bait and prey plasmids grew on SD-Trp/-Leu (DDO) medium, and diploid yeast cells in which the bait and prey proteins interacted grew into blue colonies on SD-Trp/-Leu/-His/-Ade+X-α-gal Aureobasidin A (QDO/X/A) medium. The experiment was repeated two times with similar results. (b) Yeast two-hybrid assays to test interactions between TREX-2 components (THP1, SAC3A, SAC3B, DSS1-(I), DSS1-(V), and CEN2) and subunits of Elongator (ELP4 and ELP5) or subunits of MAC (PRL1 and MAC8). The empty vectors GAL4-AD and GAL4-BD were included as negative controls. After mating, diploid yeast cells containing both the bait and prey plasmids grew on SD-Trp/-Leu (DDO) medium, and diploid yeast cells in which the bait and prey proteins interacted grew into blue colonies on SD-Trp/-Leu/-His/-Ade+X-α-gal Aureobasidin A (QDO/X/A) medium. The experiment was repeated two times with similar results. (c) BiFC analysis to test interactions between SAC3A and Pol II CTD (C-terminal domain). Scale bar = 10 μm. Three independent experiments yielded similar results. (d) RT-qPCR to determine pri-miR-SUL and Bar transcript levels in amS and thp1–5 amS. IPP2 was used as an internal control. More than 30 plants from each genotype were used in the experiment. (e) ChIP-qPCR analyses to determine the occupancy of four MIR loci by Pol II in 12-day-old seedlings of amS and thp1–5 amS. IgG amS was served as a negative control. More than 200 plants from each genotype were used in the experiment.
Extended Data Fig. 6. mRNA sequencing of wild type (Col), thp1–5, and sac3b-1/sac3b-2 sac3c-1/sac3c-1.
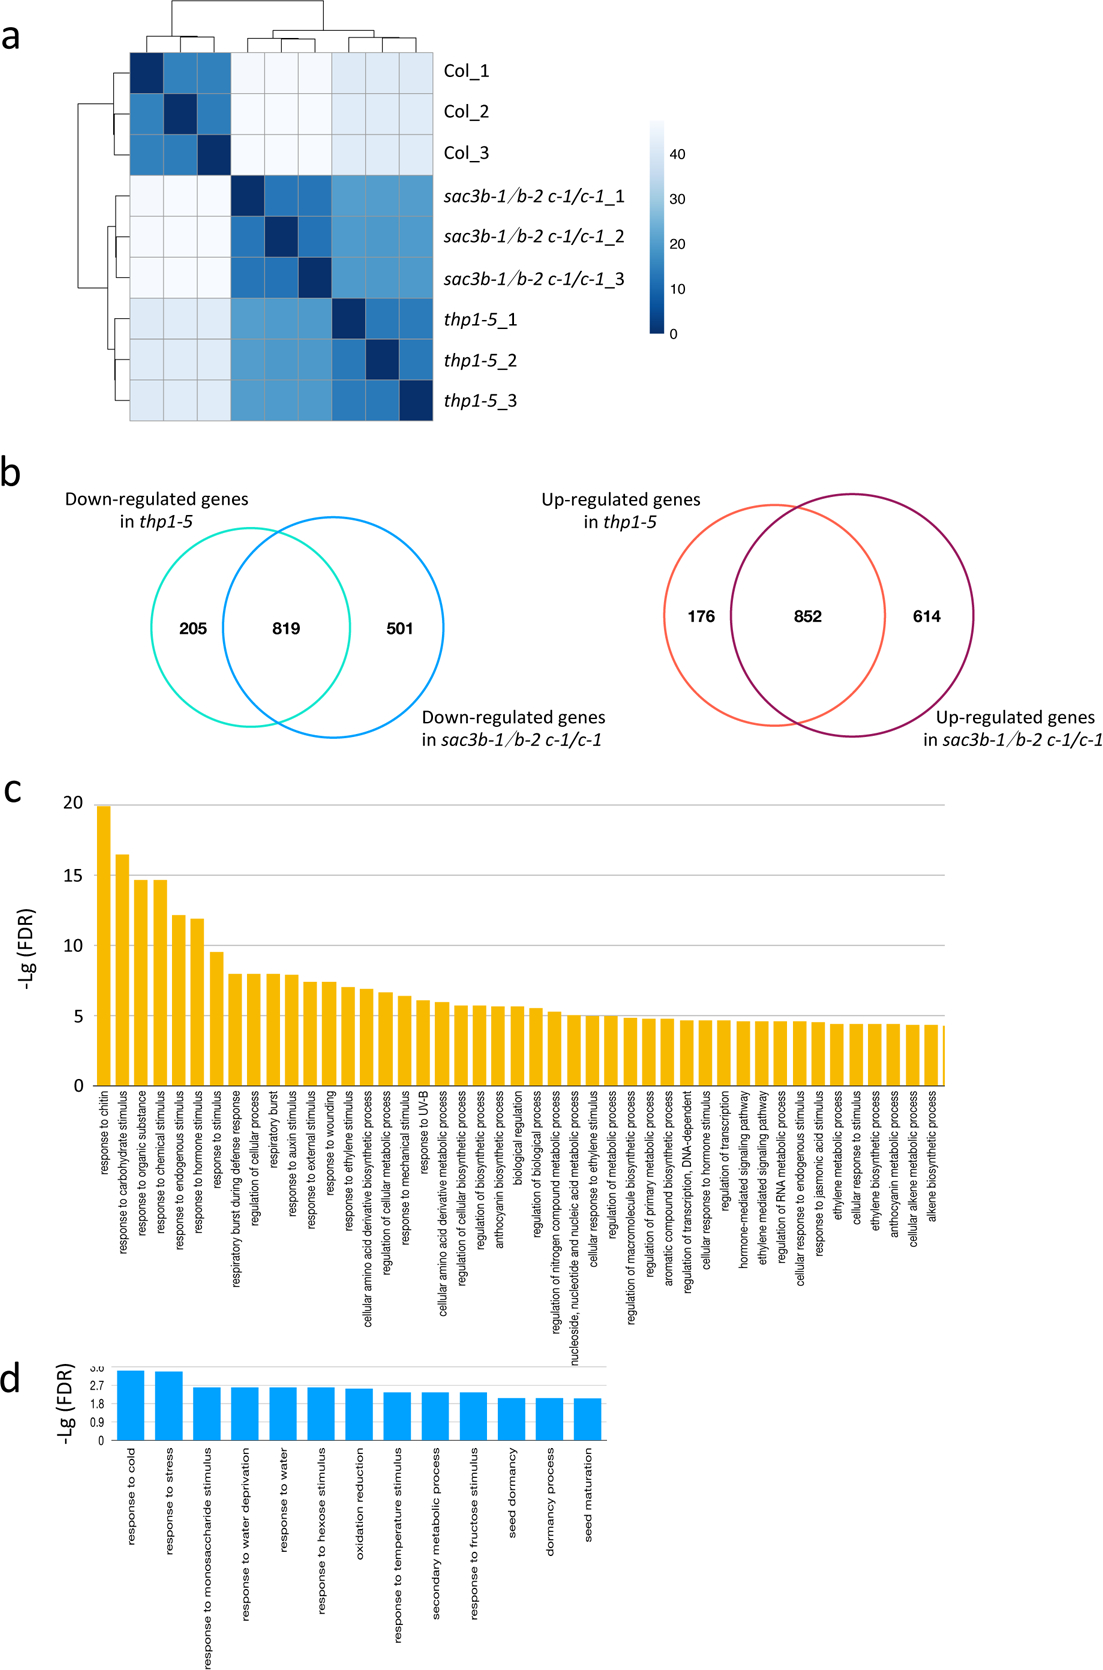
(a) Correlation analysis across WT, thp1–5 and sac3b-1/sac3b-2 sac3c-1/sac3c-1 samples. The three samples from each genotype are biological replicates. Color density indicates Euclidean distance calculated by log-transformed normalized read counts assigned to each gene. (b) Venn diagrams showing the overlap in down-regulated (left) and up-regulated (right) genes between thp1–5 and sac3b-1/sac3b-2 sac3c-1/sac3c-1. (c) GO enrichment analysis of 852 commonly up-regulated genes in thp1–5 and sac3b-1/sac3b-2 sac3c-1/sac3c-1. (d) GO enrichment analysis of 819 commonly down-regulated genes in thp1–5 and sac3b-1/sac3b-2 sac3c-1/sac3c-1.
Extended Data Fig. 7. TREX-2 associates with the microprocessor.
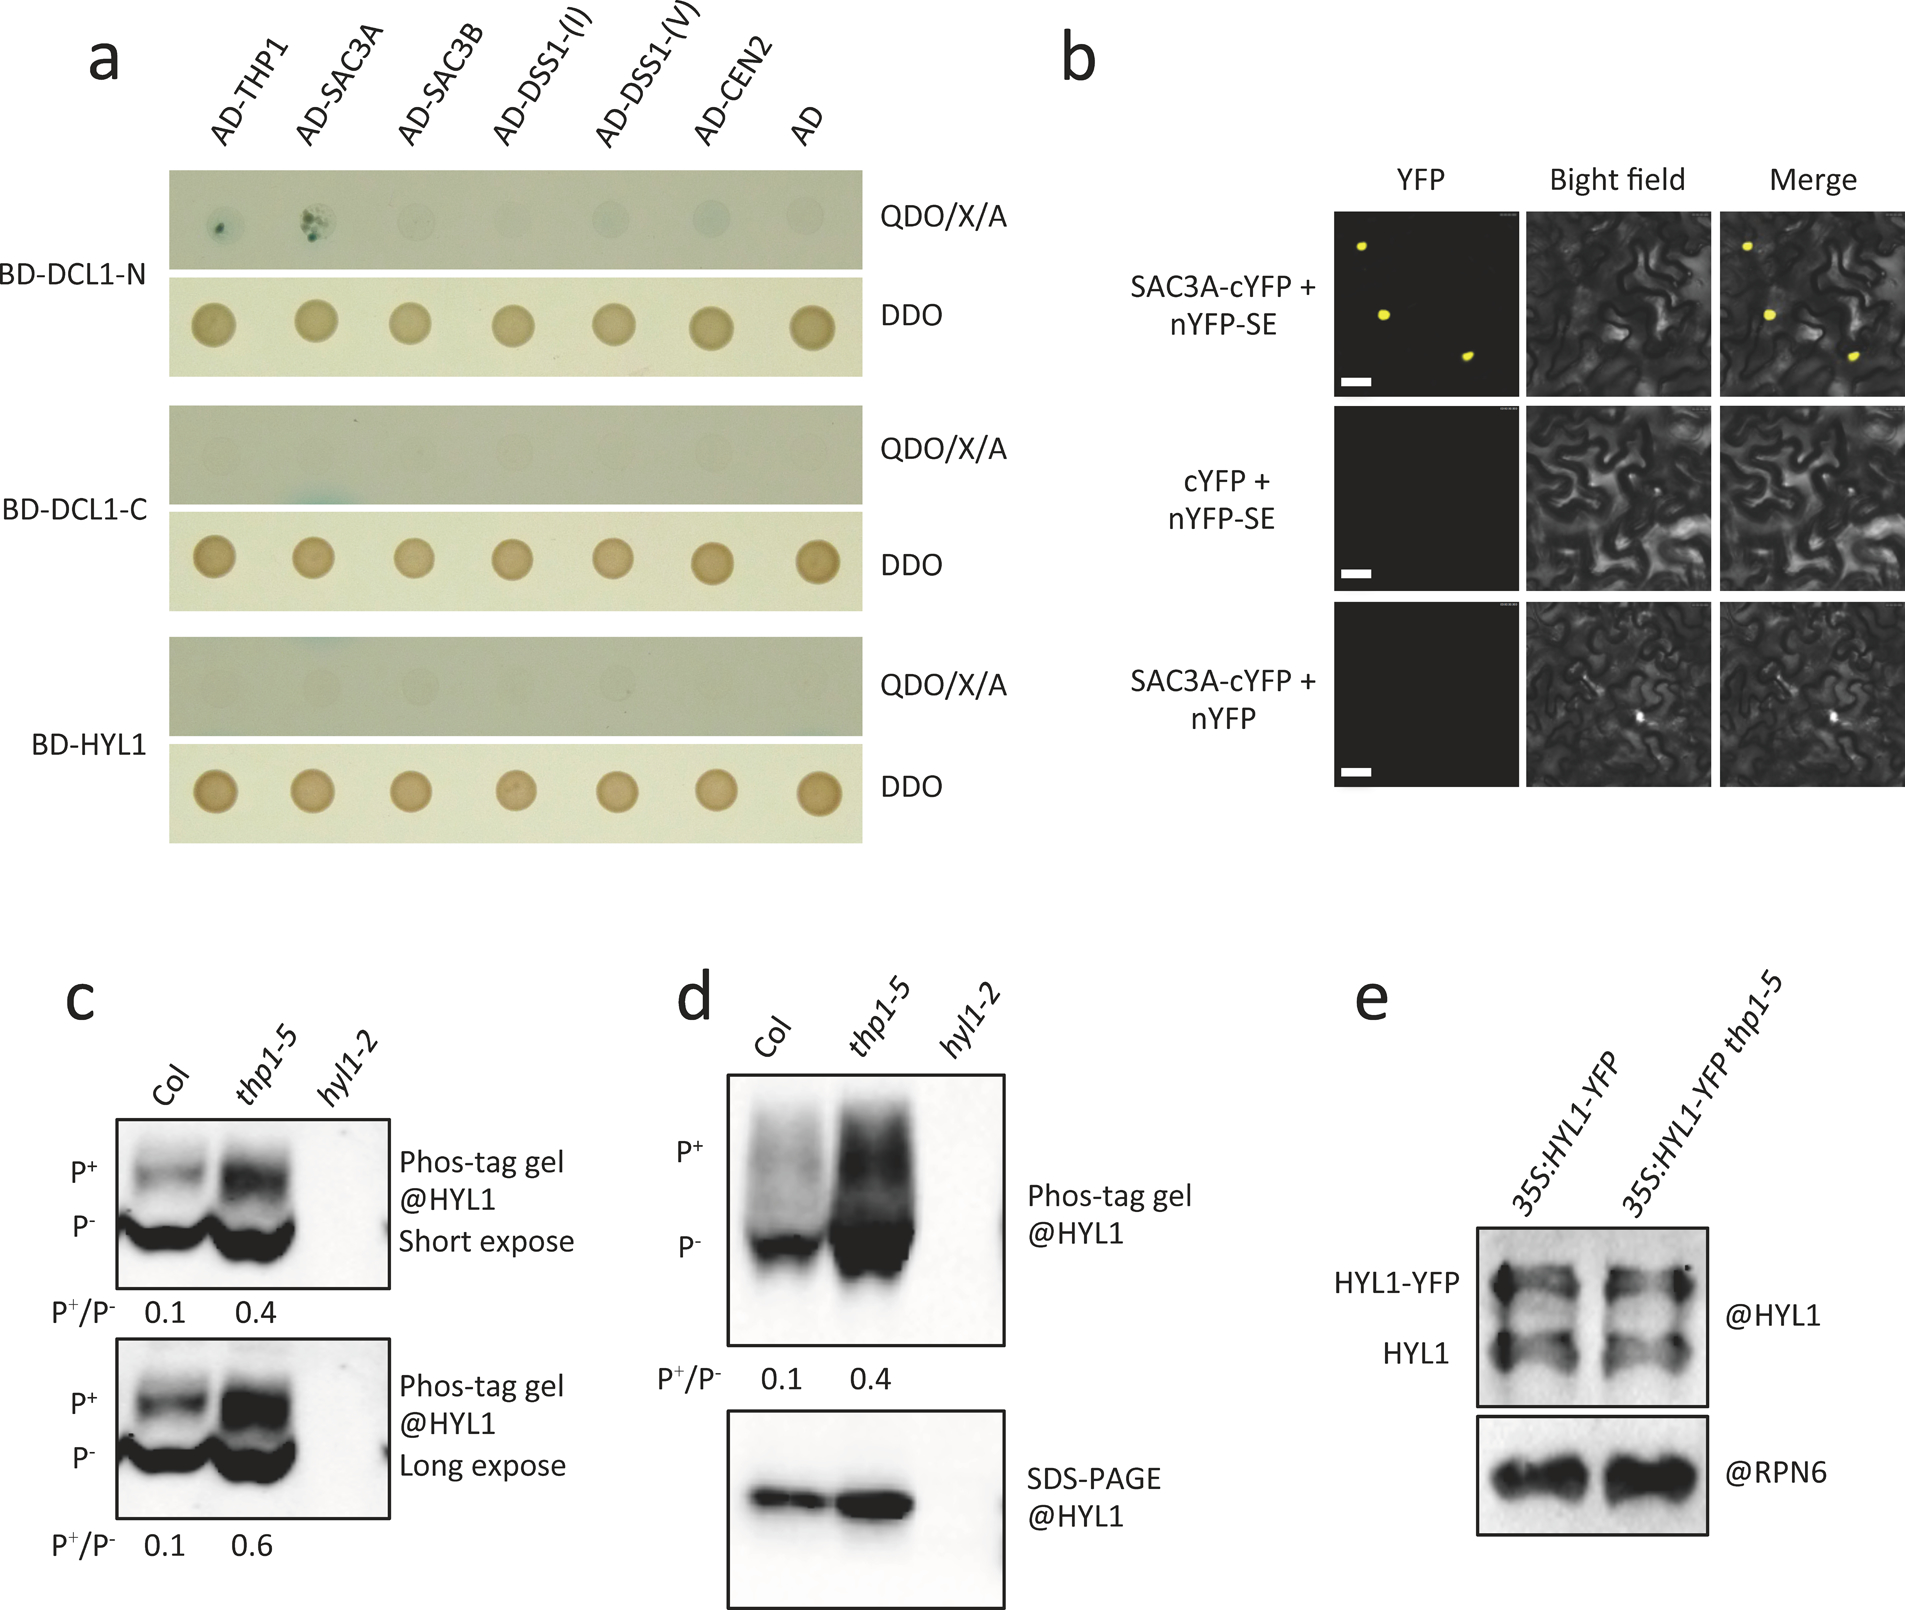
(a) Yeast two-hybrid assays to test interactions between TREX-2 components (THP1, SAC3A, SAC3B, DSS1-(I), DSS1-(V), and CEN2) and the microprocessor components DCL1 and HYL1. The empty vectors AD and BD were included as negative controls. After mating, diploid yeast cells containing both the bait and prey plasmids grew on SD-Trp/-Leu (DDO) medium, and diploid yeast cells in which the bait and prey proteins interacted were expected to grow into blue colonies on SD-Trp/-Leu/-His/-Ade+X-α-gal Aureobasidin A (QDO/X/A) medium. DCL1-N, amino acids 1 to 831 of DCL1; DCL1-C, amino acids of 832 to 1909 of DCL1. The experiment was repeated two times with similar results. (b) BiFC assay to test interactions between SAC3A and SE. Scale bar = 10 μm. Two independent experiments yielded similar results. (c) Determination of HYL1 phosphorylation status. The same blot as that of the upper panel in Fig. 4c with different exposure time. The different forms of HYL1 are as indicated (P+ = phosphorylated HYL1; P− = non-phosphorylated HYL1). The experiment was repeated three times with similar results. (d) Another replicate for Fig. 4c. (e) A western blot to show the levels of HYL1-YFP and endogenous HYL1 in 35S:HYL1-YFP and 35S:HYL1-YFP thp1–5. RPN6 is a loading control. Two independent experiments yielded similar results.
Extended Data Fig. 8. DCL1 D-body formation is compromise in thp1–5.
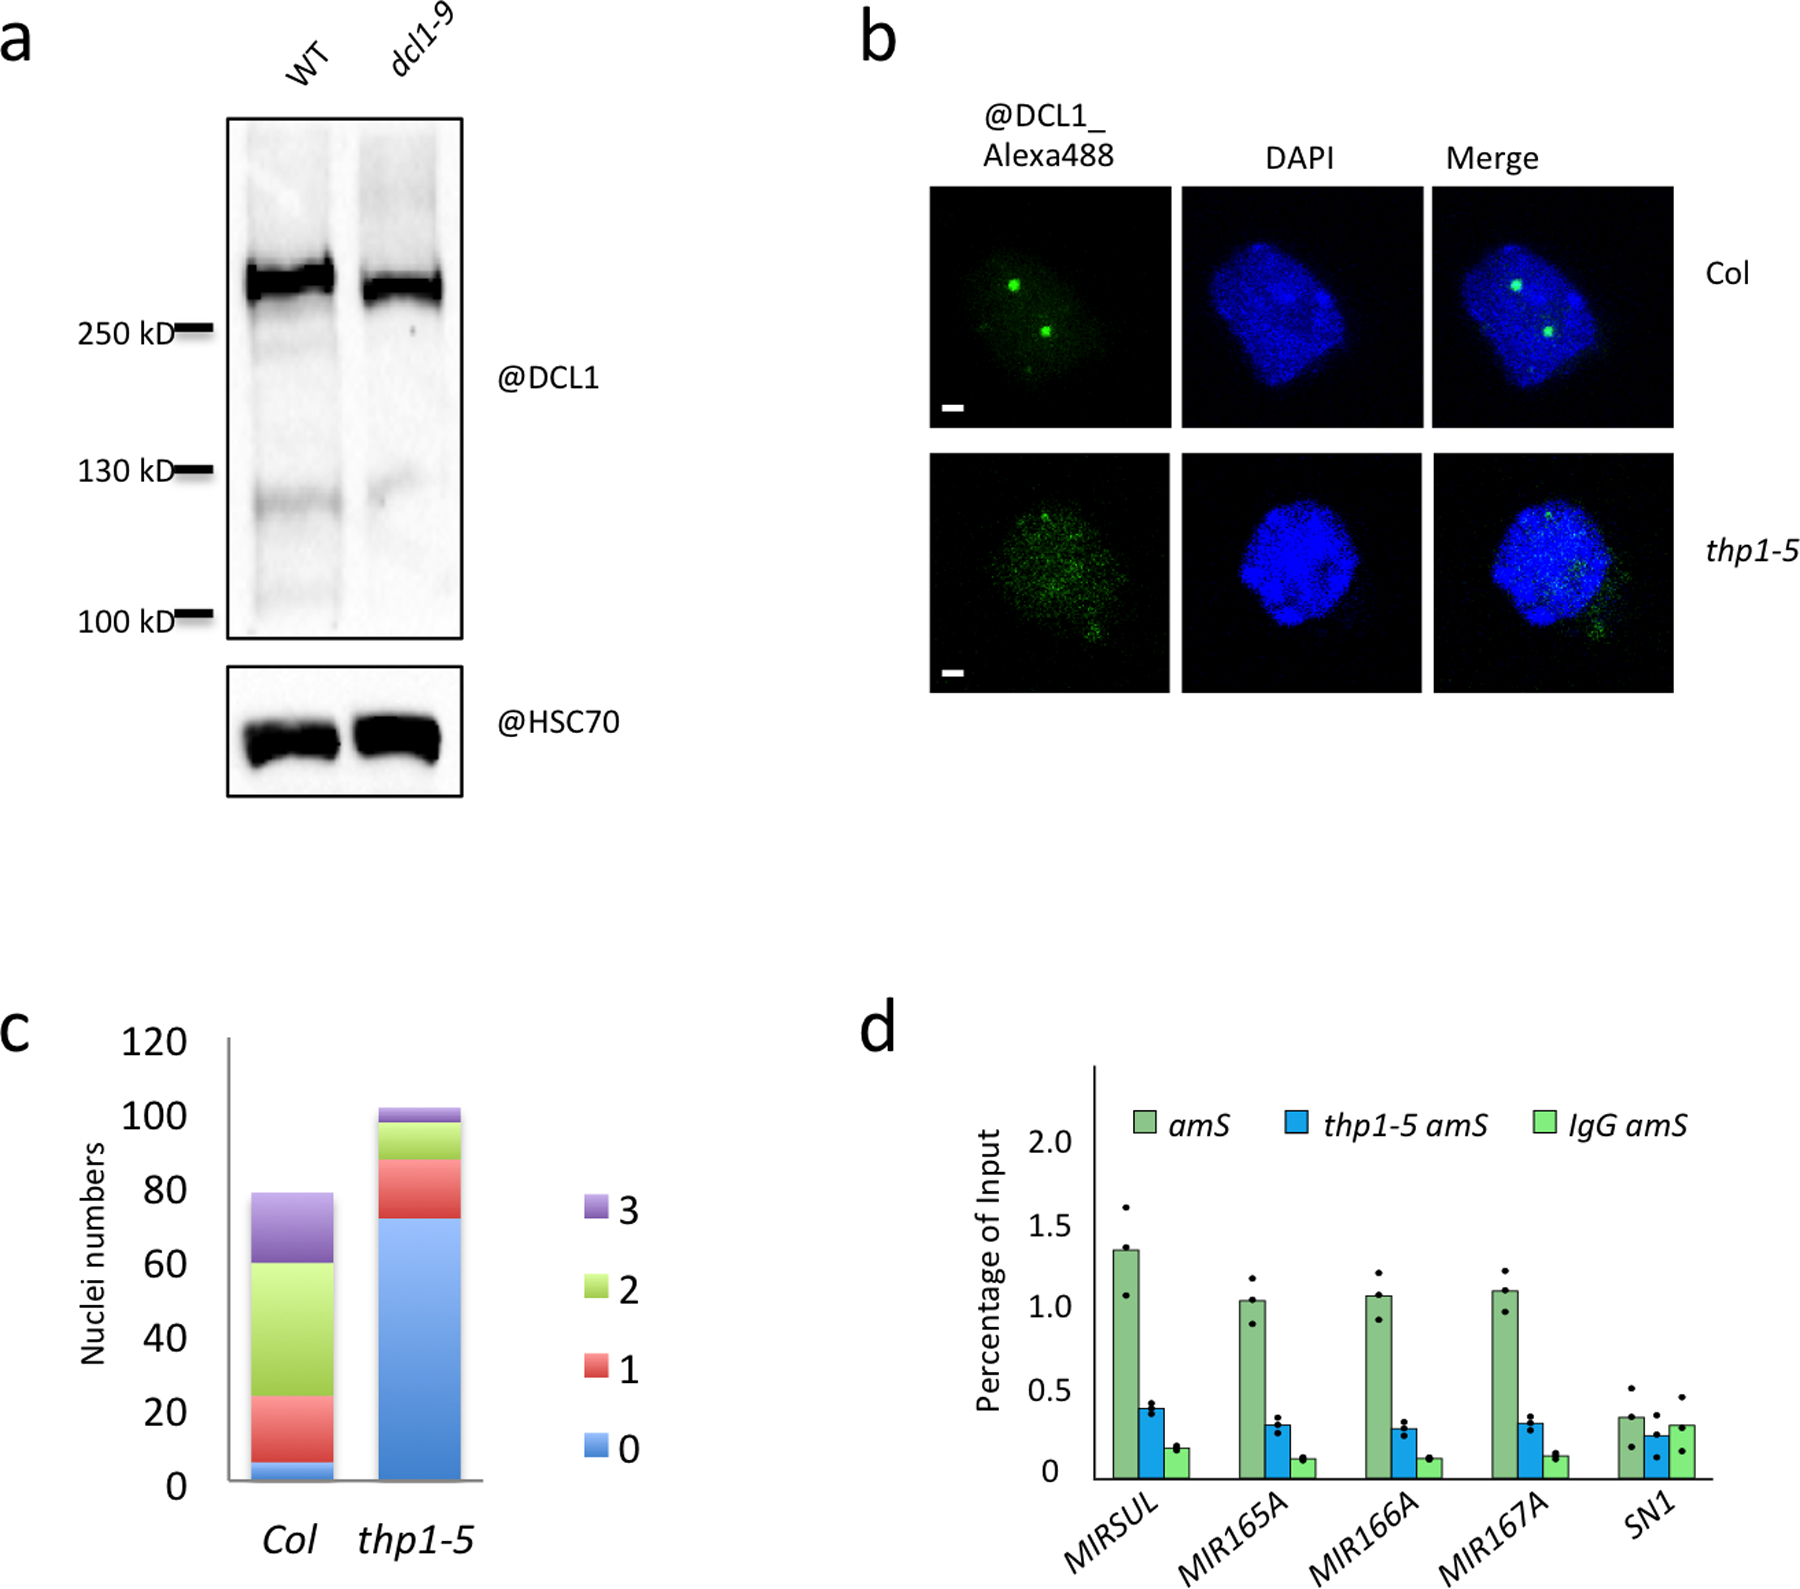
(a) A western blot to detect DCL1 with the anti-DCL1 antibody in WT and dcl1–9 (a truncation mutant). This shows that the antibody was able to specifically detect DCL1. The experiment was conducted one time. (b) Detection of DCL1 D-body by immunofluorescence of isolated nuclei from inflorescence tissue of Col and thp1–5. DCL1 D-body signals are in green and DAPI stained nuclei are in blue. One representative image is shown for Col and thp1–5 each. Scale bar =1μm. The experiment was repeated independently two times with similar results. (c) Quantification of DCL1 D-body numbers in Col (n=78) and thp1–5 (n=101) nuclei. (d) ChIP-qPCR analyses to determine the occupancy of four MIR loci by DCL1 in 12-day-old seedlings of amS and thp1–5 amS. amS and thp1–5 amS were immunoprecipitated by DCL1 antibody. SN1 (located between At3g44000 and At3g44005 at nucleotides 15,805,617–15,805,773 of chromosome 3) was used as a negative control. IgG amS served as a negative control.
Extended Data Fig. 9. The nucleo-cytoplasmic partitioning of miRNAs and AGO1 in thp1–5.
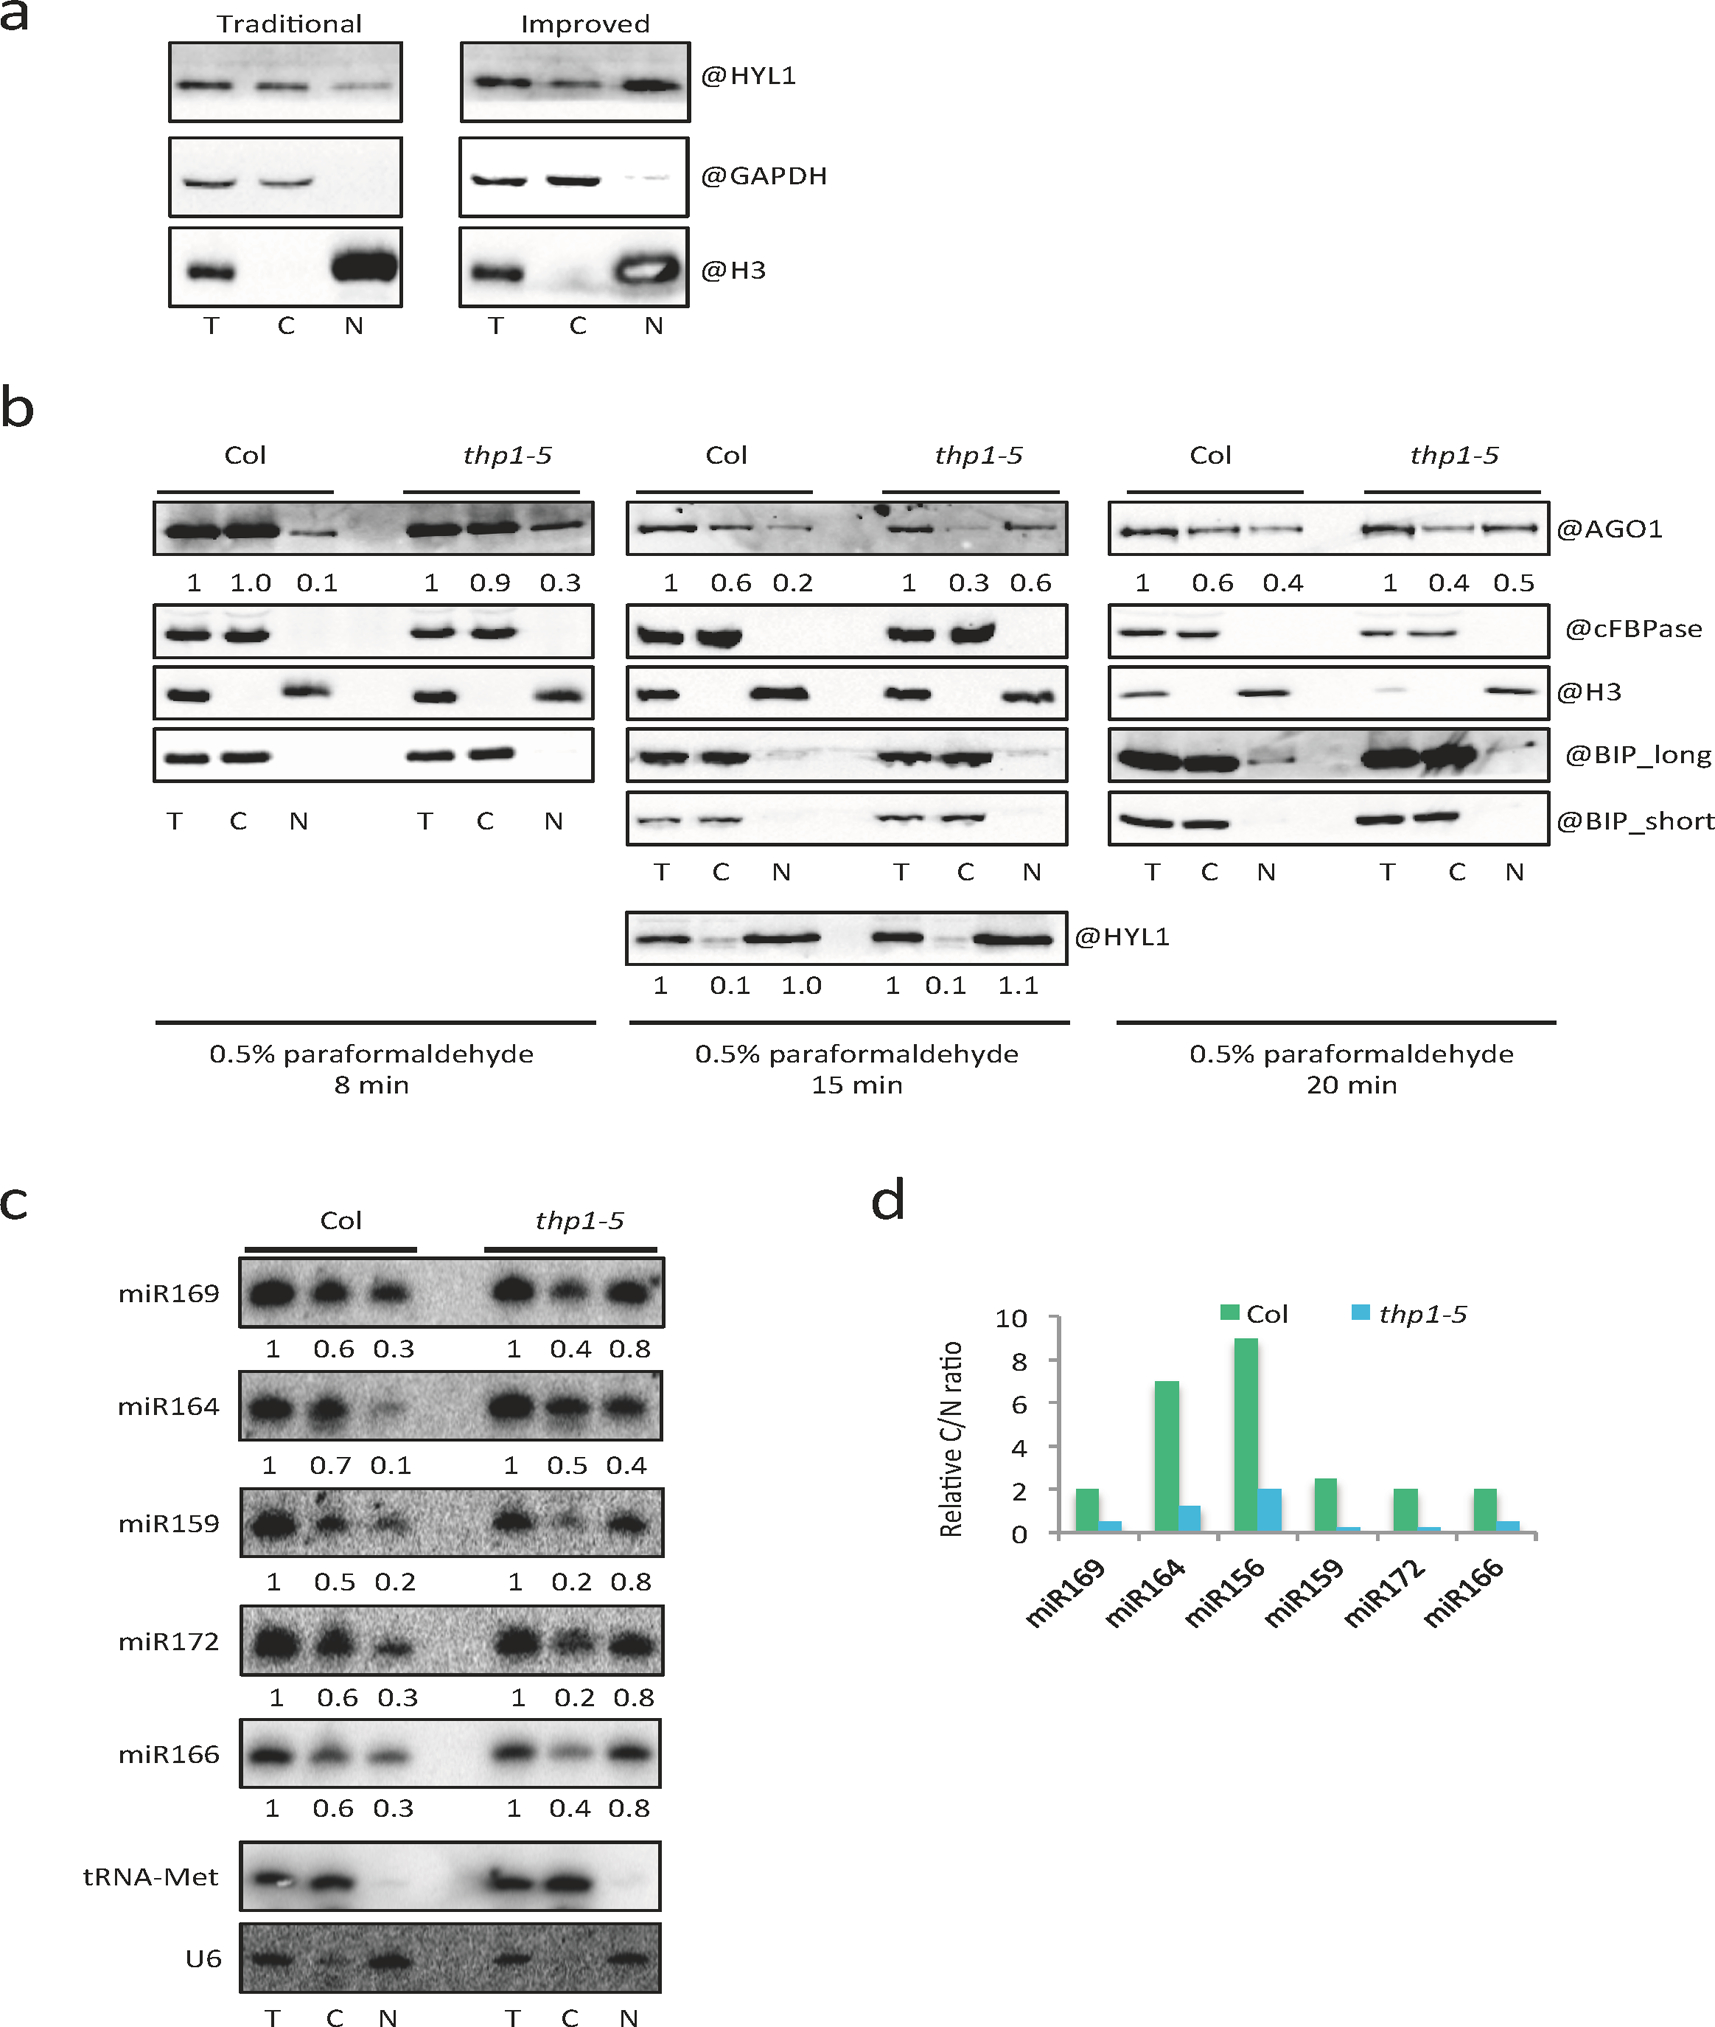
(a) Comparison of an improved nucleo-cytoplasmic fractionation method and the traditional method. The fractionated samples were subjected to protein gel blot analysis using anti-HYL1, anti-GAPDH and anti-H3 antibodies, respectively. T = total extract; C = cytoplasm; N = nucleus. HYL1 and H3 are nuclear proteins; GAPDH is a cytoplasmic protein. The experiment was repeated two times with similar results. (b) Optimization of nucleo-cytoplasmic fractionation in terms of the duration of paraformaldehyde crosslinking (8min, 15min and 20min). The fractionated samples were subjected to protein gel blot analysis using anti-AGO1, anti-cFBPase, anti-HYL1, anti-BIP and anti-H3 antibodies, respectively. T = total extract; C = cytoplasm; N = nucleus. H3 is a nuclear marker; cFBPase is a cytoplasmic marker. They were also used in the quantification of AGO1 levels (represented by the numbers) between T and N and between T and C, respectively. Three independent experiments gave similar results. (c) Small RNA gel blot assays to determine the levels of various miRNAs in Col and thp1–5 following fractionation with the improved method. T = total extract; C = cytoplasm; N = nucleus. Signal intensity of T was arbitrarily set to 1.0; that of C and N was normalized to T against U6 and tRNA-Met, respectively, as nuclear and cytoplasmic RNA markers. The experiment was repeated two times with similar results. (d) Cytoplasmic/nuclear ratios of various miRNAs as determined in (c).
Extended Data Fig. 10. Characterization of nup1-cs lines.
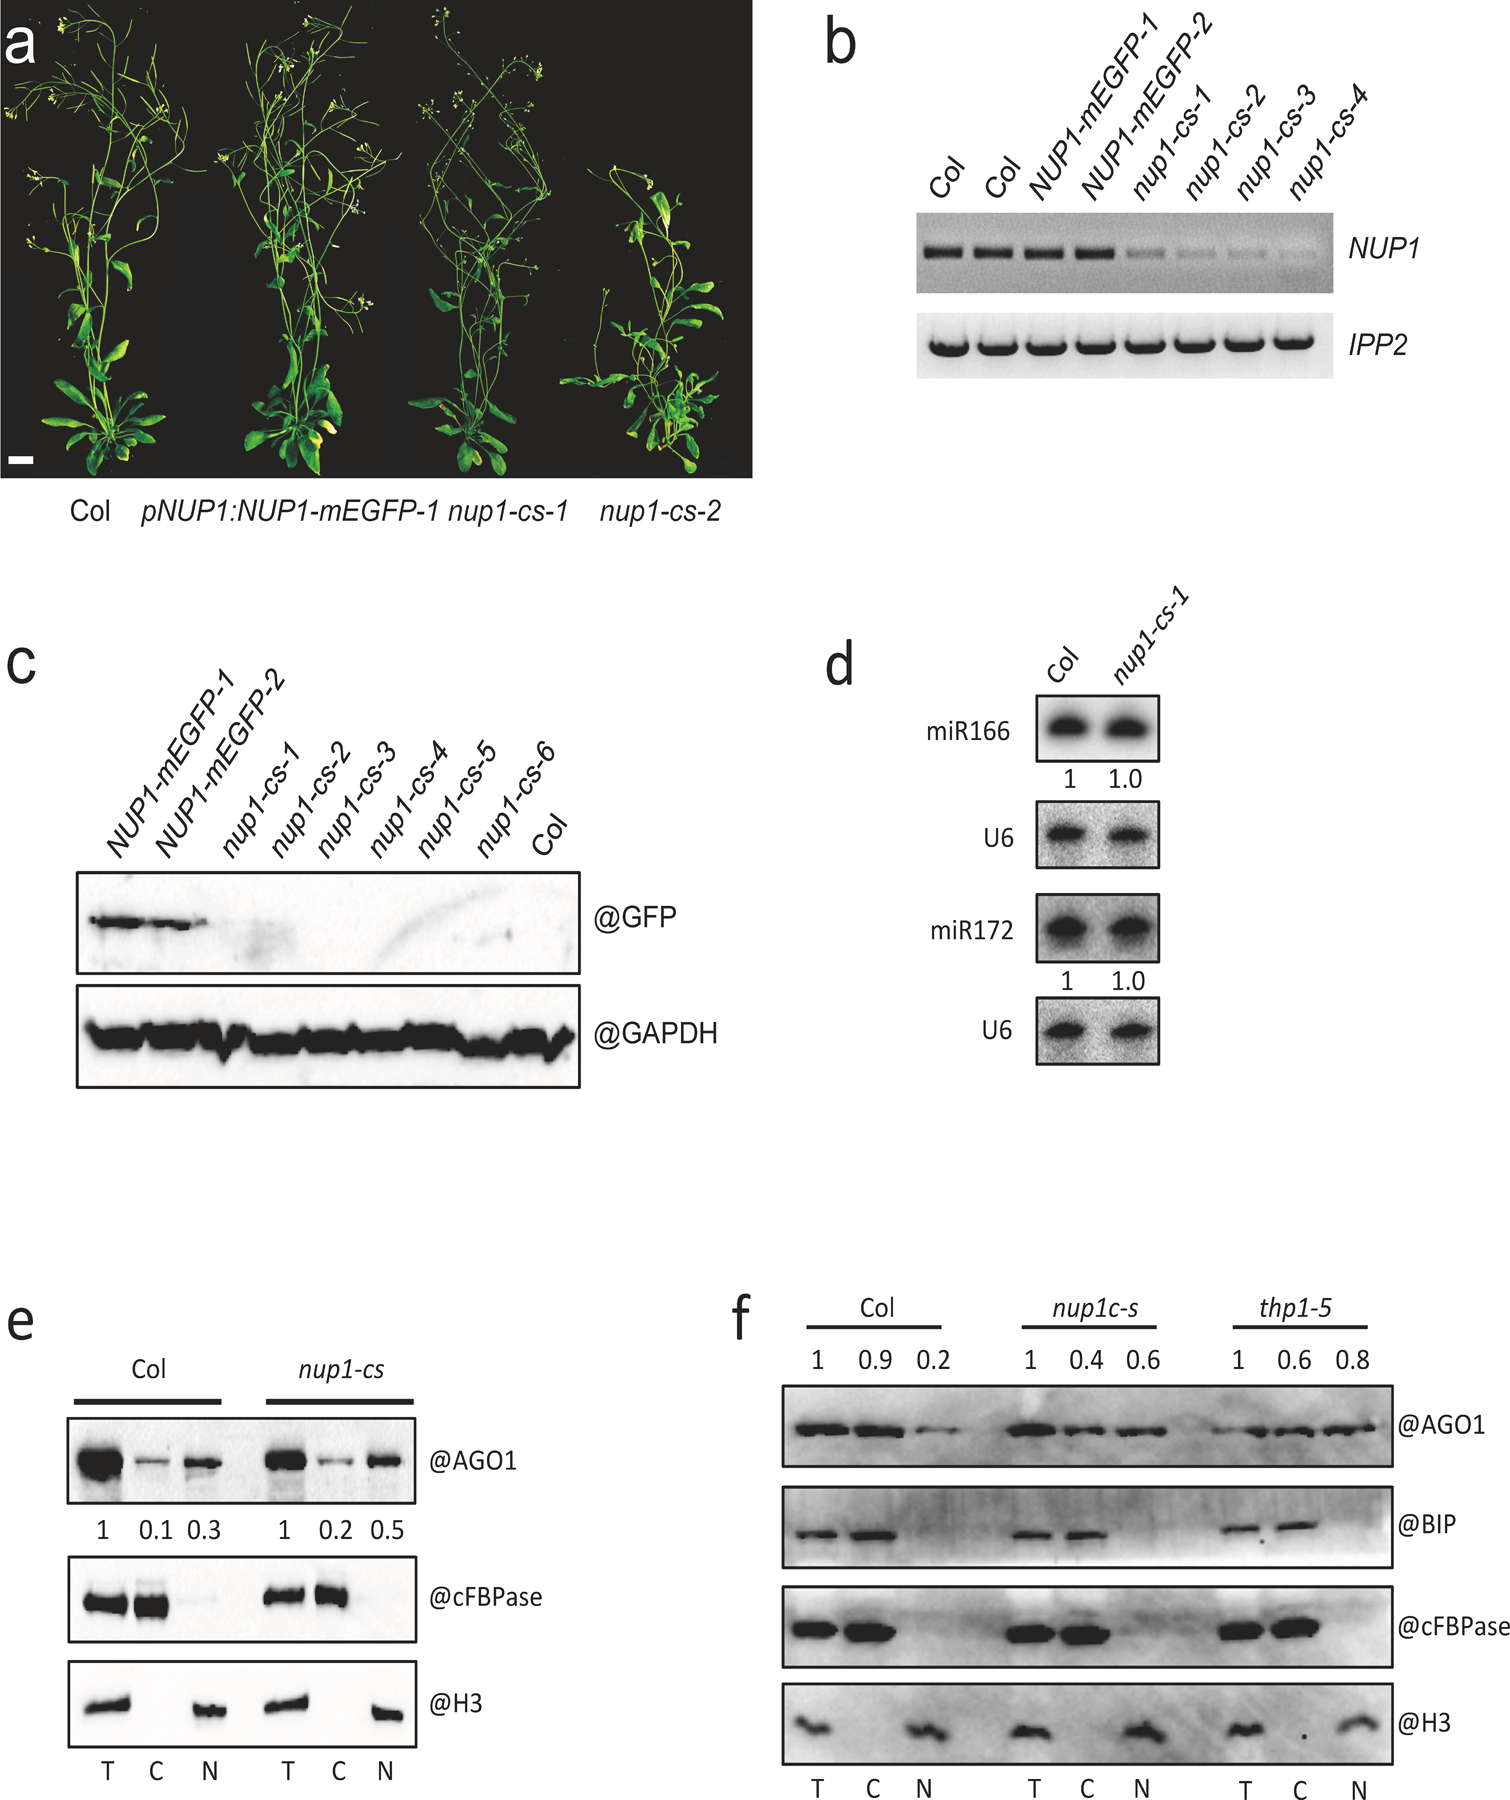
(a) 45-day-old plants of wild type (Col) and three lines harboring the pNUP1:NUP1-mEGFP transgene (the three on the right). Two of the three are nup1-cs (nup1 co-suppression) lines. Scale bar = 10 mm. (b) RT-PCR analysis of NUP1 transcripts in Col, pNUP1:NUP1-mEGFP and nup1-cs lines. Note that the signal represents transcripts from both the endogenous NUP1 gene and the pNUP1:NUP1-mEGFP transgene. The experiment was repeated two times with similar results. (c) Protein gel blot analysis of the NUP1-mEGFP protein in Col, pNUP1:NUP1-mEGFP and nup1-cs lines. The experiment was conducted one time. (d) RNA gel blot assays to determine the levels of miR166 and miR172 in Col and a nup1-cs-1 line. Inflorescences were used for RNA extraction. U6 served as an internal control. The experiment was repeated two times with similar results. (e)-(f) Protein gel blot assays to determine the nucleo-cytoplasmic partitioning of AGO1 in Col and nup1-cs (e) and in Col, nup1-cs, and thp1–5 (f). Three independent experiments gave similar results. The fractions were subjected to protein gel blot analysis using anti-AGO1, anti-cFBPase, anti-H3 and anti-BIP antibodies, respectively. H3 is a nuclear marker; cFBPase is a cytoplasmic marker. They were also used in the quantification of AGO1 levels (represented by the numbers) between T and N and between T and C, respectively. BIP is an ER marker to indicate the level of ER contamination in the nuclear fractions.
Supplementary Material
Acknowledgments
We thank Dr. Detlef Weigel for sharing the pSUC2:amiR-SUL line. We thank Dr. Yuhai Cui for sharing the thp1–3 and sac3 mutants and TREX-2 Y2H plasmids. We thank Dr. Meng Chen for sharing the fluorescence protein-containing vectors and stimulating discussions. We also thank Dr. Brandon Le, Dr. Hao Hu and Nora Flynn for comments on the manuscript. The work was funded by NIH GM129373 to X.C.
Footnotes
Competing interests
The authors declare no competing interests.
References
- 1.Achkar NP, Cambiagno DA & Manavella PA miRNA Biogenesis: A Dynamic Pathway. Trends Plant Sci. 21, 1034–1044 (2016). [DOI] [PubMed] [Google Scholar]
- 2.Chen X Small RNAs and their roles in plant development. Annu. Rev. Cell Dev. Biol 25, 21–44 (2009). [DOI] [PMC free article] [PubMed] [Google Scholar]
- 3.Bologna NG et al. Nucleo-cytosolic Shuttling of ARGONAUTE1 Prompts a Revised Model of the Plant MicroRNA Pathway. Mol. Cell 69, 709–719.e705 (2018). [DOI] [PubMed] [Google Scholar]
- 4.Yu Y, Jia T & Chen X The ‘how’ and ‘where’ of plant microRNAs. New Phytol. 216, 1002–1017 (2017). [DOI] [PMC free article] [PubMed] [Google Scholar]
- 5.Kim YJ et al. The role of Mediator in small and long noncoding RNA production in Arabidopsis thaliana. EMBO J. 30, 814–822 (2011). [DOI] [PMC free article] [PubMed] [Google Scholar]
- 6.Fang X, Cui Y, Li Y & Qi Y Transcription and processing of primary microRNAs are coupled by Elongator complex in Arabidopsis. Nat Plants 1, 15075(2015). [DOI] [PubMed] [Google Scholar]
- 7.Wang L et al. NOT2 Proteins Promote Polymerase II\textendashDependent Transcription and Interact with Multiple MicroRNA Biogenesis Factors in Arabidopsis. Plant Cell (2013). [DOI] [PMC free article] [PubMed] [Google Scholar]
- 8.Li S et al. MAC3A and MAC3B, Two Core Subunits of the MOS4-Associated Complex, Positively Influence miRNA Biogenesis. Plant Cell 30, 481–494 (2018). [DOI] [PMC free article] [PubMed] [Google Scholar]
- 9.Jia T et al. The Arabidopsis MOS4-associated Complex Promotes MicroRNA Biogenesis and Precursor Messenger RNA Splicing. Plant Cell (2017). [DOI] [PMC free article] [PubMed] [Google Scholar]
- 10.Zhang S, Liu Y & Yu B PRL1, an RNA-Binding Protein, Positively Regulates the Accumulation of miRNAs and siRNAs in Arabidopsis. PLoS Genet. 10, e1004841(2014). [DOI] [PMC free article] [PubMed] [Google Scholar]
- 11.Zhang S, Xie M, Ren G & Yu B CDC5, a DNA binding protein, positively regulates posttranscriptional processing and/or transcription of primary microRNA transcripts. Proc. Natl. Acad. Sci. U. S. A 110, 17588–17593 (2013). [DOI] [PMC free article] [PubMed] [Google Scholar]
- 12.Fang Y & Spector DL Identification of nuclear dicing bodies containing proteins for microRNA biogenesis in living Arabidopsis plants. Curr. Biol 17, 818–823 (2007). [DOI] [PMC free article] [PubMed] [Google Scholar]
- 13.Iki T et al. In vitro assembly of plant RNA-induced silencing complexes facilitated by molecular chaperone HSP90. Mol Cell 39, 282–291 (2010). [DOI] [PubMed] [Google Scholar]
- 14.Wang W et al. An importin beta protein negatively regulates MicroRNA activity in Arabidopsis. Plant Cell 23, 3565–3576 (2011). [DOI] [PMC free article] [PubMed] [Google Scholar]
- 15.Cui Y, Fang X & Qi Y TRANSPORTIN1 Promotes the Association of MicroRNA with ARGONAUTE1 in Arabidopsis. Plant Cell 28, 2576–2585 (2016). [DOI] [PMC free article] [PubMed] [Google Scholar]
- 16.Hetzer MW The nuclear envelope. Cold Spring Harb. Perspect. Biol 2, a000539(2010). [DOI] [PMC free article] [PubMed] [Google Scholar]
- 17.Strambio-De-Castillia C, Niepel M & Rout MP The nuclear pore complex: bridging nuclear transport and gene regulation. Nat. Rev. Mol. Cell Biol 11, 490–501 (2010). [DOI] [PubMed] [Google Scholar]
- 18.Beck M & Hurt E The nuclear pore complex: understanding its function through structural insight. Nat. Rev. Mol. Cell Biol 18, 73–89 (2017). [DOI] [PubMed] [Google Scholar]
- 19.Raices M & D’Angelo MA Nuclear pore complexes and regulation of gene expression. Curr. Opin. Cell Biol 46, 26–32 (2017). [DOI] [PMC free article] [PubMed] [Google Scholar]
- 20.Fischer T et al. The mRNA export machinery requires the novel Sac3p-Thp1p complex to dock at the nucleoplasmic entrance of the nuclear pores. EMBO J. 21, 5843–5852 (2002). [DOI] [PMC free article] [PubMed] [Google Scholar]
- 21.Fischer T et al. Yeast centrin Cdc31 is linked to the nuclear mRNA export machinery. Nat Cell Biol 6, 840–848 (2004). [DOI] [PubMed] [Google Scholar]
- 22.Schneider M et al. The Nuclear Pore-Associated TREX-2 Complex Employs Mediator to Regulate Gene Expression. Cell 162, 1016–1028 (2015). [DOI] [PMC free article] [PubMed] [Google Scholar]
- 23.Schubert T & Köhler A Mediator and TREX-2: Emerging links between transcription initiation and mRNA export. Nucleus 7, 126–131 (2016). [DOI] [PMC free article] [PubMed] [Google Scholar]
- 24.Lu Q et al. Arabidopsis homolog of the yeast TREX-2 mRNA export complex: components and anchoring nucleoporin. Plant J. 61, 259–270 (2010). [DOI] [PubMed] [Google Scholar]
- 25.de Felippes FF, Ott F & Weigel D Comparative analysis of non-autonomous effects of tasiRNAs and miRNAs in Arabidopsis thaliana. Nucleic Acids Res 39, 2880–2889 (2011). [DOI] [PMC free article] [PubMed] [Google Scholar]
- 26.Suzuki JY, Bollivar DW & Bauer CE Genetic analysis of chlorophyll biosynthesis. Annu Rev Genet 31, 61–89 (1997). [DOI] [PubMed] [Google Scholar]
- 27.Schauer SE, Jacobsen SE, Meinke DW & Ray A DICER-LIKE1: blind men and elephants in Arabidopsis development. Trends Plant Sci 7, 487–491 (2002). [DOI] [PubMed] [Google Scholar]
- 28.García-Molinero V et al. The SAGA/TREX-2 subunit Sus1 binds widely to transcribed genes and affects mRNA turnover globally. Epigenetics Chromatin 11, 13(2018). [DOI] [PMC free article] [PubMed] [Google Scholar]
- 29.Pfab A, Bruckmann A, Nazet J, Merkl R & Grasser KD The Adaptor Protein ENY2 Is a Component of the Deubiquitination Module of the Arabidopsis SAGA Transcriptional Co-activator Complex but not of the TREX-2 Complex. J. Mol. Biol 430, 1479–1494 (2018). [DOI] [PubMed] [Google Scholar]
- 30.Yang Y et al. SAC3B, a central component of the mRNA export complex TREX-2, is required for prevention of epigenetic gene silencing in Arabidopsis. Nucleic Acids Res 45, 181–197 (2017). [DOI] [PMC free article] [PubMed] [Google Scholar]
- 31.Christians MJ, Robles LM, Zeller SM & Larsen PB The eer5 mutation, which affects a novel proteasome-related subunit, indicates a prominent role for the COP9 signalosome in resetting the ethylene-signaling pathway in Arabidopsis. Plant J 55, 467–477 (2008). [DOI] [PubMed] [Google Scholar]
- 32.Manavella PA et al. Fast-forward genetics identifies plant CPL phosphatases as regulators of miRNA processing factor HYL1. Cell 151, 859–870 (2012). [DOI] [PubMed] [Google Scholar]
- 33.Achkar NP et al. A Quick HYL1-Dependent Reactivation of MicroRNA Production Is Required for a Proper Developmental Response after Extended Periods of Light Deprivation. Dev Cell 46, 236–247 e236 (2018). [DOI] [PubMed] [Google Scholar]
- 34.Park MY, Wu G, Gonzalez-Sulser A, Vaucheret H & Poethig RS Nuclear processing and export of microRNAs in Arabidopsis. Proc Natl Acad Sci U S A 102, 3691–3696 (2005). [DOI] [PMC free article] [PubMed] [Google Scholar]
- 35.Yi R, Qin Y, Macara IG & Cullen BR Exportin-5 mediates the nuclear export of pre-microRNAs and short hairpin RNAs. Genes Dev. 17, 3011–3016 (2003). [DOI] [PMC free article] [PubMed] [Google Scholar]
- 36.Kim YK & Kim VN Processing of intronic microRNAs. Embo Journal 26, 775–783 (2007). [DOI] [PMC free article] [PubMed] [Google Scholar]
- 37.Morlando M et al. Primary microRNA transcripts are processed co-transcriptionally. Nature Structural & Molecular Biology 15, 902–909 (2008). [DOI] [PMC free article] [PubMed] [Google Scholar]
- 38.Xie ZX et al. Expression of Arabidopsis MIRNA genes. Plant Physiol 138, 2145–2154 (2005). [DOI] [PMC free article] [PubMed] [Google Scholar]
- 39.Megraw M et al. MicroRNA promoter element discovery in Arabidopsis. Rna-a Publication of the Rna Society 12, 1612–1619 (2006). [DOI] [PMC free article] [PubMed] [Google Scholar]
- 40.Wang SK et al. The PROTEIN PHOSPHATASE4 Complex Promotes Transcription and Processing of Primary microRNAs in Arabidopsis. Plant Cell 31, 486–501 (2019). [DOI] [PMC free article] [PubMed] [Google Scholar]
- 41.Song L, Han M-H, Lesicka J & Fedoroff N Arabidopsis primary microRNA processing proteins HYL1 and DCL1 define a nuclear body distinct from the Cajal body. Proc. Natl. Acad. Sci. U. S. A 104, 5437–5442 (2007). [DOI] [PMC free article] [PubMed] [Google Scholar]
- 42.Cho SK, Ben Chaabane S, Shah P, Poulsen CP & Yang SW COP1 E3 ligase protects HYL1 to retain microRNA biogenesis. Nat Commun 5, 5867(2014). [DOI] [PubMed] [Google Scholar]
- 43.Deslauriers SD, Alvarez AA, Lacey RF, Binder BM & Larsen PB Dominant gain-of-function mutations in transmembrane domain III of ERS1 and ETR1 suggest a novel role for this domain in regulating the magnitude of ethylene response in Arabidopsis. New Phytol 208, 442–455 (2015). [DOI] [PubMed] [Google Scholar]
- 44.Cabal GG et al. SAGA interacting factors confine sub-diffusion of transcribed genes to the nuclear envelope. Nature 441, 770–773 (2006). [DOI] [PubMed] [Google Scholar]
- 45.Bologna NG & Voinnet O The diversity, biogenesis, and activities of endogenous silencing small RNAs in Arabidopsis. Annu. Rev. Plant Biol 65, 473–503 (2014). [DOI] [PubMed] [Google Scholar]
- 46.Ghildiyal M & Zamore PD Small silencing RNAs: an expanding universe. Nature Reviews Genetics 10, 94–108 (2009). [DOI] [PMC free article] [PubMed] [Google Scholar]
- 47.Du TT & Zamore PD microPrimer: The biogenesis and function of microRNA. Development 132, 4645–4652 (2005). [DOI] [PubMed] [Google Scholar]
- 48.Nakagawa T et al. Development of series of gateway binary vectors, pGWBs, for realizing efficient construction of fusion genes for plant transformation. J Biosci Bioeng 104, 34–41 (2007). [DOI] [PubMed] [Google Scholar]
- 49.Li S et al. MicroRNAs inhibit the translation of target mRNAs on the endoplasmic reticulum in Arabidopsis. Cell 153, 562–574 (2013). [DOI] [PMC free article] [PubMed] [Google Scholar]
- 50.Li H, Ruan J & Durbin R Mapping short DNA sequencing reads and calling variants using mapping quality scores. Genome Res 18, 1851–1858 (2008). [DOI] [PMC free article] [PubMed] [Google Scholar]
- 51.Li S et al. Biogenesis of phased siRNAs on membrane-bound polysomes in Arabidopsis. eLife Sciences 5, e22750(2016). [DOI] [PMC free article] [PubMed] [Google Scholar]
- 52.Johnson NR, Yeoh JM, Coruh C & Axtell MJ Improved Placement of Multi-mapping Small RNAs. G3 (Bethesda) 6, 2103–2111 (2016). [DOI] [PMC free article] [PubMed] [Google Scholar]
- 53.Love MI, Huber W & Anders S Moderated estimation of fold change and dispersion for RNA-seq data with DESeq2. Genome Biology 15 (2014). [DOI] [PMC free article] [PubMed] [Google Scholar]
- 54.Zhang B, Wang L, Zeng L, Zhang C & Ma H Arabidopsis TOE proteins convey a photoperiodic signal to antagonize CONSTANS and regulate flowering time. Genes Dev. 29, 975–987 (2015). [DOI] [PMC free article] [PubMed] [Google Scholar]
- 55.Zeng L et al. Evolution and protein interactions of AP2 proteins in Brassicaceae: Evidence linking development and environmental responses. J Integr Plant Biol 58, 549–563 (2016). [DOI] [PubMed] [Google Scholar]
- 56.Kim D, Langmead B & Salzberg SL HISAT: a fast spliced aligner with low memory requirements. Nat Methods 12, 357–360 (2015). [DOI] [PMC free article] [PubMed] [Google Scholar]
- 57.Wang M, Zhao Y & Zhang B Efficient Test and Visualization of Multi-Set Intersections. Sci Rep 5, 16923(2015). [DOI] [PMC free article] [PubMed] [Google Scholar]
- 58.Du Z, Zhou X, Ling Y, Zhang Z & Su Z agriGO: a GO analysis toolkit for the agricultural community. Nucleic Acids Res 38, W64–70 (2010). [DOI] [PMC free article] [PubMed] [Google Scholar]
Associated Data
This section collects any data citations, data availability statements, or supplementary materials included in this article.
Supplementary Materials
Data Availability Statement
Raw sequence data generated during this study were deposited into the NCBI GEO database under the accession code GSE150473. The source data for Figures and Extended Data Figures are provided as Source Data files. The authors declare that any other supporting data is available from the corresponding author upon request.


