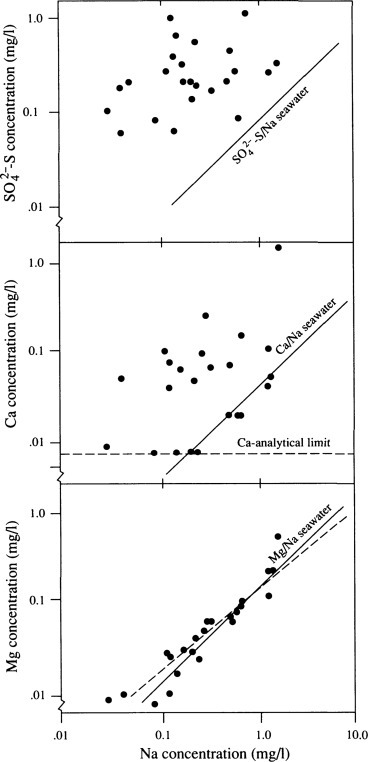
Fig. 3.14.

Concentrations of SO4, Ca, and Mg in wetfall precipitation near Santa Barbara, California (USA), plotted as a logarithmic function of Na concentration in the same samples (Schlesinger et al., 1982). The solid line represents the ratio of these ions to Na in seawater. Ca and SO4 are enriched in wetfall relative to seawater, whereas Mg shows a correlation (dashed line) that is not significantly different from the ratio expected in seawater.
