Abstract
A borondipyrromethene (BODIPY) chromophore is connected to a benzoxazole, benzothiazole or nitrobenzothiazole heterocycle through an olefinic bridge with >trans configuration. Rotation about the two [C–C] bonds flanking the olefinic bridge occurs with fast kinetics in solution, leading to the equilibration of four conformational isomers for each compound. Ensemble spectroscopic measurements in solutions fail to distinguish the co-existing isomers. They reveal instead averaged absorption and emission bands with dependence of the latter on the excitation wavelength. Using high-throughput single-molecule spectroscopy, two main populations of single molecules with distinct spectral centroids are observed for each compound on glass substrates. Computational analyses suggest the two populations of molecules to be conformational isomers with antiperiplanar and periplanar arrangements of the BODIPY chromophores about its [C–C] bond to the olefinic bridge. Thus, statistical analysis of multiple single-molecule emission spectra can discriminate stereoisomers that would otherwise be impossible to distinguish by ensemble measurements alone.
Keywords: BODIPY, Fluorescence, Conformational Isomerism, Single-Molecule Imaging, ingle-Molecule Spectroscopy
Graphical Abstract:
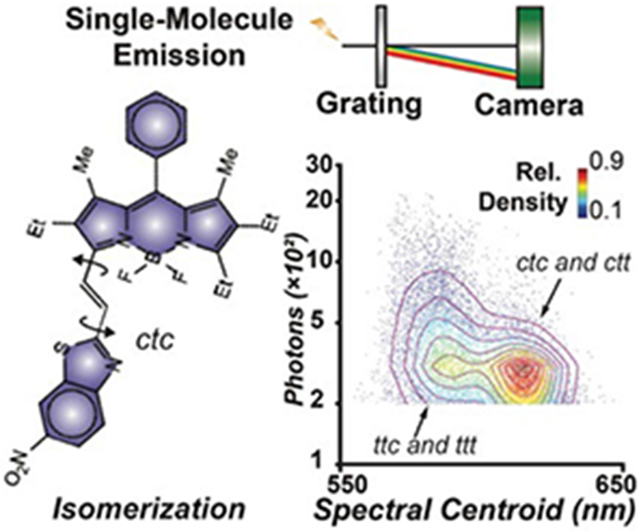
The recognition, identification and characterization of isomers are of great significance in chemical research.1-3 The majority of analyses relies on the isolation of isomers, by experimental procedures such as chromatography, followed by bulk measurements of the purified products. Analytical methods such as high-performance liquid/gas chromatography and mass spectrometry can study trace amounts of analytes. However, the purification protocols often require a large quantity of structural mixture to begin with and prolonged processing time, especially when dealing with low-abundance isomers. Additionally, isomerization during purification can complicate analysis.
Single-molecule spectroscopy (SMS)4-5 can bypass the tedious isolation process and characterize individual molecules of a complex mixture one at a time. Since the observation of single fluorescent molecules at room temperature with far-field optics two decades ago,6-7 numerous attempts to study the conformational changes of biomolecules, labeled with fluorescent reporters, using single-molecule fluorescence spectroscopy at ambient temperature have been reported.8-11 On the other hand, many investigations have also focused on the spectral behavior of the fluorescent reporter itself.12-13 The spectral fluctuation of a single fluorescent reporter and spectral inhomogeneity among different molecules of the same species have been extensively observed.14-15 It is believed that the conformational variations, associated with heterogeneous local environments are primarily responsible for these spectral differences. However, the unambiguous correlation of a distinct spectral feature with a specific conformational isomer remains a significant challenge. Besides distinct local conformational minima, single molecules may reside in multiple energy niches provided by the heterogeneous environment.12,16 Only after sufficient sampling of the entire energy landscape with statistical analyses, would the identification of a given conformational isomer out of the ensemble average become possible.17 Most SMS techniques involve the use of multiple dichroic mirrors to split photons of different spectral regions into separate detectors. The capture of full emission spectra of individual molecules for comprehensive spectral analysis is possible one at a time,18 while it requires long exposure times to gain sufficient signals over background because of the limited number of photons emitted from single molecules. Consequently, it remains difficult to collect enough samples for statistics to distinguish isomer populations from scattered and unpredictable spectral variations arising from environmental inhomogeneity.
High-throughput SMS and spectroscopic single-molecule imaging techniques have been developed using dispersive elements such as gratings and prisms for wavelength dispersion.13,19-23 These techniques concurrently collect single-molecule positions and their complete emission spectra on a millisecond scale with a large field of view of hundreds of square micrometers. Under these conditions, hundreds of thousands single molecules can be efficiently detected in a few minutes. The identification and classification of distinct populations, from statistical analysis of these SMS results, enable spectroscopic single-molecule localization microscopy (sSMLM)20-21 as well as functional super-resolution imaging.22,24 For instance, they provide the capability to map membrane polarity and protein hydrophobicity by the distinct spectral response of solvatochromic dyes in hydrophilic and hydrophobic environments,22,24 to resolve multiple far-red dyes with different spectral centroid distributions for simultaneous multi-color single-molecule super-resolution imaging20,25 and to detect different photoisomerization pathways by analyzing the spectral centroid distribution of conformational isomers.26
Our laboratories developed a photochemical strategy to switch fluorescence based on the reversible or irreversible ring-opening of [1,3]oxazine heterocycles.27-31 In particular, a photoswitchable BODIPY–oxazine dyad for single-molecule super-resolution imaging, based on photoactivated localization microscopy (PALM)32, was designed around this fluorescence switching strategy.33 In efforts to enhance the fluorescence quantum yield of the photochemical product of this type of dyad, structural modifications, in the form of heteroatom substitution of the iso-propylidene group of the photogenerated 3H-indole auxochromic component, were envisaged. In principle, the conformational freedom of the designed compounds, particularly the dihedral angles about the two [C–C] bonds flanking an olefinic bridge, could result in the possible co-existence of multiple isomers.34 The characterization of these isomers will allow the understanding of the photophysical properties and excitation dynamics of these chromophores and shed light on their spectral responses to local environments for potential sSMLM imaging. The high brightness engineered into these compounds makes them ideal candidates to unveil the isomerization processes with high-throughput SMS. This article reports the synthesis of three members of this family of bright chromophores, the characterization of their photophysical properties with ensemble and single-molecule spectroscopic measurements as well as statistical analyses of their single-molecule spectra in conjunction with density functional theory (DFT) and time-dependent DFT (TDDFT) simulations.
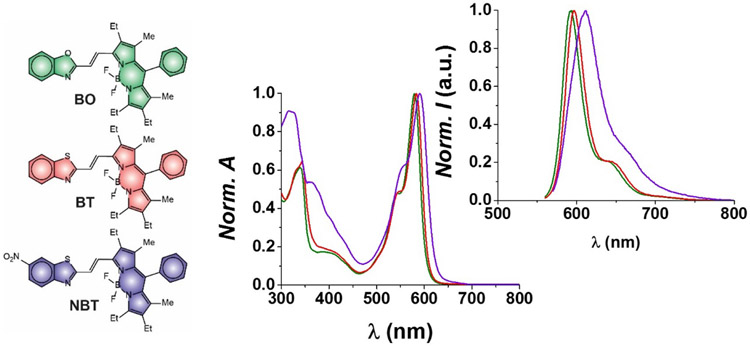
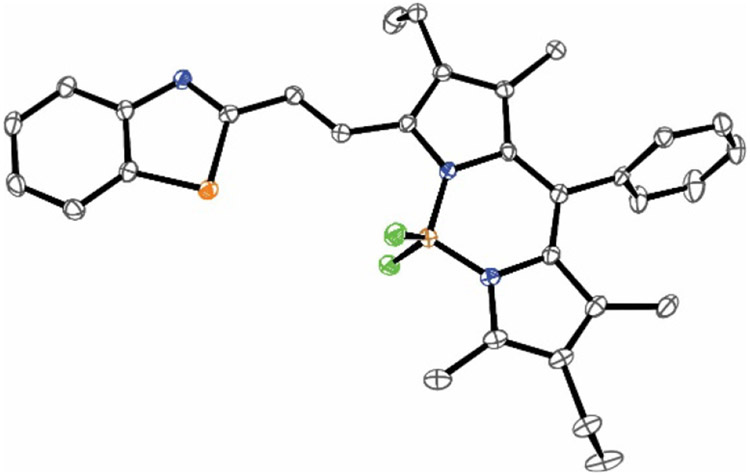
Compounds BO, BT and NBT pair a BODIPY chromophore to a benzoxazole, benzothiazole and nitrobenzothiazole heterocycle respectively through an olefinic bridge in their molecular skeleton (Figure 1). They were synthesized exploiting the Horner-Wadsworth-Emmons coupling of a formylated BODIPY precursor with the stabilized phosphonate carbanion of the benzoxazole heterocycle (Figure S1) or the Wittig coupling of the formylated BODIPY precursor with triphenylphosphonium yilides of the benzothiazole derivatives (Figures S2 and S3). Their structural identities were confirmed with a combination of high-resolution electrospray ionization mass spectrometry (ESIMS) and nuclear magnetic resonance (NMR) spectroscopy. Furthermore, single crystals of sufficient quality for X-ray diffraction analysis (Figure 2 and Table S1) were obtained for BT. The resulting structure shows the olefinic bridge between the BODIPY chromophore and the benzothiazole heterocycle to adopt a trans configuration. Consistent with an antiperiplanar arrangement of the two olefinic hydrogen atoms, the 1H NMR spectra of all three compounds show doublets for these protons with a vicinal coupling constant of ca. 17 Hz. Additionally, the 1H NMR spectra reveal a single set of resonances for each compound in deuterated chloroform at ambient temperature. These observations suggest that either a single species is present in solution or more than one conformational isomer co-exist in rapid equilibrium on the NMR timescale. In fact, the dihedral angles about the two [C–C] bonds flanking the olefinic bridge can position their substituent in either periplanar or antiperiplanar conformations, yielding a total of four possible conformational isomers for each one of the three compounds (Table S2). DFT calculations, performed with the B3LYP and M06HF functionals on the four possible conformational isomers of the two benzothiazole derivatives, reveal negligible energy differences. Specifically, the electronic energies (Tables S2 and S3) of the four species are within ca. 1.3 kcal mol−1 of each other for both BT and NBT. Similarly, their free energies (Tables S4 and S5) are within ca. 3.4 kcal mol−1 of each other for both compounds.
Figure 1.
Normalized absorption and emission spectra of BO (λEx = 550 nm), BT (λEx = 550 nm) and NBT (λEx = 560 nm) in MeCN at 25 °C.
Figure 2.
ORTEP representation (50% thermal ellipsoid probability, carbon = gray, nitrogen = blue, fluorine = green, boron = brown, sulfur = orange) of the structure adopted by BT in single crystals grown after the diffusion of pentane vapors into a CH2Cl2 solution of the compound.
The absorption and emission spectra (Figures 1 and S9-S11) of BO, BT and NBT reveal the characteristic bands of the BODIPY chromophore with molar absorption coefficients (ε) of 104, 124 and 120 mM−1 cm−1 respectively (Table S6). Comparison of BO and BT shows that the nature of the heteroatom (O vs. S) has a negligible influence on the wavelengths of their absorption (λAb) and emission maxima (λEm) as well as on their fluorescence quantum yields (ϕ), which are ca. 0.8 (Table S6). This value is significantly greater than that of the indolenine analog (8 in Table S6), which is 0.50, with an iso-propylidene group in place of the oxygen atom of BO or sulfur atom of BT. These values translate into a brightness (ε × ϕ) of 86, 105 and 53 mM−1 cm−1 for BO, BT and NBT respectively. Thus, heteroatom substitution of this particular group enhances the ability of the BODIPY chromophore to emit compared to the indolenine analog 8. Instead, the introduction of a nitro substituent in NBT causes a two-fold decrease in fluorescence quantum yield and brightness as well as bathochromic shifts in absorption and emission.
The ensemble emission spectra of BO, BT and NBT also change with the excitation wavelength (Figures S12a-S14a). The main BODIPY emission, observed upon excitation at 560 nm, is accompanied by a second blue-shifted weak emission, under excitation at 490 nm. Similarly, the excitation spectra of all compounds change with the emission wavelength (Figures S12b-S14b). Once again, the main BODIPY excitation band, observed with an emission wavelength of 650 nm, is accompanied by a second-blue-shifted excitation, when the detection wavelength is shifted to 545 nm. These observations are consistent with the co-existence of multiple conformational isomers in solution, suggested by the 1H NMR spectra and the DFT calculations. However, these ensemble measurements fail to resolve and characterize the full emission spectra of the co-existing species.
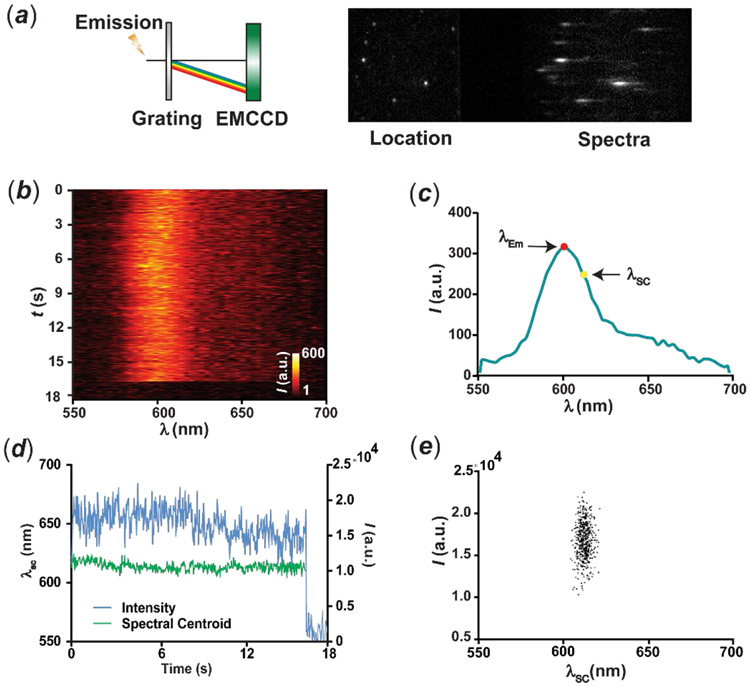
The outstanding photophysical properties of these fluorophores permit their rapid detection at the single-molecule level. The configuration employed for SMS is depicted in Figure 3a and adapts a sSMLM system we reported previously.25 Briefly, the non-dispersed zeroth-order and spectrally dispersed first-order images containing single-molecule positions and emission spectra are generated with a transmission-type diffraction grating, as the dispersive element, and detected by an electron multiplying charge-coupled device (EMCCD), while the corresponding single-molecule emission spectra are calibrated using the spatial positions of single molecules as references (calibration process detailed in the Supporting Information and Figure S4). With sparse sample density, the emission spectra of a BO molecule deposited on a glass substrate can be readily acquired over time and the averaged emission spectrum is similar to the ensemble measurement with a λEm of 599 nm (Figures 3b-c). For analyzing single-molecule spectral signatures, we calculated the intensity-weighted average wavelength, referred to as spectral centroid (λSC).12 The average λSC over 0–17s acquisition of this BO molecule is 614 nm (Figures 3c). The intensity trajectory shows a single-step photobleaching, which confirms detection of a single molecule of BO with concomitant fluctuation of the λSC (Figure 3d). Furthermore, the scatterplot of the emission intensity against λSC shows a spectral fluctuation for the single BO molecule from 603 to 623 nm with a standard deviation (σ) of 3.5 nm before it photobleaches at 17 s. A few distinct spectral jumping events are also observed upon recording their single-molecule spectral trajectories over time. For instance, the single-molecule spectrum of a BO molecule maintains λSC of ca. 606 nm in the first 8 s of the acquisition period (Figure S19). Subsequent hypsochromic shift in λSC to ca. 594 nm is firstly observed, followed by intensity jumping and recovery. We believe that the intensity fluctuation is caused by the increased competition between non-radiative relaxation and the radiative pathways in this particular conformation and local environment, which is typically observed for organic fluorophores and quantum dots.35 We speculate that the spectral jumping events are a consequence of conformational changes about the [C–C] bonds adjacent to the olefinic bridge, because of the relatively small energy barriers associated with the interconversion of the four possible conformational isomers. Instead, the energy barrier for the thermal trans → cis isomerization of the central [C=C] bond is approximately one order of magnitude larger.34 Moreover, irradiation of BO, BT and NBT in acetonitrile does not cause any changes in the ensemble emission spectra (Figures S15-S17), suggesting that photoinduced trans → cis isomerizations are also not occurring.
Figure 3.
Schematic representation (a) of the optical setup for high-throughput SMS and representative frames capturing the locations and emission spectra of individual molecules concurrently. Single-molecule emission spectra recorded over time (b), averaged emission spectrum before photobleaching (c), intensity and spectral-centroid evolution (d) of a single BO molecule over a time course of 18 s and scatterplot (e) of the emission intensity against the spectral centroid of the single molecule measured in each consecutive frame before photobleaching.
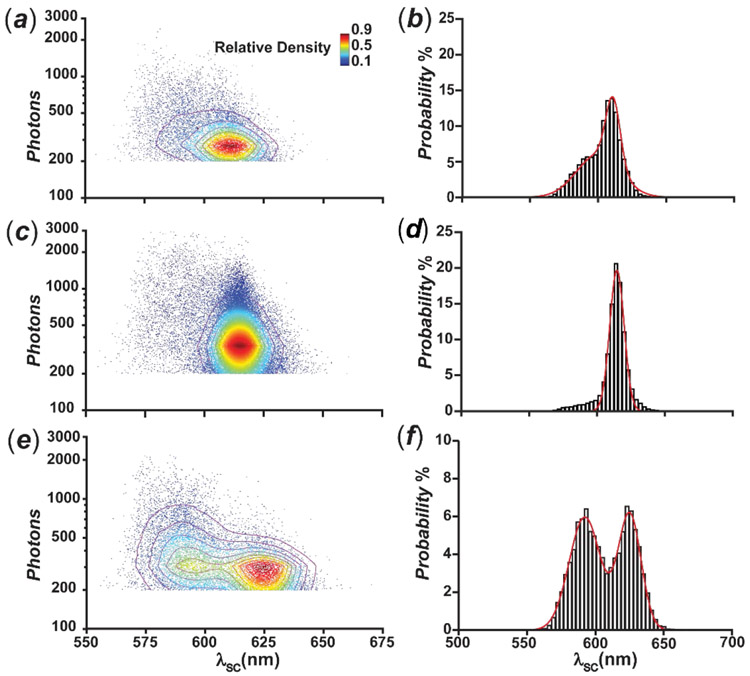
In order to clarify the nature of these effects, we performed high-throughput SMS to investigate large populations of single molecules of BO, BT and NBT and assess their spectral variations. Their single-molecule emission spectra vary significantly from 550 to 675 nm, with σ of λSC of 13.1, 9.8 and 19.1 nm for BO, BT and NBT respectively (Figure 4). The average photon counts (PC) of the BO, BT and NBT single molecules are 371, 475, and 473 respectively in the spectral channel, within 30 millisecond exposure time under our detection condition. Notably, the average PC of NBT is comparable with BT, which is different from the ensemble brightness measurement in acetonitrile. Presumably, photoinduced electron transfer from the excited BODIPY chromophore to the nitro group of NBT results in fluorescence quenching.29 This polarity-dependent process36 may be suppressed under the experimental conditions of the single-molecule measurements on glass substrates. Interestingly, the distribution of these single-molecule measurements in the two-dimensional (2D) intensity–spectral-centroid scatterplots show distinct domains among the three type of chromophores. The relative density distribution of BO shows a gradient density distribution and 50% of molecules located within the elliptical region between PC of 250 and 400 as well as λSC of 605 and 625 nm (Figure 4a). The λSC distribution of BO shows two majors λSC population from 550–650 nm, while two Gaussian functions can be fitted with peaks at 600 nm and 611 nm with σ of 22.6 nm and 7.4 nm (Figure 4b). BT shows a single dominant population and the histogram of λSC can be fitted with a gaussian with peak at 615 nm with a σ of 7.5 nm (Figures 4c-d). A small fraction of the BT single molecules with a λSC shorter than 600 nm is observed in the 2D scatterplot, which contributes to a residue band in the λSC histogram between 550–600 nm. The 2D scatterplot of NBT illustrates even more distinct spectral patterns, comparing to the above two cases. The density distribution displays two domains centered at 303 and 310 on the PC-axis, and 593 nm and 623 nm on the λSC-axis respectively, while their λSC are separated by 30 nm (Figure 4e). The histogram of its λSC is fitted with two Gaussian functions with σ values of 15.6 nm and 11.4 nm corresponding to the 593 nm and 623 nm peaks (Figure 4f). The PCs of the single molecules from the two distinct spectral population also demonstrate different distributions (Figure S20-S22). Specifically, the single molecules of BO, BT and NBT from 550–600 nm are relatively brighter with mean PCs of 463, 741 and 552, compared to the counterpart populations at 600–650 nm with mean PCs of 326, 450 and 331 respectively. These results suggest that high-throughput SMS is readily capable of resolving the distinct spectral features of different subsets of emitters at the single-molecule level. In fact, it has recently been demonstrated that the photoinduced isomerization of spiropyrans can be explored with similar sSMLM systems.26
Figure 4.
Scatterplots (a, c and e) of the emission intensity against the spectral centroid with the relative density of distribution and histograms (b, d and f) of the spectral-centroid distribution of BO, BT and NBT respectively. The color bar and 2D contour indicate the relative density of the detected single molecules in different regions of the scatterplot.
Furthermore, we calculated the averaged emission spectra of the three chromophores around their histogram peak regions. Two distinct averaged emission spectra are observed in all three cases, with a λEm of ca. 575 nm for the blue-shifted spectra and of 594 nm, 600 nm and 610 nm of the red-shifted populations for BO, BT and NBT respectively (Figures S23-S25). These spectra may correspond to distinct conformational isomers co-existing under the conditions of our single-molecule measurements. Notably, the λEm of the BO molecule shown in Figure S19 are 584 nm and 570 nm before and after the spectral jumping event respectively. The λEm values have 10 nm and 5 nm hypsochromic shifts comparing to the averaged emission spectra of the red-shifted and blue-shifted spectral populations. Presumably, the specific local environment can cause the single-molecule spectral variations along with the conformational changes.
TDDFT calculations, performed on the optimized geometries of the four conformational isomers of BT and NBT with the B3LYP and M06HF functionals, are also in agreement with the spectroscopic behavior observed experimentally. Specifically, the computed vertical energies (Tables S2 and S3) increase with a change in the conformation about the [C–C] bond connecting the BODIPY chromophore to the olefinic bond from antiperiplanar to periplanar. Instead, this parameter is essentially unaffected by the orientation of the benzothiazole heterocycle relative to the adjacent the [C–C] bond. As a result, the pair of conformational isomers with antiperiplanar BODIPY arrangement are estimated to have blue-shifted absorption bands relative to the other pair (Figures S5-S8). These results are consistent with the pair of spectral domains observed at the single-molecule level and are indicative of the co-existence of distinct conformational isomers.
However, while the wavelengths computed with the B3LYP functional for the vertical transitions of the four conformational isomers of BT and NBT are close to the experimental values (584 and 592 nm) for the absorption maxima (Table S4), the M06HF functional appears to underestimate significantly these parameters. Specifically, the B3LYP functional computes wavelengths in the 542–564 and 591–604 nm ranges for BT and NBT respectively, while the M06HF functional estimates them in the 467–480 and 464–477 nm ranges.
In conclusion, high-throughput single-molecule spectroscopy allows the identification of distinct, but co-existing, conformational isomers of BODIPY derivatives. Two main populations of molecules with antiperiplanar and periplanar conformations, about the [C–C] bond connecting the BODIPY chromophore to the adjacent olefinic bridge, emit with sufficiently-resolved spectral centroids to be discriminated at the single-molecule level with statistical confidence. The resolved single-molecule emission spectra of the two isomers resemble the TDDFT simulations. These results demonstrate the power of high-throughput single-molecule spectroscopy in the analysis of complex mixtures of emissive species that cannot otherwise be differentiated with conventional spectroscopic measurements. Further understanding and manipulating the distinct spectral populations accessible with this high-throughput single-molecule spectroscopic method can guide the design of switchable fluorescent probes for the development of spectroscopic single-molecule imaging.
Supplementary Material
Acknowledgments.
The National Institutes of Health (R01EY026078, R01EY029121) and the National Science Foundation (CHE-1505885, CBET-1706642, EFMA-1830969) are acknowledged for financial support. JLD was supported by the NSF Graduate Research Fellowship (DGE-1842165).
Footnotes
Supporting Information Available. Procedures; crystallographic data; computational data; spectroscopic data. This material is available free of charge via the Internet at http://pubs.acs.org.
References
- (1).Zhang J; Huang X; Chen X Supramolecular isomerism in coordination polymers. Chem. Soc. Rev 2009, 38, 2385–2396. [DOI] [PubMed] [Google Scholar]
- (2).Alkorta I; Elguero J; Roussel C; Vanthuyne N; Piras P Atropisomerism and Axial Chirality in Heteroaromatic Compounds. Adv. Heterocycl. Chem 2012, 105, 1–188. [Google Scholar]
- (3).Anguera G; Sánchez–García D Porphycenes and Related Isomers: Synthetic Aspects. Chem. Rev 2017, 117, 2481–2516. [DOI] [PubMed] [Google Scholar]
- (4).Moerner WE Single–Molecule Spectroscopy, Imaging, and Photocontrol: Foundations for Super–Resolution Microscopy (Nobel Lecture). Angew. Chem. Int. Ed 2015, 54, 8067–93. [DOI] [PubMed] [Google Scholar]
- (5).Betzig E; Chichester RJ Single Molecules Observed by Near–Field Scanning Optical Microscopy. Science 1993, 262, 1422–1425. [DOI] [PubMed] [Google Scholar]
- (6).Nie S; Chiu DT; Zare RN Probing individual molecules with confocal fluorescence microscopy. Science 1994, 266, 1018–1021. [DOI] [PubMed] [Google Scholar]
- (7).Nirmal M; Dabbousi BO; Bawendi MG; Macklin JJ; Trautman JK; Harris TD; Brus LE Fluorescence intermittency in single cadmium selenide nanocrystals. Nature 1996, 383, 802–804. [Google Scholar]
- (8).Ha T; Zhuang X; Kim HD; Orr JW; Williamson JR; Chu S Ligand–induced conformational changes observed in single RNA molecules. Proc. Natl. Acad. Sci. U.S.A 1999, 96, 9077–9082. [DOI] [PMC free article] [PubMed] [Google Scholar]
- (9).Weiss S Fluorescence Spectroscopy of Single Biomolecules. Science 1999, 283, 1676–1683. [DOI] [PubMed] [Google Scholar]
- (10).Ha T Single–molecule methods leap ahead. Nat. Methods 2014, 11, 1015–1018. [DOI] [PubMed] [Google Scholar]
- (11).Schlau–Cohen GS; Bockenhauer S; Wang Q; Moerner WE Single–molecule spectroscopy of photosynthetic proteins in solution: exploration of structure–function relationships. Chem. Sci 2014, 5, 2933–2939. [Google Scholar]
- (12).Lu HP; Xie XS Single–molecule spectral fluctuations at room temperature. Nature 1997, 385, 143–146. [Google Scholar]
- (13).Ma Y; Shortreed MR; Yeung ES High–Throughput Single–Molecule Spectroscopy in Free Solution. Anal. Chem 2000, 72, 4640–4645. [DOI] [PubMed] [Google Scholar]
- (14).Piatkowski L; Gellings E; van Hulst NF Broadband single–molecule excitation spectroscopy. Nat. Commun 2016, 7, 10411. [DOI] [PMC free article] [PubMed] [Google Scholar]
- (15).Lu M; Lu HP Probing Protein Multidimensional Conformational Fluctuations by Single–Molecule Multiparameter Photon Stamping Spectroscopy. J. Phys. Chem. B 2014, 118, 11943–11955. [DOI] [PMC free article] [PubMed] [Google Scholar]
- (16).Walder R; Kastantin M; Schwartz DK High throughput single molecule tracking for analysis of rare populations and events. Analyst 2012, 137, 2987–2996. [DOI] [PubMed] [Google Scholar]
- (17).Squires AH; Dahlberg PD; Liu H; Magdaong NCM; Blankenship RE; Moerner WE Single–molecule trapping and spectroscopy reveals photophysical heterogeneity of phycobilisomes quenched by Orange Carotenoid Protein. Nat. Commun 2019, 10, 1172. [DOI] [PMC free article] [PubMed] [Google Scholar]
- (18).Krüger TPJ; Novoderezhkin VI; Ilioaia C; van Grondelle R Fluorescence Spectral Dynamics of Single LHCII Trimers. Biophys. J 2010, 98, 3093–3101. [DOI] [PMC free article] [PubMed] [Google Scholar]
- (19).Xiao L; He Y; Yeung ES High Throughput Single Molecule Spectral Imaging of Photoactivated Luminescent Silver Clusters on Silver Island Films. J. Phys. Chem. C 2009, 113, 5991–5997. [Google Scholar]
- (20).Zhang Z; Kenny SJ; Hauser M; Li W; Xu K Ultrahigh–throughput single–molecule spectroscopy and spectrally resolved super–resolution microscopy. Nat. Methods 2015, 12, 935–938. [DOI] [PubMed] [Google Scholar]
- (21).Dong B; Almassalha L; Urban BE; Nguyen T–Q; Khuon S; Chew T–L; Backman V; Sun C; Zhang HF Super–resolution spectroscopic microscopy via photon localization. Nat. Commun 2016, 7, 12290. [DOI] [PMC free article] [PubMed] [Google Scholar]
- (22).Bongiovanni MN; Godet J; Horrocks MH; Tosatto L; Carr AR; Wirthensohn DC; Ranasinghe RT; Lee J–E; Ponjavic A; Fritz JV; Dobson CM; Klenerman D; Lee SF Multi–dimensional super–resolution imaging enables surface hydrophobicity mapping. Nat. Commun 2016, 7, 13544. [DOI] [PMC free article] [PubMed] [Google Scholar]
- (23).Huang T; Phelps C; Wang J; Lin LJ; Bittel A; Scott Z; Jacques S; Gibbs SL; Gray JW; Nan X Simultaneous Multicolor Single–Molecule Tracking with Single–Laser Excitation via Spectral Imaging. Biophys J 2018, 114, 301–310. [DOI] [PMC free article] [PubMed] [Google Scholar]
- (24).Moon S; Yan R; Kenny SJ; Shyu Y; Xiang L; Li W; Xu K Spectrally Resolved, Functional Super–Resolution Microscopy Reveals Nanoscale Compositional Heterogeneity in Live–Cell Membranes. J. Am. Chem. Soc 2017, 139, 10944–10947. [DOI] [PubMed] [Google Scholar]
- (25).Zhang Y; Song K–H; Dong B; Davis JL; Shao G; Sun C; Zhang HF Multicolor super–resolution imaging using spectroscopic single–molecule localization microscopy with optimal spectral dispersion. Appl. Opt 2019, 58, 2248–2255. [DOI] [PMC free article] [PubMed] [Google Scholar]
- (26).Kim D; Zhang Z; Xu K Spectrally Resolved Super–Resolution Microscopy Unveils Multipath Reaction Pathways of Single Spiropyran Molecules. J. Am. Chem. Soc 2017, 139, 9447–9450. [DOI] [PubMed] [Google Scholar]
- (27).Zhang Y; Tang S; Thapaliya ER; Sansalone L; Raymo FM Fluorescence activation with switchable oxazines. Chem. Commun 2018, 54, 8799–8809. [DOI] [PubMed] [Google Scholar]
- (28).Tang S; Zhang Y; Dhakal P; Ravelo L; Anderson CL; Collins KM; Raymo FM Photochemical Barcodes. J. Am. Chem. Soc 2018, 140, 4485–4488. [DOI] [PMC free article] [PubMed] [Google Scholar]
- (29).Zhang Y; Swaminathan S; Tang S; Garcia–Amorós J; Boulina M; Captain B; Baker JD; Raymo FM Photoactivatable BODIPYs Designed To Monitor the Dynamics of Supramolecular Nanocarriers. J. Am. Chem. Soc 2015, 137, 4709–4719. [DOI] [PubMed] [Google Scholar]
- (30).Sansalone L; Tang S; Garcia–Amoros J; Zhang Y; Nonell S; Baker JD; Captain B; Raymo FM A Photoactivatable Far–Red/Near–Infrared BODIPY To Monitor Cellular Dynamics in Vivo. ACS Sens. 2018, 3, 1347–1353. [DOI] [PubMed] [Google Scholar]
- (31).Mazza MMA; Cardano F; Cusido J; Baker JD; Giordani S; Raymo FM Ratiometric temperature sensing with fluorescent thermochromic switches. Chem. Commun 2019, 55, 1112–1115. [DOI] [PubMed] [Google Scholar]
- (32).Betzig E; Patterson GH; Sougrat R; Lindwasser OW; Olenych S; Bonifacino JS; Davidson MW; Lippincott–Schwartz J; Hess HF Imaging Intracellular Fluorescent Proteins at Nanometer Resolution. Science 2006, 313, 1642. [DOI] [PubMed] [Google Scholar]
- (33).Zhang Y; Song KH; Tang S; Ravelo L; Cusido J; Sun C; Zhang HF; Raymo FM Far–Red Photoactivatable BODIPYs for the Super–Resolution Imaging of Live Cells. J. Am. Chem. Soc 2018, 140, 12741–12745. [DOI] [PMC free article] [PubMed] [Google Scholar]
- (34).Thapaliya ER; Garcia–Amoros J; Nonell S; Captain B; Raymo FM Structural implications on the excitation dynamics of fluorescent 3H–indolium cations. Phys. Chem. Chem. Phys 2017, 19, 11904–11913. [DOI] [PubMed] [Google Scholar]
- (35).Stefani FD; Hoogenboom JP; Barkai E Beyond quamtum jumps: Blinking nanoscale light emitters. Phys. Today 2009, 62, 34–39.20523758 [Google Scholar]
- (36).Sunahara H; Urano Yasuteru, Kojima H; Nagano T Design and synthesis of a library of BODIPY–based environmental polarity sensors utilizing photoinduced electron–transfer–controlled fluorescence on/off switching. J. Am. Chem. Soc 2007, 129, 5597–5604. [DOI] [PubMed] [Google Scholar]
Associated Data
This section collects any data citations, data availability statements, or supplementary materials included in this article.


