

Summary
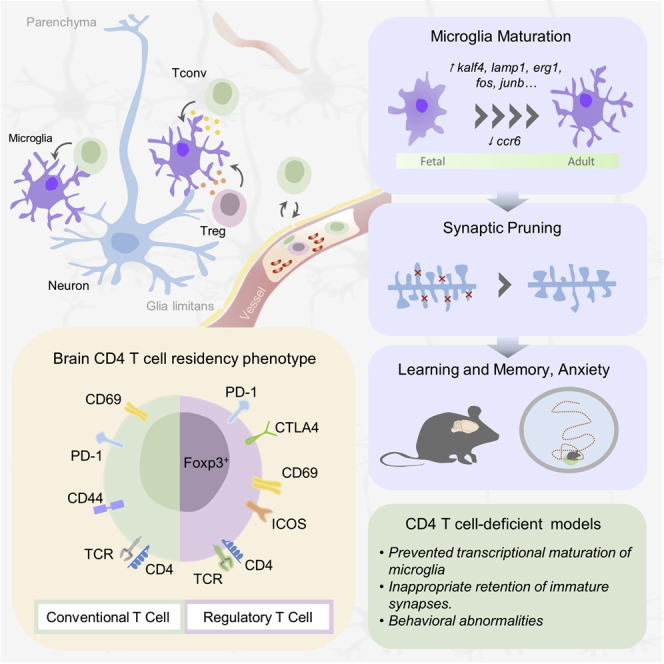
The brain is a site of relative immune privilege. Although CD4 T cells have been reported in the central nervous system, their presence in the healthy brain remains controversial, and their function remains largely unknown. We used a combination of imaging, single cell, and surgical approaches to identify a CD69+ CD4 T cell population in both the mouse and human brain, distinct from circulating CD4 T cells. The brain-resident population was derived through in situ differentiation from activated circulatory cells and was shaped by self-antigen and the peripheral microbiome. Single-cell sequencing revealed that in the absence of murine CD4 T cells, resident microglia remained suspended between the fetal and adult states. This maturation defect resulted in excess immature neuronal synapses and behavioral abnormalities. These results illuminate a role for CD4 T cells in brain development and a potential interconnected dynamic between the evolution of the immunological and neurological systems.
Video Abstract
Keywords: brain, T cells, microglia, mouse, human, differentiation, CD4 T cells, tissue-resident, microflora, migration
Graphical Abstract
Highlights
-
•
Residential CD4 T cells are present in the healthy mouse and human brain
-
•
Brain residency is a transient program initiated in situ and lasting weeks
-
•
CD4 T cell entry around birth drives a transcriptional maturation step in microglia
-
•
Absence of CD4 T cells results in defective synaptic pruning and behavior
Identification of brain-resident CD4+ T cells in mice and humans, which are required for microglia maturation and proper synaptic pruning and behavior.
Introduction
The brain is a site of relative immune privilege. The immunological perspective of the brain has gradually evolved with sequential identifications of linkages between the brain and the immune system. The blood-brain-barrier effectively stops macromolecules, but subsets of leukocytes can interact with the intact barrier and cross over into the perivascular space in low numbers (Hickey, 1991, 1999; Wekerle et al., 1991). Passage from the blood to the brain is a tightly regulated two-step process involving: (1) passage over the endothelial layer delineating the capillaries and the basal membrane into the perivascular space, and (2) passage over the glia limitans that builds the border between the perivascular space and the brain parenchyma. The first step occurs even under physiological conditions, whereas the crossing of the glia limitans is usually considered to occur in concert with a neuroinflammatory event (Hickey, 1991, 1999; Mundt et al., 2019; Wekerle et al., 1991). Leukocytes can also potentially enter the brain parenchyma from the cerebrospinal fluid, but need to cross the ependymal cell layer that delineate the ventricles (Bechmann et al., 2007; Engelhardt and Ransohoff, 2012; Wilson et al., 2010). In conjunction with the communication between perivascular spaces with the subarachnoidal space, the periarterial/perivascular drainage (Engelhardt et al., 2016; Weller et al., 2008), the recent re-discovery of extensive brain lymphatics draining the dura mater (Da Mesquita et al., 2018; Louveau et al., 2015), and vascular channels linking the bone-marrow of the skull to the brain surface (Herisson et al., 2018), it is becoming increasingly clear that the brain is a part of the immune surveillance network that covers the entire body. Nonetheless, the healthy brain is unique in terms of the anatomical structures separating the tissue from the blood.
Microglia are the primary resident immune cells of the brain, providing the tissue with innate immune sensing, inflammatory effector functions, and tissue repair services. Microglia also provide key support functions for normal brain development (Cunningham et al., 2013; Paolicelli et al., 2011; Sierra et al., 2010). In addition to microglia, the healthy brain contains sizable numbers of perivascular macrophages and dendritic cells (Mrdjen et al., 2018) and detectable numbers of T cells, B cells, and natural killer (NK) cells (Korin et al., 2017), although whether these latter populations are truly brain-resident remains controversial. CD4 T cells are best known in the neurological context as potent mediators of autoimmune diseases, such as multiple sclerosis, where oligodendrocytes are the target (Codarri et al., 2011; Komuczki et al., 2019), and narcolepsy, where hypocretin neurons are killed (Hartmann et al., 2016; Latorre et al., 2018). Beyond autoimmunity, CD4 T cells may have a role in the neurodegenerative diseases, being present in patient samples and functionally active in mouse models of Parkinson’s (Brochard et al., 2009), Alzheimer’s (Baruch et al., 2015; Dansokho et al., 2016; Lambert et al., 2013; Monsonego et al., 2003), and stroke (Ito et al., 2019). Yet, despite this growing appreciation of the role of CD4 T cells in neuroinflammatory and neurodegenerative processes, the presence and potential function of these cells in the healthy brain remains controversial. Here, we quantified and characterized the brain CD4 T cell population, finding in situ initiation of a residency program. Absence of the CD4 T cell population resulted in microglia remaining suspended between a fetal and adult developmental state, with resulting defects in synaptic pruning function and normal mouse behavior.
Results
Brain CD4 T Cells Show a Conserved Residency Phenotype in the Healthy Mouse and Human Brain
Despite reports of CD4 T cells in the mouse and human brain (Smolders et al., 2018; Song et al., 2016; Xie et al., 2015), the existence of these cells in healthy brain tissues has remained controversial, with contaminating circulatory T cells potentially explaining the discrepancy in results. Using confocal imaging on the mouse brain, we identified rare CD4 T cells scattered across the brain, including cells undergoing transition across the α1/α4 laminin basement membranes lining leptomeninges (Figures 1A and 1B) or blood vessels (Figure 1C). CD4 T cells were identified beyond the α1/α4 laminin basement membranes (Figures 1D–1F) and both within (Figure 1G) and beyond (Figures 1H and 1I) the glia limitans. Importantly, this puts the T cells in close proximity to microglia (Figures 1J, 1K, and S1A–S1K; Videos S1, S2, S3, S4, S5, S6, and S7). Using proximity to lectin-stained vessels (Figures S1L–S1O), we found CD4 T cells at a density of ∼4 cells/mm3 (Figure 1L). CD4 T cells were distributed relatively evenly across brain regions (Figure 1M). Although comprehensive analysis of the anatomical zone requires further investigation, the substantial proportion of these CD4 T cells that are distal to the identified vasculature, including cells beyond the glia limitans, is consistent with a non-vascular non-meningeal placement for a subset of cells.
Figure 1.

CD4 T Cells Are Present in the Healthy Mouse and Human Brain
For a Figure360 author presentation of this figure, see https://doi.org/10.1016/j.cell.2020.06.026.
(A and B) Surface rendering of confocal images. Representative image of (A) CD4 T cell crossing laminin 4 barrier or (B) laminin α1 barrier within midbrain meningeal folds.
(C) Representative image of a CD4 T cell undergoing transvascular movement in the hindbrain.
(D–F) Representative images of CD4 T cells beyond the laminin 4/α1 barrier in the (D) cerebellum, (E) hindbrain, or (F) olfactory bulb.
(G–I) Representative images of CD4 T cells (G) enclosed by the glia limitans in the mid-brain and beyond the glia limitans in (H) the midbrain and (I) the cerebellum.
(J and K) Representative images of CD4 T cells in close proximity to microglia in the (J) midbrain (K) or hindbrain. Scale bar, 20 μm.
(L) Quantification of CD4 T cells based on proximity to vasculature from the sagittal sections of the mouse brain.
(M) Relative and absolute distribution of CD4 T cells across mouse brain regions, based on quantification of sagittal sections. Values represent the number of non-vascular CD4 T cells located in each region, per mm3 or in absolute number (biological replicates from the average of 21–23 quantified sections).
(N) Mice were intravenously (i.v.) injected with anti-CD45-PE and perfused. Brains were then dissected and analyzed by flow cytometry for the proportion of intravascular CD4 T cells (n = 3,5,2).
(O and P) CD4 T cells in dissected mouse brain regions by flow cytometry, based on (O) percentage of CD45+ cells or (P) absolute number (n = 4).
(Q and R) Absolute number of (Q) CD4 T cells and (R) Tregs in the perfused healthy mouse brain, as assessed by imaging (excluding vascular cells) and flow cytometry (excluding meningeal cells).
(S) Average proportion of CD4 T cells in the white matter, gray matter, and meninges of healthy brain tissue (n = 4).
See also Figure S1 and Videos S1, S2, S3, S4, S5, S6, and S7.
Figure S1.

Localization of CD4 T Cells in the Healthy Mouse Brain, Related to Figure 1
(A) Perfused brain was stained for CD4 (green), laminin 4 (red), laminin α1 (white) and DAPI (blue), displaying individual channels and composite image. Representative image of CD4 T cell crossing laminin 4 barrier or (B) laminin α1 barrier within midbrain meningeal folds. (C) Representative image of a CD4 T cell undergoing transvascular movement in the hindbrain. (D) Representative images of CD4 T cells beyond the laminin 4/α1 barrier in the cerebellum, (E) hindbrain or (F) olfactory bulb. (G) Surface rendering of confocal images showing CD4 T cells (green), CD31+ vasculature (red), GFAP+ astrocytes (magenta) and DAPI (blue). Representative images of CD4 T cells enclosed by the glia limitans in the mid-brain, and beyond the glia limitans in (H) the midbrain and (I) the cerebellum. (J) Perfused brain was stained for CD4 (green), CD31 (red), Iba1 (yellow) and DAPI (blue), displaying individual channels and composite image. Representative images of CD4 T cells in close proximity to microglia in the midbrain (K) or hindbrain. Scale bar = 20μm. (L) Representative confocal images showing CD4 T cells, immunostained using CD4 (green) and Foxp3 (red) staining located in mouse brain distal to the vasculature, adjacent to the vasculature, and in the intravascular space. Fluorescent-labeled lectin was used to label vasculature (white) and cell nuclei were stained with DAPI (blue). Scale bar = 20μm. (M) Magnification and 3D-reconstruction of an example of CD4+Foxp3- T cells, and (N) CD4+Foxp3+ T cells. Scale bar = 10μm. (O) Representative measurements of distances between CD4 T cells and the vasculature, for cells deemed distal to, adjacent to or inside the vasculature.
3D surface rendering of perfused brain stained for CD4 (green), laminin 4 (red), laminin α1 (white) and DAPI (blue). Representative video of CD4 T cell crossing laminin 4 barrier within midbrain meningeal folds.
3D surface rendering of perfused brain stained for CD4 (green), laminin 4 (red), laminin α1 (white) and DAPI (blue). Representative video of CD4 T cell crossing laminin α1 barrier within midbrain meningeal folds.
3D surface rendering of perfused brain stained for CD4 (green), CD31 (red), GFAP (magenta) and DAPI (blue). Representative images of CD4 T cells enclosed within the glia limitans in the midbrain.
3D surface rendering of perfused brain stained for CD4 (green), CD31 (red), GFAP (magenta) and DAPI (blue). Representative images of CD4 T cells enclosed beyond the glia limitans in the midbrain.
3D surface rendering of perfused brain stained for CD4 (green), CD31 (red), GFAP (magenta) and DAPI (blue). Representative images of CD4 T cells enclosed beyond the glia limitans in the cerebellum.
3D surface rendering of perfused brain stained for CD4 (green), CD31 (red), Iba1 (yellow) and DAPI (blue). Representative images of CD4 T cells in close proximity to microglia in the midbrain.
3D surface rendering of perfused brain stained for CD4 (green), CD31 (red), Iba1 (yellow), and DAPI (blue). Representative images of CD4 T cells in close proximity to microglia in the hindbrain.
As an independent approach to identify and quantify CD4 T cells in the mouse brain, we used high dimensional flow cytometry. Through a combination of tissue perfusion and intravenous anti-CD45 PE-conjugated labeling, we determined that perfusion led to a purity of ∼90% non-vascular CD4 T cells (Figure 1N). Brain region dissection and flow cytometry found a small but consistent proportion of CD4 T cells across the brain (Figure 1O). Notably, while the meninges were richest in CD4 T cells, > 75% of brain CD4 T cells were in the brain tissue, rather than the meninges (Figure 1P). Together, the two independent approaches to identifying CD4 T cells, confocal imaging and flow cytometry, each came up with values of ∼2000 brain-resident CD4 T cells (Figure 1Q), of which ∼150 are regulatory T cells (Tregs) (Figure 1R), in the healthy adult murine brain. To determine whether this finding was applicable to humans, we assessed healthy human brain tissue removed during temporal lobe surgery by flow cytometry, and found cellular densities of CD4 T cells at a similar level to that of the mouse (Figure 1S).
To characterize the CD4 T cells present in the brain, we used high dimensional flow cytometry and single-cell sequencing. Although these approaches allow higher throughput and greater depth of information, they also result in loss of spatial information, such as including cells from deep meningeal folds. Conventional (Foxp3−) CD4 T cells from the perfused adult mouse brain presented with an expression profile highly distinct (p < 10−10) from the analogous cells in the blood (Figure 2A). The key phenotypic differences in the brain were the relative paucity of naive cell clusters and the expansion of clusters expressing the residency marker CD69 (Figures 2B and S2A). At a transcriptional level, the predominant cytokine expression observed was interferon gamma (IFNγ) and CCL5 (Figure S2C). A similar distinction between brain Tregs and blood regulatory T cells was observed (Figure 2C), with elevated expression of activation markers CTLA-4 and ICOS as well as the residency markers ST2 and CD69 (Figures 2D and S2B). The number of brain CD4 T cells was maximal around birth, declined in the post-natal period, and then slowly increased with age (Figures S2D–S2G). An evolving phenotype was observed with age (Figures S2H–S2K), but was relatively consistent across brain regions (Figures S2L–S2S), with blood and meningeal CD4+ T cells forming the outgroup. This phenotypic data supports a non-vascular non-meningeal localization of a small brain-resident CD4+ T cell population in the mouse.
Figure 2.

A Conserved Residency Program for CD4 T Cells and Tregs in the Healthy Mouse and Human Brain
(A) Healthy perfused mouse brains were compared to blood by high-dimensional flow cytometry. n = 5. t-Distributed Stochastic Neighbor Embedding (t-SNE) of conventional T cells built on key markers (CD62L, CD44, CD103, CD69, CD25, PD-1, Nrp1, ICOS, KLRG1, ST2, Ki67, Helios, T-bet, and CTLA4). Colors indicate FlowSOM clusters, quantified in side panel.
(B) Representative histograms for conventional T cells from wild-type mouse blood and brain.
(C) t-SNE of Tregs built on key markers. Colors indicate FlowSOM clusters, quantified in side panel.
(D) Representative histograms for Tregs from mouse blood and brain.
(E) Unaffected human brain tissues were compared to peripheral blood mononuclear cells (PBMCs) by high-dimensional flow cytometry, n = 4. t-SNE of conventional T cells built on key markers (ICOS, CD28, CD69, Ki-67, CD95, CD31, HLA-DR, CCR2, CXCR5, CD25, PD-1, CXCR3, RORγT, CCR4, CTLA-4, CCR7, and CD45RA). Colors indicate FlowSOM clusters.
(F) Dendrogram showing the relationship across the brain regions based on cross-entropy differences in t-SNE.
(G) 10× single-cell sequencing was performed on sorted CD4 T cells from the human brain and PBMCs. Quality control filtering and gating based on expression markers identified 86 CD4+ T cells from the brain and 567 CD4+ T cells from the blood. t-SNE visualizing cell clusters built on the combined population of 653 CD4+ cells. Clusters are identified with different colors and labeled based on signature expression of transcriptional markers (left) or tissue origin (right).
(H) Volcano plot of differential expression between brain and PBMC CD4 T cells. Indicated cut-offs are used for pathway analysis.
See also Figure S2.
Figure S2.

A Conserved Residency Profile for CD4 T Cells and Regulatory T Cells in the Healthy Mouse and Human Brain, Related to Figure 2
(A) Healthy perfused mouse brains were compared to blood by high-dimensional flow cytometry. Comparison of expression levels of CD62L, CD44, CD103, CD69, CD25, PD-1, Nrp1, ICOS, KLRG1, ST2, Ki67, Helios, T-bet and CTLA4 on blood versus brain CD4+CD3+CD45+CD8-Foxp3- T cells or (B) CD4+CD3+CD45+CD8-Foxp3+ Tregs (n = 5). (C) Transcription profile of CD4+ T cells purified from the murine brain, with analysis through the 10X single cell pipeline and filtering for known cytokines. Naive, activated and regulatory cells were defined based on tSNE clusters and the relative expression of CD44, CD62L and Foxp3 within each cluster. (D) CD4 T cells were assessed in the perfused mouse brain by high-dimensional flow cytometry. Wild-type mice were sampled across the late embryonic (day 19), post-natal development (day 5, 10, 21, 30) and during healthy aging (weeks 8, 12, 30 and 52). n = 9,3,3,5,2,8,5,6,5. Quantification of CD4+ cells per gram of brain tissue, (E) CD4+ T cells, as percentage of CD45+ cells, (F) CD4+Foxp3- conventional T cells and (G) CD4+Foxp3+ regulatory T cells. (H) tSNE of CD4+Foxp3- T cells gated on CD4+Foxp3-CD3+CD8-CD45+ cells and built on CD62L, CD44, CD103, CD69, CD25, PD-1, Nrp1, ICOS, KLRG1, ST2, Ki67, Helios, T-bet and CTLA4. FlowSOM clusters identified in color. P values refer to cross-entropy difference between age-matched blood and brain samples. Dendrogram represents cross-entropy distance between samples. (I) Comparison of expression levels of CD62L, CD44, CD103, CD69, CD25, PD-1, Nrp1, ICOS, KLRG1, ST2, Ki67, Helios, T-bet and CTLA4 on blood versus brain CD4+CD3+CD45+CD8-Foxp3- T cells at different ages. (G) tSNE of CD4+Foxp3+ T cells gated on CD4+Foxp3+CD3+CD8-CD45+ cells and built on CD62L, CD44, CD103, CD69, CD25, PD-1, Nrp1, ICOS, KLRG1, ST2, Ki67, Helios, T-bet and CTLA4. FlowSOM clusters identified in color. P values refer to cross-entropy difference between age-matched blood and brain samples. (J) Comparison of expression levels of CD62L, CD44, CD103, CD69, CD25, PD-1, Nrp1, ICOS, KLRG1, ST2, Ki67, Helios, T-bet and CTLA4 on blood versus brain CD4+CD3+CD45+CD8-Foxp3+ T cells at different ages. (K) Brain regions were surgically dissected and resident CD4 T cells were characterized by high-dimensional flow cytometry at 10 days, 30 weeks, 60 weeks and 90 weeks of age (n = 6,4,4,5). (L) Numbers and frequencies of CD4 T cells across brain regions in pups and adult mice. (M) tSNE of CD4+ Foxp3- T cells gated on CD4+Foxp3-CD3+CD8-CD45+ cells and built on CD62L, CD44, CD103, CD69, CD25, PD-1, Nrp1, ICOS, KLRG1, ST2, Ki67, Helios, T-bet, CTLA4, shown for blood and different brain regions in adult mice. The adjusted P value reflects the cross-entropy difference between tSNE plots in brain region versus blood. (N) Dendrogram showing the relationship in Tconv across the brain regions based on cross-entropy differences in tSNE. (O) CD69 expression in Tconv from the brain regions in pups and adult mice. (P) Heatmap showing expression of markers in brain region Tconv. (Q) tSNE of CD4+ Foxp3+ T cells gated on CD4+Foxp3+CD3+CD8-CD45+ cells and built on CD62L, CD44, CD103, CD69, CD25, PD-1, Nrp1, ICOS, KLRG1, ST2, Ki67, Helios, T-bet, CTLA4, shown for blood and different brain regions. The adjusted P value reflects the cross-entropy difference between tSNE plots in brain region versus blood. (R) CD69 expression in Treg from the brain regions in pups and adult mice. (S) Heatmap showing expression of markers in brain region Treg. (T) Unaffected human brain tissues removed during brain surgery were compared to peripheral blood mononuclear cells by high-dimensional flow cytometry (n = 4). Representative histograms for CD4+Foxp3- T cells from human peripheral blood mononuclear cells, white matter, gray matter and meninges for CCR2, CXCR3, PD-1 and CD69. (U) Expression of ICOS, CD28, CD69, Ki-67, CD95, CD31, HLA-DR, CCR2, CXCR5, CD25, PD-1, CXCR3, RORγT, CCR4, CTLA-4, CCR7 and CD45RA on CD4+Foxp3- T cells. (V) tSNE of CD4+Foxp3+ T cells gated on CD4+Foxp3+CD3+CD8-CD14- cells and built on ICOS, CD28, CD69, Ki-67, CD95, CD31, HLA-DR, CCR2, CXCR5, CD25, PD-1, CXCR3, RORγT, CCR4, CTLA-4, CCR7 and CD45RA. Colors indicate FlowSOM clusters. Dendrogram showing the relationship across the brain regions based on cross-entropy differences in tSNE. (W) Representative histograms for CD4+Foxp3+ T cells from human peripheral blood mononuclear cells, white matter, gray matter and meninges for CCR2, CXCR3, PD-1 and CD69. (X) Expression of ICOS, CD28, CD69, Ki-67, CD95, CD31, HLA-DR, CCR2, CXCR5, CD25, PD-1, CXCR3, RORγT, CCR4, CTLA-4, CCR7 and CD45RA on CD4+Foxp3+ T cells. (Y) Single cell RNaseq data from sorted CD4+CD3+CD8- cells from the human brain and PBMCs. Quality control filtering and gating based on expression markers identified 86 CD4+ T cells from the brain and 567 CD4+ T cells from the blood. tSNE dimensionality reduction is used for cluster display, with lineage marker expression indicated by color for CD3D, CD4, IL7R, IL2RA, FOXP3, CD44, SELL, AREG, CD69, KLRG1 and NR4A1. (Z) Differentially expressed genes were assessed for pathway by GSEA.
High dimensional analysis of CD4 T cells purified from the resected human brain allowed an analogous comparison. As with murine CD4 T cells, human CD4 T cells showed a distinct phenotype. Conventional brain CD4 T cells separated from their blood and meningeal counterparts (Figures 2E and 2F), with elevated expression of activation markers and the CD69 residency marker (Figures S2T–S2V). Similar results were observed with the brain regulatory T cell population (Figures S2W and S2X). Single-cell analysis of 653 blood and brain CD4+ T cells demonstrated distinct transcriptional patterns (Figures 2G and S2Y), with a common transcriptional pattern to that observed in the mouse (Figure 2H). Brain CD4+ T cells exhibited elevated expression of residency markers such as CD69 and chemotactic receptors, and pathway analysis consistent with adaption to the tissue environment (Figure S2Z). Together, these results indicate a conserved residency phenotype of brain CD4 T cells across mouse and human, a result inconsistent with blood contamination as the sole cellular source and potentially indicative of a physiological function.
CD4 T Cells Acquire the Residential Phenotype In Situ during Transient Brain Passage
Having characterized a brain-resident T cell population, we sought to uncover the ontogeny. Parabiosis studies allow the calculation of steady-state population exchange. Through parabiosis of Foxp3Thy1.1CD45.1 mice with Foxp3Thy1.1CD45.2 mice and high-dimensional flow cytometry analysis at five successive time points (Figures 3A and S3A–S3E), we could monitor the kinetics of blood and brain tissue normalization for both CD4 conventional T cells (Figure 3B) and Tregs (Figure 3C). Unlike the blood, where normalization occurred within days, exchange-rate calculations determined that CD69− CD4 T cells had a median brain dwell-time of ∼2–3 weeks, whereas the CD69+ counterpart had a median brain dwell-time of ∼7 weeks (Figure 3D). Phenotypic analysis of the incoming brain T cells, both conventional and regulatory, identified a distinct marker profile during the first 2 weeks of residency, which was succeeded by a host-like residency profile (Figures 3E and 3F). This effect could be clearly shown with CD69, where the incoming cells were initially CD69− and later converted to a CD69+ phenotype (Figures 3G and 3H). Kinetic analysis of further subsets of conventional and regulatory CD4 T cells demonstrated that the small naive population showed rapid exchange, consistent with transient entry, whereas the antigen-experienced population possessed longer dwell-times (Figure S3B). We therefore studied the population flow with statistical models based on continuous-time Markov chains (Figures S3F and S3G). The best fit model was consistent with an in situ acquisition of residency. Both naive and activated conventional CD4 T cells were modeled to cross from the blood into the brain, with ∼10-fold higher rates for activated conventional CD4 T cells (Figure 3I). Naive conventional CD4 T cells in the brain were highly transient. The activated population was likewise highly transient, however, with a small fraction transitioning to the CD69+ population. This population, by contrast, demonstrated a high degree of stability, with slow rates of death, egress or deconversion to the activated state (Figure 3I). Independently modeling the Treg population, comparable results were observed, however, the conversion rate of activated Tregs to CD69+ Tregs was ∼100-fold higher than was observed in the conventional pool (Figure 3J). This CD69+ population was modeled to very slowly die in situ or de-differentiate into the generic activated population. These results demonstrate the complexity and dynamism of CD4 T cell migration into, and differentiation within, the brain, with high separation of timescales between the involved processes.
Figure 3.

Brain-Resident CD4 T Cells Acquire a Residency Phenotype In Situ during a Prolonged Brain Transit
(A) Schematic of parabiosis experiments (n = 12,12,18,16,14).
(B and C) Curve of best fit for the origin of conventional (B) T cells or (C) Tregs showing CD69− and CD69+ in the blood and brain.
(D) Derived median dwell times.
(E and F) t-SNE of conventional (E) T cells and (F) Tregs built on CD62L, CD44, CD103, CD69, CD25, PD-1, Nrp1, ICOS, KLRG1, ST2, Ki67, Helios, T-bet, and CTLA4. FlowSOM clusters represented in color. Host and incoming cells were defined on CD45.1 versus CD45.2 expression, and are shown at the 2-, 4-, and 8-week time points.
(G and H) CD69 histograms for CD4 conventional (G) T cells and (H) Tregs.
(I and J) Population flow diagrams for conventional (I) T cells and (J) Tregs, in homeostatic state. Circle areas represent population frequencies, calculated independently for blood and brain. Small black circles represent cell death. The size of arrow ends is proportional to the rate of population flow. Numbers display the corresponding entry or exit rate, in events/1,000 cells/day. Numbers with asterisk denote rates with high estimation uncertainty. Population transitions with rates lower than 0.1/1,000 cells/day are not shown.
See also Figure S3.
Figure S3.

Parabiotic Analysis of Brain T Cell Kinetics, Related to Figure 3
Parabiosis surgery was performed on Foxp3Thy1.1CD45.1 and Foxp3Thy1.1CD45.2 mice, with analysis of brain and blood CD4 T cells at 1, 2, 4, 8 and 12 weeks (n = 12, 12, 18, 16, 14). Curves of best fit as well as the mean ± SEM for each subset are displayed at each time-point. (A) Curve of best fit for the origin of CD4+Foxp3- conventional T cells in the blood and brain. (B) Curve of best fit for the origin of CD4+Foxp3- conventional T cells in the blood and brain, divided into naive (CD62LhiCD44low) and antigen-experienced (CD62LlowCD44hi) subsets. (C) Curve of best fit for the origin of CD4+Foxp3+ regulatory T cells in the blood and brain, divided into CD69- and CD69+ subsets in the brain. (D) Curve of best fit for the origin of CD4+Foxp3+ regulatory T cells in the blood and brain, divided into naive (CD62LhiCD44low) and antigen-experienced (CD62LlowCD44hi) subsets. (E) Curve of best fit for the origin of CD4+Foxp3+ regulatory T cells in the blood and brain, divided into thymic-derived (Nrp1+) and peripherally-derived (Nrp1-) subsets. (F) Time evolution of average populations as predicted by a continuous-time Markov chain model fitted on the data from weeks 2 to 12, with homeostatic state identified from week 0. Experimental data (points) and calculations (solid lines) are shown in blue for host cells and in red for donor cells. Big points identify experimental population averages, whereas homeostatic states are displayed with black dashed lines. Model for CD4+Foxp3- conventional T cells and (G) CD4+Foxp3+ regulatory T cells. Tissue and subpopulation for each graph are shown in the top-left graph label.
Entry of CD4 T Cells into the Brain Is Gated by Peripheral Activation
The Markov chain modeling of brain CD4 T cell migration and differentiation predicts activated peripheral CD4 T cells to be the dominant entry population into the brain. Using Nur77-GFP mice, we can measure the degree of TCR engagement present on brain-resident CD4 T cells (Moran et al., 2011). Conventional CD4 T cells in the brain expressed the Nur77 reporter at levels lower than that of analogous cells in the blood, with the resident CD69+ population displaying even lower levels of TCR engagement (Figures 4A and 4B). This result is similar to that observed in tissue-resident CD8 T cells in other organs, where continuous antigen-engagement is not required for residency (Mackay et al., 2012). By contrast, CD69+ Tregs resident in the brain expressed much greater levels of the Nur77 reporter than their circulatory counterparts (Figures 4C and 4D). Based on these data and the Markov model, we postulate that conventional CD4+ T cells will be reliant on peripheral activation for entry, but will not require their antigen to be present in the brain. As a corollary, only Tregs will be dependent upon brain-expressed antigens. To test this, we assessed mice bearing a TCR transgene reactive against the neuronal antigen MOG 35-55 (2D2 transgenic) or the non-self-model antigen OVA 323-339 (OT-II transgenic). For both the 2D2 and OT-II transgenes, CD4 T cells expressing the transgene were largely in the naive state, based on antigenic exclusion (2D2) or absence (OT-II), whereas endogenous TCR rearrangements are enriched in the activated CD4 T cells (data not shown). Despite the neuronal reactivity of the 2D2 TCR transgene, conventional CD4 T cells expressing the Vα3.2Vβ11 2D2 transgene were greatly under-represented in the brain compared to the blood and periphery (Figure 4E). By contrast, Tregs expressing the Vα3.2Vβ11 2D2 transgene were enriched in the brain compared to the blood and periphery (Figure 4F). Phenotypic analysis of residency markers (e.g., CD69) demonstrated correlation of marker expression with population enrichment (Figure S4). Using the OT-II transgene, where the antigen is absent, conventional T cells expressing the transgene were again sharply under-represented in the brain (Figure 4G) and less likely to express residency markers (Figure S4). However, unlike the 2D2 transgenic, Tregs expressing the OT-II TCR transgene were undetectable in the brain (Figure 4H). When TCR expression was limited to the OT-II transgene by Rag deficiency, brain CD4 T cells, both conventional and Tregs, were essentially absent despite the abundant presence in the periphery. These results support the Markov-derived model, whereby peripheral activation is required for brain entry.
Figure 4.

Brain CD4 T Cells Are Licensed For Brain Entry by Peripheral Activation
(A–D) Perfused brains from Nur77-GFP reporter mice were assessed for Nur77 reporter expression, n = 8. (A) Representative histograms and (B) average expression for conventional CD4 T cells in the blood and brain. (C) Representative histograms and (D) average expression for Tregs in the blood and brain.
(E and F) Blood, perfused brains, spleen, and perfused lung from 2D2 transgenic mice and (right panel) wild-type controls were assessed for the frequency and numbers of transgene-expressing (Vα3.2+Vβ11+) and transgene-non-expressing (Vα3.2−Vβ11−) (E) conventional and (F) Tregs (n = 5,5).
(G and H) Blood, perfused brains, spleen, and perfused lung were collected from OT-II and (right panel) wild-type mice, on the Rag-sufficient or -deficient background, were assessed for the frequency and numbers of transgene-expressing (Vα2+Vβ5+) and transgene-non-expressing (Vα2−Vβ5−) (G) conventional and (H) Tregs (n = 5,5). p values represent one-way ANOVA with Tukey’s multiple comparison for cross-organ data and Sidak’s multiple comparison test for 2-way ANOVA for within brain comparison.
See also Figure S4.
Figure S4.

Phenotypic Profile of Brain-Resident TCR Transgenic CD4 T Cells, Related to Figure 4
CD4 T cells from perfused brains of TCR transgenic mice and wild-type controls (n = 5) were assessed by high parameter flow cytometry for CD62L, CD44, CD103, CD69, CD25, PD-1, Nrp1, ICOS, KLRG1, ST2, Ki67, Helios, T-bet, CTLA4. (A) tSNE of CD4+Foxp3- conventional 2D2 T cells, gated on CD4+Foxp3-CD3+CD8-CD45+ cells and subdivided into transgene-expressing (Vα3.2+Vβ11+) and transgene-non-expressing (Vα3.2-Vβ11-) cells. The tSNE was built on CD62L, CD44, CD103, CD69, CD25, PD-1, Nrp1, ICOS, KLRG1, ST2, Ki67, Helios, T-bet, CTLA4. FlowSOM clusters are illustrated in color and (B) quantified. (C) Heatmap of expression changes between transgene-expressing (Vα3.2+Vβ11+) and transgene-non-expressing (Vα3.2-Vβ11-) conventional 2D2 CD4+ T cells. (D) tSNE of CD4+Foxp3+ 2D2 regulatory T cells, gated on CD4+Foxp3+CD3+CD8-CD45+ cells and subdivided into transgene-expressing (Vα3.2+Vβ11+) and transgene-non-expressing (Vα3.2-Vβ11-) cells. The tSNE was built on CD62L, CD44, CD103, CD69, CD25, PD-1, Nrp1, ICOS, KLRG1, ST2, Ki67, Helios, T-bet, CTLA4. FlowSOM clusters are illustrated in color and (E) quantified. (F) Heatmap of expression changes between transgene-expressing (Vα2+Vβ5+) and transgene-non-expressing (Vα2-Vβ5-) regulatory T cells. (G) tSNE of CD4+Foxp3- conventional OT-II T cells, gated on CD4+Foxp3-CD3+CD8-CD45+ cells and subdivided into transgene-expressing (Vα2+Vβ5+) and transgene-non-expressing (Vα2-Vβ5-) cells. The tSNE was built on CD62L, CD44, CD103, CD69, CD25, PD-1, Nrp1, ICOS, KLRG1, ST2, Ki67, Helios, T-bet, CTLA4. FlowSOM clusters are illustrated in color and (H) quantified. (I) Heatmap of expression changes between transgene-expressing (Vα2+Vβ5+) and transgene-non-expressing (Vα2-Vβ5-) conventional OT-II CD4+ T cells.
The hypothesized requirement of conventional T cells on peripheral-restricted activation signals suggests that the gut microbiome has potential to modify the brain-resident population. We compared specific-pathogen-free (SPF)-housed mice with gnotobiotic (germ-free) mice or “dirty” wild-exposed mice to create continuum from no exposure to the external microbiome through to the possession of a diverse wild microbiome (that, although largely absent of pathogens, demonstrated an enriched diversity in microflora) (Figures S5A–S5C). This comparison, in effect, creates a microbial exposure gradient, which serves to activate peripheral T cells (Figures S5D–S5J). No difference was observed between germ-free and SPF mice in terms of CD4 T cell number in the brain or the conventional/Treg balance (Figures 5A and 5B). Wild microbiome mice, by contrast, demonstrated an increase in CD4 T cells driven by the expansion of the conventional population (Figure 5B). At a phenotypic level, the conventional CD4 T cell population displayed a progressive broadening of phenotypic markers from germ-free (where the brain population more closely resembled blood-based cells) to SPF to cohoused (Figures 5C and S5K–S5N). In contrast to the conventional population, the CD4 Treg population appeared relatively refractory to changes in the microbiome, with no major shifts in number and smaller alterations in phenotype (Figures 5D, S5L, S5O, and S5P). Parallel changes were observed through the depletion of microflora with broad-spectrum antibiotic treatment (Figures S5Q–S5Z). This microbiome data supports the Markov-derived model, whereby peripheral activation of conventional CD4 T cells is essential to license migration into the brain.
Figure S5.

Altered Activated Conventional Brain CD4 T Cells following Exposure to a Wild Microbiome or Broad-Spectrum Antibiotic Treatment, Related to Figure 5
(A) The microbial diversity of caecal contents in specific pathogen-free (SPF) and wild-cohoused (CoH) mice was compared through 16S rRNA analysis. When comparing the microbial communities from SPE and CoH mice groups, we detect differences in richness but not in the Shannon diversity index (p < 0.03 and p > 0.05, respectively, Wilcoxon test) in the CoH compared to SPF mice. 32% of the variation on the microbial composition can be explained by this grouping (adonis test, R2 = 0.31681, p = 0.022). (B) Principal coordinate analysis (PCoA) of the mice microbiota community variation based on Bacteria and Archaea genus-level Bray-Curtis dissimilarity distances revealed two different clusters. (C) Phylum and genus distribution barplots. Only the top 14 genera are displayed. The body of the boxplot represents the first and third quartiles of the distribution and the median line. The whiskers extend from the quartiles to the last data point within 1.5 × IQR, with outliers beyond. ‘uc_f’: unclassified genus of the family and ‘uc_o’: unclassified genus of the order. Differential abundance analysis at the phylum level identified Deferribacteres and Proteobacteria enriched and Tenericutes depleted in CoH mice (q-values < 0.1, Wilcoxon test). (D) Lymph nodes, spleen, blood, perfused brain and perfused lung were dissected from gnotobiotic, SPF and dirty cohoused mice (n = 6, 10, 12) and assessed by flow cytometry. Total leukocyte counts, and (E) absolute numbers of CD4 T cells or (F) Tregs. (G) Proportion of CD4 T cells within the CD45+ compartment. (H) Proportion of Tregs within the CD4+ compartment. (I) Proportion of naive or (J) activated cells within the conventional T cell compartment. (K) Dendrogram showing the relationship of conventional T cells and (L) Tregs across the samples, based on cross-entropy differences in tSNE for expression of CD62L, CD44, CD103, CD69, CD25, PD-1, Nrp1, ICOS, KLRG1, ST2, Ki67, Helios, T-bet, CTLA4. (M) Representative histograms shown for ICOS, PD-1, CTLA-4 and CD44 on conventional CD4 T cells. (N) Expression of assessed markers on conventional CD4 T cells. (O) Representative histograms shown for ICOS, PD-1, CTLA-4 and CD44 on Tregs. (P) Expression of assessed markers on Tregs. (Q) Wild-type mice were placed on broad-spectrum antibiotics for 2, 4 or 6 weeks (n = 5, 8, 6) and were compared to untreated control mice (n = 8) by high parameter flow cytometry of the perfused brain. CD4 T cells in perfused brain, as a percentage of CD45+ cells, and (R) absolute numbers of conventional and regulatory CD4 T cells in the brain. P value refers to comparison of conventional T cells. (S) tSNE of CD4+Foxp3- T cells gated on CD4+Foxp3-CD3+CD8-CD45+ cells and built on CD62L, CD44, CD103, CD69, CD25, PD-1, Nrp1, ICOS, KLRG1, ST2, Ki67, Helios, T-bet, CTLA4. P values represent cross-entropy comparison to control mice. FlowSOM clusters are illustrated in color and (T) quantified. (U) Expression heatmap and (V) marker expression rate for CD62L, CD44, CD103, CD69, CD25, PD-1, Nrp1, ICOS, KLRG1, ST2, Ki67, Helios, T-bet and CTLA4 levels in CD4+Foxp3- T cells. (W) tSNE of CD4+Foxp3+ T cells gated on CD4+Foxp3+CD3+CD8-CD45+ cells and built on CD62L, CD44, CD103, CD69, CD25, PD-1, Nrp1, ICOS, KLRG1, ST2, Ki67, Helios, T-bet, CTLA4. P values represent cross-entropy comparison to control mice. FlowSOM clusters are illustrated in color and (X) quantified. (Y) Expression heatmap and (Z) marker expression rate for CD62L, CD44, CD103, CD69, CD25, PD-1, Nrp1, ICOS, KLRG1, ST2, Ki67, Helios, T-bet and CTLA4 levels in CD4+Foxp3+ T cells.
Figure 5.

Brain Conventional CD4 T Cells Are Expanded by Exposure to the Microbiome
(A and B) Perfused mouse brains were compared to blood by high-dimensional flow cytometry from gnotobiotic, SPF, and dirty co-housed mice (n = 6,10,12). CD4 T cells in perfused brain as (A) a percentage of CD45+ cells and (B) absolute numbers of CD4 T cells in the brain.
(C and D) t-SNE of conventional (C) T cells and (D) Tregs built on CD62L, CD44, CD103, CD69, CD25, PD-1, Nrp1, ICOS, KLRG1, ST2, Ki67, Helios, T-bet, and CTLA4, with quantified FlowSOM clusters. p values represent cross-entropy comparison to SPF mice.
See also Figure S5.
Microglia Require CD4 T Cells for Maturation and the Acquisition of Synaptic Pruning Function
To study the function of CD4 T cells in the brain, we turned to the MHC II knockout (KO) mouse. These mice demonstrate a deficiency of CD4 T cells in both the periphery and the brain (Figure S6A), consistent with the well-characterized blockade in thymic development of this lineage. As the interface between the neurological and immunological systems, we investigated the impact of CD4 T cell deficiency on microglia composition. We profiled 11,681 CD11b+ cells from adult wild-type and MHC II-deficient murine brains by single-cell sequencing. Initial clustering identified 11 distinct populations (Figure 6A), which could be identified as eight contiguous microglial clusters and distinct granulocyte/monocyte/macrophage populations based on key lineage marker expression (Figure S6B). Strikingly, visualization of wild-type and MHC II KO microglia displayed a distinct segregation in phenotype (Figure 6B), with 72% of microglia from MHC II KO mice being present within microglia cluster 3, a minor population in the wild-type mouse (Figure 6C).
Figure S6.

Brain T Cells Alter Gene Expression in Microglia, Related to Figure 6
(A) Graph of CD4+ T cells in wild-type and MHC II KO mice in the spleen and perfused brain, as a percentage of CD45+ cells (n = 4). (B) Single cell RNaseq data from CD11b+ cells purified from wild-type mice and MHC II-deficient mice were assessed for gene-expression. tSNE dimensionality reduction is used for cluster display, with lineage marker expression indicated by color for Cx3cr1, P2ry12, Tmem119, ApoE, S100a9, Mrc1, Cd74 and S100a4. (C) Gene expression from isolated microglia from adult male wild-type and MHC class II KO mice (n = 4,4) were measured by qPCR. The expression of the indicated genes, selected from the differentially-expressed single cell sequencing dataset (Ccr6 upregulated in MHC II KO microglia, other genes downregulated in MHC II KO microglia) was calculated relative to Ppia rRNA. P values were obtained by two-tailed Mann-Whitney U test. (D) Single cell RNaseq data was generated on microglia collected from wild-type mice and MHC II-deficient mice. Volcano plots of wild-type versus MHC II-deficient clusters 1, cluster 2, cluster 3, cluster 4, cluster 5, cluster 6, cluster 7 and cluster 8 microglia, perivascular macrophages, macrophages, monocytes and granulocytes. Labeled genes with a differential expression of more than 1-log fold change (p < 0.05) are shown in black. (E) Microglia along the trajectory are divided into five groups based on expression of highly variable genes in wild-type and MHC II KO microglia. Cells are colored according to the facet in which they reside. (F) Pseudotime kinetics of genes identified as differentially expressed between wild-type and MHC II KO microglia, colored according to pseudotime trajectory. (G) Single cell RNaseq data from CD11b+ cells purified from wild-type mice and MHC II-deficient mice were assessed for gene-expression. Signature genes previously identified as differentially expressed between yolk sac-derived microglia and peripheral macrophage-derived microglia (Cronk et al., 2018) were assessed. Expression of Sall1, the transcriptional regulator defining authentic microglia differentiation, distinct from macrophage-derived microglia. (left) distribution of reads in normalized UMI counts, (right) marker expression indicated by color on tSNE dimensionality reduction. (H) Average expression of genes constituting the transcriptional signature of genes upregulated in macrophage-derived microglia compared to yolk sac-derived microglia: Abca1, Arhgef10l, Car9, Cln6, Cxcr2, Dclre1c, Dnajb14, Fgf2, Flt3, Fmd6, Fzd7, Galc, Gk, Hoxb4, Ifnar1, Jag1, Kcnn4, Lpar6, Ltbp3, Nrp1, Pcgf2, Pgap1, Pi4k2b, Plekhg5, Pmepa1, Qpct, Rap2a, Rgs1, R1pr1, Sesn1, Sestd1, Sgsh, Slc26a11, Slc44a1, Stab1, Stbd1, Tlr8, Tmem176b, Tpst1, Txndc16, Xylt2, Zdhhc23, Znrf3. (I) Microglia were sorted from control wild-type mice, or wild-type mice treated with anti-CD4 depleting antibody from day 5 or week 3 of age until 7 weeks of age (n = 15,9,9). Quantification of the CD45hiCD11b+Gr1- myeloid compartment of the brain following anti-CD4 depletion, demonstrating no numerical loss of macrophages. (J) Gene expression from isolated microglia was measured by qPCR. The expression of the indicated genes, selected from the downregulated-genes in the single cell sequencing dataset, was calculated relative to Ppia rRNA. P values were obtained by two-tailed Mann-Whitney U test. (K) Brain slices were cultured from neonatal cerebellum and left untreated or seeded with sort-purified CD4+ or CD8+ T cells (n = 2,3,2). Gene expression from isolated microglia was measured by qPCR. The expression of the indicated genes, selected from the downregulated-genes in the single cell sequencing dataset, was calculated relative to Ppia rRNA. P values were obtained by two-tailed Mann-Whitney U test. (L) Mice were i.v. injected with anti-CD45-PE and perfused, following which brains were dissected and analyzed by flow cytometry for the proportion of intravascular CD8 T cells (n = 6). (M) Proportional representation of CD8 T cells among CD45+ leukocytes in mouse (n = 6). (N) Numbers of CD8 T cells per gram in mouse blood and brain (n = 6). (O) CD45.1 and CD45.2 mice were parabiosed and assessed for brain and blood CD8 infiltrate at 2, 4, 8 and 12 weeks post-surgery (n = 12, 12, 18, 16, 14). Curve of best fit for the origin of CD8+ T cells in the blood and brain. (P) Mouse blood and perfused brain were assessed by flow cytometry (n = 6). tSNE of CD8+CD3+CD4-CD45+ cells built on CD62L, CD44, CD103, CD69, CD25, PD-1, Nrp1, ICOS, KLRG1, ST2, Ki67, Helios, T-bet, CTLA4. Colors indicate FlowSOM clusters (Q) which are quantified. (R) Heatmap of protein expression in mouse CD8 T cells. (S) Unaffected human brain tissues removed during brain surgery were compared to peripheral blood mononuclear cells by high-dimensional flow cytometry (n = 8,4), with CD8 T cells quantified as a fraction of CD45+ leukocytes and (T) in absolute number per gram of tissue. (U) Representative tSNE of human CD8+ CD3+CD4-CD14- cells built on ICOS, CD28, CD69, Ki-67, CD95, CD31, HLA-DR, CCR2, CXCR5, CD25, PD-1, CXCR3, RORγT, CCR4, CTLA-4, CCR7 and CD45RA. Colors indicate FlowSOM clusters (V) which are quantified. (W) Heatmap of protein expression in human CD8 T cells. (X) Isolated microglia were cultured with control conditioned media, conventional T cell conditioned media, Treg conditioned media, IL-4, IFN-γ, TGF-β and Amphiregulin (n = 2/group). Gene expression from isolated microglia was measured by qPCR. The expression of the indicated genes, selected from the downregulated-genes in the single cell sequencing dataset, was calculated relative to Ppia rRNA. P values were obtained by two-tailed Mann-Whitney U test. (Y) Microglia were sorted from TCRα knockout mice or heterozygous littermate controls (n = 7,8). Expression of signature genes (downregulated in MHC II KO microglia) were assessed by qPCR, with individual data-points reflecting the average of quadruplicate technical repeats in each of 19 genes across 7-8 biological replicates. (Z) Gene expression from isolated microglia was measured by qPCR. The expression of the indicated genes, selected from the downregulated-genes in the single cell sequencing dataset, was calculated relative to Ppia rRNA.
Figure 6.

CD4 T Cell Deficiency Traps Microglia in a Fetal-like Transcriptional State
10× single-cell sequencing was performed on 9,404 CD11b+ cells from the wild-type adult mouse brain and 2,278 CD11b+ cells from the MHC II KO adult mouse brain.
(A) t-SNE visualizing cell clusters built on the combined population.
(B and C) t-SNE visualizing cells originating from the (B) wild-type and MHC II KO condition with (C) relative proportions.
(D) Volcano plot of differential expression between cluster 3 microglia and non-cluster 3 microglia in the wild-type mouse.
(E and F) Volcano plot of differential expression between wild-type microglia and microglia from MHC II KO mice (E). High fold-change genes are labeled. Indicated cut-offs (signature genes) are used for (F) pathway analysis by GSEA.
(G) Fold-change of all expressed genes between wild-type and MHC II KO mice plotted against the fold-change of the same gene set in a reference dataset comparing healthy and damage-associated microglia (Keren-Shaul et al., 2017).
(H) Differentially expressed genes between wild-type and MHC II KO microglia plotted against a reference dataset of microglia spanning development, healthy adult status, aging, and neuroinjury (Hammond et al., 2019). Left: comparative expression in total microglia at each stage. Right: gene-level expression changes between the pre-natal and early post-natal period, paired t test.
(I) BubbleGUM analysis using gene sets from differential expression in wild-type versus MHC II KO microglia (this manuscript) and E14.5 versus day 100 microglia (Hammond et al., 2019). Red for wild-type and day 100 microglia, blue for MHC II KO and E14.5 microglia.
(J) The combined wild-type and MHC II KO microglia population were assessed for pseudotime trajectory, plotted separately for each genotype and showing branch points.
(K) Brain CD4 T cell numbers were assessed in control wild-type mice, or wild-type mice treated with anti-CD4 depleting antibody from day 5 or week 3 of age (n = 15,14,13).
(L) Microglia were sorted from control wild-type mice or anti-CD4 depleted mice. Expression of signature genes were assessed by qPCR, with data points reflecting 16 genes in 9–10 biological replicates.
(M) Neonatal brain slices were left untreated or exposed to CD4 or CD8 T cells for 14 days prior to microglia sorting. Expression of signature genes was assessed by qPCR, with data points reflecting 16 genes in 2–3 biological replicates.
(N) Neonatal microglia were cultured with control media, media from stimulated conventional or Tregs, or selected cytokines. Expression of signature genes were assessed by qPCR, with data points reflecting 10 genes in 2 biological replicates.
See also Figure S6.
The transcriptional profile of cluster 3 microglia is consistent with a remnant fetal-type immature microglial population. When comparing wild-type cluster 3 microglia to the other wild-type microglia (Figure 6D), the population is characterized by a failure to turn on expression of the transcription factors AP-1, Klf4, and Egr1, key transcription factors in the maturation of prenatal microglia to adult microglia (Holtman et al., 2017). Comparative transcriptional analysis of microglia from MHC II KO mice compared to wild-type mice identified 87 genes with at least 1.5-fold lower expression (Figures 6E and S6C). The most dramatically decreased genes were enriched for development-associated genes (Figure 6F), suggesting a failure to initiate a differentiation program. In particular, the Fos and Jun transcription factors, the signature of mature microglia (Matcovitch-Natan et al., 2016), were reduced in microglia from MHC II KO mice (Figure 6E). Similar results were observed when microglia from wild-type and MHC II KO mice were compared at the microglial cluster level (Figure S6D). Differential expression was not correlated with transcriptional changes associated with disease-associated microglia (Keren-Shaul et al., 2017) (Figure 6G), indicating the developmental, rather than inflammatory, nature of the transcriptional module.
To test whether the transcriptional signature of CD4 T cell-deficient microglia was associated with an immature population, we charted the relative expression of the downregulated genes across microglia development, using a reference single-cell microglia atlas covering pre- and post-natal development, old age, and injury (Hammond et al., 2019). The downregulated genes in microglia from MHC II KO mice were correspondingly low in pre-natal microglia, and showed signs of induction in the post-natal microglia before reaching normal expression in the juvenile adult (Figure 6H). Using a reciprocal BubbleMap analysis of differential expression between wild-type versus KO microglia, or embryonic versus adult microglia, significant concordance was observed (Figure 6I), demonstrating the embryonic-like transcriptional state of microglia from MHC class II-deficient mice. Pseudotime trajectory analysis identified MHC II KO microglia as existing on the same transcriptional trajectory profiles as wild-type microglia (Figures 6J, S6E, and S6F). MHC II KO microglia, however, were clustered at one end of the trajectory, consistent with incomplete progression. Furthermore, no expression changes were observed in the Sall1 transcriptional regulator that defines yolk sac-derived microglia, or in genes previously identified as differentially expressed in macrophage-derived microglia (Figures S6G and S6H). Together, these results suggest that the final stage of the normal microglia differentiation pathway is defective in MHC II KO mice.
To independently test the hypothesis of CD4 T cell-mediated maturation, we used an additional four systems. First, we removed CD4 T cells from wild-type mice using anti-CD4 depleting antibodies (Figure 6K). Elimination of this population at day 5 post-birth prevented the upregulation of the associated maturation signature (Figures 6L, S6I, and S6J). Delaying elimination of CD4 T cells until 3 weeks post-birth negated this effect (Figure 6L), consistent with a maturation switch. Second, we modeled the same effect in vitro, using a cultured brain slice system from neonatal cerebellum. Embryonic microglia in the slice upregulated the maturation gene signature when seeded with CD4 T cells (Figures 6M and S6K). Notably, despite the presence of an analogous CD8 T cell population (Figures S6L–S6W), no effect was observed when seeding with CD8 T cells (Figure 6M). Third, using a microglial culture system, the maturational switch was observed upon the addition of supernatant from stimulated CD4 T cells, in particular conventional CD4 T cells (Figures 6N and S6X), although most signature genes were non-responsive to the individual cytokines identified as expressed by brain T cells (Figure S2C). Finally, we utilized an alternative genetic model, comparing TCRα KO mice to heterozygous littermates. While this system includes its own caveats, with deficiencies in CD8 T cells as well as CD4 T cells, sorted microglia from these mice showed a similar significant reduction in the transcriptional signature (Figures S6Y and S6Z). Together, these results are consistent with a model where immature microglia require the entry of CD4 T cells into the brain in order to fully mature into the adult state.
We functionally investigated the impact of deficiency in CD4 T cells on microglia using imaging-based approaches. The number and cellular density of microglia was intact in MHC II KO mice throughout development (Figures S7A and S7B). Likewise the early phagocytic functions of immature microglia, quantified through phagocytic bud formation, appeared intact (Figures S7C and S7D). Despite the absence of CD4 T cells, immature microglia in MHC II KO mice lost their amoeboid morphology and at least partially developed a dendritic morphology, albeit one with shorter process extensions and earlier branching (Figures S7E–S7H). This phenotype notably corresponds to the failure to adequately upregulate the “cellular processes” transcriptional module (Figure 6F). Although developmental functions of microglia from MHC II KO mice were seemingly intact, the key function of mature microglia, synaptic pruning, was disturbed. Synaptic analysis of cortical pyramidal neurons revealed an increase in synaptic density (Figures 7A and 7B), with the increase driven by a retention of immature long thin spines (Figure 7C). Together with the transcriptional analysis, where key synaptic pruning genes such as AP-1, Egr1, and Lamp1 (Holtman et al., 2017; Vasek et al., 2016) failed to be switched on in microglia from MHC II KO mice (Figure 6E), these results implicate CD4 T cells in the maturation of microglia morphology and the acquisition of mature synaptic function capacity.
Figure S7.

Microglial Density Morphology Diverges during Development between Wild-Type and MHC II-Deficient Mice, Related to Figure 7
Microglia structure and morphology were assessed in the brain of wild-type and MHC II-deficient mice at post-natal day 0 (striatum), day 7 and 15 weeks of age. (A) Representative 20 × view of confocal images of Iba1 immunostaining showing microglial density; scale = 50μm. (B) Quantification of microglia density at post-natal day 0, day 7 and 15 weeks (n = 4,2,2,5,4,4). (C) Representative 20 × view of confocal images Iba1 labeling (red) from the post-natal day 0 (striatum) and day 7 (cortex). Scale = 50μm, arrows indicate phagocytic microglia containing engulfed DAPI+ nucleus. (D) Quantification of microglia exhibiting phagocytotic buds (n = 4,2,2,5). (E) Representative 40 × images showing microglia morphology, process extensions and ramification at 15 weeks; scale = 50μm. (F) Quantification of the proportion of microglia with a maximum enclosing radius out to varying distances. Number of microglia analyzed: wild-type = 37; MHC II-deficient mice = 44 (n = 4,4). (G) Quantification of the total number of process intersections in microglia. (H) Sholl analysis of microglia process intersections per radii (spaced with the interval of 10 μm) from the soma. Dots represent each microglia, n = 8-10 microglia/mouse (n = 4,4). Fligner-Killeen non-parametric test for difference in variance. (I) MHC II-deficient mice and wild-type siblings were assessed for behavioral abnormalities. Time spent on the rod, average of 4 repeated tests of 300 s (n = 24,25). (J) Sociability test trials to monitor the interaction with a stranger mouse (S1) compared to a empty chamber (E1) (K) and the social preference for a new stranger (S2), with interaction with repeated stranger (S1) and new stranger (S2). (n = 24,23). (L) Freezing behavior over time during context acquisition conditioning (n = 13,14). (M) Marble burying test (n = 9,14). (N) Wild-type mice were housed under standard SPF conditions, or placed under behavioral modification in the form of isolated or environmental enrichment (n = 18, 15, 10). Mice were compared by high parameter flow cytometry of the blood and perfused brain. CD4 T cells as absolute numbers of conventional cells and Tregs in the brain. P value refers to comparison of conventional T cells. (O) Proportion of Foxp3+ cells within the CD4 T cell population in blood and brain. (P) tSNE of CD4+Foxp3- T cells gated on CD4+Foxp3-CD3+CD8-CD45+ cells or (Q) CD4+Foxp3+CD3+CD8-CD45+ cells and built on CD62L, CD44, CD103, CD69, CD25, PD-1, Nrp1, ICOS, KLRG1, ST2, Ki67, Helios, T-bet, CTLA4. P values represent cross-entropy comparison to control mice. FlowSOM clusters are illustrated in color. (R) Proportion of naive (top) and activated (bottom) cells within the conventional and (S) Treg populations in the blood and brain. Mean ± SEM.
Figure 7.

Altered Neuronal Synapses and Behavior in MHC II KO
(A) Wild-type and MHC II KO mice were assessed for neuronal synapses in cortical pyramidal neurons. Representative dendritic segments; scale, 5 μm.
(B and C) Spine density in pyramidal neurons from (B) wild-type and MHC II KO mice, and (C) relative density of spine types (n = 4,6 mice, with 900–1,000 spines per condition).
(D) Comparative change in spine density in MHC II KO mice (this study) versus disease models of Down syndrome (Belichenko et al., 2007), autism spectrum disorder (Zhou et al., 2016), schizophrenia (Zhou et al., 2016), Fragile X syndrome (FXS) (Liu et al., 2011), and Rett syndrome (Jiang et al., 2013).
(E and F) Behavioral assessment of wild-type and MHC II KO mice. (E) Open field total distance moved and (F) time in the center (n = 23,24).
(G) Latency to enter light zones in light-dark test (n = 22,20).
(H) Time immobile during forced swim test (n = 12,14).
(I) Nest building scoring (n = 35,21).
(J) Contextual discrimination during generalization test (n = 13,14).
(K–M) Spatial learning in the Morris water maze. (K) Path length to finding the hidden platform (n = 24,24), (L) probe tests after 5 days and (M) 10 days (n = 21,17). Mean ± SEM.
See also Figure S7.
The magnitude of spine density change observed in MHC II-deficient mice was similar in scale to changes observed in multiple neuropathologies, from Down syndrome to Rett syndrome (Figure 7D). Correspondingly, MHC II KO mice exhibited multiple abnormalities in their behavior. In the exploratory open field test, the MHC II KO mice showed reduced mobility and spent more time in the corners of the arena (Figures 7E and 7F), whereas no motor defects were detected on the rotarod (Figure S7I). Increased anxiety also resulted in preference for the dark compartment in the light-dark test (Figure 7G). The MHC II KO mice demonstrated reduced motivation and depression-like behavior in the forced swim test (Figure 7H) and in the nest building test (Figure 7I). Contextual learning in the fear conditioning (Figure 7J) and spatial learning in the Morris water maze (Figures 7K–7M) was also significantly impaired in the MHC II KO mice, although both groups maintained the ability to learn over time. Absence of CD4 T cells did not affect social behaviors or marble burying behavior (Figures S7J–S7M). Together, these results demonstrated that CD4 T cells play an important role in brain development, influencing anxiety control, motivation, and learning in adult mice. Intriguingly, bidirectional effects may be at play, with behavioral modification via environmental manipulation also influencing the number and phenotype of brain CD4 T cells (Figure S7N–S7S).
Discussion
Although not widely accepted in the field, there are a growing number of studies suggesting that the immune system impacts on behavior. Several studies have suggested that KO mice with loss of adaptive immune populations show behavioral abnormalities, including Rag-deficient (Cushman et al., 2003; Fan et al., 2019; Rattazzi et al., 2013, 2015), severe combined immunodeficiency (SCID) (Kipnis et al., 2004; Ziv et al., 2006), MHCI-deficient (Lee et al., 2014), and MHCII-deficient mice (Radjavi et al., 2014). These effects have, however, been disputed (Brachman et al., 2015), and the mechanistic link is unclear. With adaptive immunity often being thought to be restricted to the meninges in the healthy brain, research has focused on identifying soluble factors that count account for the effects. Indeed, IFNα (Blank et al., 2016), IFNγ (Dulken et al., 2019; Filiano et al., 2016), tumor necrosis factor alpha (TNF-α) (Stellwagen and Malenka, 2006), interleukin (IL)-2 (Petitto et al., 1999), IL-4 (Derecki et al., 2010; Kawahara et al., 2012), IL-13 (Kawahara et al., 2012), and IL-17 (Choi et al., 2016) have all been demonstrated to alter behaviors of healthy mice. A soluble mediator model is consistent with our data, where conditioned media from T cells reproduced a sizeable fraction of the maturation transcriptional signature. A more problematic aspect is that of range, where the segregated model has depended on the reverse fluid flow. Although an exchange of fluids between the cerebrospinal fluid and interstitial fluid of the brain may provide a sufficient delivery mechanism (Da Mesquita et al., 2018), our findings of CD4 T cells in close proximity with microglia allow for additional short-range delivery.
Although the number of CD4 T cells in the brain is low, T cells are highly motile, spending only a few minutes scanning each interaction partner (Jansson, 2010). During Toxoplasma gondii infection, CD8 T cells in the brain undergo a unique Lévy walk pattern, with a tissue motility speed of ∼5–10 μm/min (Harris et al., 2012). Extrapolation from CD8 T cells to CD4 T cells, coupled with a dwell time of up to 6 weeks, is sufficient to allow even the small number of CD4 T cells in the brain to come into close proximity with each of the ∼106 microglia in a mouse brain. The multitude of available molecular mediators for T cell to microglia crosstalk potentially allow for the delivery of complex peripheral signals with highly diverse neurological outcomes. The concept of brain CD4 T cells as a conduit of complex peripheral inputs provides a potential mechanistic explanation for the problematic association between gut microbiome and behavior (Hsiao et al., 2013; Kim et al., 2017; Sharon et al., 2019). The gut microbiome alters microglial phenotypes (Dodiya et al., 2019; Thion et al., 2018), including microglia morphology and process length and complexity (Erny et al., 2015). At a transcriptional level, germ-free mice possess microglia that have only partially matured into the adult state (Matcovitch-Natan et al., 2016). And yet, how can the gut microbiome affect a distant sterile site that is supposedly secluded from peripheral influences? Microbial metabolites and small molecules have been proposed as the mediators (Dodiya et al., 2019), despite the obvious problems of dilution and the blood-brain-barrier in direct transmission. The immune system is an attractive alternative mediator of the microbial effect, with a theoretical link between gut and brain (Kipnis, 2018). The phenotypic modification we observed of brain conventional CD4 T cells by gut microbiome provides a direct information conduit, encoded as cellular phenotype, from the gut to the brain. This mechanistic missing link provides support to controversial associations between gut microbiome and human neurological disorders and mental health (Kang et al., 2017; Sharon et al., 2016; Valles-Colomer et al., 2019), although a reverse causation (of behavioral changes influencing microbiome) has not yet been ruled out and should perhaps remain the leading hypothesis to explain the associations.
Microglia undergo a stepwise transcriptional program, starting from the embryonic stage and progressively maturing toward the differentiated adult microglia. Each stage of this program is coordinated by distinct regulatory circuits, providing the cellular machinery required for temporally restricted functions (Matcovitch-Natan et al., 2016). The late post-natal stage, around day 14 in mice, is accompanied by the growth of intense ramifications in microglia. The growth and branching of microglial processes allows microglia to initiate synaptic pruning functions, a necessary process for effective neural circuit formation (Paolicelli et al., 2011). We postulate a model whereby the first wave of CD4 T cell migration into the brain results in interaction with immature microglia and promotes the post-natal transcriptional and morphological maturation program. Although a truncated version of this program can occur in the absence of CD4 T cells, it leaves the microglia suspended between a fetal and adult state. This leaves a key function of mature microglia, synaptic pruning, disturbed in the absence of CD4 T cells. Because even minor changes in synaptic density accompany neuropathological states (Belichenko et al., 2007; Jiang et al., 2013; Liu et al., 2014; Zhou et al., 2016), this effect can explain the altered behavioral measurements obtained here and elsewhere. We would, however, caution against excessive attribution of the immune system in brain biology. Although our results provide a pathway from T cells to behavioral changes, via microglia differentiation, large defects in the immune system are required to pick up relatively subtle shifts in behavior. Indeed, a recent study surprisingly characterized a novel mouse strain that is healthy and neurologically normal despite entirely lacking microglia (Rojo et al., 2019). Although behavioral studies were not performed on these mice, it does suggest that the immune systems are responsible for subtle modifications of the brain, rather than being central to brain function.
A stepwise differential program for microglia implies the existence of a temporally regulated series of molecular cues. For the first stage of microglia differentiation, from the yolk sac precursor, the molecular cue spurring differentiation is entry into the brain. The development of a fully matured brain could, in principle, be achieved through self-perpetuating differentiation circuits, where the progressive differentiation of neurons drives the sequential differentiation of glia, in turn propagating the neuronal maturation process until steady state has been reached. For example, it has been proposed that the production of transforming growth factor β (TGF-β) by mature neurons and IL-33 by astrocytes could trigger the post-natal maturation of microglia (Attaai et al., 2018; Vainchtein et al., 2018). The identification of a role for brain CD4 T cells in the final stages of microglia maturation demonstrate that microglia differentiation is not fully autonomous, and relies, at least in the final stages, on externally provided developmental cues. These data suggest that the brain uses the initial influx of CD4 T cells as an indicator that the appropriate developmental stage has been reached to switch to the mature adult-like state.
If T cells participate in normal brain development in mice, is there evidence that the same is true in humans? It is plausible that the function identified here in mice has been substituted in humans by T cell-independent processes, during the ∼33 million years of evolutionary divergence. Enormous changes in brain development have self-evidently occurred during this period. However, as has been previously noted (Kipnis et al., 2012), there is circumstantial evidence supporting a parallel between mouse and human. Children with chemotherapy for CNS cancers have a higher risk for cognitive impairment and memory defects (Ellenberg et al., 2009), a process known as “chemobrain.” This has been attributed to direct effects on the brain, however, part of this effect may be mediated by alteration of the brain T cell compartment. T cell- and B cell-deficient SCID children consistently show reduced neurocognitive development (Titman et al., 2008), a process that could be iatrogenic, but may be due to defective T cell production. With the link between the immune system and brain development in mice, it is notable that the prolonged gestation period of humans, and the post-gestation provision of maternal antibodies in milk, permits the relatively late maturation of the adaptive immune system (Olin et al., 2018). The possibility that a delay in immune system maturation contributes to the expansion of the neurodevelopment stage in humans leads to the tantalizing implication of evolutionary interplay between the development of the immune system and the brain.
STAR★Methods
Key Resources Table
| REAGENT or RESOURCE | SOURCE | IDENTIFIER |
|---|---|---|
| Antibodies | ||
| Anti-CD4 (clone GK1.5) | BioXCell | Cat#BE0003-1 |
| Anti-CD45 (30-F11), PE | eBioscience | Cat#12-0451-82 |
| DyLight 649 labeled Lycopersicon Esculentum (Tomato) Lectin | Vector labs | Cat#DL-1178 |
| Anti-mouse CD4 Antibody | Biolegend | Cat#100506 |
| Anti-human/mouse FoxP3 Antibody | R&D systems | Cat#MAB8214 |
| Anti-Iba1 | ©FUJIFILM Wako Pure Chemical Corporation | Cat#019-19741 |
| Anti-Glial Fibrillary Acidic Protein (GFAP) | DAKO | Cat#Z033429-2 |
| Anti-CD31 Monoclonal Antibody (2H8) | Invitrogen | Cat#MA3105 |
| Anti-Laminin α4 | R&D systems | Cat#AF3837 |
| Anti-Laminin α1 | R&D systems | Cat#MAB4656 |
| DAPI | Life Technologies | Cat#D1306 |
| anti-CD3e (145-2C11) | eBioscience | Cat#16-0031-85 |
| anti-CD28 (37.51) | eBioscience | Cat#16-0281-85 |
| anti-IFNγ (XMG1.2) | BioXcell | Cat#BE0055 |
| 2.4G2 | ATCC® | Cat#HB197 |
| Anti-CD8α Monoclonal Antibody (53-6.7), APC-eFluor 780 | eBioscience | Cat#47-0081-82 |
| Anti-CD45 (Leukocyte Common Antigen, Ly-5), clone 30-F11 Ms BUV395 | BD Biosciences | Cat#564279 |
| Anti-mouse CD4 Antibody Brilliant Violet 510 | BioLegend | Cat#100449 |
| Zombie UV Fixable Viability Kit | BioLegend | Cat#423108 |
| Anti-CD3e Monoclonal Antibody (145-2C11), PE-Cyanine7 | eBioscience | Cat#25-0031-82 |
| Anti-CD69 Monoclonal Antibody (H1.2F3), APC | eBioscience | Cat#17-0691-82 |
| Anti-CD11b Monoclonal Antibody (M1/70), PerCP-Cyanine5.5 | eBioscience | Cat#45-0112-82 |
| Anti-mouse CX3CR1 Antibody, Alexa Fluor® 488 | BioLegend | Cat#149022 |
| Anti-Ly-6G / Ly-6C (Gr-1) Monoclonal Antibody (RB6-8C5), Alexa Fluor 700 | eBioscience | Cat#56-5931-82 |
| Anti-CD19 Monoclonal Antibody (eBio1D3 (1D3)), eFluor 450 | eBioscience | Cat#48-0193-82 |
| Anti-mouse CD196 (CCR6) Antibody, PE/Dazzle 594 | BioLegend | Cat#129822 |
| Fixable Viability Dye eFluor 780 | eBioscience | Cat#65-0865-18 |
| Anti-CD45 Monoclonal Antibody (30-F11), APC | eBioscience | Cat#17-0451-82 |
| Ly-6G/Ly-6C Monoclonal Antibody (RB6-8C5), APC-eFluor 780 | eBioscience | Cat#47-5931-82 |
| CD19 Monoclonal Antibody (eBio1D3 (1D3)), APC-eFluor 780 | eBioscience | Cat#47-0193-82 |
| Streptavidin Brilliant Blue 790-P | BD Biosciences | Cat#624296 |
| Biotin anti-human CD69 Antibody (FN50) | BioLegend | Cat#310924 |
| CD3 Antibody, anti-human, PerCP-Vio® 700, REAfinity (REA613) | Miltenyi Biotec | Cat#130-113-141 |
| Brilliant Blue 660-P2 anti-human CD28 (CD28.2) | BD Biosciences | Cat#624295 |
| Brillliant Blue 630-P2 anti-human ICOS (DX29) | BD Biosciences | custom |
| Anti-CD45RA Monoclonal Antibody (HI100), FITC, eBioscience | eBioscience | Cat#11-0458-42 |
| Brilliant Violet 785 anti-human CD183 (CXCR3) Antibody (G025H7) | BioLegend | Cat#353738 |
| BV750 Mouse anti-human CD279 (PD-1) Clone EH12.1 | BD Biosciences | Cat#747446 |
| Brilliant Violet 711 anti-human CD25 Antibody (BC96) | BioLegend | Cat#302636 |
| BD OptiBuild BV650 rat anti-human CXCR5 (CD185) (RF8B2) | BD Biosciences | Cat#740528 |
| Brilliant Violet 605 anti-human CD192 (CCR2) Antibody (K036C2) | BioLegend | Cat#357214 |
| Brilliant Violet 570 anti-human HLA-DR Antibody (L243) | BioLegend | Cat#307638 |
| BD Horizon BV480 mouse anti-human CD31 (WM59) | BD Biosciences | Cat#566144 |
| Brilliant Violet 421 anti-human CD127 (IL-7Rα) Antibody (A019D5) | BioLegend | Cat#351310 |
| BD Horizon BUV805 mouse anti-human CD8 (SK1) | BD Biosciences | Cat#564912 |
| BD Horizon BUV737 Mouse anti-human CD95 (DX2) | BD Biosciences | Cat#564710 |
| BUV615 anti-Ki67 (B56) | BD Biosciences | Cat#624279 |
| BD Horizon BUV496 mouse anti-human CD4 (SK3) | BD Biosciences | Cat#564651 |
| BD Horizon BUV395 rat anti-mouse CD4 (GK1.5) | BD Biosciences | Cat#565974 |
| eBioscience Fixable Viability Dye eFluor 780 | eBioscience | Cat#65-0865-18 |
| Anti-CD11b Monoclonal Antibody (M1/70), APC-eFluor 780, eBioscience | eBioscience | Cat#47-0112-82 |
| Alexa Fluor® 647 anti-human FOXP3 Antibody (206D) | BioLegend | Cat#320114 |
| Anti-CD197 (CCR7) Monoclonal Antibody (3D12), PE-Cyanine7, eBioscience | eBioscience | Cat#25-1979-42 |
| Anti-CD14 Monoclonal Antibody (TuK4), PE-Cyanine5.5 | Invitrogen | Cat#MHCD1418 |
| BD PharMingen PE-Cy5 mouse anti-human CD152 (BNI3) | BD Biosciences | Cat#555854 |
| PE/Dazzle 594 anti-human CD194 (CCR4) Antibody (L291H4) | BioLegend | Cat#359420 |
| BD PharMingen PE Mouse anti-Human RORγt (Q21-559) | BD Biosciences | Cat#563081 |
| Anti-BDNF-PE, human (REA358) | Miltenyi Biotec | Cat#130-105-181 |
| BD OptiBuild BUV395 Rat Anti-Mouse CD103 (M290) | BD Biosciences | Cat#740238 |
| BV750 anti-mouse CD11b, M1/70 | BD Biosciences | custom |
| BV750 anti-mouse CD19 (1D3) | BD Biosciences | custom |
| BV480 Rat Anti-Mouse CD25 (PC61) | BD Biosciences | Cat#566120 |
| Brilliant Violet 650 anti-mouse CD3 Antibody (17A2) | BioLegend | Cat#100229 |
| BUV496 Rat Anti-Mouse CD4 (GK1.5) | BD Biosciences | Cat#612952 |
| Brilliant Violet 510 anti-mouse/human CD44 Antibody (IM7) | BioLegend | Cat#103044 |
| BD Horizon BUV563 Rat Anti-Mouse CD45 (30-F11) | BD Biosciences | Cat#565710 |
| Alexa Fluor® 488 anti-mouse CD45.1 Antibody (A20) | BioLegend | Cat#110718 |
| BD Horizon BUV737 Rat Anti-Mouse CD62L (MEL-14) | BD Biosciences | Cat#612833 |
| PE/Cy5 anti-mouse CD69 Antibody (H1.2F3) | BioLegend | Cat#104510 |
| CD69 Monoclonal Antibody (H1.2F3), PE, eBioscience | eBioscience | Cat#12-0691-83 |
| CD8a Monoclonal Antibody (53-6.7), Biotin, eBioscience | eBioscience | Cat#13-0081-82 |
| Streptavidin, Alexa Fluor 350 conjugate | Invitrogen | Cat#S11249 |
| BD Horizon BUV805 Rat Anti-Mouse CD8a (53-6.7) | BD Biosciences | Cat#612898 |
| CD90.1 (Thy-1.1) Monoclonal Antibody (HIS51), APC, eBioscience | eBioscience | Cat#17-0900-82 |
| Brilliant Violet 421 anti-mouse CD152 Antibody (UC10-4B9) | BioLegend | Cat#106312 |
| Anti-FoxP3-APC, mouse (REA788) | Miltenyi Biotec | Cat#130-111-601 |
| FOXP3 Monoclonal Antibody (FJK-16 s), APC, eBioscience | eBioscience | Cat#17-5773-82 |
| Alexa Fluor® 488 anti-GFP Antibody (FM264G) | BioLegend | Cat#338008 |
| Anti-Helios-PE-Vio615, human and mouse (REA829) | Miltenyi Biotec | Cat#130-112-636 |
| Brilliant Violet 605 anti-human/mouse/rat CD278 (ICOS) (C398.4A) | BioLegend | Cat#313538 |
| Alexa Fluor® 700 anti-mouse Ki-67 Antibody (16A8) | BioLegend | Cat#652420 |
| Brilliant Violet 785 anti-mouse/human KLRG1 (MAFA) Antibody (2F1/KLRG1) | BioLegend | Cat#138429 |
| CD304 (Neuropilin-1) Monoclonal Antibody (3DS304M), PerCP-eFluor 710, eBioscience | eBioscience | Cat#46-3041-82 |
| Purified anti-mouse NK-1.1 Antibody (PK136) | BioLegend | Cat#108702 |
| Brilliant Violet 711 anti-mouse CD279 (PD-1) Antibody (29F.1A12) | BioLegend | Cat#135231 |
| IL-33R (ST2) Monoclonal Antibody (RMST2-2), PE-Cyanine7, eBioscience | eBioscience | Cat#25-9335-82 |
| Anti-T-bet-PE, human and mouse (REA102) | Miltenyi Biotec | Cat#130-098-596 |
| Brilliant Violet 421 anti-mouse TCR Va2 Antibody (B20.1) | BioLegend | Cat#127825 |
| TCR V alpha 3.2 Monoclonal Antibody (RR3-16), FITC, eBioscience | eBioscience | Cat#11-5799-80 |
| TCR V beta 11 Monoclonal Antibody (RR3-15), Super Bright 436, eBioscience | eBioscience | Cat#62-5827-82 |
| FITC anti-mouse TCR Vα5.1, 5.2 | BioLegend | Cat#139513 |
| Alexa Fluor® 488 anti-mouse TCR β chain Antibody | BioLegend | Cat#109215 |
| CD45 Monoclonal Antibody (30-F11), PE, eBioscience | eBioscience | Cat#12-0451-82 |
| Brilliant Blue 790-P anti-mouse CD45 (30-F11) | BD Biosciences | custom |
| Chemicals, Peptides, and Recombinant Proteins | ||
| Ampicillin | Sigma-Aldrich | Cat#10835242001 |
| Vancomycin Hydrochloride | Fisher scientific | Cat#BP2958-1 |
| Ciprofloxacin | Sigma-Aldrich | Cat#17850-5G-F |
| Imipenem monohydrate | Fisher scientific | Cat#15595136 |
| Metronidazole | Sigma-Aldrich | Cat#M3761-5G |
| DiI(1-1’-Dioctadecyl-3,3,3′,3′- tetramethylindocarbocyanine perchlorate | Sigma-Aldrich | Cat#42364 |
| Tungsten M-17 Microcarriers | Biorad | Cat#1652267 |
| X-VIVO 15 Serum-free Hematopoietic Cell Medium | Lonza | Cat#BE02-060F |
| Recombinant Murine IL-2 | Biolegend | Cat#575402 |
| Recombinant hTGFb1 | R&D systems | Cat#7754-BH-005 |
| Recombinant Murine IL4 | Peprotech | Cat#214-14 |
| Recombinant Murine IFNγ | Peprotech | Cat#315-05 |
| Recombinant Murine Amphiregulin | Peprotech | Cat#315-36 |
| Hyaluronidase from bovine testes | Sigma-Aldrich | Cat#H3506-1G |
| DEOXYRIBONUCLEASE I | Sigma-Aldrich | Cat#DN25-1G |
| Collagenase D | Sigma-Aldrich | 11088882001 |
| Percoll Plus | VWR International Ltd | Cat#17-5445-01 |
| Precision Count Beads | Biolegend | Cat#424902 |
| RNeasy Micro Kit | QIAGEN | Cat#74004 |
| iScript cDNA Synthesis Kit | Bio-rad | Cat#1708891 |
| Preamp Master Mix | Fluidigm | Cat#1005581 |
| DNA suspension buffer | TEKnova | Cat#T0227 |
| exonuclease I | New England Biolabs | Cat#PN M0293L |
| SsoFast EvaGreen® Supermix with Low ROX | Biorad | Cat#PN 1725211 |
| 96.96 DNA Binding Dye Sample/Loading Kit—10 IFCs, with Control Line Fluid | Fluidigm | Cat#BMK-M10- 96.96-EG |
| Agencourt AMPure | BeckmanCoulter | Cat#A63880 |
| MiSeq Reagent Kit v2 (500-cycles) | illumina | Cat#MS-102-2003 |
| EasySep Mouse CD4+ T Cell Isolation Kit | Stemcell | Cat#19852 |
| EasySep Mouse CD8+ T Cell Isolation Kit | Stemcell | Cat#19853 |
| PE/Cy5.5® Conjugation Kit - Lightning-Link® | abcam | Cat#ab102899 |
| CD11b microbeads | Miltenyi | Cat#130-093-634 |
| MACS buffer | Miltenyi | Cat#130-091-373 |
| Neural Tissue Dissociation Kit (P) | Miltenyi | Cat#130-092-628 |
| Glutamine | Life Technologies | Cat#25030-024 |
| DMEM/F12, GlutaMAX | Life Technologies | Cat#31331-028 |
| N-Acetyl Cysteine | Sigma-Aldrich | Cat#A7250-10G |
| Insulin | Sigma-Aldrich | Cat#I9278-5ML |
| Apo-Transferrin | Sigma-Aldrich | Cat#T1147-100MG |
| Sodium Selenite | Sigma-Aldrich | Cat#S9133-1MG |
| Cholesterol | Sigma-Aldrich | Cat#C8667-500MG |
| Heparan Sulfate | Ams bio UK | Cat#GAG-HS01 |
| Mouse M-CSF | Peprotech | Cat#300-25 |
| Mouse TGFβ | Peprotech | Cat#100-21 |
| Mouse IL-34 | BioLegend | Cat#577604 |
| Mouse CX3CL1 | BioLegend | Cat#583506 |
| Critical Commercial Assays | ||
| Single Cell 3′ Library & Gel Bead Kit v2 and Chip Kit | 10x Genomics | Cat#PN-120237 |
| Deposited Data | ||
| Single cell sequencing dataset (Murine microglia) | GEO | GSE144038 |
| Human T cell dataset | GEO | GSE146165 |
| Experimental Models: Organisms/Strains | ||
| Foxp3Thy1.1 reporter mice (C57BL/6.SJL-Ptprca/BoyJ and C57BL/6J backgrounds) | Alexander Rudensky (Sloan Kettering) | N/A |
| OT-II TCR transgenic mice (C57BL/6.SJL-Ptprca/BoyJ and C57BL/6.Rag2tm1Fwa.SJL-Ptprca/BoyJ backgrounds) | Michelle Linterman and Rahul Roychoudhuri (Babraham Institute) | N/A |
| 2D2 TCR transgenic mice (C57BL/6.SJL-Ptprca/BoyJ background) | Roland Liblau and Anne Dejean (INSERM) | N/A |
| Nur77-GFP mice (C57BL/6-Tg(Nr4a1-EGFP/cre)820Khog/J) | Martin Turner (Babraham Institute) | N/A |
| TCRα knockout mice (B6.129S2-Tcratm1Mom/J) | Michelle Linterman (Babraham Institute) | N/A |
| MHC II knockout mice (C57BL/6.129S2-H2dlAb1-Ea/J) | Jackson | Stock No: 003584 |
| C57BL/6 germfree mice | Germfree Ghent Germfree and Gnotobiotic mouse facility | N/A |
| C57BL/6J | Jackson | Stock No: 000664 |
| Rag knockout mice (B6(Cg)-Rag2tm1.1Cgn/J) | Jackson | Stock No: 008449 |
| CD45.1 mice (B6.SJL-Ptprca Pepcb/BoyJ) | Jackson | Stock No: 002014 |
| Oligonucleotides | ||
| See Table S1 for primers | N/A | N/A |
| Software and Algorithms | ||
| Ethovision | Noldus, Wageningen, the Netherlands | N/A |
| BubbleGUM, v.1.3.19 | Spinelli et al., 2015 | http://www.ciml.univ-mrs.fr/applications/BubbleGUM/index.html |
| Panlab Freezing, v. 1.2.0 | Panlab | https://www.panlab.com/en/ |
| Zen | Zeiss | https://www.zeiss.com/microscopy/int/products/microscope-software/zen.html |
| ANY-maze Video Tracking System | Stoelting Europe | https://www.stoeltingco.com/ |
| ImageJ, v. 2.0.0 | https://imagej.nih.gov/ij | https://imagej.nih.gov/ij/download.html |
| Sholl analysis, v. 3.6.12 | https://imagej.net/Sholl_Analysis | https://imagej.net/Sholl_Analysis |
| Imaris, v. 9.5.1 | https://imaris.oxinst.com/ | https://imaris.oxinst.com/ |
| Biomark HD | Fluidigm | https://www.fluidigm.com/products/biomark-hd-system |
| FlowJo | BD | https://www.flowjo.com/ |
| Prism | GraphPad | https://support.10xgenomics.com/single-cell-gene-expression/software/overview/welcome |
| Cell Ranger, v 3.1 | 10x Genomics | https://support.10xgenomics.com/single-cell-gene-expression/software/overview/welcome |
| LotuS pipeline | Hildebrand et al., 2014 | N/A |
| DADA2 pipeline, v. 1.6 | Callahan et al., 2016 | https://benjjneb.github.io/dada2/tutorial_1_6.html |
| GSEA, v. 3.0 | Subramanian et al., 2005 | N/A |
| R software enviroment, v 3.6.2 | R Development Core Team, 2014 | N/A |
| R package phyloseq | McMurdie and Holmes, 2013 | N/A |
| R package vegan | Oksanen et al., 2007 | N/A |
| R package Seurat, v 3.0 | Stuart et al., 2019 | https://satijalab.org/seurat/ |
| R package Monocle, v. 2.8.0 | Qiu et al., 2017 | http://packages.renjin.org/package/org.renjin.bioconductor/monocle |
| R package rstan, v. 2.19 | Stan Development Team, 2018 | N/A |
Resource Availability
Lead Contact
Lead Contact is Adrian Liston (adrian.liston@babraham.ac.uk).
Materials Availability
Further information and requests for resources and reagents should be directed to and will be fulfilled by the Lead Contact. This study did not generate new unique reagents.
Data and Code Availability
The scRNA-seq datasets are deposited in the Genome Expression Omnibus under the accession numbers GSE144038, GSE146165. Data resources 1-7 are available at Mendeley Data (https://doi.org/10.17632/hsmzw47kbg.3). Analyses were performed in R, as detailed below. The Code used for analysis generation is included with the data at Mendeley Data. Additional custom code is currently under preparation for publication. Full description of the theoretical and practical aspects of those novel approaches is included in the methods. The list of R libraries and other analytical software used in this study can be found in the Key Resources Table.
Experimental Model and Subject Details
Patient material
Five human brain samples were obtained over a 1-year period (July 2018 through April 2019) during epilepsy surgery. It included 4 females (7, 24, 48,62 years old) and one male (20 years old). Surgical and medical reports were carefully analyzed. All experimental samples represented lateral temporal neocortex. 4 out of 5 patients underwent pure temporal lobe surgery for mesial lesions. Lesions (medial temporal lobe) included hippocampal sclerosis (N = 2), ganglioglioma (N = 2). All 5 experimental samples (lateral temporal lobe) were macroscopically normal and histopathology of the lateral neocortex was either normal or showed only very discrete aspecific changes (gliosis). 1 patient underwent a hemispherectomy (postvaccinal encephalitis) and in this case pathology showed changes in the neuronal architecture most likely due to chronic epilepsy. Both lateral and mesial temporal lobe specimens were sent for pathology. All experimental samples were immediately placed on wet ice and transported to the lab for further processing (post sampling intervals < 10 mins). All procedures were approved by the UZ Leuven Ethical Committee (protocol study number S61186).
Mice
Foxp3Thy1.1 reporter mice (Liston et al., 2008) were used on the C57BL/6 and C57BL/6.SJL-Ptprca/BoyJ background, 2D2 TCR transgenic mice were used on the C57BL/6 background. OT-II TCR transgenic mice were used on the C57BL/6.SJL-Ptprca/BoyJ and C57BL/6.Rag2tm1Fwa.SJL-Ptprca/BoyJ backgrounds. C57BL/6.129S2-H2dlAb1-Ea/J mice (Madsen et al., 1999) were purchased from Jackson. B6.129S2-Tcratm1Mom/J mice (Mombaerts et al., 1992) were bred in-house. For germfree experiments, C57BL/6 germfree mice were provided by the Germfree Ghent Germfree and Gnotobiotic mouse facility. Mice were housed under SPF conditions, unless otherwise noted. Both male and females (8-15 weeks old) have been used in this study unless otherwise specified. For isolation and enrichment experiments 4 weeks old C57BL6 mice have been used. Control mice were group housed in standard cages (27x17x14cm, 2-4 mice/cage), and isolated mice were housed individually in standard cages for ten weeks. An enriched environment was provided by housing mice in large cages (37x22x18cm, 3-5 mice/cage) with novel objects (plastic and wooden toys shelters, running wheel, platforms, grids, tubes and nesting materials, rotated weekly) for at least five weeks.
All mice were fed a standard chow diet, ad libitum. All experiments were performed in accordance with the University of Leuven Animal Ethics Committee guidelines, the Babraham Institute Animal Welfare and Ethics Review Body, the University of Belfast Animal Welfare and Ethics Review Body or CEAA-Toulouse (Comités d’éthique en expérimentation animale). Animal husbandry and experimentation complied with existing European Union and national legislation and local standards. Sample sizes for mouse experiments were chosen in conjunction with the Animal Ethics Committee to allow for robust sensitivity without excessive use.
Method Details
Anti-CD4 depletion
For anti-CD4 depletion experiments, mice were injected i.p. with 25 μg/g anti-CD4 (clone GK1.5, BioXCell). The P5 treatment group received injections on post-natal day 5, day 13 and day 36, while the P21 group was treated on days 23 and 45. All mice were assessed at 7 weeks of age.
Broad-spectrum antibiotic treatment
For broad-spectrum antibiotic treatment 10 weeks old female C57BL6 mice have been used. Mice were treated with an antibiotic cocktail in the drinking water ad libitum for a period 2, 4- or 6-weeks containing: ampicillin (1g/L, Sigma-Aldrich), vancomycin (0.,5g/L, Fisher scientific), ciprofloxacin (0.2 g/L, Sigma-Aldrich), imipenem (0.25 g/L, Sigma-Aldrich), metronidazole (1 g/L, Sigma-Aldrich) and 10% sucrose, with control mice receiving just 10% sucrose.
Intravenous CD45 labeling
For intravenous labeling experiments, mice were injected i.v. with 2μg of PE-labeled mouse anti-CD45 antibody (CD45:PE). Blood was sampled and mice perfused with PBS 3min after injection.
Parabiosis
For parabiosis, pairs of 7-10 weeks old female mice were cohoused for 14-21 days prior to surgery. For this experiment, Foxp3Thy1.1 reporter mice (Liston et al., 2008) were used on the C57BL/6 and C57BL/6.SJL-Ptprca/BoyJ background. Pairs of mice were anesthetized with inhaled isoflurane, 3.5% v/v induction, 2.5%–3.0% v/v maintenance. Carprofen and Buprenorphine were delivered intraperitoneally at a dose of 10 mg/kg and 0.1 mg/kg prior to surgery. Fur was removed from the surgical site. Mice were laid supine and the surgical site was disinfected with betadine solution followed by 70% EtOH. Longitudinal skin incisions to the shaved sides of each animal starting at 0.5cm above the elbow all the way to 0.5cm below the knee joint. The skin was gently detached from the subcutaneous fascia to create 0.5cm of free skin, and sutured together to generate a parabiotic pair. Following post-operative care, parabiotic pairs have been monitored for fusion of the circulatory systems using CD45.1 and CD45.2 flow cytometry measurement in the blood. Only pairs that demonstrated early chimerism of the circulatory system were used for tissue analysis.
Murine cohousing
For cohousing experiments, 4-6 weeks old female pet-store mice were purchased and housed in a dirty facility to allowing interaction with wild mice for 4 weeks, prior to cohousing these mice with Foxp3Thy1.1 reporter mice. During the 6 weeks cohousing period, bedding was exchanged on a regular basis between each cohoused unit, to normalize microbiota exchange. Despite cohousing, mice were largely negative for the standard pathogen screens, with negative cultures for Citrobacter rodentium, Corynebacterium kutscheri, Klebsiella oxytoca, Klebsiella pneumonia, Pasteurellaceae, Pseudomonas aeruginosa, Salmonella species, Staphyloccus aureus, Streptobacillus moniliformis, Steptococci beta-haemolytic Group A/B/C/G and Steptococcus pneumonia. Some co-housed cages were culture positive for Rodentibacter species. By MIA screen, cohoused mice were negative for Adenovirus FL, Clostridium piliforme, Ectromelia virus, General parvovirus (rNS-1), Lymphocytic choriomeningitisvirus, Minute virus of mice, Mouse hepatitis virus, Mouse parvovirus (rVP2), Mouse rotavirus / EDIM, Pneumonia virus of mice, Reovirus type 3 and Sendai virus. Some co-housed cages were MIA positive for Adenovirus K87, Murine norovirus, Mycoplasma pulmonis and Theiler’s encephalomyelitis virus (GD VII). By PCR, all co-housed cages were negative for Helicobacter hepaticus, while some co-housed cages were positive for Helicobacter bilis, Helicobacter typhlonicus and other Helicobacter species. By microscopy, co-housed mice were negative for Chilomastix bettencourti, Eimeria species, Entamoeba species, Giardia species and other ectoparasites and endoparasites. Some co-housed cages were positive for Aspiculuris tetraptera, Myobia musculi / Radfordia species, Myocoptes musculinus, Spironucleus muris, and Syphacia obvelata. All co-housed cages were positive for Trichomonas species.
At experimental end, caecal samples were extracted from mice and frozen for subsequent microbiome analysis. The V4 region of the 16S rRNA gene was amplified with the primer pair 515F and 806R (GTGYCAGCMGCCGCGGTAA and GGACTACNVGGGTWTCTAAT, respectively), modified to contain a barcode sequence between each primer and the Illumina adaptor sequences to produce dual-barcoded libraries (Tito et al., 2019).
Size selection, before Illumina sequencing, was performed using Agencourt AMPure to remove fragments below 200 bases. Sequencing was performed on the Illumina MiSeq platform (MiSeq Reagent Kit v2, 500 cycles, 15.38% PhiX,-2∗250 PE) at the VIB Nucleomics core laboratory (Leuven, Belgium). After de-multiplexing with sdm without allowing for mismatches, as part of the LotuS pipeline (Hildebrand et al., 2014), fastq sequences were further analyzed per sample using DADA2 pipeline (v. 1.6) (Callahan et al., 2016). In brief, after inspecting quality, sequences were trimmed to remove the primers and the first 10 bases after the primer, keeping only 200 bases and 130 for the R1 and R2 files, respectively. After merging paired sequences and removing chimeras, taxonomy was assigned using formatted RDP training set ‘rdp_train_set_16’.
Sequences annotated to the class Chloroplast, family mitochondria or unknown bacteria were removed prior to the analyses. The sequencing data was rarefied to 10 000 observations to calculate inter-individual and intra-individual microbial diversity. All further analyses were performed at the genus level, such as richness, Shannon diversity index and Bray-Curtis dissimilarity index. Statistical analyses were performed using R, and packages phyloseq (McMurdie and Holmes, 2013) and vegan (Oksanen et al., 2007). For microbiota and metadata association analysis, we excluded taxa present in < 20% of samples. Correlations between bacteria and archaea genera and mice group status were performed using Wilcoxon test. Correction for multiple testing using Benjamini-Hochberg’s procedure for false discovery rate (FDR) was performed when applicable (Benjamini and Hochberg, 1995); significance was defined at FDR < 10% (see https://dx.doi.org/10.17632/hsmzw47kbg.3 at Mendeley Data).
Behavior
All behavioral experiments were performed in 13-18 weeks old female mice. Littermate mice (at least 10/group) were tested in 3 independent experiments. Mice were habituated to their new environment for at least 5 days and tests were conducted during the light phase of their activity cycle. Health and weight of the mice were recorded routinely during the whole period of testing. Tests were performed and analyzed blind to the genotype. If tracking error occurred mice have been excluded. All protocols were approved by the ethical commission.
Open Field
Open-field exploration was tested in a 40cm × 40cm × 30cm (w × l × h) square arena illuminated by indirect light. Animals were dark adapted for 30 min and tested in the arena for 10 min. Movements of the mice in the arena were video-tracked for 10 minutes with Ethovision software (Noldus, Wageningen, the Netherlands).
Nest Building
For the nest building test the mice were single-housed with 1.5g of Cocoon nesting pellets and left undisturbed for 24 hours. Nests were assessed scored according to published protocols (Deacon, 2012).
Morris Water Maze (MWM)
Spatial learning and cognitive flexibility were tested in the hidden platform Morris water maze (MWM). A circular pool (150cm) was filled with opaquified (0.01% Acusol OP301, Dow chemicals) water (26 ± 1°C). The platform (15cm) was hidden 1 cm underneath the water surface. For spatial learning, the mice were trained for 10 days to a fixed platform position (Callaerts-Vegh et al., 2006; D’Hooge and De Deyn, 2001). To evaluate reference memory, probe trials (100 s) were conducted on days 6 and 11 during acquisition learning. During probe trials, floater mice have been excluded. Swim paths were tracked with Ethovision software (Noldus, Wageningen, the Netherlands).
Sociability/social novelty
Sociability and social memory were evaluated using the three-chamber test (Nadler et al., 2004; Naert et al., 2011). The set-up consists of a rectangular transparent Plexiglas box divided into three compartments, separated by two partitions. The central chamber (42 × 26 cm) was connected to a left and right chamber (26 × 26cm) connected by guillotine doors (6x8cm). The SPSN test consisted of three consecutive stages: acclimation stage, sociability stage, and preference for social novelty stage. After habituation to the central compartment (5 min), wire cages (11x10cm) were placed in the external chambers containing a stranger mouse (same sex, stranger 1) or left empty and approach behavior to either wire cages was recorded for 10 min (sociability). After 10 min, a second stranger (same sex, stranger 2) was placed in the empty wire cage and approach behavior toward either mouse is recorded (preference for social novelty) for 10 min. Animal behavior was recorded using a webcam and ANY-maze Video Tracking System software (Stoelting Europe).
Marble burying test
The set-up consisted of a large cage (45 × 22cm) with filter tops filled with 5cm of fresh and compact bedding and 24 marbles (∼1.5 cm diameter each) that were equally distributed along the walls (at 2cm distance). Mice were placed in the cage and left undisturbed for 30 min. At the end of the test, the number of marbles buried more than 2/3 of their volume were counted by an experimenter blind to the genotype.
Forced swim test
Mice were individually placed into a glass cylinder (20 × 14cm) filled with water (16cm depth, 25 ± 1°C). The mouse was placed gently in the water for 6 min and amount of immobility (passive floating, no active swimming or escape behavior) was scored for the final 4 min using ANY-maze Video Tracking System software (Stoelting Europe).
Light/dark test
The apparatus used for the light/dark test consisted of a cage (40 × 40 × 30cm) divided into two compartments of equal size by a partition with a door. One compartment was brightly illuminated, while the other was dark. Mice were placed in the dark compartment and allowed to move freely between the two chambers for 10 min. Mice activity in the light compartment was tracked with Ethovision equipment and software (Noldus).
Rotarod test
Motor coordination and equilibrium were tested with a rotarod setup (MED Associates Inc., St. Albans, Vermont, USA). Mice were first trained at constant speed (4 rpm, 2 min) and then tested on four trials (intertrial interval, 10 min). During the test trials, the animals had to balance on a rotating rod that accelerated from 4 rpm to 40 rpm in 300 s, the latency to fall off the rod was recorded (up to the 5 min cut-off).
Contextual discrimination fear conditioning
Two identical conditioning boxes (25 × 25 × 25cm) with stainless steel grid floors to deliver shocks were located in sound-attenuating dark cubicles. Animal movement was monitored by motion-sensitive platforms connected to an interfaced computer using Panlab Freezing v1.2.0 software. The degree of motion could range from 0 to 100. Freezing, defined as the absence of movement except for breathing, was recorded when activity remained below a validated threshold of 2.5 (arbitrary unit) for at least 1 s. Contextual fear conditioning was measured in three different contexts, where 2 contexts (A and C) were very similar in tactile (grid floor), olfactory (odor), visual (dark) dimensions, but C had in addition a inserted a-frame roof (adapted from van Boxelaere et al., 2017). In contrast, context B was different in all dimensions. On day 1-3, mice were placed in context A, and after 3 minutes a single mild foot shock (2 s, 0.5mA) was applied to induce contextual fear conditioning. After another minute, the animals were placed back in their home cage. On day 4 and 5, fear memory to A, B, and C was measured by placing the animal for 4 minutes in each of the contexts and measuring the amount of freezing. The amount of freezing to C in comparison to A indicated the amount of contextual generalization.
Imaging
DiOlistic labeling of brain slices
Male littermate mice (14-16 weeks old) were deeply anaesthetized with ketamine/xilazine i.p. (100 mg/kg body weight Ketamine, 16 mg/kg body weight Xylazine) and transcardially perfused with 5% buffered formalin solution. Brains were post-fixed in 2% paraformaldehyde. Vibratome sections of 150μm at the hippocampal level were collected. DiOlistic staining was performed using a gene gun system (Helios Gene Gun System, Bio-Rad), as previously reported (Seabold et al., 2010). Briefly, bullets were prepared using tungsten beads coated with DiI(1-1’-Dioctadecyl-3,3,3′,3′- tetramethylindocarbocyanine perchlorate) and were then shot over slices (0.03mg DiI/mg tungsten). Shooting was performed at a helium pressure of 150psi. All sections were incubated with DAPI (1:1000) for 15 min and mounted with Fluormount-GTM Neurons of layers II-IV of the somatosensory cortex were analyzed. Confocal images were obtained using Nikon C2 Eclipse microscope (40x oil objective), with a resolution of 2048x2048 pixels. Each image is a z- projection of approximately 10 to 20 images, taken at 0.8-1 μm depth intervals. Quantitative analysis was performed blind. Image processing and analysis was performed using imageJ (https://imagej.nih.gov/ij/download.html). Single dendrites were selected randomly. Five dendritic segments of 10 μm at 50um distance from the cell body were analyzed from 3-5 neurons/mouse. Each individual spine on the dendrites was manually traced and assigned to one of the four morphological classes, stubby, mushroom, long thin and filopodia, based on spine length, head and neck measures as previously shown (Pak et al., 2001).
Fluorescence immunostaining
C57BL/6 mice (14-20 weeks old) were deeply anaesthetized with ketamine/xilazine i.p. and transcardially perfused with PBS followed by 10% buffered formalin solution. The brain was removed and fixed in 10% buffered formalin solution overnight and stored in 30% sucrose until preservation in tissue freezing medium (OCT). For Laminin staining mice were transcardially perfused with PBS followed by FBS and preserved in tissue freezing media (OCT). Cryostat sections were prepared on positively charged slides at a thickness of 16μm. In vivo vascular labeling was performed by intravenously injection with 0.1 mL of DyLight 649 labeled Lycopersicon Esculentum (Tomato) Lectin (DL-1178, Vector labs) i.v. (75ug/30 g mouse). Lectin was allowed to circulate for 30 minutes and then mice were transcardially perfused with PBS followed by 10% buffered formalin solution. Cryo-sections were pre-blocked with 10% normal donkey serum in 0.3% Triton X-100 for 1h at room temperature and incubated overnight at 4°C with primary antibodies, directed against CD4 (1:500, 100506, Biolegend), Foxp3 (1:500, MAB8214, R&D systems), Iba1 (1:1000, 014-19741, Wako), GFAP (1:500, Z033429-2, DAKO), CD4 (1:500, ab183685, Abcam), CD31 (1:250, MA3105, Invitrogen), Laminin α4 (1:500, AF3837, R&D systems), Laminin α1 (1:500, MAB4656, R&D systems). Subsequently, the sections were incubated for 1.5h at room temperature with appropriate secondary antibodies labeled with fluorophores. All sections were incubated with DAPI (1:1000) for 15 min and mounted with Fluormount-GTM. Images were obtained from 6 mice. For each set of staining, negative controls without of primary antibody were included. For CD4 & Foxp3 quantification, the images from sagittal brain sections were obtained using Zeiss AxioScanZ.1. The confocal images were obtained using Nikon C2 Eclipse or Zeiss LSM780 confocal microscope. For microglia Sholl analysis, Iba1 staining was performed on free-floating sections of thickness 140μm and images were obtained using Nikon Spinning Disc microscope. Image processing was performed using imageJ (https://imagej.nih.gov/ij/download.html). Surface rendering was performed using Imaris software. v 9.5.1 (https://imaris.oxinst.com/). 3D surface rendering videos for all images are available at https://dx.doi.org/10.17632/hsmzw47kbg.3 on Mendeley Data).
Quantification
For immunohistochemical quantification of CD4+ and Foxp3+ cells, ∼30 sagittal sections at a thickness of 16 μm have been acquired for one hemisphere (AP 0 to +0.5mm to Bregma), for each mouse. Three mice have been quantified. The counting was done manually using Zen software (Zeiss). The proportion of cells associated with vascular-adjacent and vascular-distal locations was determined by the extent of overlap of CD4+/Foxp3+ cells with lectin stained vasculature. The estimate of total number of cells in the whole brain was calculated based on the average volume of adult mouse brain which is ∼440mm3 (Oprica et al., 2007). For microglia density analysis and counting of phagocytic buds, 8-10 fields of 634.28 × 634.28 μm images were obtained from cortex of 4-5 coronal brain slices per each mouse with the Z stack of 12μm range. Microglia/mm3 were calculated from the average number of microglia found in each field of view. For microglia morphology analysis, 40x images were obtained with the Z stack of 50μm. Sholl analysis was performed using the Fiji plug-in for ImageJ (https://imagej.nih.gov/ij/download.html). The complexity and the length of the branches were measured using a step-size of 10μm from the soma (http://imagej.net/Sholl_Analysis). The complexity and the length of the branches were measured using a step-size of 10μm from the soma.
Flow cytometry
Mice were deeply anaesthetized with ketamine/xilazine i.p. and transcardially perfused with ice cold PBS unless otherwise state. Mouse and human tissues have been harvested in RPMI 1640 (Life-technologies) supplemented with 2 mM MgCl2, 2 mM CaCl2, 20% FBS, 2 mM EDTA and 2 mM HEPES and kept in ice until processing. Single-cell suspensions were prepared from mouse, spleen, and pooled lymph nodes (cervical, inguinal, mesenteric, axillary, and brachial) by mechanical dissociation or from blood by red blood cells lysis. Single cell suspensions from brain tissue were prepared by digestion for 30 minutes at 37°C with 1 mg/ml collagenase IV (ThermoFisher), 300 μg/ml hyaluronidase (Sigma-Aldrich) and 40 mg/ml DNase I (Sigma-Aldrich) in RPMI supplemented with 2mM MgCl2, 2mM CaCl2 20% FBS and 2 mM HEPES. Digested tissue was mechanically disrupted, filtered through 100μm mesh and enriched for leukocytes by centrifugation (600 g, 10 minutes, no brakes) through 40% Percoll (GE Healthcare). Lung tissue was treated similarly, while the small intestine was subjected to a pre-digest incubation in HBSS with 2% FCS and 10mM EDTA to remove the epithelial layer. PBMCs were isolated using LSM (MP Biomedicals) from healthy individuals. Non-specific binding was blocked using either 2.4G2 supernatant for mouse cells or normal mouse serum for human cells, and dead cells were labeled by fixable viability dye eFluor 780 (ThermoFisher). Cells were fixed and permeabilized with the eBioscience Foxp3 staining kit (eBioscience). Cells were enumerated based on the recovery of Precision Count Beads (BioLegend).
Cellular phenotypes were assessed using high parameter flow cytometry panels containing markers to identify cell types and markers to assess activation states. Vascular cells binding CD45:PE, dead cells and doublets were gated out prior to downstream analysis. For murine flow samples, antibodies were generally incubated at 4C after fixation and permeabilization using the eBioscience Foxp3 staining kit (eBioscience), with the exception of viability staining and CD69. Nur77-GFP data were acquired on a BioRad ZE5 with a panel consisting of GFP, CD45, CD4, CD8, CD3, CD19, NK1.1, CD11b, Foxp3, viability, CD103, CD62L, CD25, Neuropilin, ST2, PD-1, KLRG1, Helios, CD69, ICOS, CD44 and Ki67, using 2% formalin as a fixative to enable robust co-detection of Foxp3 and GFP. OTII and 2D2 mouse data were also acquired on the BioRad ZE5 with a panel comprised of CD11b, CD3, CD45, CD4, CD19, NK1.1, viability, Foxp3, Ki67, CD62L, CD44, CD103, ST2, CD69, Helios, Neuropilin, T-bet, KLRG1, PD-1 and ICOS as well as a pair of TCR-specific antibodies in each case. For OTII samples, anti-TCR Vα2 and anti-TCR Vβ5 were used to identify cells carrying the OTII TCR rearrangement. For 2D2, anti-TCR Vα3.2 and Vβ11 were used. For the OTII and 2D2 experiments, intravascular labeling with anti-CD45-PE was used to identify blood contamination instead of perfusion. The remaining high parameter flow data were acquired on a BD FACSymphony, with a mouse panel covering CD45.1, CD45, CD4, CD8, CD3, CD19, NK1.1, Foxp3, viability, CD103, CD62L, CD25, Neuropilin, ST2, PD-1, KLRG1, Helios, CD69, ICOS, CD44, T-bet and Ki67, and a human panel covering viability, CD11b, CD3, CD4, CD8, CD14, Foxp3, CD127, CD25, PD-1, CXCR3, CD69, CD45RA, CCR2, ICOS, CD28, CTLA-4, HLA-DR, CXCR5, Ki67, CD95, CD31, RORγT, CCR4 and CCR7. Precise and accurate compensation was achieved using AutoSpill, developed in house (manuscript in preparation). tSNE, FlowSOM and heatmap analysis were performed in R (version 3.6.2) using only activation markers. Examples for murine cells are always presented as concatenated biological replicates. Cell sorting was performed using a BD FACSAria III, for sorting mouse live microglia single cell suspension was stained with CX3CR1, CD11b, CD45, Fixable viability dye Ly6C/Ly6G, CD19.
Brain slices culture
Brain slice cultures were generated from P0-P2 mice. C57BL6 mice were euthanised by decapitation and the hindbrain was removed. Brain stem slices (300 μm) were generated using a McIlwain Tissue Chopper and then cultured in 6 well plate transwell inserts (Millipore, Cat. No: PICMORG50) containing 1 mL of brain slice media (46.6% minimum essential medium (MEM, Life-technologies), 25% Earle’s balanced Salt Solution (EBSS, Life-technologies), 25% Heat-inactivated horse serum (Life-technologies), 1% Penicillin/Streptomycin (Life-technologies), 1% Glutamax (Life-technologies), 1.4% D-glucose (Sigma-Aldrich). 3-4 brain slices were cultured per transwell, each of them originating from different animals. Brain slice media was changed the day after the slices were prepared and then every other day. Brain stem slices were kept in culture for 7 days prior to seeding with 50,000 CD4+ T cells and CD8+ T cells isolated from lymph nodes and spleens of 8-12 week old mice. T cells were purified using the EasySep CD4 negative selection kit (Stem Cell Technologies) and EasySep CD8 negative selection kit (Stem Cell Technology), and confirmed by flow cytometry. Brain slices were kept in culture for an additional 14 days, changing media every other day, after which brain slices were detached from the transwell and treated with Collagenase IV (0.4mg/mL (Roche) in RPMI and HEPES buffer), stained with CX3CR1-AF488 (Biolegend), CD11b-PerCPCy5.5, CD45-APC, Fixable viability dye eFluor780, Ly6C/Ly6G-APCe780, CD19-APCe780 (all eBioscience) for sorting live CD19-Ly6C/Ly6G-CD11blowCD45lowCx3Cr1+ microglia.
Microglia cultures
Primary murine microglial cells were isolated from wild-type neonates at postnatal day 1 (P1) as described previously (López-Serrano et al., 2019) without discriminating by sex. Forebrains were harvested and placed in cold HBSS, mechanically triturated and enzymatically dissociated using the Neural Tissue Dissociation Kit (P) (Miltenyi) following manufacturer’s specifications. Samples were passed through a cell strainer of 70 μm mesh (BD2 Falcon) and washed with MACS buffer (Miltenyi). Cells were incubated with CD11b microbeads and passed through a LS column (QuadroMACS, Miltenyi). Murine microglia were plated in 24 well plates at a density of 50,000 cells/well, and cultured using TIC medium (DMEM/F12, Glutamine (2mM), N-Acetyl Cysteine (5μg/mL), Insulin (1:2000), Apo-Transferrin (100 μg/mL), Sodium Selenite (100 ng/mL), Cholesterol (1.5 μg/mL), Heparan Sulfate (1 μg/mL) supplemented with 50 ng/mL M-CSF, 100 ng/ml IL-34, 10 ng/ml CX3CL1 and 2 ng/mL TGFβ (Bohlen et al., 2017; Mancuso et al., 2019). The medium was changed three days after plating and cells were cultured for five days before starting the experiments. Media was then supplemented with either 20ng/ml IL4, 20ng/ml IFNγ, 20ng/ml TGFβ, 40ng/ml Amphiregulin or conditioned media (1 in 10). Conditioned medium from T cells was prepared by culturing 1x10⁶ sort-purified cells on 24-well plates coated o4 hours with anti-CD3 (2μg/ml, clone 145-2C11, eBioscience), anti-CD28 (5μg/ml, clone 37.51) and recombinant IL-2 (20 ng/ml, BioLegend) in serum-free X-VIVO medium (Lonza). Regulatory T cells had the additional presence of recombinant TGFβ (2ng/ml, R&D Systems) and anti-IFNγ (10μg/ml, clone XMG1.2, Bioxcell). T cells were cultured for 72h before the conditioned media was centrifuged, and the supernatant was stored at −80C until use. Control media was generated through the same process, without T cell inclusion. Samples were lysed in Trizol after 24 hours co-culture, for qPCR analysis. Experiments were performed in 2 replicates and blind to genotype.
Quantitative PCR (qPCR)
RNA extraction and complementary DNA production was performed using the RNeasy Micro Kit (QIAGEN) and iScript cDNA Synthesis Kit (Bio-rad) according to the manufacturers’ protocols. Pre-amplification of cDNA samples was carried out as the initial step for the Biomark HD system (Fluidigm). Briefly, PrimeTime qPCR Primer Assays (Integrated DNA technologies) were diluted in DNA suspension buffer (10 mM Tris, pH 8.0, 0.1 mM EDTA; TEKnova) to bring the final concentrations of the primers to 500 nM. The sequences of all primers are listed in Key Resources Table. PCR reactions were amplified with the T100 Thermal Cycler (Bio-Rad) and treated with exonuclease I (New England Biolabs) prior to real time qPCR analysis with 96.96 IFC (Fluidigm). Primer assay mixture and sample pre-mix were prepared in quadruplicates using SsoFast EvaGreen® Supermix with Low ROX (Biorad) and 20X DNA binding dye (Fluidigm). The 96.96 dynamic arrays IFC Chip (Fluidigm) run in the HDBiomark instrument for Fluidigm initial thermal mix at 70°C for 40 minutes, 60°C for 30 s and hot start at 95°C for 60 s, followed by 30 cycles of 96°C for 5 s and then annealing at 60°C for 20 s. The data were analyzed with Real-Time PCR Analysis Software in the HDBiomark instrument (Fluidigm). All data were normalized to the Ppia reference gene control, with the average of quadruplicates used to determine each biological value used for downstream analysis. Experiments were performed lind to genotype.
Single cell sequencing
Single cells were prepared as described above. Murine live CD11b+CD45+ and CD4+CD45+CD11b- cells were sorted using a BD FACSAria III, and resuspended in DPBS 0.04% BSA. Littermate, male, 16 weeks old mice have been used. Human CD4+ cells were extracted from PBMCs and brain tissue as above, and sorted as CD4+CD3+CD8+ CD25loCD127hi and CD4+CD3+CD8+ CD25hiCD127lo T cells, tagged and pooled. C The cell count and the viability of the samples were accessed (where possible) using LUNA dual florescence cell counter (Logos Biosystems) and a targeted cell recovery of 5000 cells were aimed for all the samples. Library preparations for the scRNA-seq was performed using 10X Genomics Chromium Single Cell 3′ Kit, v2 (10X Genomics, Pleasanton, CA, USA). Post cell count and QC, the samples were immediately loaded onto the Chromium Controller. Single cell RNaseq libraries were prepared using manufacturers recommendations (Single cell 3′ reagent kits v2 user guide; CG00052 Rev F), and at the different check points the library quality was accessed using Qubit (ThermoFisher) and Bioanalyzer (Agilent). With a sequencing coverage targeted for 50,000 reads per cell, single cell libraries were sequenced either on Illumina’s HiSeq4000 platform using paired-end sequencing workflow and with recommended 10X; v3 read parameters (28-8-0-91 cycles). For each experiment about 8700 cells were added to each channel with a targeted cell recovery estimate of 5000 cells.
Murine sequence data were preprocessed with Cell Ranger V.2.0 (10x Genomics). The resulting count matrices showing the number of transcripts (UMIs) of each gene for a given cell were analyzed with R (http://www.r-project.org V.3.4) (R Development Core Team, 2014) and the package Seurat (https://satijalab.org/seurat/ V.2.2 (Butler et al., 2018), following the standard pipeline with default parameters, unless stated otherwise. Genes detected in less than five cells were filtered out. Low-quality cells or empty droplets identified as those with less than 200 genes and cell doublets or multiplets identified as those with a very high gene count (i.e., > 5000) were also filtered out in each dataset. Finally, low-quality / dying cells, which often exhibit extensive mitochondrial contamination, were filtered out, leaving 14196 genes across 9404 wild-type cells and 12077 genes across 2278 MHC II- deficient cells. For murine CD4+ T cells, the same filtering approach was followed leaving 16960 genes across 105 wild-type cells. The feature expression measurements for each cell within the combined datasets were normalized by the total expression and log-transformed. Before clustering unwanted variation due to number of UMIs and mitochondrial gene expression was removed. A linear transformation (‘scaling’) of the expression of each gene was also performed normalizing across the sample for the differences in range of variation of expression of genes. The PCElbowPlot() function was used to distinguish principal components (PCs) for further analysis. The tSNE plots were calculated on the first 15 PCs and clusters were identified using the FindClusters() function with the Louvain algorithm, a resolution of 0.4 and 1000 iterations. The identified distinct populations were based on cluster-specific expression patterns of the 2094 and 6526 most variable genes for the murine microglia and CD4 T cell analysis, respectively. Gene set enrichment analysis was carried out on differentially-expressed genes with a 0.4 log fold-change cut-off with GSEA v 3.0 (Broad Institute, Cambridge, Massachusetts, USA) (Subramanian et al., 2005). Genes were pre-ranked based on sign of fold change ∗ -log10pvalue metric with highly upregulated genes on the top and highly downregulated genes at the bottom of the list. Gene sets with size larger than 1000 or smaller than 10 were excluded. Detection of variation in gene sets was controlled to have a false discovery rate lower than 0.25. Gene sets were prioritized according to the normalized enrichment score provided by GSEA. The full murine microglia dataset and analysis code are available in Mendeley Data (https://dx.doi.org/10.17632/hsmzw47kbg.3), with the data available on GEO as dataset GSE144038. Differentially expressed genes are available in Mendeley Data (https://dx.doi.org/10.17632/hsmzw47kbg.3).
Human brain and PBMC sequence data were preprocessed with Cell Ranger V.3.1 (10x Genomics). The resulting count UMI matrices were analyzed with R (http://www.r-project.org V.3.5.1) and the package Seurat (https://satijalab.org/seurat/ V.3.0.2 (Stuart et al., 2019), following the standard pipeline with default parameters, unless stated otherwise. Genes detected in less than five cells, low-quality cells or empty droplets (< 200 or > 4000 genes) and cells with > 20% mitochondrial counts were filtered out in each dataset leaving 14048 genes across 754 brain cells and 13795 genes across 1009 PBMC cells. The feature expression measurements for each cell within each dataset were normalized by the total expression and log-transformed and unwanted variation due to number of UMIs and mitochondrial gene expression was removed. Highly variable features were selected using the FindVariableFeatures with the “vst” selection.method. A linear transformation (‘scaling’) of the expression of each gene was also performed. The tSNE plots were calculated on the first 20 PCs and clusters were identified using the FindNeighbors and FindClusters() functions with granularity of 0.6 and 1000 iterations. The clusters within each dataset annotated as CD4+ T cell populations (86 brain and 567 PBMC cells) were then merged and reclustered. The full human T cell dataset and analysis code are available in Mendeley Data (https://dx.doi.org/10.17632/hsmzw47kbg.3), with the data available on GEO as dataset GSE146165. Differentially expressed genes are available in Mendeley Data (https://dx.doi.org/10.17632/hsmzw47kbg.3).
Quantification and Statistical Analysis
BubbleMap analysis
Count matrices for two mouse microglia samples, one at embryonic day 14.5 (E14.5) (GSM3442007) and another at adulthood (P100) (GSM3442026) were downloaded from the NIH GEO database (GSE121654) (Hammond et al., 2019) and analyzed using the package Seurat V.2.2, following the standard pipeline with default parameters. Genes detected in less than 20 cells and low-quality cells or empty droplets identified as those with less than 650 genes were filtered out. Differentially-expressed genes (Wilcoxon rank sum test implemented in Seurat) were selected as those with average log fold change > 0.6 and Padj < 0.05 (i.e., 326 upregulated genes in E14.5 versus P100) and those with average log fold change < −0.6 and Padj < 0.05 (i.e., 302 downregulated genes in E14.5 versus P100). These genes together with 45 upregulated genes in MHC II KO versus wild-type microglia from our analysis were used to test which be significantly enriched in all possible pairwise comparisons between the four mice using the BubbleMap module of BubbleGUM software v.1.3.19 (Spinelli et al., 2015). BubbleMap assesses the enrichment of input gene signatures between all possible pairs of conditions from independent datasets, based on GSEA methodology. BubbleMap was used with 1000 geneset-based permutations, and with “difference of classes” as a metric for ranking the genes. Since the “geneset” permutations require many gene sets, 46 independent GeneSets from MSigDB (Liberzon, 2014) were additionally used for statistical power. The results were displayed as a BubbleMap, where each bubble is a GSEA result and reflects a GSEA enrichment plot. Each enrichment is represented as a bubble with different sizes and color intensities (bigger and darker show stronger and more significant enrichment) and in a color matching the mouse in which the gene set is enriched (red for wild-type and day 100 microglia, blue for MHC II KO and E14.5 microglia). The strength of the enrichment was quantified by the normalized enrichment score (NES), which represents the number and differential expression intensity of the genes enriched. The significance of the enrichment was measured by the false discovery rate (FDR) value (q) representing the likelihood that the enrichment of the gene set is false-positive. The q value was further corrected for multiple testing to allow comparison of bubble patterns across gene sets and pairwise comparisons. The enrichment was considered significant for absolute NES values > 1 with an associated q value < 0.25. An empty bubble indicates a non-significant enrichment.
Single-cell trajectory analysis
Developmental trajectories between wild-type and MHC II KO microglia were inferred using Monocle v.2.8.0 (Qiu et al., 2017; Trapnell et al., 2014). Monocle is an algorithm that learns the sequence of gene expression changes that each cell undergoes and places cells in “pseudotime” (the total transcriptional change a cell undergoes as it differentiates) by progress through differentiation. Wild-type and MHC II KO microglia data filtered in Seurat were loaded into a monocle object specifying the negative binomial distribution as the expressionFamily argument to newCellDataSet. Data were normalized using estimateSizeFactors. Dimensionality reduction was performed using the reduceDimension command with parameters max_components = 2 and reduction_method = “DDRTree.” Cells were ordered in pseudotime using the orderCells command based on highly variable genes in microglia and the minimum spanning tree on cells was plotted using plot_cell_trajectory command. Pseudotime kinetics of differentially-expressed genes were depicted using the plot_genes_in_pseudotime function.
Continuous-time Markov chain model
Average populations at any time point were modeled with Dirichlet distributions, whose temporal evolution was described by a continuous-time Markov chain. Possible cell states and locations were defined by the factorial design of the parabiosis experiment, as mouse (donor/host) x tissue (blood/brain) x cell state (naive/activated/CD69+), thus with 12 possible values. The differential generator matrix Q, which characterizes the behavior of any continuous-time Markov chain, had in principle 144 coefficients. Among those, by only considering transitions reflecting realistic changes of cell type or location, the number decreased to 47 non-zero matrix coefficients (see https://dx.doi.org/10.17632/hsmzw47kbg.3 on Mendeley Data). This number also included 6 coefficients representing death rates of brain cells, codified as return rates to naive blood cells, which were introduced to ensure irreducibility (and therefore ergodicity) of the Markov chain, needed to obtain a realistic long-term behavior. Further, among the 47 non-zero coefficients of the Q matrix, only 11 were free model coefficients, given constraints imposed by (1) proper structure of a Q matrix, (2) symmetry in behavior between the two mice in each parabiotic pair, and (3) long-term behavior of the chain.
In this model, the Markov chain considers the mouse pair as a whole dynamical system. In contrast, experimental data obtained by flow cytometry only allows views of cell populations isolated by sample, in this case by tissue and time point. That is, cell populations in this dataset cannot be directly compared between different tissues or times. To solve this issue, we performed two operations. First, we estimated the ratio between cell numbers in blood and brain from available data, with values 750/2 for conventional CD4+ T cells and 750/8 for regulatory T cells. These values were used in the estimations of the initial state and the long-term behavior of the chain. Second, we introduced 6 additional free parameters, (3 time points x 2 tissues) in the model, to accommodate for the indeterminate ratios between cell numbers during model fitting.
The initial state of the chain was calculated from data of week 2, to avoid post-surgery artifacts. Long-term behavior was defined as the full equilibrium donor-host, using data from unpaired mice as reference. Data from weeks 4, 8, and 12 was fitted to the model, with a total of 96 6-simplex data points. Model fitting was carried out with a Bayesian approach, using Dirichlet distributions as likelihoods and uniform (uninformative) distributions as priors. Free model parameters were the 11 unconstrained coefficients of the Q matrix, together with the 6 additional parameters mentioned above. Likelihood distributions were calculated from week 2 to each later time point (weeks 4, 8, and 12), as defined by the time evolution of the Markov chain given the Q matrix. Posterior probabilities were sampled with Markov Chain Monte Carlo, using the R package rstan (Stan Development Team, 2018). Sampling was done with 10 chains and 10,000 samples per chain. Marginal posterior distributions of all (both free and non-free) parameters were revised, to identify unfittable parameters yielding quasi-uniform posterior marginals. As a result, three model parameters were fixed a priori. The rate of exchange of blood cells between host and donor was given a very large value (100-fold per day), to signify that this exchange was much faster than any rate detectable in an experiment with time points separated by weeks. Both the return rate of naive cells from brain to blood and the death of naive brain cells were fixed at 0.5, giving an effective combined rate of 1-fold per day, this case reflecting the inability to detect this cell flow given the very large ratio between naive cell numbers in blood versus brain. In all three cases, the lack of fitting was reasonable given the experimental setting, and the introduction of a priori values simplified the sampling of the posterior probabilities for the remaining model parameters, without loss of model fit.
Comparison of tSNE plots: cross entropy tests and dendrograms
or the original and t-SNE space of each tSNE plot, a probability per data point was calculated following the same approach as in the tSNE algorithm. From these point probabilities, the distribution of cross-entropy in the tSNE space relative to the original space was obtained per plot. Then, for each figure panel, all pairwise comparisons between plots were evaluated with Kolmogorov-Smirnov tests on the difference between the cross-entropy distributions. Resulting p values were corrected with the Holm method. Dendrograms were obtained from hierarchical clustering, using as distance the Kolmogorov-Smirnov statistic, that is, the L-infinity distance between the cross-entropy distributions (manuscript in preparation).
Additional statistics
Comparisons between two groups were performed using unpaired two-tailed Student’s t tests. Post hoc Holm’s, or Sidak’s multiple comparisons test was performed when required. Two-way ANOVA was used when appropriate. Curves of best fit and the resultant dwell times were calculated using robust regression one phase decay with Y0 set at 0 and the plateau set to 50. Statistical differences between parabiotic groups were analyzed using mixed model ANOVA with Tukey’s multiple comparison testing. The value of n reported within figure legends represents number of animals. Values are represented as mean ± SEM, with differences considered significant when p < 0.05.
Acknowledgments
The authors acknowledge Rachael Walker and the Babraham Institute Flow Cytometry Core, Pier-Andrée Penttila and the KUL FACS Core, Simon Walker and the Babraham Institute Imaging Core, Sebastian Munck and the VIB BioImaging Core, Dietmar Thal (KUL) for anatomical advice, Sonia Agüera for scientific illustrations, Chloë Verspecht (VIB), David Posner (Babraham Institute), Madhu V Seelam (VIB), and Steffie Junius (VIB) for technical help, Lars Vereecke (VIB), Alexander Rudensky (Sloan Kettering), Michelle Linterman (Babraham Institute), Rahul Roychoudhuri (Babraham Institute), Martin Turner (Babraham Institute), Roland Liblau (INSERM), and Anne Dejean (INSERM) for the provision mice. This work was supported by the VIB, the KUL, the Rega Institute, the ERC Consolidator Grant TissueTreg (to A.L.), Alzheimer’s Association Research Grant (to A.L.), the ERC Advanced Grant CellPhase AD (to B.D.S.), and the Biotechnology and Biological Sciences Research Council (BBSRC) through Institute Strategic Program Grant funding (BBS/E/B/000C0427 and BBS/E/B/000C0428), and the BBSRC Core Capability Grant to the Babraham Institute. E.P. and V.L. were supported by fellowships from the FWO. R.M. was supported by the AARF.
Author Contributions
Conceptualization, E.P. and A.L.; Methodology, E.P., O.T.B., C.P.R., B.D.S., D.C.F., J.D., and A.L.; Software, C.P.R. and V.L.; Formal Analysis, E.P., O.T.B., C.P.R., V.L., and R.Y.T.; Investigation, E.P., O.T.B., W.D.R., R.M., L.K., Z.C.-V., A.G.d.l.F., T.P., L.G.M., A.B., C.E.W., L.Y., A.M.-M., M.N., A.Y., A.M., P.L., S.P., and J.D.; Resources, T.T.; Data Curation, C.P.R. and V.L.; Writing – Original Draft, A.L.; Writing – Review & Editing, E.P., O.T.B., C.P.R., L.Y., and A.L.; Visualization, E.P., O.T.B., C.P.R., J.D., and A.L.; Supervision, J.R., B.D.S., D.C.F., and A.L.; Project Administration and Funding Acquisition, A.L.
Declaration of Interests
The authors declare no competing interests.
Published: July 22, 2020
Footnotes
Supplemental Information can be found online at https://doi.org/10.1016/j.cell.2020.06.026.
A video abstract is available at https://doi.org/10.1016/j.cell.2020.06.026#mmc10.
Supplemental Information
References
- Attaai A., Neidert N., von Ehr A., Potru P.S., Zöller T., Spittau B. Postnatal maturation of microglia is associated with alternative activation and activated TGFβ signaling. Glia. 2018;66:1695–1708. doi: 10.1002/glia.23332. [DOI] [PubMed] [Google Scholar]
- Baruch K., Rosenzweig N., Kertser A., Deczkowska A., Sharif A.M., Spinrad A., Tsitsou-Kampeli A., Sarel A., Cahalon L., Schwartz M. Breaking immune tolerance by targeting Foxp3(+) regulatory T cells mitigates Alzheimer’s disease pathology. Nat. Commun. 2015;6:7967. doi: 10.1038/ncomms8967. [DOI] [PMC free article] [PubMed] [Google Scholar]
- Bechmann I., Galea I., Perry V.H. What is the blood-brain barrier (not)? Trends Immunol. 2007;28:5–11. doi: 10.1016/j.it.2006.11.007. [DOI] [PubMed] [Google Scholar]
- Belichenko P.V., Kleschevnikov A.M., Salehi A., Epstein C.J., Mobley W.C. Synaptic and cognitive abnormalities in mouse models of Down syndrome: exploring genotype-phenotype relationships. J. Comp. Neurol. 2007;504:329–345. doi: 10.1002/cne.21433. [DOI] [PubMed] [Google Scholar]
- Benjamini Y., Hochberg Y. Controlling the False Discovery Rate - a Practical and Powerful Approach to Multiple Testing. J. R. Stat. Soc. B. 1995;57:289–300. [Google Scholar]
- Blank T., Detje C.N., Spieß A., Hagemeyer N., Brendecke S.M., Wolfart J., Staszewski O., Zöller T., Papageorgiou I., Schneider J. Brain Endothelial- and Epithelial-Specific Interferon Receptor Chain 1 Drives Virus-Induced Sickness Behavior and Cognitive Impairment. Immunity. 2016;44:901–912. doi: 10.1016/j.immuni.2016.04.005. [DOI] [PubMed] [Google Scholar]
- Bohlen C.J., Bennett F.C., Tucker A.F., Collins H.Y., Mulinyawe S.B., Barres B.A. Diverse Requirements for Microglial Survival, Specification, and Function Revealed by Defined-Medium Cultures. Neuron. 2017;94:759–773. doi: 10.1016/j.neuron.2017.04.043. [DOI] [PMC free article] [PubMed] [Google Scholar]
- Brachman R.A., Lehmann M.L., Maric D., Herkenham M. Lymphocytes from chronically stressed mice confer antidepressant-like effects to naive mice. J. Neurosci. 2015;35:1530–1538. doi: 10.1523/JNEUROSCI.2278-14.2015. [DOI] [PMC free article] [PubMed] [Google Scholar]
- Brochard V., Combadière B., Prigent A., Laouar Y., Perrin A., Beray-Berthat V., Bonduelle O., Alvarez-Fischer D., Callebert J., Launay J.M. Infiltration of CD4+ lymphocytes into the brain contributes to neurodegeneration in a mouse model of Parkinson disease. J. Clin. Invest. 2009;119:182–192. doi: 10.1172/JCI36470. [DOI] [PMC free article] [PubMed] [Google Scholar]
- Butler A., Hoffman P., Smibert P., Papalexi E., Satija R. Integrating single-cell transcriptomic data across different conditions, technologies, and species. Nat. Biotechnol. 2018;36:411–420. doi: 10.1038/nbt.4096. [DOI] [PMC free article] [PubMed] [Google Scholar]
- Callaerts-Vegh Z., Beckers T., Ball S.M., Baeyens F., Callaerts P.F., Cryan J.F., Molnar E., D’Hooge R. Concomitant deficits in working memory and fear extinction are functionally dissociated from reduced anxiety in metabotropic glutamate receptor 7-deficient mice. J. Neurosci. 2006;26:6573–6582. doi: 10.1523/JNEUROSCI.1497-06.2006. [DOI] [PMC free article] [PubMed] [Google Scholar]
- Callahan B.J., McMurdie P.J., Rosen M.J., Han A.W., Johnson A.J., Holmes S.P. DADA2: High-resolution sample inference from Illumina amplicon data. Nat. Methods. 2016;13:581–583. doi: 10.1038/nmeth.3869. [DOI] [PMC free article] [PubMed] [Google Scholar]
- Choi G.B., Yim Y.S., Wong H., Kim S., Kim H., Kim S.V., Hoeffer C.A., Littman D.R., Huh J.R. The maternal interleukin-17a pathway in mice promotes autism-like phenotypes in offspring. Science. 2016;351:933–939. doi: 10.1126/science.aad0314. [DOI] [PMC free article] [PubMed] [Google Scholar]
- Codarri L., Gyülvészi G., Tosevski V., Hesske L., Fontana A., Magnenat L., Suter T., Becher B. RORγt drives production of the cytokine GM-CSF in helper T cells, which is essential for the effector phase of autoimmune neuroinflammation. Nat. Immunol. 2011;12:560–567. doi: 10.1038/ni.2027. [DOI] [PubMed] [Google Scholar]
- Cronk J.C., Filiano A.J., Louveau A., Marin I., Marsh R., Ji E., Goldman D.H., Smirnov I., Geraci N., Acton S. Peripherally derived macrophages can engraft the brain independent of irradiation and maintain an identity distinct from microglia. J. Exp. Med. 2018;215:1627–1647. doi: 10.1084/jem.20180247. [DOI] [PMC free article] [PubMed] [Google Scholar]
- Cunningham C.L., Martínez-Cerdeño V., Noctor S.C. Microglia regulate the number of neural precursor cells in the developing cerebral cortex. J. Neurosci. 2013;33:4216–4233. doi: 10.1523/JNEUROSCI.3441-12.2013. [DOI] [PMC free article] [PubMed] [Google Scholar]
- Cushman J., Lo J., Huang Z., Wasserfall C., Petitto J.M. Neurobehavioral changes resulting from recombinase activation gene 1 deletion. Clin. Diagn. Lab. Immunol. 2003;10:13–18. doi: 10.1128/CDLI.10.1.13-18.2003. [DOI] [PMC free article] [PubMed] [Google Scholar]
- D’Hooge R., De Deyn P.P. Applications of the Morris water maze in the study of learning and memory. Brain Res. Brain Res. Rev. 2001;36:60–90. doi: 10.1016/s0165-0173(01)00067-4. [DOI] [PubMed] [Google Scholar]
- Da Mesquita S., Louveau A., Vaccari A., Smirnov I., Cornelison R.C., Kingsmore K.M., Contarino C., Onengut-Gumuscu S., Farber E., Raper D. Functional aspects of meningeal lymphatics in ageing and Alzheimer’s disease. Nature. 2018;560:185–191. doi: 10.1038/s41586-018-0368-8. [DOI] [PMC free article] [PubMed] [Google Scholar]
- Dansokho C., Ait Ahmed D., Aid S., Toly-Ndour C., Chaigneau T., Calle V., Cagnard N., Holzenberger M., Piaggio E., Aucouturier P., Dorothée G. Regulatory T cells delay disease progression in Alzheimer-like pathology. Brain. 2016;139:1237–1251. doi: 10.1093/brain/awv408. [DOI] [PubMed] [Google Scholar]
- Deacon R. Assessing burrowing, nest construction, and hoarding in mice. J. Vis. Exp. 2012;5:e2607. doi: 10.3791/2607. [DOI] [PMC free article] [PubMed] [Google Scholar]
- Derecki N.C., Cardani A.N., Yang C.H., Quinnies K.M., Crihfield A., Lynch K.R., Kipnis J. Regulation of learning and memory by meningeal immunity: a key role for IL-4. J. Exp. Med. 2010;207:1067–1080. doi: 10.1084/jem.20091419. [DOI] [PMC free article] [PubMed] [Google Scholar]
- Dodiya H.B., Kuntz T., Shaik S.M., Baufeld C., Leibowitz J., Zhang X., Gottel N., Zhang X., Butovsky O., Gilbert J.A., Sisodia S.S. Sex-specific effects of microbiome perturbations on cerebral Aβ amyloidosis and microglia phenotypes. J. Exp. Med. 2019;216:1542–1560. doi: 10.1084/jem.20182386. [DOI] [PMC free article] [PubMed] [Google Scholar]
- Dulken B.W., Buckley M.T., Navarro Negredo P., Saligrama N., Cayrol R., Leeman D.S., George B.M., Boutet S.C., Hebestreit K., Pluvinage J.V. Single-cell analysis reveals T cell infiltration in old neurogenic niches. Nature. 2019;571:205–210. doi: 10.1038/s41586-019-1362-5. [DOI] [PMC free article] [PubMed] [Google Scholar]
- Ellenberg L., Liu Q., Gioia G., Yasui Y., Packer R.J., Mertens A., Donaldson S.S., Stovall M., Kadan-Lottick N., Armstrong G. Neurocognitive status in long-term survivors of childhood CNS malignancies: a report from the Childhood Cancer Survivor Study. Neuropsychology. 2009;23:705–717. doi: 10.1037/a0016674. [DOI] [PMC free article] [PubMed] [Google Scholar]
- Engelhardt B., Ransohoff R.M. Capture, crawl, cross: the T cell code to breach the blood-brain barriers. Trends Immunol. 2012;33:579–589. doi: 10.1016/j.it.2012.07.004. [DOI] [PubMed] [Google Scholar]
- Engelhardt B., Carare R.O., Bechmann I., Flügel A., Laman J.D., Weller R.O. Vascular, glial, and lymphatic immune gateways of the central nervous system. Acta Neuropathol. 2016;132:317–338. doi: 10.1007/s00401-016-1606-5. [DOI] [PMC free article] [PubMed] [Google Scholar]
- Erny D., Hrabě de Angelis A.L., Jaitin D., Wieghofer P., Staszewski O., David E., Keren-Shaul H., Mahlakoiv T., Jakobshagen K., Buch T. Host microbiota constantly control maturation and function of microglia in the CNS. Nat. Neurosci. 2015;18:965–977. doi: 10.1038/nn.4030. [DOI] [PMC free article] [PubMed] [Google Scholar]
- Fan K.Q., Li Y.Y., Wang H.L., Mao X.T., Guo J.X., Wang F., Huang L.J., Li Y.N., Ma X.Y., Gao Z.J. Stress-Induced Metabolic Disorder in Peripheral CD4(+) T Cells Leads to Anxiety-like Behavior. Cell. 2019;179:864–879. doi: 10.1016/j.cell.2019.10.001. [DOI] [PubMed] [Google Scholar]
- Filiano A.J., Xu Y., Tustison N.J., Marsh R.L., Baker W., Smirnov I., Overall C.C., Gadani S.P., Turner S.D., Weng Z. Unexpected role of interferon-γ in regulating neuronal connectivity and social behaviour. Nature. 2016;535:425–429. doi: 10.1038/nature18626. [DOI] [PMC free article] [PubMed] [Google Scholar]
- Hammond T.R., Dufort C., Dissing-Olesen L., Giera S., Young A., Wysoker A., Walker A.J., Gergits F., Segel M., Nemesh J. Single-Cell RNA Sequencing of Microglia throughout the Mouse Lifespan and in the Injured Brain Reveals Complex Cell-State Changes. Immunity. 2019;50:253–271. doi: 10.1016/j.immuni.2018.11.004. [DOI] [PMC free article] [PubMed] [Google Scholar]
- Harris T.H., Banigan E.J., Christian D.A., Konradt C., Tait Wojno E.D., Norose K., Wilson E.H., John B., Weninger W., Luster A.D. Generalized Lévy walks and the role of chemokines in migration of effector CD8+ T cells. Nature. 2012;486:545–548. doi: 10.1038/nature11098. [DOI] [PMC free article] [PubMed] [Google Scholar]
- Hartmann F.J., Bernard-Valnet R., Quériault C., Mrdjen D., Weber L.M., Galli E., Krieg C., Robinson M.D., Nguyen X.H., Dauvilliers Y. High-dimensional single-cell analysis reveals the immune signature of narcolepsy. J. Exp. Med. 2016;213:2621–2633. doi: 10.1084/jem.20160897. [DOI] [PMC free article] [PubMed] [Google Scholar]
- Herisson F., Frodermann V., Courties G., Rohde D., Sun Y., Vandoorne K., Wojtkiewicz G.R., Masson G.S., Vinegoni C., Kim J. Direct vascular channels connect skull bone marrow and the brain surface enabling myeloid cell migration. Nat. Neurosci. 2018;21:1209–1217. doi: 10.1038/s41593-018-0213-2. [DOI] [PMC free article] [PubMed] [Google Scholar]
- Hickey W.F. Migration of hematogenous cells through the blood-brain barrier and the initiation of CNS inflammation. Brain Pathol. 1991;1:97–105. doi: 10.1111/j.1750-3639.1991.tb00646.x. [DOI] [PubMed] [Google Scholar]
- Hickey W.F. Leukocyte traffic in the central nervous system: the participants and their roles. Semin. Immunol. 1999;11:125–137. doi: 10.1006/smim.1999.0168. [DOI] [PubMed] [Google Scholar]
- Hildebrand F., Tadeo R., Voigt A.Y., Bork P., Raes J. LotuS: an efficient and user-friendly OTU processing pipeline. Microbiome. 2014;2:30. doi: 10.1186/2049-2618-2-30. [DOI] [PMC free article] [PubMed] [Google Scholar]
- Holtman I.R., Skola D., Glass C.K. Transcriptional control of microglia phenotypes in health and disease. J. Clin. Invest. 2017;127:3220–3229. doi: 10.1172/JCI90604. [DOI] [PMC free article] [PubMed] [Google Scholar]
- Hsiao E.Y., McBride S.W., Hsien S., Sharon G., Hyde E.R., McCue T., Codelli J.A., Chow J., Reisman S.E., Petrosino J.F. Microbiota modulate behavioral and physiological abnormalities associated with neurodevelopmental disorders. Cell. 2013;155:1451–1463. doi: 10.1016/j.cell.2013.11.024. [DOI] [PMC free article] [PubMed] [Google Scholar]
- Ito M., Komai K., Mise-Omata S., Iizuka-Koga M., Noguchi Y., Kondo T., Sakai R., Matsuo K., Nakayama T., Yoshie O. Brain regulatory T cells suppress astrogliosis and potentiate neurological recovery. Nature. 2019;565:246–250. doi: 10.1038/s41586-018-0824-5. [DOI] [PubMed] [Google Scholar]
- Jansson A. A mathematical framework for analyzing T cell receptor scanning of peptides. Biophys. J. 2010;99:2717–2725. doi: 10.1016/j.bpj.2010.08.024. [DOI] [PMC free article] [PubMed] [Google Scholar]
- Jiang M., Ash R.T., Baker S.A., Suter B., Ferguson A., Park J., Rudy J., Torsky S.P., Chao H.T., Zoghbi H.Y., Smirnakis S.M. Dendritic arborization and spine dynamics are abnormal in the mouse model of MECP2 duplication syndrome. J. Neurosci. 2013;33:19518–19533. doi: 10.1523/JNEUROSCI.1745-13.2013. [DOI] [PMC free article] [PubMed] [Google Scholar]
- Kang D.W., Adams J.B., Gregory A.C., Borody T., Chittick L., Fasano A., Khoruts A., Geis E., Maldonado J., McDonough-Means S. Microbiota Transfer Therapy alters gut ecosystem and improves gastrointestinal and autism symptoms: an open-label study. Microbiome. 2017;5:10. doi: 10.1186/s40168-016-0225-7. [DOI] [PMC free article] [PubMed] [Google Scholar]
- Kawahara K., Suenobu M., Yoshida A., Koga K., Hyodo A., Ohtsuka H., Kuniyasu A., Tamamaki N., Sugimoto Y., Nakayama H. Intracerebral microinjection of interleukin-4/interleukin-13 reduces β-amyloid accumulation in the ipsilateral side and improves cognitive deficits in young amyloid precursor protein 23 mice. Neuroscience. 2012;207:243–260. doi: 10.1016/j.neuroscience.2012.01.049. [DOI] [PubMed] [Google Scholar]
- Keren-Shaul H., Spinrad A., Weiner A., Matcovitch-Natan O., Dvir-Szternfeld R., Ulland T.K., David E., Baruch K., Lara-Astaiso D., Toth B. A Unique Microglia Type Associated with Restricting Development of Alzheimer’s Disease. Cell. 2017;169:1276–1290. doi: 10.1016/j.cell.2017.05.018. [DOI] [PubMed] [Google Scholar]
- Kim S., Kim H., Yim Y.S., Ha S., Atarashi K., Tan T.G., Longman R.S., Honda K., Littman D.R., Choi G.B., Huh J.R. Maternal gut bacteria promote neurodevelopmental abnormalities in mouse offspring. Nature. 2017;549:528–532. doi: 10.1038/nature23910. [DOI] [PMC free article] [PubMed] [Google Scholar]
- Kipnis J. Immune system: The “seventh sense”. J. Exp. Med. 2018;215:397–398. doi: 10.1084/jem.20172295. [DOI] [PMC free article] [PubMed] [Google Scholar]
- Kipnis J., Cohen H., Cardon M., Ziv Y., Schwartz M. T cell deficiency leads to cognitive dysfunction: implications for therapeutic vaccination for schizophrenia and other psychiatric conditions. Proc. Natl. Acad. Sci. USA. 2004;101:8180–8185. doi: 10.1073/pnas.0402268101. [DOI] [PMC free article] [PubMed] [Google Scholar]
- Kipnis J., Gadani S., Derecki N.C. Pro-cognitive properties of T cells. Nat. Rev. Immunol. 2012;12:663–669. doi: 10.1038/nri3280. [DOI] [PMC free article] [PubMed] [Google Scholar]
- Komuczki J., Tuzlak S., Friebel E., Hartwig T., Spath S., Rosenstiel P., Waisman A., Opitz L., Oukka M., Schreiner B. Fate-Mapping of GM-CSF Expression Identifies a Discrete Subset of Inflammation-Driving T Helper Cells Regulated by Cytokines IL-23 and IL-1beta. Immunity. 2019;50:1289–1304. doi: 10.1016/j.immuni.2019.04.006. [DOI] [PubMed] [Google Scholar]
- Korin B., Ben-Shaanan T.L., Schiller M., Dubovik T., Azulay-Debby H., Boshnak N.T., Koren T., Rolls A. High-dimensional, single-cell characterization of the brain’s immune compartment. Nat. Neurosci. 2017;20:1300–1309. doi: 10.1038/nn.4610. [DOI] [PubMed] [Google Scholar]
- Lambert J.C., Ibrahim-Verbaas C.A., Harold D., Naj A.C., Sims R., Bellenguez C., DeStafano A.L., Bis J.C., Beecham G.W., Grenier-Boley B., European Alzheimer’s Disease Initiative (EADI) Genetic and Environmental Risk in Alzheimer’s Disease. Alzheimer’s Disease Genetic Consortium. Cohorts for Heart and Aging Research in Genomic Epidemiology Meta-analysis of 74,046 individuals identifies 11 new susceptibility loci for Alzheimer’s disease. Nat. Genet. 2013;45:1452–1458. doi: 10.1038/ng.2802. [DOI] [PMC free article] [PubMed] [Google Scholar]
- Latorre D., Kallweit U., Armentani E., Foglierini M., Mele F., Cassotta A., Jovic S., Jarrossay D., Mathis J., Zellini F. T cells in patients with narcolepsy target self-antigens of hypocretin neurons. Nature. 2018;562:63–68. doi: 10.1038/s41586-018-0540-1. [DOI] [PubMed] [Google Scholar]
- Lee H., Brott B.K., Kirkby L.A., Adelson J.D., Cheng S., Feller M.B., Datwani A., Shatz C.J. Synapse elimination and learning rules co-regulated by MHC class I H2-Db. Nature. 2014;509:195–200. doi: 10.1038/nature13154. [DOI] [PMC free article] [PubMed] [Google Scholar]
- Liberzon A. A description of the Molecular Signatures Database (MSigDB) Web site. Methods Mol. Biol. 2014;1150:153–160. doi: 10.1007/978-1-4939-0512-6_9. [DOI] [PubMed] [Google Scholar]
- Liston A., Nutsch K.M., Farr A.G., Lund J.M., Rasmussen J.P., Koni P.A., Rudensky A.Y. Differentiation of regulatory Foxp3+ T cells in the thymic cortex. Proc. Natl. Acad. Sci. USA. 2008;105:11903–11908. doi: 10.1073/pnas.0801506105. [DOI] [PMC free article] [PubMed] [Google Scholar]
- Liu Z.H., Chuang D.M., Smith C.B. Lithium ameliorates phenotypic deficits in a mouse model of fragile X syndrome. Int. J. Neuropsychopharmacol. 2011;14:618–630. doi: 10.1017/S1461145710000520. [DOI] [PMC free article] [PubMed] [Google Scholar]
- Liu Y., Carlsson R., Comabella M., Wang J., Kosicki M., Carrion B., Hasan M., Wu X., Montalban X., Dziegiel M.H. FoxA1 directs the lineage and immunosuppressive properties of a novel regulatory T cell population in EAE and MS. Nat. Med. 2014;20:272–282. doi: 10.1038/nm.3485. [DOI] [PubMed] [Google Scholar]
- López-Serrano C., Santos-Nogueira E., Francos-Quijorna I., Coll-Miró M., Chun J., López-Vales R. Lysophosphatidic acid receptor type 2 activation contributes to secondary damage after spinal cord injury in mice. Brain Behav. Immun. 2019;76:258–267. doi: 10.1016/j.bbi.2018.12.007. [DOI] [PMC free article] [PubMed] [Google Scholar]
- Louveau A., Smirnov I., Keyes T.J., Eccles J.D., Rouhani S.J., Peske J.D., Derecki N.C., Castle D., Mandell J.W., Lee K.S. Structural and functional features of central nervous system lymphatic vessels. Nature. 2015;523:337–341. doi: 10.1038/nature14432. [DOI] [PMC free article] [PubMed] [Google Scholar]
- Mackay L.K., Stock A.T., Ma J.Z., Jones C.M., Kent S.J., Mueller S.N., Heath W.R., Carbone F.R., Gebhardt T. Long-lived epithelial immunity by tissue-resident memory T (TRM) cells in the absence of persisting local antigen presentation. Proc. Natl. Acad. Sci. USA. 2012;109:7037–7042. doi: 10.1073/pnas.1202288109. [DOI] [PMC free article] [PubMed] [Google Scholar]
- Madsen L., Labrecque N., Engberg J., Dierich A., Svejgaard A., Benoist C., Mathis D., Fugger L. Mice lacking all conventional MHC class II genes. Proc. Natl. Acad. Sci. USA. 1999;96:10338–10343. doi: 10.1073/pnas.96.18.10338. [DOI] [PMC free article] [PubMed] [Google Scholar]
- Mancuso R., Van Den Daele J., Fattorelli N., Wolfs L., Balusu S., Burton O., Liston A., Sierksma A., Fourne Y., Poovathingal S. Stem-cell-derived human microglia transplanted in mouse brain to study human disease. Nat. Neurosci. 2019;22:2111–2116. doi: 10.1038/s41593-019-0525-x. [DOI] [PubMed] [Google Scholar]
- Matcovitch-Natan O., Winter D.R., Giladi A., Vargas Aguilar S., Spinrad A., Sarrazin S., Ben-Yehuda H., David E., Zelada González F., Perrin P. Microglia development follows a stepwise program to regulate brain homeostasis. Science. 2016;353:aad8670. doi: 10.1126/science.aad8670. [DOI] [PubMed] [Google Scholar]
- McMurdie P.J., Holmes S. phyloseq: an R package for reproducible interactive analysis and graphics of microbiome census data. PLoS ONE. 2013;8:e61217. doi: 10.1371/journal.pone.0061217. [DOI] [PMC free article] [PubMed] [Google Scholar]
- Mombaerts P., Clarke A.R., Rudnicki M.A., Iacomini J., Itohara S., Lafaille J.J., Wang L., Ichikawa Y., Jaenisch R., Hooper M.L. Mutations in T-cell antigen receptor genes alpha and beta block thymocyte development at different stages. Nature. 1992;360:225–231. doi: 10.1038/360225a0. [DOI] [PubMed] [Google Scholar]
- Monsonego A., Zota V., Karni A., Krieger J.I., Bar-Or A., Bitan G., Budson A.E., Sperling R., Selkoe D.J., Weiner H.L. Increased T cell reactivity to amyloid beta protein in older humans and patients with Alzheimer disease. J. Clin. Invest. 2003;112:415–422. doi: 10.1172/JCI18104. [DOI] [PMC free article] [PubMed] [Google Scholar]
- Moran A.E., Holzapfel K.L., Xing Y., Cunningham N.R., Maltzman J.S., Punt J., Hogquist K.A. T cell receptor signal strength in Treg and iNKT cell development demonstrated by a novel fluorescent reporter mouse. J. Exp. Med. 2011;208:1279–1289. doi: 10.1084/jem.20110308. [DOI] [PMC free article] [PubMed] [Google Scholar]
- Mrdjen D., Pavlovic A., Hartmann F.J., Schreiner B., Utz S.G., Leung B.P., Lelios I., Heppner F.L., Kipnis J., Merkler D. High-Dimensional Single-Cell Mapping of Central Nervous System Immune Cells Reveals Distinct Myeloid Subsets in Health, Aging, and Disease. Immunity. 2018;48:380–395. doi: 10.1016/j.immuni.2018.01.011. [DOI] [PubMed] [Google Scholar]
- Mundt S., Greter M., Flügel A., Becher B. The CNS Immune Landscape from the Viewpoint of a T Cell. Trends Neurosci. 2019;42:667–679. doi: 10.1016/j.tins.2019.07.008. [DOI] [PubMed] [Google Scholar]
- Nadler J.J., Moy S.S., Dold G., Trang D., Simmons N., Perez A., Young N.B., Barbaro R.P., Piven J., Magnuson T.R., Crawley J.N. Automated apparatus for quantitation of social approach behaviors in mice. Genes Brain Behav. 2004;3:303–314. doi: 10.1111/j.1601-183X.2004.00071.x. [DOI] [PubMed] [Google Scholar]
- Naert A., Callaerts-Vegh Z., D'Hooge R. Nocturnal hyperactivity, increased social novelty preference and delayed extinction of fear responses in post-weaning socially isolated mice. Brain Res. Bull. 2011;85:354–362. doi: 10.1016/j.brainresbull.2011.03.027. [DOI] [PubMed] [Google Scholar]
- Oksanen J., Kindt R., Legendre P., O’Hara B., Stevens M.H.H. The vegan package. Community Ecology Package. 2007;10:631–637. [Google Scholar]
- Olin A., Henckel E., Chen Y., Lakshmikanth T., Pou C., Mikes J., Gustafsson A., Bernhardsson A.K., Zhang C., Bohlin K. Stereotypic Immune System Development in Newborn Children. Cell. 2018;174:1277–1292. doi: 10.1016/j.cell.2018.06.045. [DOI] [PMC free article] [PubMed] [Google Scholar]
- Oprica M., Hjorth E., Spulber S., Popescu B.O., Ankarcrona M., Winblad B., Schultzberg M. Studies on brain volume, Alzheimer-related proteins and cytokines in mice with chronic overexpression of IL-1 receptor antagonist. J. Cell Mol. Med. 2007;11:810–825. doi: 10.1111/j.1582-4934.2007.00074.x. [DOI] [PMC free article] [PubMed] [Google Scholar]
- Pak D.T., Yang S., Rudolph-Correia S., Kim E., Sheng M. Regulation of dendritic spine morphology by SPAR, a PSD-95-associated RapGAP. Neuron. 2001;31:289–303. doi: 10.1016/s0896-6273(01)00355-5. [DOI] [PubMed] [Google Scholar]
- Paolicelli R.C., Bolasco G., Pagani F., Maggi L., Scianni M., Panzanelli P., Giustetto M., Ferreira T.A., Guiducci E., Dumas L. Synaptic pruning by microglia is necessary for normal brain development. Science. 2011;333:1456–1458. doi: 10.1126/science.1202529. [DOI] [PubMed] [Google Scholar]
- Petitto J.M., McNamara R.K., Gendreau P.L., Huang Z., Jackson A.J. Impaired learning and memory and altered hippocampal neurodevelopment resulting from interleukin-2 gene deletion. J. Neurosci. Res. 1999;56:441–446. doi: 10.1002/(SICI)1097-4547(19990515)56:4<441::AID-JNR11>3.0.CO;2-G. [DOI] [PubMed] [Google Scholar]
- Qiu X., Mao Q., Tang Y., Wang L., Chawla R., Pliner H.A., Trapnell C. Reversed graph embedding resolves complex single-cell trajectories. Nat. Methods. 2017;14:979–982. doi: 10.1038/nmeth.4402. [DOI] [PMC free article] [PubMed] [Google Scholar]
- R Development Core Team . R Foundation for Statistical Computing; 2014. R: A language and environment for statistical computing. [Google Scholar]
- Radjavi A., Smirnov I., Kipnis J. Brain antigen-reactive CD4+ T cells are sufficient to support learning behavior in mice with limited T cell repertoire. Brain Behav. Immun. 2014;35:58–63. doi: 10.1016/j.bbi.2013.08.013. [DOI] [PMC free article] [PubMed] [Google Scholar]
- Rattazzi L., Piras G., Ono M., Deacon R., Pariante C.M., D’Acquisto F. CD4+ but not CD8+ T cells revert the impaired emotional behavior of immunocompromised RAG-1-deficient mice. Transl. Psychiatry. 2013;3:e280. doi: 10.1038/tp.2013.54. [DOI] [PMC free article] [PubMed] [Google Scholar]
- Rattazzi L., Cariboni A., Poojara R., Shoenfeld Y., D’Acquisto F. Impaired sense of smell and altered olfactory system in RAG-1(-∕-) immunodeficient mice. Front. Neurosci. 2015;9:318. doi: 10.3389/fnins.2015.00318. [DOI] [PMC free article] [PubMed] [Google Scholar]
- Rojo R., Raper A., Ozdemir D.D., Lefevre L., Grabert K., Wollscheid-Lengeling E., Bradford B., Caruso M., Gazova I., Sánchez A. Deletion of a Csf1r enhancer selectively impacts CSF1R expression and development of tissue macrophage populations. Nat. Commun. 2019;10:3215. doi: 10.1038/s41467-019-11053-8. [DOI] [PMC free article] [PubMed] [Google Scholar]
- Seabold G.K., Daunais J.B., Rau A., Grant K.A., Alvarez V.A. DiOLISTIC labeling of neurons from rodent and non-human primate brain slices. J. Vis. Exp. 2010;(41):2081. doi: 10.3791/2081. [DOI] [PMC free article] [PubMed] [Google Scholar]
- Sharon G., Sampson T.R., Geschwind D.H., Mazmanian S.K. The Central Nervous System and the Gut Microbiome. Cell. 2016;167:915–932. doi: 10.1016/j.cell.2016.10.027. [DOI] [PMC free article] [PubMed] [Google Scholar]
- Sharon G., Cruz N.J., Kang D.W., Gandal M.J., Wang B., Kim Y.M., Zink E.M., Casey C.P., Taylor B.C., Lane C.J. Human Gut Microbiota from Autism Spectrum Disorder Promote Behavioral Symptoms in Mice. Cell. 2019;177:1600–1618. doi: 10.1016/j.cell.2019.05.004. [DOI] [PMC free article] [PubMed] [Google Scholar]
- Sierra A., Encinas J.M., Deudero J.J., Chancey J.H., Enikolopov G., Overstreet-Wadiche L.S., Tsirka S.E., Maletic-Savatic M. Microglia shape adult hippocampal neurogenesis through apoptosis-coupled phagocytosis. Cell Stem Cell. 2010;7:483–495. doi: 10.1016/j.stem.2010.08.014. [DOI] [PMC free article] [PubMed] [Google Scholar]
- Smolders J., Heutinck K.M., Fransen N.L., Remmerswaal E.B.M., Hombrink P., Ten Berge I.J.M., van Lier R.A.W., Huitinga I., Hamann J. Tissue-resident memory T cells populate the human brain. Nat. Commun. 2018;9:4593. doi: 10.1038/s41467-018-07053-9. [DOI] [PMC free article] [PubMed] [Google Scholar]
- Song C., Nicholson J.D., Clark S.M., Li X., Keegan A.D., Tonelli L.H. Expansion of brain T cells in homeostatic conditions in lymphopenic Rag2(-/-) mice. Brain Behav. Immun. 2016;57:161–172. doi: 10.1016/j.bbi.2016.03.017. [DOI] [PMC free article] [PubMed] [Google Scholar]
- Spinelli L., Carpentier S., Montañana Sanchis F., Dalod M., Vu Manh T.P. BubbleGUM: automatic extraction of phenotype molecular signatures and comprehensive visualization of multiple Gene Set Enrichment Analyses. BMC Genomics. 2015;16:814. doi: 10.1186/s12864-015-2012-4. [DOI] [PMC free article] [PubMed] [Google Scholar]
- Stan Development Team (2018). RStan: the R interface to Stan. http://mc-stan.org.
- Stellwagen D., Malenka R.C. Synaptic scaling mediated by glial TNF-alpha. Nature. 2006;440:1054–1059. doi: 10.1038/nature04671. [DOI] [PubMed] [Google Scholar]
- Stuart T., Butler A., Hoffman P., Hafemeister C., Papalexi E., Mauck W.M., 3rd, Hao Y., Stoeckius M., Smibert P., Satija R. Comprehensive Integration of Single-Cell Data. Cell. 2019;177:1888–1902. doi: 10.1016/j.cell.2019.05.031. [DOI] [PMC free article] [PubMed] [Google Scholar]
- Subramanian A., Tamayo P., Mootha V.K., Mukherjee S., Ebert B.L., Gillette M.A., Paulovich A., Pomeroy S.L., Golub T.R., Lander E.S., Mesirov J.P. Gene set enrichment analysis: a knowledge-based approach for interpreting genome-wide expression profiles. Proc. Natl. Acad. Sci. USA. 2005;102:15545–15550. doi: 10.1073/pnas.0506580102. [DOI] [PMC free article] [PubMed] [Google Scholar]
- Thion M.S., Low D., Silvin A., Chen J., Grisel P., Schulte-Schrepping J., Blecher R., Ulas T., Squarzoni P., Hoeffel G. Microbiome Influences Prenatal and Adult Microglia in a Sex-Specific Manner. Cell. 2018;172:500–516. doi: 10.1016/j.cell.2017.11.042. [DOI] [PMC free article] [PubMed] [Google Scholar]
- Titman P., Pink E., Skucek E., O’Hanlon K., Cole T.J., Gaspar J., Xu-Bayford J., Jones A., Thrasher A.J., Davies E.G. Cognitive and behavioral abnormalities in children after hematopoietic stem cell transplantation for severe congenital immunodeficiencies. Blood. 2008;112:3907–3913. doi: 10.1182/blood-2008-04-151332. [DOI] [PubMed] [Google Scholar]
- Tito R.Y., Chaffron S., Caenepeel C., Lima-Mendez G., Wang J., Vieira-Silva S., Falony G., Hildebrand F., Darzi Y., Rymenans L. Population-level analysis of Blastocystis subtype prevalence and variation in the human gut microbiota. Gut. 2019;68:1180–1189. doi: 10.1136/gutjnl-2018-316106. [DOI] [PMC free article] [PubMed] [Google Scholar]
- Trapnell C., Cacchiarelli D., Grimsby J., Pokharel P., Li S., Morse M., Lennon N.J., Livak K.J., Mikkelsen T.S., Rinn J.L. The dynamics and regulators of cell fate decisions are revealed by pseudotemporal ordering of single cells. Nat. Biotechnol. 2014;32:381–386. doi: 10.1038/nbt.2859. [DOI] [PMC free article] [PubMed] [Google Scholar]
- Vainchtein I.D., Chin G., Cho F.S., Kelley K.W., Miller J.G., Chien E.C., Liddelow S.A., Nguyen P.T., Nakao-Inoue H., Dorman L.C. Astrocyte-derived interleukin-33 promotes microglial synapse engulfment and neural circuit development. Science. 2018;359:1269–1273. doi: 10.1126/science.aal3589. [DOI] [PMC free article] [PubMed] [Google Scholar]
- Valles-Colomer M., Falony G., Darzi Y., Tigchelaar E.F., Wang J., Tito R.Y., Schiweck C., Kurilshikov A., Joossens M., Wijmenga C. The neuroactive potential of the human gut microbiota in quality of life and depression. Nat. Microbiol. 2019;4:623–632. doi: 10.1038/s41564-018-0337-x. [DOI] [PubMed] [Google Scholar]
- van Boxelaere M., Clements J., Callaerts P., D’Hooge R., Callaerts-Vegh Z. Unpredictable chronic mild stress differentially impairs social and contextual discrimination learning in two inbred mouse strains. PLoS ONE. 2017;12:e0188537. doi: 10.1371/journal.pone.0188537. [DOI] [PMC free article] [PubMed] [Google Scholar]
- Vasek M.J., Garber C., Dorsey D., Durrant D.M., Bollman B., Soung A., Yu J., Perez-Torres C., Frouin A., Wilton D.K. A complement-microglial axis drives synapse loss during virus-induced memory impairment. Nature. 2016;534:538–543. doi: 10.1038/nature18283. [DOI] [PMC free article] [PubMed] [Google Scholar]
- Wekerle H., Engelhardt B., Risau W., Meyermann R. Interaction of T lymphocytes with cerebral endothelial cells in vitro. Brain Pathol. 1991;1:107–114. doi: 10.1111/j.1750-3639.1991.tb00647.x. [DOI] [PubMed] [Google Scholar]
- Weller R.O., Subash M., Preston S.D., Mazanti I., Carare R.O. Perivascular drainage of amyloid-beta peptides from the brain and its failure in cerebral amyloid angiopathy and Alzheimer’s disease. Brain Pathol. 2008;18:253–266. doi: 10.1111/j.1750-3639.2008.00133.x. [DOI] [PMC free article] [PubMed] [Google Scholar]
- Wilson E.H., Weninger W., Hunter C.A. Trafficking of immune cells in the central nervous system. J. Clin. Invest. 2010;120:1368–1379. doi: 10.1172/JCI41911. [DOI] [PMC free article] [PubMed] [Google Scholar]
- Xie L., Choudhury G.R., Winters A., Yang S.H., Jin K. Cerebral regulatory T cells restrain microglia/macrophage-mediated inflammatory responses via IL-10. Eur. J. Immunol. 2015;45:180–191. doi: 10.1002/eji.201444823. [DOI] [PMC free article] [PubMed] [Google Scholar]
- Zhou Y., Kaiser T., Monteiro P., Zhang X., Van der Goes M.S., Wang D., Barak B., Zeng M., Li C., Lu C. Mice with Shank3 Mutations Associated with ASD and Schizophrenia Display Both Shared and Distinct Defects. Neuron. 2016;89:147–162. doi: 10.1016/j.neuron.2015.11.023. [DOI] [PMC free article] [PubMed] [Google Scholar]
- Ziv Y., Ron N., Butovsky O., Landa G., Sudai E., Greenberg N., Cohen H., Kipnis J., Schwartz M. Immune cells contribute to the maintenance of neurogenesis and spatial learning abilities in adulthood. Nat. Neurosci. 2006;9:268–275. doi: 10.1038/nn1629. [DOI] [PubMed] [Google Scholar]
Associated Data
This section collects any data citations, data availability statements, or supplementary materials included in this article.
Supplementary Materials
3D surface rendering of perfused brain stained for CD4 (green), laminin 4 (red), laminin α1 (white) and DAPI (blue). Representative video of CD4 T cell crossing laminin 4 barrier within midbrain meningeal folds.
3D surface rendering of perfused brain stained for CD4 (green), laminin 4 (red), laminin α1 (white) and DAPI (blue). Representative video of CD4 T cell crossing laminin α1 barrier within midbrain meningeal folds.
3D surface rendering of perfused brain stained for CD4 (green), CD31 (red), GFAP (magenta) and DAPI (blue). Representative images of CD4 T cells enclosed within the glia limitans in the midbrain.
3D surface rendering of perfused brain stained for CD4 (green), CD31 (red), GFAP (magenta) and DAPI (blue). Representative images of CD4 T cells enclosed beyond the glia limitans in the midbrain.
3D surface rendering of perfused brain stained for CD4 (green), CD31 (red), GFAP (magenta) and DAPI (blue). Representative images of CD4 T cells enclosed beyond the glia limitans in the cerebellum.
3D surface rendering of perfused brain stained for CD4 (green), CD31 (red), Iba1 (yellow) and DAPI (blue). Representative images of CD4 T cells in close proximity to microglia in the midbrain.
3D surface rendering of perfused brain stained for CD4 (green), CD31 (red), Iba1 (yellow), and DAPI (blue). Representative images of CD4 T cells in close proximity to microglia in the hindbrain.
Data Availability Statement
The scRNA-seq datasets are deposited in the Genome Expression Omnibus under the accession numbers GSE144038, GSE146165. Data resources 1-7 are available at Mendeley Data (https://doi.org/10.17632/hsmzw47kbg.3). Analyses were performed in R, as detailed below. The Code used for analysis generation is included with the data at Mendeley Data. Additional custom code is currently under preparation for publication. Full description of the theoretical and practical aspects of those novel approaches is included in the methods. The list of R libraries and other analytical software used in this study can be found in the Key Resources Table.