
Figure 2.
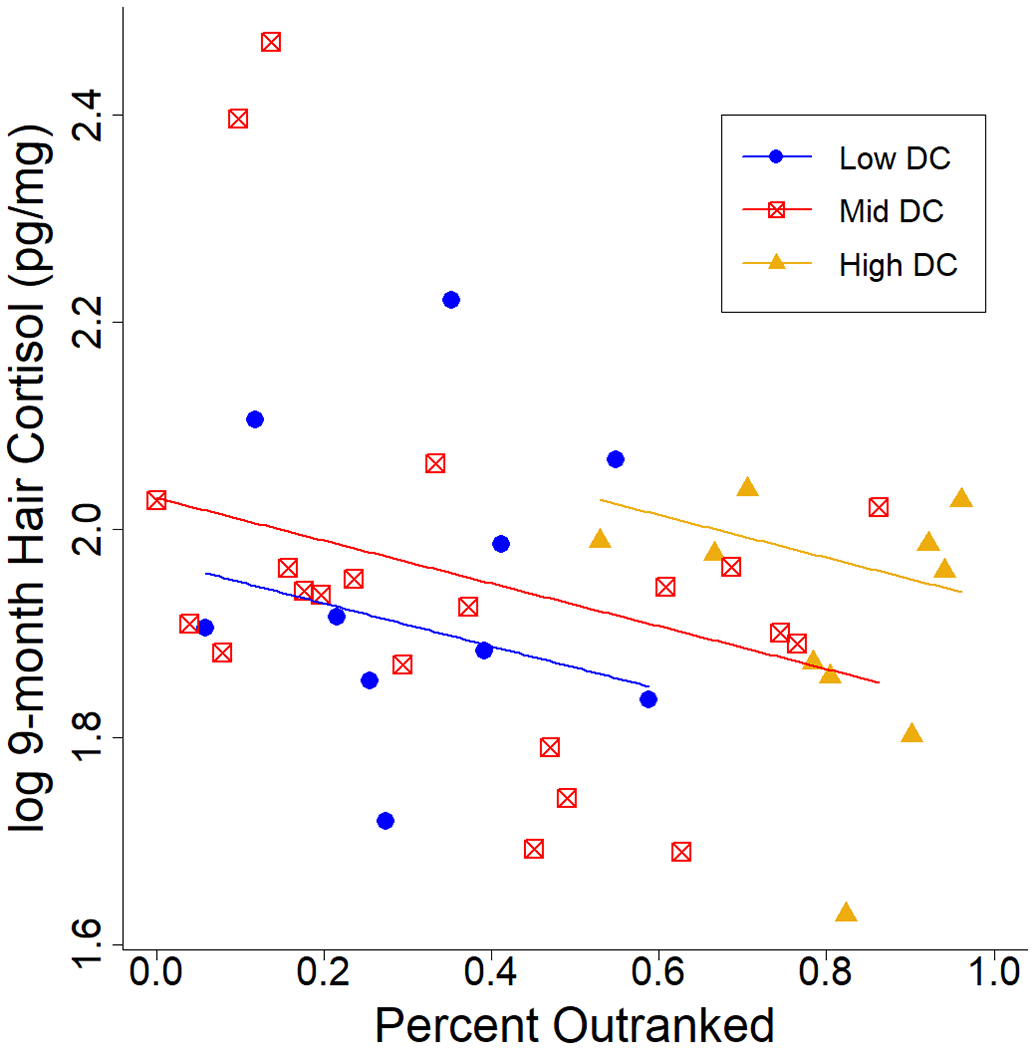
Log 9-month hair cortisol by rank for individuals of different dominance certainties, assuming mean age. Rank is shown here as Percent Outranked, a number between 0 and 1 such that the highest-ranking individual is 1.0 and the lowest-ranking is 0. Colors indicate dominance certainty for highest quartile (yellow), middle two quartiles (red), and lowest quartile (blue). Lines represent model-estimated mean hair cortisol concentrations for the mean dominance certainty in each dominance certainty group. Note that ages vary within each dominance certainty group and dominance certainty is shown here in categories for visualization purposes only.