

Abstract
Background and Aims:
Ventilator setting in the intensive care unit patients is a topic of debate and setting of tidal volume (TV) should be patient-specific based on lung mechanics. In this study, we have evaluated to develop optimal ventilator strategies through continuous and thorough monitoring of respiratory mechanics during ongoing ventilator support to prevent alveolar collapse and alveolar injury in mechanically ventilated patients.
Methods:
In our monocentric, randomized, observational study, we had recruited 60 patients and divided them into two groups of 30 each. In Group 1 patients, TV and positive end-expiratory pressure (PEEP) were set according to pressure–volume (P/V) curve obtained by the mechanical ventilator in a conventional manner (control group), and in Group 2, TV and PEEP were set according to P/V curve obtained by the mechanical ventilator using intratracheal catheter. PEEP and TV were set accordingly. TV, PEEP, and PaO2/FiO2 (P/F) ratio at days 1, 3, and 7, mortality within 7 days and mortality within 28 days were measured in each group and compared.
Results:
We found a significant difference between PEEP and P/F ratio in both groups while intragroup comparison at days 1, 3, and 7. After the intergroup comparison of Group 1 and 2, we observed a significant difference of PEEP and P/F ratio between the groups at day 7 and not on day 1 or 3.
Conclusion:
This study concludes that optimal PEEP is more accurate using an intratracheal catheter than the conventional method of deciding ventilator setting. Hence, it is recommended to use intratracheal catheter to obtain more accurate ventilator settings.
Keywords: Intratracheal catheter, positive end-expiratory pressure, tidal volume, mechanical ventilation
INTRODUCTION
Mechanical ventilation is often life-saving but has the inherent risk of causing damage to lung tissues. Over distension and repetitive collapsing/opening of alveoli should be avoided. Both reduction in tidal volume (TV) and alveolar recruitment may be important to limit ventilator-induced lung injury during mechanical ventilation of patients.
There is strong evidence to support the hypothesis that positive end-expiratory pressure (PEEP) has a protective effect in acute lung injury and probably in the prevention of ventilator-induced lung injury. The research studies have proven that to optimize lung compliance with modern low stretch (low TV) ventilation strategies, the lung needs to be recruited and compliant. PEEP only prevents recruitment. Pressure–volume (P/V) curve helps to determine the optimum PEEP.
The static P/V curve has been regarded as the gold standard tool for the assessment of the mechanical properties of the lung. On this curve, a lower inflection point (LIP) can be detected in some patients, and in most patients, an upper inflection point (UIP) can be seen. The most common interpretation of the LIP and the UIP is that LIP represents the point where alveoli collapse at the end of expiration and reopen at the start of inspiration and the UIP represents the pressure above which alveoli become over distended. It has been proposed that to avoid cyclic closing and opening and overdistension of alveoli, ventilation should be performed with pressures between the LIP and UIP, where the compliance of the lungs is highest.
The SpiroDynamics algorithm (dynostatic curve) provides estimates of the alveolar pressure and three-point lung compliance values from the beginning, middle, and end of the breath. The resulting P/V loops provide an improved view of the patient's lung mechanics, because an intratracheal catheter [Figure 1] reduces the interference caused by the artificial airway's resistance between the ventilator and the patient's lungs.[1,2,3,4,5] P/V curve obtained by a conventional manner is affected by secretions, humidifiers, and other devices attached to the endotracheal tube (ETT). Intratracheal catheter obtains a more accurate assessment of P/V curve and more accurate intervention can be done.[6,7]
Figure 1.
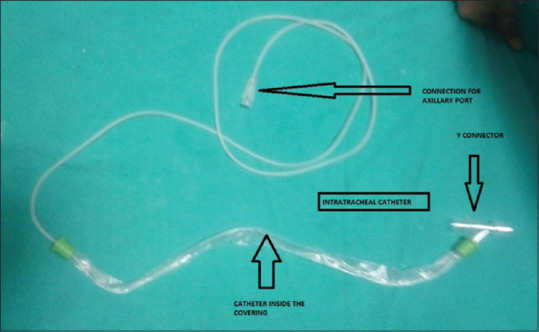
Intratracheal catheter
The aim of our study is to develop optimal ventilator strategies through continuous and thorough monitoring of respiratory mechanics during ongoing ventilatory support and to prevent alveolar injury and collapse in mechanically ventilated patients.
METHODS
Ethical approval for this study was provided by Dr. Ram Manohar Lohia Institute of Medical Sciences, Lucknow, Uttar Pradesh. After taking written informed consent from patients or relatives, the study was conducted in 60 patients between 15 and 65 years, who were having primary illness of pneumonia, sepsis, acute respiratory distress syndrome (ARDS), and respiratory failure, requiring prolong mechanical ventilation (>24 h) with P/F ratio <300, and who are admitted in our intensive care unit over a duration of 18 months. Patients with acute coronary disease, cardiac arrhythmias, intracranial hypertension, bronchopleural fistula, pregnancy, BMI >35, chronic obstructive pulmonary disease, and restrictive lung diseases and patients with a high risk of mortality within 24 h were excluded from the study. Patients who died within 3 days of ventilator support were also excluded from the study.
A total of 60 patients were recruited in the study and divided into two groups by computer-generated random number tables.
Group 1: TV and PEEP were set according to P/V curve obtained by the mechanical ventilator in a conventional manner (without the use of intratracheal catheter): control group.
Group 2: TV and PEEP were set according to P/V curve obtained by the mechanical ventilator using intratracheal catheter.
We used Synchronized Intermittent Mandatory Ventilation- Volume Controlled and Synchronized Intermittent Mandatory Ventilation- Pressure Controlled mode during mechanical ventilation. PEEP was set at or above LIP but below the UIP. TV was initially targeted according to 6 mL.kg − 1 bodyweight and was adjusted by +1 mL.kg−1 bodyweight or −1 mL.kg−1 bodyweight as allowed by plateau pressure of ≤30 cm H2O; the value was limited to 4–8 mL.kg − 1 of predicted bodyweight. Respiratory rate was set to achieve a pH goal of 7.3–7.45 accordingly (6–30/min). We kept FiO2 below 0.6 but increased above 0.6 if SpO2 fell below 90%. The ratio of the duration of inspiration to expiration was set from 1:1 to 1:3. As per requirement, midazolam and fentanyl infusion was used for sedation of the patients.
Intratracheal catheter is attached to the ventilator with auxiliary port, sliding tubing over the barbed end of the port. Direct tracheal pressure was measured with an air-filled pressure line of 1.57 mm × 1.1 mm, passed through the lid of a connector to end 2 cm distal to the tip of the ETT. Before measuring the pressure, the auxiliary pressure system must be zeroed. Monitoring lines may become clogged and effect performance; to avoid this problem, there is a purge flow system which delivers 35 ± 15 mL.min−1 of air.
P/V curve was displayed on the screen of ventilator which was taken for the consideration of LIP and UIP and then PEEP.
In both the groups, pressure support/TV and PEEP were adjusted throughout as per the P/V curve. Recruitment maneuver was done frequency according to the patient, and arterial blood gas analysis was done 4–6 hourly. Chest X-ray, other investigations, and treatment were implemented as per the requirement.
In both groups TV, PEEP and P/F ratio at days 1, 3, and 7 were assessed and documented. Mortality within 7 days and 28 days were also measured in each group and compared with the help of statistical analysis.
Statistical analysis
Categorical variables are presented in number and percentage, and continuous variables are presented as mean and standard deviation. Quantitative variables are compared using unpaired t-test between two groups and to compare the parameters in each group on different stages, ANOVA is applied. Qualitative variables are compared using the Chi-square test/Fisher's exact test as appropriate. P < 0.05 was considered statistically significant. The data were entered in the Microsoft Excel spreadsheet, and analysis was done using the Statistical Package for the Social Sciences (SPSS) version 21.0 IBM.
RESULTS
In our study, both the groups were comparable in terms of the demographic variables (age, sex, and predicted bodyweight), sequential organ failure assessment score (SOFA) score, and baseline clinical status. At the time of admission, SOFA score (mean ± standard deviation) of Group 1 patients was 7.23 ± 2.812, and in Group 2, it was 7.3 ± 3.09 with P = 0.931 showing no statistically significant difference between both groups. Results were made in terms of intragroup comparison of each group, and finally, intergroup comparison between Group 1 and 2 was done.
As shown in Table 1, no significant difference was found among the mean value of TV in Group 1 patients at 1, 3, and 7 days (P = 0.98). The mean values of PEEP in Group 1 patients at 1, 3, and 7 days were 9.56 ± 1.70, 9.00 ± 1.70, and 8.33 ± 2.60, respectively. Statistically, this difference between groups was found significant (P < 0.05). Comparison of the mean value of P/F ratio in Group 1 patients at days 1, 3, and 7 was found statistically significant (199.26 ± 54.27 vs. 216.07 ± 64.48 vs. 225.19 ± 85.60) (P < 0.05).
Table 1.
Comparison of Tidal Volume, PEEP and P/F ratio of Group 1 at day 1, 3 and 7
| Group | n | Mean±SD | P | |
|---|---|---|---|---|
| TV1 | Group I (without intratracheal catheter) | 30 | 319.70±33.55 | 0.980 |
| TV3 | Group I (without intratracheal catheter) | 30 | 318.14±53.01 | |
| TV7 | Group I (without intratracheal catheter) | 27 | 320.07±67.44 | |
| PEEP1 | Group I (without intratracheal catheter) | 30 | 9.56±1.70 | 0.037* |
| PEEP3 | Group I (without intratracheal catheter) | 30 | 9.00±1.73 | |
| PEEP7 | Group I (without intratracheal catheter) | 27 | 8.33±5.60 | |
| PF1 | Group I (without intratracheal catheter) | 30 | 199.26±54.27 | 0.019* |
| PF3 | Group I (without intratracheal catheter) | 30 | 216.07±65.48 | |
| PF7 | Group I (without intratracheal catheter) | 27 | 225.19±85.60 |
Data are expressed in mean±SD. P<0.05 is statistically significant. TV=Tidal volume, PEEP=Positive end-expiratory pressure, PF=PO2/FiO2ratio, SD=Standard deviation. *Statistically significant
As shown in Table 2, in Group 2 patients also, the mean value of TV at 1, 3, and 7 days was not found statistically significant (P > 0.05). Comparison of the mean value of PEEP at 1, 3, and 7 days was found highly significant statistically (9.11 ± 2.28 vs. 8.92 ± 2.34 vs. 6.46 ± 2.47) (P < 0.001). Statistically, the mean value of P/F ratio at 1, 3, and 7 days was also found highly significant (210.57 ± 55.31 vs. 227.46 ± 60.68 vs. 270.52 ± 73.84) (P < 0.001).
Table 2.
Comparison of Tidal Volume, PEEP and P/F ratio of Group 2 at day 1, 3 and 7
| Group | n | Mean±SD | P | |
|---|---|---|---|---|
| TV1 | Group II (with intratracheal catheter) | 30 | 296.59±62.40 | 0.093 |
| TV3 | Group II (with intratracheal catheter) | 30 | 298.97±53.68 | |
| TV7 | Group II (with intratracheal catheter) | 27 | 322.28±64.93 | |
| PEEP1 | Group II (with intratracheal catheter) | 30 | 9.11±2.28 | <0.001 |
| PEEP3 | Group II (with intratracheal catheter) | 30 | 8.92±2.34 | |
| PEEP7 | Group II (with intratracheal catheter) | 27 | 6.46±2.47 | |
| PF1 | Group II (with intratracheal catheter) | 30 | 210.57±55.31 | <0.001 |
| PF3 | Group II (with intratracheal catheter) | 30 | 227.46±60.68 | |
| PF7 | Group II (with intratracheal catheter) | 27 | 270.52±73.84 |
Data are expressed in mean±SD. P<0.05 is statistically significant. TV=Tidal volume, PEEP=Positive end-expiratory pressure, PF=PO2/FiO2ratio, SD=Standard deviation
For the intergroup comparison of TV, PEEP, and P/F ratio, Student's t-test was applied. There was no significant difference found statistically in TV on days 1, 3, and 7 between Group 1 and 2 (P >.05) as shown in Graph 1. As shown in Graph 2, the value of PEEP at day 1 and day 3 between Group 1 and 2 patients was different, but this difference was not found statistically significant (P > 0.05). Statistically significant difference of PEEP between the groups was found at day 7 (8.33 ± 2.60 vs. 2 6.46 ± 2.47) (P < 0.05).
Graph 1.
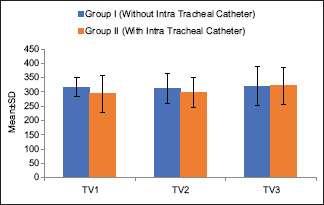
Comparison of Tidal Volume between Group 1 and 2 at day 1, 3 and 7
Graph 2.
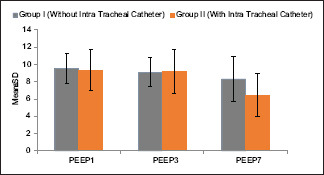
Comparison of PEEP between Group 1 and 2 at day 1, 3 and 7
As shown in Graph 3, we found the value of P/F ratio different at day 1 and 3 between Group 1 and 2, but statistically, this difference was not found significant (P > 0.05). At day 7, we found statistically significant difference of P/F ratio between the groups (225.19 ± 85.606 vs. 270.57 ± 73.844, P < 0.05).
Graph 3.
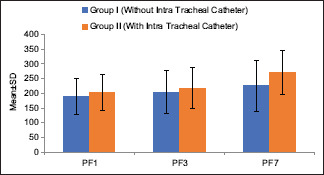
Comparison of P/F ratio between Group 1 and 2 at day 1, 3 and 7
We found mortality within 7 days was same in both the groups (10%), but we found decreased mortality in Group 2 (26%) than in Group 1 (33%) when compared mortality within 28 days.
DISCUSSION
The present study was carried out with an aim to developing optimal ventilator strategies through continuous and thorough monitoring of respiratory mechanics during ongoing ventilator support. Both the groups were comparable in terms of demographic variables, SOFA score, and clinical status. In both the groups, TV was initially targeted according to 6 mL.kg−1 of predicted bodyweight and was adjusted by + 1 mL.kg−1 to − 1 mL.kg−1 of predicted bodyweight as allowed by plateau pressure of ≤30 cm H2O. Minimum and maximum values were limited to 4 and 8 mL.kg−1 of predicted bodyweight,[8] Three patients from both the groups were died during the study before 7 days.
The mean value of TV [Table 1] in Group 1 at day 1, day 3, and day 7 was found to be statistically insignificant, as according to the study protocol, the TV was fixed between 4–8 mL.kg − 1 of predicted bodyweight to facilitate protective lung ventilation. The ARDS Network Writing Committee[9] has compared the conventional TV (high TV) and the low TV in ALI and ARDS patients and also reported the similar results in terms of lower mortality in the lower TV group. The mean value of PEEP [Table 1] was found 9.56 ± 1.70, 9.00 ± 1.70, and 8.33 ± 2.60 at days 1, 3, and 7. Therefore, on 7th day, statistically significant (P < 0.05) decrease in PEEP was found. This was because of the recovery phase of the disease and optimal PEEP strategies which was set at or above the LIP, at which the maximum oxygenation was attained. Amato et al.[10] studied 53 patients of ARDS and compared conventional ventilation (high TV) with protective strategy (low TV and PEEP). Later, it was associated with improved survival at 28 days, a higher rate of weaning from mechanical ventilation and a lower rate of barotraumas. Protective ventilation was not associated with a higher rate of survival after hospital discharge. The mean values of P/F ratio [Table 1] at days 1, 3, and 7 were 199.26 ± 54.27, 216.07 ± 64.48, and 225.19 ± 85.60, respectively. This increase in P/F ratio was found to be statistically significant. This is explained by optimal ventilator strategies as explained above; as more parenchyma is available for oxygenation, the P/F ratio shows a significant difference.
The mean values of TV [Table 2] in Group 2 at 1, 3, and 7 days were 296.59 ± 62.40, 298.97 ± 53.68, and 322.28 ± 64.93, respectively. The increase in TV was not statistically significant. The mean value of PEEP Table 2 was observed 9.11 ± 2.28, 8.92 ± 2.34, and 6.46 ± 2.47 at days 1, 3, and 7, and we found statistically highly significant decrease (P < 0.001) in PEEP; this was because of the recovery phase of disease and optimal PEEP strategies which was set at or above the LIP, at which the maximum oxygenation was attained. Table 2 also shows that the mean values of P/F ratio in Group 2 at days 1, 3, and 7 were 210.57 ± 55.31, 227.46 ± 60.68, and 270.52 ± 73.84. This increase in P/F ratio was found to be highly statistically significant (P < 0.001). This is explained by optimal ventilator strategies as explained above; as more parenchyma is available for oxygenation, and hence, the P/F atio shows a significant difference.
In support of our study about more accurate assessment of P-V curve, Ranieri and Slutsky in 1999[11] and Pelosi and Gattinoni in 2000[12] have called for a simple, rapid, safe, and reproducible method for measuring the P/V curve and establishing ventilator settings based on the LIP and UIP. The direct measurement of tracheal pressure using a thin catheter inserted through the ETT in combination with the DSA affords online analysis of the alveolar P/V curve and calculation of compliance at any one point of the P/V curve and yields the plot of alveolar pressure versus time.
Both the methods of deciding optimal ventilatory parameter were found to be useful on the basis of P/V curve, and hence, P/V curve is helpful in deciding PEEP and TV, improving oxygenation, and deciding optimal ventilator strategies.[6,7,13]
As shown in Graph 1, we observed statistically no significant change in TV at days 1, 3, and 7 between Group 1 and 2. Graph 2 shows no significant difference of PEEP at day 1 and 3 between the groups. However, on day 7, the significant difference of PEEP was found between Group 1 and 2. Possible explanation may be the more accurate application of PEEP using an intratracheal catheter than by the conventional method that helps in alveolar recruitment with more accuracy. Graph 3 shows that P/F ratio at days 1 and 3 between Group 1 and Group 2 patients were different but statistically insignificant (P > 0.05). At the same time, P/F ratio at day 7 in Group 1 and in Group 2 was different, and statistically, this difference between groups was significant (P < 0.05). The possible explanation may be the more accurate ventilator parameter that improved ventilation and oxygenation through lung parenchyma and reduced VILI. Graph 4 showed that the mortality was the same in both the groups (10%) within 7 days. When we compared the mortality within 28 days, it was found 26% for Group 2 and 33% for Group 1.
Graph 4.
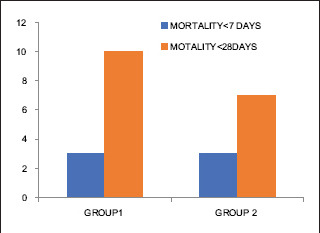
Comparison of Mortality between Group 1 and 2 at day 7 and 28
Guttmann et al. in 1993[14] studied that intratracheal pressure should be the basis for the analysis of lung mechanics. If measured at all, Ptrach is usually assessed by introducing a catheter into the trachea through the lumen of the ETT. The authors propose a computer-assisted method for calculating Ptrach on a point-by-point basis by subtracting the flow-dependent pressure drop delta PETT (V) across the ETT from the airway pressure (P[aw]), continuously measured at the proximal end of the ETT. They concluded that Ptrach can be monitored by combining our ETT coefficients and the flow and airway pressure continuously measured at the proximal end of the ETT. Kárason et al. in 2000[15] depicted that by measuring airway pressure at the trachea, the effect of ETT resistance during inspiration is excluded while it is included during expiration, yielding correct end points of inspiration and expiration. This makes it possible to calculate accurately total compliance of the respiratory system during dynamic conditions. By monitoring airway pressure in the trachea, respiratory mechanics can be assessed more accurately and ventilatory settings adjusted to attenuate ventilator-induced lung injury.
P/V curves determined by Albaiceta et al., in 2008,[6,7] through conventional manner are affected by secretions, humidifiers, and other devices attached to ETT. Intratracheal catheter obtains a more accurate assessment of P/V curve and more accurate intervention can be done.
Villafane et al.[16] depicts that tracheal pressure measurement gives online information on both end-inspiratory and end-expiratory pressure, independently of the changes in tube resistance due to secretions, compression, or kinking, without interrupting ventilation. Changes in ETT diameter due to secretions during treatment occur and these affect precision in the calculation.
Sondergaard et al. in 2003[17] studied ten patients undergoing postoperative respiratory therapy (feasibility of tracheal measurement) and ten patients with acute lung injury undergoing ventilator treatment (evaluation of algorithm). Direct tracheal pressure measurements with a catheter inserted through the ETT. Comparison of measured alveolar and the dynostatic alveolar pressure versus time in a lung model with changes in five ventilatory parameters. They concluded using a thin tracheal pressure catheter inserted through the ETT alveolar pressure allows continuous bedside monitoring with ease and precision using the dynostatic algorithm. The method is unaffected by tube and connector geometry or by secretions.
CONCLUSION
Both the methods of deciding optimal ventilatory parameter were found to be useful on the basis of P/V curve, and hence, P/V curve is helpful in deciding PEEP and TV, improving oxygenation, and deciding optimal ventilator strategies, so we conclude that optimal PEEP is more accurate using an intratracheal catheter than conventional method of deciding ventilator setting. Hence, it is recommended to use intratracheal catheter to obtain more accurate ventilator settings.
Financial support and sponsorship
Nil.
Conflicts of interest
There are no conflicts of interest.
REFERENCES
- 1.Sondergaard S, Kárason S, Hanson A, Nilsson K, Wiklund J, Lundin S, et al. The dynostatic algorithm accurately calculates alveolar pressure on-line during ventilator treatment in children. Paediatr Anaesth. 2003;13:294–303. doi: 10.1046/j.1460-9592.2003.01064.x. [DOI] [PubMed] [Google Scholar]
- 2.Karason S, Sondergaard S, Aneman A, Lundin S, Stenqvist O. Respiratory mechanics during endotoxin infusion measured with the SpiroDynamic method. Intensive Care Med. 2001;27:S452. [Google Scholar]
- 3.Kárason S, Søndergaard S, Lundin S, Stenqvist O. Continuous on-line measurements of respiratory system, lung and chest wall mechanics during mechanic ventilation. Intensive Care Med. 2001;27:1328–39. doi: 10.1007/s001340101024. [DOI] [PubMed] [Google Scholar]
- 4.Kárason S, Søndergaard S, Lundin S, Wiklund J, Stenqvist O. A new method for non-invasive, manoeuvre-free determination of “static” pressure-volume curves during dynamic/therapeutic mechanical ventilation. Acta Anaesthesiol Scand. 2000;44:578–85. [PubMed] [Google Scholar]
- 5.Karason S. Spirodynamics: New Methods for Continuous Monitoring of Respiratory Mechanics in Ventilator Treated Patients Thesis. University of Gothenburg; 2000. [Google Scholar]
- 6.Albaiceta GM, Blanch L, Lucangelo U. Static pressure-volume curves of the respiratory system: Were they just a passing fad? Curr Opin Crit Care. 2008;14:80–6. doi: 10.1097/MCC.0b013e3282f2b8f4. [DOI] [PubMed] [Google Scholar]
- 7.Jonson B, Richard JC, Straus C, Mancebo J, Lemaire F, Brochard L. Pressure-volume curves and compliance in acute lung injury: Evidence of recruitment above the lower inflection point. Am J Respir Crit Care Med. 1999;159:1172–8. doi: 10.1164/ajrccm.159.4.9801088. [DOI] [PubMed] [Google Scholar]
- 8.Acute Respiratory Distress Syndrome Network. Brower RG, Matthay MA, Morris A, Schoenfeld D, Thompson BT, et al. Ventilation with lower tidal volumes as compared with traditional tidal volumes for acute lung injury and the acute respiratory distress syndrome. N Engl J Med. 2000;342:1301–8. doi: 10.1056/NEJM200005043421801. [DOI] [PubMed] [Google Scholar]
- 9.Brower RG1, Fessler HE. Mechanical ventilation in acute lung injury and acute respiratory distress syndrome. Clin Chest Med. 2000;21:491–510, viii. doi: 10.1016/s0272-5231(05)70161-1. [DOI] [PubMed] [Google Scholar]
- 10.Amato MB, Barbas CS, Medeiros DM, Magaldi RB, Schettino GP, Lorenzi-Filho G, et al. Effect of a protective-ventilation strategy on mortality in the acute respiratory distress syndrome. N Engl J Med. 1998;338:347–54. doi: 10.1056/NEJM199802053380602. [DOI] [PubMed] [Google Scholar]
- 11.Ranieri VM, Slutsky AS. Respiratory physiology and acute lung injury: The miracle of Lazarus. Intensive Care Med. 1999;25:1040–3. doi: 10.1007/s001340051010. [DOI] [PubMed] [Google Scholar]
- 12.Pelosi P, Gattinoni L. Respiratory mechanics in ARDS: A siren for physicians? Intensive Care Med. 2000;26:653–6. doi: 10.1007/s001340051227. [DOI] [PubMed] [Google Scholar]
- 13.Jeon K, Jeon IS, Suh GY, Chung MP, Koh WJ, Kim H, et al. Two methods of setting positive end-expiratory pressure in acute lung injury: An experimental computed tomography volumetric study. J Korean Med Sci. 2007;22:476–83. doi: 10.3346/jkms.2007.22.3.476. [DOI] [PMC free article] [PubMed] [Google Scholar]
- 14.Guttmann J, Eberhard L, Fabry B, Bertschmann W, Wolff G. Continuous calculation of intratracheal pressure in tracheally intubated patients. Anesthesiology. 1993;79:503–13. doi: 10.1097/00000542-199309000-00014. [DOI] [PubMed] [Google Scholar]
- 15.Kárason S, Søndergaard S, Lundin S, Wiklund J, Stenqvist O. Evaluation of pressure/volume loops based on intratracheal pressure measurements during dynamic conditions. Acta Anaesthesiol Scand. 2000;44:571–7. doi: 10.1034/j.1399-6576.2000.00515.x. [DOI] [PubMed] [Google Scholar]
- 16.Villafane MC, Cinnella G, Lofaso F, Isabey D, Harf A, Lemaire F, et al. Gradual reduction of endotracheal tube diameter during mechanical ventilation via different humidification devices. Anesthesiology. 1996;85:1341–9. doi: 10.1097/00000542-199612000-00015. [DOI] [PubMed] [Google Scholar]
- 17.Sondergaard S, Karason S, Wiklund J, Lundin S, Stenqvist O. Alveolar pressure monitoring: An evaluation in a lung model and in patients with acute lung injury. Intensive Care Med. 2003;29:955–62. doi: 10.1007/s00134-003-1730-2. [DOI] [PubMed] [Google Scholar]