

Helix 8 of the GPCR neurotensin receptor 1 is stabilised by specific lipid-protein interactions.
Abstract
G protein–coupled receptors (GPCRs) are the largest and pharmaceutically most important class of membrane proteins encoded in the human genome, characterized by a seven-transmembrane helix architecture and a C-terminal amphipathic helix 8 (H8). In a minority of GPCR structures solved to date, H8 either is absent or adopts an unusual conformation. The controversial existence of H8 of the class A GPCR neurotensin receptor 1 (NTS1) has been examined here for the nonthermostabilized receptor in a functionally supporting membrane environment using electron paramagnetic resonance, molecular dynamics simulations, and circular dichroism. Lipid-protein interactions with phosphatidylserine and phosphatidylethanolamine lipids, in particular, stabilize the residues 374 to 390 of NTS1 into forming a helix. Furthermore, introduction of a helix-breaking proline residue in H8 elicited an increase in ß-arrestin–NTS1 interactions observed in pull-down assays, suggesting that the structure and/or dynamics of H8 might play an important role in GPCR signaling.
INTRODUCTION
G protein–coupled receptors (GPCRs) are of considerable biological and pharmacological significance, since they account for ~1% of human genome-encoded proteins and are implicated in a variety of biological processes and pathologies (1). In recent years, GPCR structural biology has undergone rapid progress as a result of advances in protein engineering, the use of lipidic cubic phases and x-ray free-electron lasers for crystallography, and most recently, developments in cryo-electron microscopy (cryo-EM) (2), resulting in structures for 57 unique receptors published to date. In all cases, GPCRs are characterized by a seven-transmembrane helix architecture, with the majority of structures displaying an additional structural element, helix 8 (H8). H8 is an amphipathic α helix that follows the conserved NPxxY motif on transmembrane helix 7 (TM7). Sequence alignment of class A GPCRs reveals a semiconserved motif F(R/K)xx(F/L)xxx(L/F) for H8 (fig. S1). Physiological studies have shown H8 to be important for surface expression of GPCRs, for receptor trafficking, and for G protein activation and specificity thereof (3–7). Moreover, biophysical studies of the μ opioid receptor (8, 9) and rhodopsin (10–12) suggest that the conformational dynamics of H8 are involved in GPCR (pre-)activation and interaction with arrestin (12).
Given the potential functional significance of H8, it is noteworthy that in a minority of structures, H8 either is absent or adopts an unusual conformation (fig. S1 and table S1); of the 367 structures of class A GPCRs published to date, all but 30 (~8%), representing 17 (~30%) of the 57 unique class A GPCRs for which structures have been published, show a helical H8. In some cases, this can be rationalized by the lack of sequence determinants, but for several receptors, specifically, the adenosine A1 receptor (A1R), the angiotensin II type 1 and type 2 receptors (AT1R and AT2R, respectively), the CC chemokine receptor type 2, the D4 dopamine receptor, the purinergic P2Y12 receptor (P2Y12R), and the rat neurotensin receptor 1 (NTS1), one or more of the reported structures lack H8 despite the presence of an intact H8 motif (fig. S1). The rat NTS1 is of particular interest, since eight crystal structures have been published to date, demonstrating distinct conformations of H8 (table S2) (13–16). In all cases, thermostabilizing mutations and C-terminal and/or intracellular loop 3 (IC3) truncations were necessary for crystallization of NTS1, with four of the crystal constructs also containing T4-lysozyme (T4L) insertions (table S2) (13, 15, 16). Crystallographic studies of NTS1 using constructs in which functionally impairing mutations were reverted back to wild-type (WT) (15), or with alternative thermostabilizing mutations lacking a T4L insertion, which showed improved functionality (14), did show the presence of H8.
Here, we sought to determine the conformation adopted by the H8 residues in an NTS1 construct having the full-length C terminus and no thermostabilizing mutations, as well as the influence of the lipid environment and receptor activation state on this conformation. A combination of continuous-wave electron paramagnetic resonance (CW-EPR), circular dichroism (CD), and molecular dynamics (MD) demonstrate that NTS1 has a dynamic H8 that is dependent on lipid-protein interactions for its helicity. Furthermore, agonist binding to the receptor induces (subtle) rearrangements of the helix, and disruption of helical structure by a proline mutation affects NTS1-arrestin binding in human embryonic kidney (HEK) 293T cells. Together, these results emphasize the importance of lipids in H8 structure and the dynamic nature of H8 in NTS1.
RESULTS
CW-EPR reveals helical periodicity for H8
CW-EPR was used to probe the secondary structure and conformational dynamics of H8 in NTS1 reconstituted into a lipid bilayer and lacking any thermostabilizing mutations that were previously required for crystallization (table S2) (13–16). Specifically, cysteine mutations for site-directed spin labeling with 2,2,5,5-tetramethylpyrroline-1-oxyl-3-methyl)methanethiosulfonate (MTSL) (R1) were introduced into a background mutant of NTS1 (ΔC-NTS1) in which native accessible cysteines were mutated to serine or alanine residues (C172S3.55, C278SIC3, C332S6.59, C386SC-term, and C388AC-term). The background mutant shows the same affinity for agonist as WT receptor [dissociation constant (Kd) ≤ 2 nM) (17), single-cysteine mutants thereof were previously shown to be able to bind Gαi1 in a guanosine 5′-O-(3′-thiotriphosphate)–dependent manner (17), and all single-cysteine mutants used here showed salt-sensitive binding to a ligand affinity column, as expected for functional NTS1, although signaling competence was not tested. CW-EPR spectra were recorded at 295 and 170 K (figs. S2 and S3, respectively) for NTS1 sequentially spin-labeled at the C-terminal residues 374 to 393 reconstituted in brain polar lipid (BPL) extract liposomes. NTS1 has previously been shown to be functional within this lipid environment (18).
All spectra were complex, containing multiple dynamic components; a more (τc ≈ 30 to 200 ns) and a less (τc ≈ 2 ns) motionally restricted component, labeled “i” and “m,” respectively (fig. S2), can be distinguished. These two components could arise from different conformational states of the receptor or from spin label rotamers with different interactions with their environment, resulting in different amplitude of motion, rate of motion, or both (19). Changes in the intensity of these components reflect changes in the population of the corresponding protein states or spin label rotamers. The outer splittings (2Azz′) reflect the mobility of the more restricted component “i,” while the width of the central resonance line (ΔH0) is only somewhat biased by the more mobile spectral component “m,” and is a good overall measure of spin label mobility (fig. S2) (10, 19).
As the mobility of the spin label, and thus ΔH0, is dependent on its local environment, the secondary structure of a sequence can be assessed from the periodicity in this mobility parameter (10). Plotting the inverse of the central linewidth against residue number shows that ΔH0−1, for part of the probed stretch, follows a sine function, indicative of helical periodicity (Fig. 1A). To determine the length of the helix, sine functions were fit to all possible residue stretches between 4 and 20 residues long, and fitting results were ranked according to the residual sum of squares. The periodicity in ΔH0−1 for apo receptor was most consistent with two helical stretches kinked around residues F380-L381 (Fig. 1A). The data in the presence of saturating concentrations of agonist, neurotensin (NT; Fig. 1B), were consistent with an uninterrupted helix, and in both cases, the periodicity was approximately 3.6 residues (Fig. 1, A and B, dotted lines). No clear periodicity could be discerned beyond residue W391, which follows helix-breaking residues P389 and G390, suggesting that the rest of the probed C terminus lacks regular structure. Compared to the apo state, the presence of agonist elicited the largest changes in the local dynamics of the residues flanking the putative helix kink (380 to 382) as gauged by the observed differences in ΔH0−1 and the relative contributions of the more and less motionally restricted spectral components (Fig. 1, B to F, and fig. S2). Addition of NT resulted in either an increase in local dynamics (increase in ΔH0−1, residue 381; Fig. 1, C and E) or a decrease (residues 380 and 382; Fig. 1, C, D, and F). The observation of opposite effects on spin label mobility for alternating residues (378 to 383; Fig. 1C) may reflect a local reorientation of the helix relative to the membrane, allowing the formation of an uninterrupted helix. An increase in ΔH0−1 in the presence of NT compared to apo receptor was observed for most label positions on the C-terminal half of H8 (from 383 onward) and the unstructured C-terminal stretch beyond H8, suggesting an overall increase in spin label mobility in the presence of agonist (Fig. 1C), although the effect of agonist on the spectra was modest (fig. S2).
Fig. 1. CW-EPR analysis of H8 periodicity.
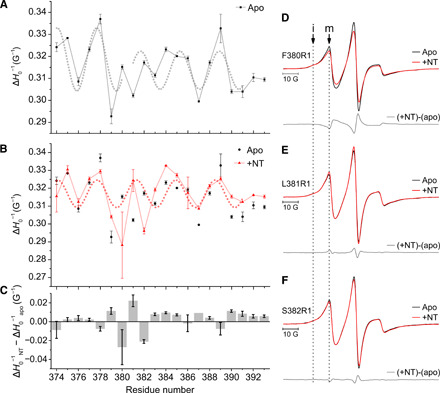
Sequential single cysteine mutants of NTS1 were labeled with MTSL, generating the R1 side chain. EPR spectra were recorded at 295 K for residues along the C-terminal stretch after TM7, encompassing the putative H8 (see fig. S2). ΔH0−1 determined from spectra of NTS1 (A) in the absence (apo, black squares) or (B) presence (+NT, red triangles) of agonist recorded at 295 K is shown here, plotted against residue number. ΔH0−1 data points for apo receptor (black circles) are also shown in (B) for comparison. The dotted gray and red sinusoids have a period of 3.6 residues. (C) The difference in the mobility parameter ΔH0−1 observed between the spectra recorded in the presence (ΔH0−1NT) and absence of NT (ΔH0−1apo) is shown for each residue position. A positive value reflects an increase in local dynamics of the spin label in the presence of agonist with respect to the apo receptor. Error bars represent the SEM (n = 2); note that lack of an error bar means that both measurements gave the same value. (D to F) Averaged spectra (n = 2) recorded in the absence (black line) and presence of agonist (NT, red lines) and difference spectra [(+NT) - (apo), gray line] are shown for three label positions showing the largest spectral changes in the presence of agonist compared to apo: (D) F380R1, (E) L381R1, and (F) S382R1. The spectra are multicomponent, containing a more and less motionally restricted component, labeled “i” and “m,” respectively.
H8 secondary structure is stabilized by membranes
To assess the influence of the membrane on the secondary structure of H8, a peptide corresponding to H8 (S373-C388) was studied by far-ultraviolet (UV) CD in aqueous buffer, in detergent, and in liposomal suspensions of 1-palmitoyl-2-oleoyl-sn-glycero-3-phosphocholine (POPC) or the more native BPL. In the absence of detergent or lipid (black line; Fig. 2), the CD spectrum is characteristic of an unstructured peptide (8 ± 1% helical; fig. S4A), showing a strong negative signal around 200 nm. However, in the presence of lipids (red and gray lines; Fig. 2) or detergents (fig. S4A), the peptide shows a higher propensity to adopt a helical secondary structure (~29 to 65% helical; fig. S4A). Although it has to be noted that the very low lipid-to-protein ratio (5:1, mol:mol) used to minimize scattering in the far-UV region of the spectrum means that the spectra are likely to be subject to flattening, affecting the reliability of detailed spectral analysis, the differences between the spectra in the presence and absence of lipid are a clear indication of the stabilizing effect of lipid membranes on the secondary structure of this amphipathic helix.
Fig. 2. CD analysis of influence of membrane mimetic on H8 secondary structure.
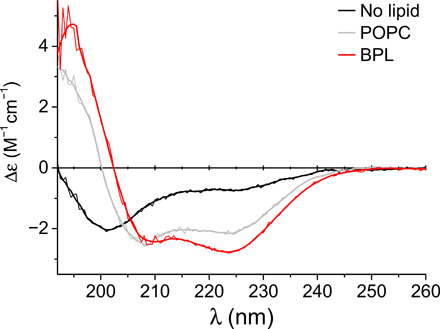
The molar CD (Δε) of a peptide (0.1 mg/ml) corresponding to a short NTS1 C-terminal stretch (S373-C388) including the H8 sequence was measured in saline buffer in the absence of lipids (black line) and in the presence of POPC (gray line) or BPL extract (red line) liposomes at a 5:1 lipid-to-peptide molar ratio. Smoothed data (fat line) are plotted on top of the raw data.
The type of lipid used influenced the CD spectra of the NTS1 H8 peptide. The blue shift of ~2 nm in the zero crossing (Δε = 0) observed in the presence of POPC compared to BPL (Fig. 2) is indicative of reduced α-helical content (29 ± 2% and 34 ± 1% followed from spectral analysis for POPC and BPL, respectively). Furthermore, while the shape of the CD spectrum of the peptide in the presence of POPC was similar to that of the peptide in detergent, the presence of BPL resulted in a more pronounced CD signal at ~225 nm (Fig. 2 and fig. S4A). These results suggest that other types of lipid present in BPL besides phosphatidylcholine (PC) lipids, e.g., phosphatidylethanolamine (PE) or phosphatidylserine (PS) lipids, constituting ~33 and ~19% of BPL, respectively, could have stabilizing interactions with H8.
H8 interacts predominantly with lipid headgroups
To determine the depth of H8 penetration into lipid bilayers, the effect of the S373-C388 H8 peptide on acyl chain order of POPC model membranes was examined using EPR and spin-labeled PC lipids [1-palmitoyl-2-stearoyl-(5/12/14-doxyl)-sn-glycero-3-phosphocholine (DOXYL-PC)]. Large unilamellar vesicles (LUVs; 100 nm) were formed, with a DOXYL-PC spin label specifically installed in either the outer or inner leaflet of the vesicle (20). EPR spectra were recorded in the absence and presence of H8 peptide (fig. S4B), and the apparent order parameters Sapp, derived from the hyperfine splittings of the spectra (21), were calculated (Table 1). The greatest increase of Sapp, indicating decreased motional freedom, was observed in the peptide-accessible outer leaflet of the model membrane compared to the peptide-inaccessible inner leaflet. The greatest increase (+15%) was observed with lipids labeled with DOXYL in the 5-position of the carbon chain, closest to the external headgroup region. A more modest increase was observed at the 12- and 14-positions of the outer leaflet (+4.0% and 3.7%, respectively). Barely any ordering was observed at the 5-, 12-, and 14-positions of spin-labeled lipids residing in the inner leaflet (0.9%, 1.2% and 0.5%, respectively).
Table 1. Effect of H8 peptide on spin-labeled lipids.
Apparent order parameters Sapp were calculated for lipids spin labeled at different positions and in different leaflets from hyperfine splitting.
| S | Sapp inner leaflet labeled | % Change | Sapp outer leaflet labeled | % Change | ||
| With H8 | Without H8 | With H8 | Without H8 | |||
| 5-PCSL | 0.542 | 0.537 | +0.9 | 0.517 | 0.594 | +15.0 |
| 12-PCSL | 0.189 | 0.187 | +1.2 | 0.186 | 0.179 | +4.0 |
| 14-PCSL | 0.136 | 0.135 | +0.5 | 0.126 | 0.121 | +3.7 |
These data suggest that the S373-C388 H8 peptide interacts with zwitterionic model membranes primarily via surface interactions, with minimal insertion of the peptide into the hydrophobic core of the bilayer, consistent with its predicted amphipathic nature. The asymmetry of the order parameters across the membrane suggests that, in LUVs of this lipid composition, H8 does not insert as a transmembrane peptide. The absence of a substantial ordering of the inner leaflet also suggests that the peptide does not cross the membrane to interact with the inner surface of the vesicle.
MD reveals specific lipid-protein interactions stabilizing H8
The role of lipid-protein interactions in the stability of H8 secondary structure was studied in more detail by atomistic MD (AT-MD) simulations of peptides corresponding to H8, specifically, a short H8 peptide (H8p; residues A374-A385) and a longer peptide (eH8p, A374-H393), as well as of the whole receptor. Simulations were run in both a POPC and a BPL-mimicking membrane bilayer consisting of cholesterol, POPC, 1-palmitoyl-2-oleoyl-sn-glycero-3-phosphoethanolamine (POPE), and 1-palmitoyl-2-oleoyl-sn-glycero-3-phospho-l-serine (POPS) (see the Materials and Methods) for the H8 peptides and the receptor. Analogous simulations in explicit water in the absence of lipids were also run for the H8 peptides. The secondary structure of H8 was tracked along the 200-ns simulations, and any lipid-protein interactions with H8 were investigated. The length of the AT-MD trajectories is within the same dynamic range of anisotropy averaging of the nitroxide spin label motion in CW-EPR (nanosecond) (21) and therefore suitable for comparison with the EPR experiments.
While both H8 peptides (H8p and eH8p) appeared to be fully unstructured in water, in the presence of a BPL-like membrane, predominantly, α- and π-helical conformations were observed along the trajectories (fig. S5, A and B). The initial α-helical structure of H8p and eH8p was completely lost by the end of the trajectories in the presence of only POPC, suggesting that interaction with POPS, POPE, and/or cholesterol can stabilize H8, in agreement with the higher α-helical content observed by CD in the presence of BPL compared to POPC (Fig. 2 and fig. S4A). For both the shorter H8p and the longer eH8p, the helical structure of the N-terminal half of the peptide (376 to 380) appeared more stable than the C-terminal half (>381), with the latter only showing helical tendency during part of the trajectories. The NTS1 model based on the 4BUO structure (14) with thermostabilizing mutations reverted back to the corresponding WT residues showed an α helix for the A374-L384 fragment throughout the 200-ns simulation when embedded in a BPL-like membrane, while the presence of POPC alone only partially stabilized the helix (A374-L381/S382; fig. S5C). During the AT-MD trajectory of the NTS1 model in a BPL-like membrane, H8 remains parallel to the membrane plane with its hydrophobic (residues F3768.50, F3808.54, and L3848.58) and hydrophilic (residues N3758.49, Q3788.52, and S3828.56) side membrane buried and solvent-exposed or at the solvent-membrane interface, respectively (fig. S5D). Also, the packing of H8 with TM1 and TM7 does not deviate substantially from the crystal structure (fig. S5E) (14). In POPC, H8 adopted a different orientation with respect to the TM helix bundle, kinking away further from TM1, when compared to both the 4BUO crystal structure (14) and the AT-MD simulation in a BPL-like membrane (fig. S5E). The limited stability of NTS1 in POPC compared to BPL is also reflected in the backbone fluctuations observed during the AT-MD simulations, where average backbone root mean square deviations (RMSDs) of 1.9 ± 0.8 Å and 0.9 ± 0.2 Å were found for H8 and 4.2 ± 0.9 Å and 3.5 ± 0.3 Å for the NTS1 model overall within a POPC and a BPL-like membrane, respectively. Again, these observations suggest that interactions of H8 with POPE, POPS, and/or cholesterol play a role in maintaining its secondary structure.
To provide more insight into the conformational dynamics of H8 in a BPL-like lipid membrane and the effects of ligand binding, additional triplicate simulations of the receptor in the apo and the agonist-bound state were run. As before, an α helix was observed for the apo receptor throughout the 200-ns simulation for the A374-L384 fragment, and the average backbone RMSDs of H8 and NTS1 overall (0.9 ± 0.2 Å and 3.6 ± 0.3 Å, respectively) were also in agreement with the previous simulation (0.9 ± 0.2 Å and 3.5 ± 0.3 Å, respectively). In the NT-bound state, a marked increase in mobility was seen for H8 (residues A374-C386) and TM7-H8 (I364-C386) compared to the apo state receptor. While the backbone RMSD of the TM helices shows only a very modest increase from 2.1 ± 0.2 Å in the apo state to 2.3 ± 0.2 Å in the NT-bound state, the RMSDs of H8 and TM7-H8 increased from 0.9 ± 0.2 Å and 0.9 ± 0.2 Å to 1.8 ± 0.3 Å and 2.3 ± 0.3 Å, respectively (fig. S6). In addition, H8 loses part of its helical structure, in particular, at the N-terminal end (residues A374-N375/F376), in the simulations of the agonist-bound receptor (fig. S7A); the number of contacts observed between Y7.53 (Y369) and F8.50 (F376) is strongly reduced compared to the apo state from 28 ± 9 to 2 ± 5 contacts; and the angle between TM7 and H8 changes drastically (Fig. 3A). NT makes extensive contacts with a cascade of mostly aromatic residues and two arginine residues at the extracellular (EC) end of TM6 and TM7. While the EC end of TM6 moves toward the receptor core (from residue W3216.48 onward), that of TM7 moves outward (fig. S7B), possibly contributing to the observed increase in RMSD in TM7 and H8 of NT-bound NTS1 compared to the apo receptor (fig. S6). Reorientation of Y7.53 toward N7.49 and D2.50 as observed in various active-state structures of GPCRs has been proposed to be a main part of the activation mechanism (22) and was indeed observed in one of the three simulations of NT-bound NTS1, but not in the other two, where Y3697.53 was either found in a hydrophobic pocket made up of L1062.43, V3096.36, and V3136.40 or made π-π contacts with F3808.54 (Fig. 3B). To probe the importance of Y7.53-F8.50 stacking for the stability of H8, triplicate simulations of a Y7.53A mutant of NTS1 in the apo state in BPL-like membranes were run. The Y7.53A mutation lead to a more modest increase in mobility of H8 and TM7 compared to WT receptor than that elicited by the presence of agonist; the backbone RMSDs of H8 and TM7-H8 only increased to 1.1 ± 0.3 Å and 1.3 ± 0.2 Å, respectively, compared to 0.9 ± 0.2 Å and 0.9 ± 0.2 Å for WT apo NTS1 and 1.8 ± 0.3 Å and 2.3 ± 0.3 Å for NT-bound NTS1 (fig. S6). While the number of contacts between Y7.53 and F8.50 during the course of the simulation was reduced (21 ± 7 versus 28 ± 9 for WT, a likely reduction with a Bayesian t test probability of 0.88), it is still significantly higher than the number of contacts observed for the NT-bound receptor (only 2 ± 5). The angle between TM7 and H8 did increase during the simulations of the Y7.53A mutant and fluctuated more strongly than during the simulations of the WT apo receptor (Fig. 3A). Thus, the Y7.53-F8.50 interaction does appear to have a stabilizing role on H8, but its loss in the agonist-bound state is not the sole cause of the strong effect of agonist on H8 conformational dynamics observed in the AT-MD simulations.
Fig. 3. TM7-H8 angle in MD simulations.
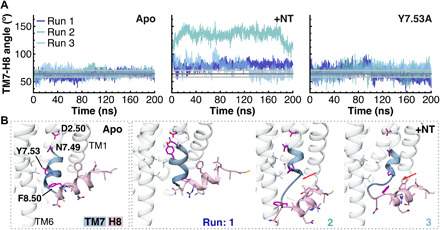
(A) The angle between TM7 and H8 calculated between the vector formed by the Cα atoms of Y360-N370 (on TM7) and the vector formed by the Cα atoms of F376-F380 (on H8) is shown here for all MD simulations. The average angle during the simulations of apo WT NTS1 is shown as a dark gray line in each panel, while the light gray lines indicate the average RMSD of ±1 SD. (B) The cytosolic end of TM7 (blue) and H8 (pink) are shown for the final frame of one simulation (run 2) of the apo receptor (Apo) and all three simulations of the NT-bound receptor (+NT). While Y7.53 interacts with F8.50 during the simulations of the apo receptor, in the presence of NT, Y7.53 interacts with N7.49 and D2.50 (run 1), or the cytosolic end of TM7 unwinds (runs 2 and 3, red arrow) without Y7.53 interacting with N7.49 and D2.50.
To investigate the role of particular lipid species in the stability of H8, given the observed enhanced stability of H8 in BPL compared to POPC membranes, we looked at the number of close lipid-protein contacts (≤3.5 Å) during the simulations, normalizing for the total number of contacts observed and correcting for the relative proportions of each lipid species in the bilayer (Fig. 4). In the apo state, while the whole receptor showed some preference for contacts with POPS over the other phospholipids (fig. S8A), at H8, POPE and, to a lesser extent, POPS were particularly enriched (Fig. 4A and fig. S8B), with most contacts observed at R3778.49 and C3868.60 (Fig. 4B and fig. S8C); hydrogen bonds and electrostatic interactions were observed between the side chains and the lipid headgroup, phosphate, and/or glycerol moieties (Fig. 4C). These interactions with C3868.60 may play a role in preventing the unfolding of the C-terminal end of H8, since in the POPC-only membrane, a shorter H8 was observed. While the Y7.53A mutation did not have a significant effect on the observed lipid-protein contacts compared to the apo WT receptor, in the agonist-bound state, the number of contacts with POPS increased strongly at H8 (Fig. 4A and fig. 8D), but not significantly for the receptor overall (fig. S8, A and D); interactions with the POPS headgroup were seen mainly at R3778.49 and C3868.60 (Fig. 4C and fig. S8C). The POPS lipid tails also interacted with a number of hydrophobic H8 residues (F3808.54, L3818.55, and L3848.58) and R3778.49 (fig. S8C), possibly due to the change in angle between TM7 and H8 exposing these residues more to the surrounding lipid membrane.
Fig. 4. Lipid-protein interactions observed in MD.
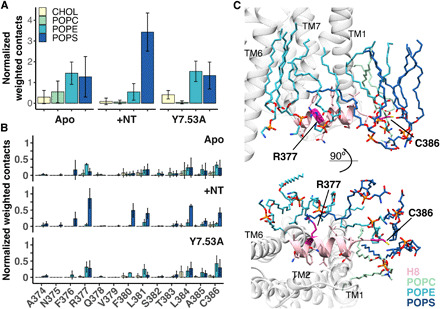
(A) The number of lipid-protein contacts (≤3.5 Å) per lipid species observed during AT-MD simulations of NTS1 in a BPL-like bilayer was normalized by the total number of interactions during each simulation run and weighted by the percentage of each lipid type found in the mixed bilayer. Results are shown for simulations of apo WT NTS1 (Apo), NT-bound WT NTS1 (+NT), and apo mutant NTS1 where Tyr369 is mutated to Ala (Y7.53A). Averages of three simulation runs for each condition for the timeframe in equilibrium (20 to 200 ns) are shown with error bars representing the SD. Contacts are shown (A) for H8 as a whole (residues A374-C386) and (B) for the individual H8 residues. Contacts for the whole receptor, a breakdown of the contacts into contacts with the lipid tails and lipid headgroups, and statistical analysis are shown in fig. S8. (C) Final frame of the AT-MD simulation of apo NTS1 in a BPL-like bilayer, showing NTS1 (gray cartoon) and lipids surrounding H8 (highlighted in pink). POPS (dark blue sticks) and POPE (cyan sticks) lipids are observed clustered around R3778.51 (magenta) and the C-terminal C3868.60 (magenta) throughout the AT-MD simulations. CHOL, cholesterol.
H8 in NTS1 signaling
To gain insight into the role of H8 in NTS1 at the cellular level, WT NTS1, NTS1 with a helix-breaking proline substitution at position V3798.53 (NTS1-V379P), and NTS1 with a conservative mutation at the same position (NTS1-V379L) were expressed in HEK293T cells, and the recruitment of ß-arrestin-1 was investigated (Fig. 5, A and B). Following NT stimulation, the amount of ß-arrestin-1 binding to the receptor was probed using pull-down assays. Our results show a significantly higher amount of β-arrestin-1 bound to the NTS1-V379P compared with the WT NTS1 receptor (Fig. 5A), while no significant difference was found for NTS1-V379L (Fig. 5B). While it appeared that the V379P8.53 mutation might also affect extracellular signal–regulated kinases 1 and 2 (ERK1/2) phosphorylation (Fig. 5C), further supporting that H8 could be involved in NTS1-arrestin interactions, the differences in phosphorylation levels between the mutant and WT NTS1 were not statistically significant.
Fig. 5. Association of NTS1 with β-arrestin-1 and extracellular signal-regulated kinases 1 and 2 phosphorylation.
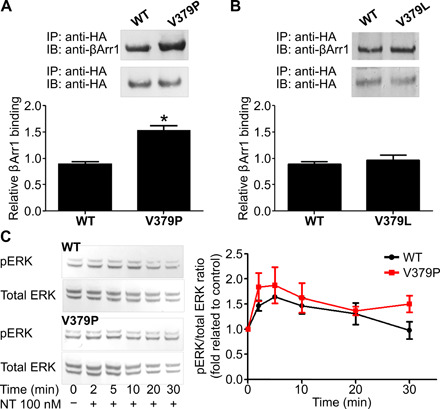
(A and B) Pull-down assays were performed to assess the interaction of β-arrestin-1 (βArr1) with the receptor. Specifically, HEK293 cells expressing wild-type NTS1 (WT), NTS1-V379P (V379P), or NTS1-V379L (V379L) receptors were stimulated with 100 nM NT for 15 min at 37°C. After stimulation, cell lysates were precipitated with anti–hemagglutinin (HA) antibody, and Western blotting was performed to probe the amount of β-arrestin-1 interacting with the receptors. Signals were quantified by densitometry, and values were normalized by the amount of β-arrestin-1 interacting with NTS1. Each point represents the mean of four independent experiments, and error bars represent the SEM. Statistical significance was determined using one-way analysis of variance (ANOVA) with Dunnett’s multiple comparison test; *P < 0.05. IP, immunoprecipitation; IB, immunoblot. (C) Kinetics profiles for extracellular signal-regulated kinases 1 and 2 (ERK1/2) phosphorylation (pERK) after 100 nM NT stimulation in cells expressing WT or V379P are shown. Signals were quantified by densitometry, and pERK values were normalized by total ERK values. Each point represents the mean of three independent experiments, and error bars represent the SEM. Statistical significance was tested using a two-sample two-tailed t test.
DISCUSSION
Mounting evidence suggests that, in addition to its importance in GPCR biogenesis and trafficking (3–6), H8 may play a role in early GPCR activation (8, 9, 12) and biased signaling through the arrestin pathway (6, 9, 12). Notably, a subset of all class A GPCR structures solved to date (30 of 367) did not have a canonical H8 perpendicular to the TM bundle following TM7. Sequence alignment of all crystallized GPCRs shows that for some of these receptors, this may be due to the absence of certain conserved residues of the H8 F8.50(R/K)8.51xx(F/L)8.54xxx(L/F)8.58 motif (table S1); the sequences of the leukotriene 4 BLT1 receptor, the lysophosphatic acid 6 receptor, and free fatty acid 1 receptor (FFA1R) deviate substantially from the canonical sequence, with FFA1R even having a proline residue at position 8.50. However, other receptors, such as NTS1, have been crystallized without a structured eighth helix despite showing a (near) canonical H8 sequence. Conversely, receptors with similarly deviating sequences, e.g., the lysophosphatidic acid receptor 1 (MSxxFxxxL), the C5a1 receptor (SLxxNxxxE), or the sphingosine-1-phosphate receptor 1 (MRxxFxxxM), lacking the most conserved Phe, have only been crystallized with a structured H8 (table S1), suggesting that the stability of the helix cannot be rationalized by sequence determinants alone.
Although most of the GPCR structures for which H8 was found to be unstructured were solved using constructs containing an IC3 insertion, and a destabilizing effect of the insertion cannot be excluded, there seems to be no clear correlation between the presence of an IC3 fusion and the absence of H8. Many other GPCRs have been crystallized with a structured H8 despite the presence of an IC3 insertion; not all structures of receptors that have been found to lack a structured H8 were solved using constructs containing an IC3 insertion (e.g., for AT1R, AT2R, and A1R, an N-terminal fusion protein was used instead); and in some cases, the same or similar constructs containing an IC3 insertion have resulted in structures with and without a helical H8 (e.g., for P2Y12R-bRIL and the various thermostabilized forms of NTS1-T4L).
Thus far, 10 receptor subtypes have been crystallized, both with and without a helical H8 (fig. S1). For NTS1, this discrepancy between crystal structures was suggested to reflect the relative low stability of H8 (14) or differences in activation state of the receptor (15, 23), which were produced using different thermostabilized constructs showing varying degrees of G protein activation (table S2) (13–16). Here, using CW-EPR spectroscopy, we could demonstrate the presence of a helical H8, for a nonthermostabilized, non–C-terminally truncated NTS1 construct reconstituted in lipid bilayers. Helical periodicity was observed stretching from residue A3748.48 up to G3908.64/W3918.65, both for the apo receptor and in the presence of agonist. It has to be noted that the Pro-to-Cys mutation and spin labeling required for the EPR measurements at position 389 may have negated any helix-disrupting effect of the native proline, thus extending H8 beyond its native length. However, the observed change in amplitude of ΔH0−1 for the flanking residues G3908.64 and W3918.65 relative to L3878.61 and C3888.62, determined in the presence of the native Pro, follows the trend expected for continuation of the helical periodicity over that stretch of the sequence, suggesting H8 ends shortly after the helix-breaking Pro8.63-Gly8.64 residues. In the absence of ligand, the periodicity in the EPR mobility parameters was best fit with a discontinuous helix, with a kink around residues F3808.54/L3818.55. The structured stretch of H8 in NTS1 crystal structures varied from N3758.47-F3808.54 at the shortest [Protein Data Bank (PDB) ID 4XES] to A3748.48-L3878.61 at the longest (PDB ID 4BV0, chain B; table S2). Notably, the end of the shortest resolved structured H8 coincides with the location of the putative helix kink observed in our EPR experiments.
Previous fluorescence, double electron-electron resonance (DEER), and nuclear magnetic resonance (NMR) spectroscopy studies have suggested that agonist binding alone can trigger changes in the local dynamics of TM7/H8 in a number of different GPCR subtypes (8, 9, 11, 24, 25), independent of the well-described outward movement of TM6 upon GPCR activation (8, 25), suggesting that conformational changes in TM7, H8, and IC1 may precede TM6 movement (8, 25). While the presence of ligand did not affect the overall structure of H8 of NTS1, as gauged here by EPR, it did appear to induce some local dynamic effects. The largest changes were observed for the residues flanking the putative helix kink (F3808.54 to S3828.56; Fig. 1 and fig. S2), suggestive of a local rearrangement of H8 possibly resulting in an uninterrupted helix, as implied by the ΔH0−1 periodicity in the presence of agonist. Notably, these changes occur close to the highly conserved F8.50 residue (F376 in NTS1). F8.50 is proposed to interact with the similarly conserved Y7.53 of the NPxxY motif on TM7 in the inactive state of class A GPCRs. It is thought that the interactions between Y7.53 and F8.50 are broken upon activation (22), which may contribute to the changes in H8 dynamics upon activation (8, 9, 11, 24, 25); a slight inward movement of the cytosolic end of TM7 relative to its position in the inactive state has been observed in crystal structures of the agonist-bound (intermediate) active state of several GPCRs (22), confirming earlier observations by DEER spectroscopy of rhodopsin activation (11). This repositioning of TM7 and concomitant repositioning of the side chain of Y7.53 toward the transmembrane core precluding its interaction with F8.50 has been suggested to lead to steric stabilization of TM6 in its active pose (22). For example, in the various “active-like” agonist-bound rat NTS1 crystal structures, Y7.53 packs against TM2, TM3, and TM6 and does not interact with F8.50 (13, 15). Notably, different conformations of the NPxxY motif were also reported in a recent cryo-EM study of a human NTS1 (hNTS1) construct in two Gi1-coupled states of the receptor (26): a canonical and a noncanonical state. While the G protein exhibited a very different binding pose in the noncanonical state, being rotated by about 45° compared to the canonical state, the overall structure of hNTS1 was very similar in both states, with the exception of TM7. In the canonical hNTS1 state, Y7.53 was found in the transmembrane core packing against TM6, as observed in the active-like rat NTS1 structures (13, 15), distorting the NPxxY region of TM7, while in the noncanonical hNTS1 state, Y7.53 adopts a more “inactive-like” conformation similar to the 4BUO NTS1 structure, packing against L1052.43 (L106 in rat NTS1 numbering), suggesting that it represents an activation intermediate. Notably, H8 is structured in both hNTS1-Gi1 structures but shorter in the more active-like canonical state (N8.49-F8.54 versus S8.47-C8.60 in the noncanonical state). In our AT-MD simulations of NT-bound NTS1, the number of contacts between Y7.53 and F8.50 was reduced significantly, and TM7 and H8 were more flexible compared to the apo receptor. Eliminating the π-π stacking interaction by mutation of Y7.53 to Ala had a more modest effect on the flexibility of H8 (fig. S6) and the angle between TM7 and H8 (Fig. 3); indeed, Y7.53A still showed CH-π interactions with F8.50. Thus, it is possible that a change in the interaction between Y7.53 and F8.50 upon ligand binding contributes to a locally more dynamic H8 without affecting its secondary structure, in combination with other destabilizing effects of ligand binding on TM7 (fig. S7). The EPR spectra showed a modest increase in ΔH0−1 in the presence of NT compared to apo receptor for most label positions on the C-terminal half of H8 (from 383 onward) and the unstructured C-terminal stretch beyond H8 (Fig. 1C). Residues 372 to 401 of the C terminus of NTS1 have been shown to be involved in coupling to Gs- and Gi-mediated pathways (27), and deletion of residues 374 to 389 was deleterious to G protein activation in an NTS1-Gi1/q fusion protein (28). Changes in the local dynamics of H8 may be required for receptor signaling, e.g., facilitating engagement with G protein and/or arrestin. TM7/H8 conformation and/or dynamics were previously shown to be particularly sensitive to arrestin-biased ligands for, e.g., the vasopressin receptor 2 and the μ opioid receptor (8, 24). The finger loop of arrestin was also shown to interact predominantly with the N-terminal part of H8 of opsin (the retinal-free active conformation of rhodopsin) (22). Disruption of H8 by insertion of a helix-breaking proline at position V379 resulted in increased binding of ß-arrestin-1 relative to WT receptor (Fig. 5), suggesting that structural integrity or dynamics of H8 may also play a role in NTS1-arrestin interactions. High local mobility of H8 has previously been shown to be required for initial (low-affinity) binding of β-arrestin-1 to rhodopsin (12), while deletion or severe disruption of H8 by replacing the central K8.53 with a helix-breaking proline was reported to perturb the interaction of the bradykinin B2 receptor with GPCR kinase 2/3 (GRK 2/3) and ß-arrestin-2 (6). Thus, while the presence of H8 appears to be required, structural changes that increase its local dynamics might facilitate arrestin interaction directly, or indirectly, for example, by making the receptor C terminus more readily accessible for GRKs, although such a hypothesis would require further testing. While no interaction was observed between the α5 helix of the α subunit of Gs and TM7 or H8 of β2-adrenergic receptor (β2AR), more recent structures of GPCR–G protein complexes [reviewed in (29)] of the A2A adenosine receptor (with mini Gs), μ opioid receptor (with Gi), 5-hydroxytryptamine 1B (5-HT1B) receptor (with Go), rhodopsin (with Gi), and hNTS1 (with Gi1/q) (26) do show direct contacts of the G protein with the N-terminal part of H8 similar to that observed for arrestin, suggesting that changes in H8 conformation, positioning, and/or dynamics may play a (receptor-dependent) role in G protein recognition and in arrestin coupling.
It is worth noting that EPR spectra of the N-terminal half of H8 in rhodopsin recorded in a previous study in n-dodecyl β-d-maltopyranoside (DDM) micelles (10) show stronger immobilization of the spin labels and larger maximal differences in ΔH0−1 (0.1 to 0.27 versus 0.05) between residue positions compared to NTS1 here, suggesting that H8 may be more dynamic in NTS1 than in rhodopsin. The changes observed in the EPR spectra of rhodopsin H8 upon light activation were substantially more pronounced than those observed for here NTS1. This may reflect the previously proposed difference in energy landscape for activation for rhodopsin and other GPCRs (30); covalent coupling to its inverse agonist precludes basal activity in rhodopsin, resulting in a larger change upon activation. It should also be noted that an absence of large changes in CW-EPR does not preclude conformational changes (e.g., rigid body movements) occurring in NTS1 upon ligand binding. For example, CW-EPR spectra of TM6 of the β2AR show only small spectral changes upon addition of ligand, or even a G protein mimetic, which were of similar magnitude as those observed here for H8 in apo and NT-bound NTS1 (30), even though crystallography and pulsed EPR measurements have shown large conformational changes under these conditions (22, 29, 30).
Both in vitro experiments and simulations suggested that lipid-protein interactions are important for H8 secondary structure integrity; in the absence of lipids, CD and MD showed that a peptide corresponding to H8 was unstructured, while the presence of lipids or detergent supported its helical structure. Similar results have previously been obtained for peptides corresponding to the H8 fragment of the CB1 cannabinoid (31) and the β2-adrenergic receptors (32) by CD and NMR spectroscopy, where helicities of ~65 and 31%, respectively, were found in membrane-mimicking environments, similar to the values obtained here by CD (fig. S4A), while the peptides appeared unstructured in water. Furthermore, the H8 peptide showed higher helical propensity by CD in the presence of BPL than in the presence of only PC lipids (Fig. 2), indicating that specific lipid headgroup interactions could contribute to its structure. During MD simulations of NTS1 in a BPL bilayer, close interactions were observed between H8 and all main components of the BPL bilayer (POPC, POPE, POPS, and cholesterol) (Fig. 4 and fig. S8). In vivo, PE and PS lipids are largely confined to the inner leaflet of the plasma membrane (20), and interaction with these lipids in particular appears to contribute to the higher stability of H8 in BPL membranes relative to POPC membranes; frequent interactions with R3778.51 and C3868.60 were observed both with POPE and POPS during simulations of the apo and the NT-bound receptor, respectively. The presence of a basic residue at position 8.51 is highly conserved in class A GPCRs (fig. S1), suggesting that this stabilizing lipid-protein interaction may be of general significance. PE lipids have previously been shown to be important for NT binding in vitro (18), which may be due to stabilization of the native structure of the receptor. The observed increase in contacts between H8 and PS lipids in the NT-bound state suggests that the agonist-bound conformation is particularly stabilized by interaction with anionic lipids, which have been implicated in promoting NTS1 G protein activity in vitro (33). In previous simulations using the structure of the thermostabilized NTS1-GW5 construct that was crystallized without a structured H8 (13) and a WT homology model derived therefrom in POPC bilayers (23), a modeled H8 was reported to be unstable. While this discrepancy with our results most likely reflects the difference in starting model, the lack of stabilizing interactions with other lipid species may also have contributed to the lower H8 stability observed (23).
NTS1 produced in Escherichia coli as used here, and as used to produce the 4BUO crystal structure (14), is not posttranslationally modified and thus lacks palmitoylation of the C-terminal cysteine residues. An MD study of the dopamine D2 receptor embedded in lipid raft-like membranes showed that C-terminal palmitoylation enhanced membrane penetration by the H8 backbone, while depalmitoylation enabled H8 to move out into the aqueous environment (34). Our MD simulations suggest that lipid-protein interactions, such as the extensive interactions observed between PE and PS lipids and C386 of NTS1, may stabilize H8 in the absence of palmitoylation at this C-terminal cysteine residue (Fig. 4) and maintain partial insertion of its C-terminal end into the membrane throughout the MD simulation (fig. S5D). Furthermore, the palmitoylation thioester bond is labile, making it a transient posttranslational modification. Previous studies of several GPCRs have established that levels of receptor palmitoylation can be modulated by, e.g., agonist binding [reviewed in (35)], suggesting that this modification is dynamic and regulated and that pools of depalmitoylated receptors exist. In hNTS1, inhibition of palmitoylation has been linked to reduced interaction with Gq and lower levels of ERK1/2 phosphorylation, which was ascribed to diminished localization to structured membrane microdomains (36). Thus, while palmitoylation of the C-terminal cysteines does not appear to be an essential requirement for H8 helicity, it might have a stabilizing and regulating effect.
In conclusion, this study confirms the presence of a structured H8 in NTS1, both for apo and agonist-bound receptor, which is stabilized by lipid-protein interactions. Whether the fact that H8 was only observed in part of the solved crystal structures is due to protein engineering, crystallographic conditions, lack of specific lipid-protein stabilizing contacts, or inherent flexibility of H8 remains unclear. Accumulating evidence suggests that H8 structure, dynamics, and conformation may play a role in GPCR signaling and, in particular, in arrestin-biased pathways, and the techniques used here could be extended to studies in the presence of signaling partners, such as G proteins or β-arrestins, to shed more light on the structural basis of the activation mechanisms of different GPCR signaling pathways and the role that lipids play therein.
MATERIALS AND METHODS
NTS1 purification, spin labeling, and reconstitution
The rat NTS1 was produced as a fusion construct, NTS1BH6 (MBP-TEV-rT43NTS1-His6-TEV-TrxA-His10), where NTS1 is truncated at the N terminus (1 to 42), has a His6 tag added to its C terminus and is flanked by tobacco etch virus (TEV) protease recognition sites separating it from its N- and C-terminal fusion partners, maltose-binding protein, and thioredoxin, followed by an additional C-terminal His10 tag, respectively (17). Sequential single-cysteine mutations (for residues 374 to 393) were introduced in a cysteine-depleted background mutant of NTS1BH6 (C172S3.55, C278SIC3, C332S6.59, C386SC-term, and C388AC-term, where superscripts refer to the Ballosteros-Weinstein numbering), previously described in (17). Cysteine mutants of NTS1BH6 were expressed in E. coli BL21(DE3), purified, and reconstituted as previously described (17). Briefly, NTS1BH6 was solubilized from E. coli cell pellet in 50 mM tris-HCl (pH 7.4), 200 mM NaCl, 30% glycerol (v/v), 1% DDM (w/v), 0.5% CHAPS (w/v), and 0.1% (w/v) cholesteryl hemisuccinate (CHS), supplemented with protease inhibitors [leupeptin (2 μg/ml), pepstatin A (2 μg/ml), and aprotinin (3 μg/ml)]. NTS1BH6 was purified from clarified lysate by immobilized metal affinity chromatography [eluting in 50 mM tris-HCl (pH 7.4), 200 mM NaCl, 10% glycerol (v/v), 0.5% CHAPS (w/v), 0.1% DDM (w/v), 0.1% CHS (w/v), and 500 mM imidazole], after which fusion partners were removed by proteolytic cleavage with TEV protease. The receptor was diluted with salt-free buffer to reduce the NaCl (<70 mM) concentration and further purified by ligand-affinity chromatography using N-terminally Cys-derived NT (Alta Bioscience) immobilized on UltraLink Iodoacetyl Resin (Pierce, Thermo Fisher Scientific), ensuring that the final sample contained only properly folded receptor, capable of ligand binding. The sample was incubated with the resin for at least 2 to 3 hours at 4°C, and impurities were removed by washes with 70 and 150 mM NaCl [50 mM tris-HCl (pH 7.4), 10% glycerol (v/v), 0.1% DDM (w/v), and 0.01% CHS (w/v)], after which NTS1 was eluted with 1 M NaCl. The NT column eluate was incubated with 10 mM dithiothreitol (DTT) for 2 to 3 hours at 4°C and concentrated by loading it on a 1-ml HisTrap Ni2+ column, extensively washing (~50 to 90 column volumes) to remove DTT and eluting with 400 mM imidazole. Eluted receptor was then incubated with a 20-fold molar excess of MTSL (Toronto Research Chemicals) spin label over receptor for 45 min at room temperature, after which the sample was buffer-exchanged, and excess label was removed by gel filtration using two 5-ml HiTrap Desalting columns (GE Healthcare) connected in series and equilibrated with 50 mM tris-HCl (pH 7.4), 50 mM NaCl, 10% glycerol (v/v), 0.1% DDM (w/v), 0.01% CHS (w/v), and 1 mM EDTA. The labeled receptor was then reconstituted into 100-nm extruded porcine BPL (Avanti Polar Lipids) liposomes at an initial lipid-to-protein molar ratio of 1750:1 using Bio-Beads SM-2 Resin (Bio-Rad) for detergent removal. Proteoliposomes (containing ~1.5 to 3 nmol of NTS1) were resuspended in 10 μl of liposome buffer [50 mM tris-HCl, 50 mM NaCl, 10% glycerol (v/v), and 1 mM EDTA (pH 7.4)], with or without a 5- to 10-fold molar excess of agonist, NT8–13 (Sigma-Aldrich), the active C-terminal fragment of NT. Two biological replicates were prepared for each label position.
CW-EPR on NTS1
Samples were loaded into ~0.5-mm glass capillaries (Sigma-Aldrich), which were flame-sealed at one end before loading. Spectra were recorded on an X-band CW spectrometer (EMX, Bruker). The temperature was controlled (295 or 170 K) using a nitrogen cryostat coupled to a variable temperature unit (Oxford Instruments). Spectra were typically collected with a sweep width of 200 G, at 45 s per scan, and the time constant was adjusted to ~10% of the conversion time. The modulation amplitude was set to 1 or 3 G for spectra recorded at 295 or 170 K, respectively. Receiver gain was set at 40 to 60 dB, and microwave power was adjusted to avoid saturation (10 mW at 295 K and 0.1 mW at 170 K). Between 10 and 20 scans (recording time ~ 8 to 15 min) were collected and averaged. Single spectra that were recorded as a control before and after the recording of an averaged spectrum, to verify the stability of the receptor over the course of the measurements, were indistinguishable. Spectra were normalized to the integrated intensity of the absorption spectra. Rotational correlation times (τc) were estimated from the maximum outer splitting 2Azz′ of the spectra recorded at 295 K (see fig. S2) using the method of Freed (21), where the maximum outer splitting of the spectra recorded at 170 K was used to determine the rigid limit 2AzzR. To determine ΔH0, spectra were smoothened using cubic splines in R (using RStudio) and interpolated, and the global maxima and minima were extracted. Nelder-Mead optimization in R was subsequently used to fit sine functions to (ΔH0)−1 (average of the two biological repeats) plotted against residue number (374 to 393) for all possible residue stretches, discarding results for stretches shorter than four residues. Results were ranked according to the resulting residual sum of squares.
CW-EPR with spin-labeled lipids
POPC and 5/12/14-PCSL or DOXYL-PC were purchased from Avanti Polar Lipids (Alabaster, AL, USA). Lipids were dissolved in chloroform to give stocks (25 mg/ml) and stored at −20°C. A peptide corresponding to S373-C388 of NTS1 (H8 peptide: Ac-SANFRQVFLSTLACLC-NH2) was purchased from Peptide Synthetics and used without further purification. LUVs were formed with a spin label installed in the outer leaflet of the membrane; for the inner leaflet, the lipid compositions of the donor and acceptor vesicles are reversed. Specifically, adapting a protocol from Cheng et al. (20), donor multilamellar vesicles (MLVs) were prepared by mixing POPC (12 mg, 16 μmol) and DOXYL-PC (0.24 mg, 0.3 μmol) in CHCl3 and dried under nitrogen and then in vacuo for 1 hour. The dried lipid film was suspended in H2O (500 μl) to a concentration of 32 μM and left to stand at 40°C for 1 hour, with occasional, gentle vortexing. The MLVs were then incubated with 500 μl of methyl-β-cyclodextrin (MβCD; Sigma-Aldrich, 64 μmol) for 2 hours at 1000 rpm and 50°C using a heated vortexer (Eppendorf Thermomixer Comfort). At the same time, acceptor LUVs were formed by first preparing MLVs of POPC (3 mg, 4 μmol) in H2O with 20% (w/v) sucrose (500 μl) and then subjected to five freeze-thaw cycles between liquid N2 and 40°C. The freeze-thawed MLVs were extruded 11 times through 100-nm polycarbonate filters (Avanti Polar Lipids). The sucrose-entrapped vesicles were diluted with H2O (9 ml) and centrifuged for 2 hours at 190,000g and 40°C, using a Beckman Optima XL-100 K Ultracentrifuge and SW 41 Ti rotor. The pelleted vesicles were then resuspended in H2O (500 μl) to a final concentration of 8 μM. The sucrose-entrapped LUVs were added to the solution of MβCD-solubilized MLVs, and the resulting suspension was mixed for 30 min at 1000 rpm and 50°C using a heated vortexer. This mixed suspension was then diluted in 9 ml of 4.5% (w/v) sucrose solution and centrifuged for 2 hours at 190,000g and 10°C. The unpelleted MLVs and MβCD were removed in the supernatant, and the exchange LUVs were resuspended in 50 mM phosphate buffer (pH 7.2; 100 μl). H8 peptide in dimethyl sulfoxide (DMSO) was added to give a peptide-to-lipid (P:L) molar ratio of 1:25. The relative concentrations of inner leaflet– and outer leaflet–labeled vesicles were calculated using fluorescence of 0.1% Rhodamine PE in the acceptor vesicles to ensure that the P:L ratio was the same. An identical volume of DMSO was added to lipid-only samples. The mixed suspension was then diluted in 9 ml of 4.5% (w/v) sucrose solution and centrifuged for 2 hours at 190,000g and 10°C. CW-EPR measurements were carried out at 293 K on an X-band CW spectrometer (EMX, Bruker) fitted with a nitrogen cryostat. The hyperfine splittings Apar and Aper were obtained from the EPR spectra, and the apparent order parameter Sapp was calculated according to the equation
where Azz, Ayy, and Axx are the principal hyperfine splittings (32.9, 5.4, and 5.9 for DOXYL, respectively) of the molecular axes of the spin label
is a normalization term for the polarity of the environment, and
accounts for dependence of the hyperfine splittings (Aper) on the local polarity (21).
Circular dichroism
For CD measurements, the H8 peptide was dissolved at 15 mg/ml in trifluorethanol (TFE) and then diluted to 0.1 mg/ml in (i) 20 mM sodium phosphate, 20 mM NaCl buffer, or buffer containing either (ii) POPC liposomes (0.43 mg/ml), (iii) BPL liposomes (0.37 mg/ml) to a 5:1 lipid-to-peptide molar ratio, (iv) 1% octyl β-d glucoside, 0.01% CHS, or (v) 0.1% DDM, 0.01% CHS (w/v). Peptide concentration was measured using absorption at 205 nm. Liposomes were prepared by extrusion through 100-nm polycarbonate filters (Whatman). CD spectra were recorded at 293 K between 190 and 260 nm on a Jasco J-815 Spectropolarimeter using a 1-mm quartz cuvette, a scan rate of 20 nm/min, and a data integration time of 1 s. The recorded spectra were corrected for buffer contribution, accounting for TFE (0.67%) and the appropriate lipid/detergent. The data were smoothed in OriginPro 8.5 (OriginLab) using Savitzky-Golay filtering (10-nm window, second-order polynomial), and the DichroWeb server was used to estimate secondary structure; results from multiple algorithms (K2D, CONTIN, CDSSTR, and SELCON3) and reference datasets (sets 4, 7, SP175, and SMP180) that gave a normalized RMSD below 0.1 were averaged.
MD simulations
The NTS1 crystal structure of highest resolution containing a resolved H8 (PDB code 4BUO) (14) was used as initial conformation (upon ligand removal), and the non-resolved IC1 was modeled with the software MODELLER [the model with the best Discrete Optimized Protein Energy (DOPE) score was chosen]. For the simulations of the H8 peptides and NTS1 comparing POPC and BPL, simulations were run using GROMACS (v. 4.6.3). Self-assembly coarse-grained (CG)–MD simulations (37) in a POPC membrane were first performed for 100 ns at 323 K using the MARTINI force field, giving a membrane-embedded protein with about 300 POPC lipids, solvated with water particles and ~150 mM NaCl. The final systems were then converted to atomistic detail using the CG2AT protocol, then bilayer/solvent-equilibrated (with positional restraints on the protein) for 1 ns, and lastly run for a further 200 ns (at 310 K) of AT-MD with the GROMOS96 53a6 force field. The self-assembled POPC CG systems were lipid-exchanged (38) to build the BPL-like membrane models, composed of POPC:POPS:POPE:cholesterol at a ratio of 15:22:39:24, therefore mimicking the composition of BPL extract. The resulting heterogeneous membrane systems were submitted, before conversion back to atomistic, to a 100-ns CG-MD simulation at 323 K using the same parameters as for the POPC CG-MD. Each atomistic system was considered to be in equilibrium after the first 20 ns of AT-MD, based on NTS1 backbone RMSD. Therefore, the trajectory analysis was performed from 20 to 200 ns for each AT-MD simulation, using the GROMACS and VMD tools. Further triplicate simulations were run using apo WT NTS1, NT-bound WT NTS1, and apo mutant NTS1 where Tyr369 is mutated to Ala (Y7.53A), in a BPL-like bilayer as described above with a few differences. Specifically, simulations were run using GROMACS (v.2019), the CHARMM36 force field was used for the AT-MD simulations, and Insane (39) was used to build the BPL-like membrane models (same lipid ratio as in the other simulations); the resulting heterogeneous membrane systems were submitted to a 500-ns CG-MD simulation at 310 K, before conversion back to atomistic. Atomistic simulations of 200 ns were performed in triplicate. Lipid-protein contacts (≤3.5 Å) per lipid species observed during MD simulations were quantified for each condition for the timeframe in equilibrium (20 to 200 ns). The number of contacts was normalized by the total number of interactions during each simulation run and subsequently weighted by the percentage of each lipid type found in the mixed bilayer. Averages from the triplicate runs were calculated and subjected to statistical analysis using R (in RStudio) using a Bayesian alternative to the two-sample t test, BEST (40).
Pull-down assays
Rat NTS1 receptor was cloned into the pOPINHA vector (a gift from R. Owens, OPPF-UK) using the InFusion cloning method (Clontech). The vector containing the receptor was used as the template to generate V379P and V379L mutants using QuikChange (Stratagene) according to the manufacturer’s instructions. The sequence of each construct was confirmed by DNA sequencing.
HEK293T cells were cultivated in Dulbecco’s modified Eagle’s medium (DMEM; Sigma-Aldrich) supplemented with 10% (v/v) fetal bovine serum and glutamine (2 mM) in a 5% CO2 environment at 37°C. NTS1, NTS1-V379P, and NTS1-V379L plasmids were transiently transfected into HEK293T cells using Lipofectamine 2000 (Invitrogen) following the manufacturer’s instructions. Thirty-six hours after the transfection, cells were serum-starved overnight. Subsequently, cells were stimulated with 100 nM NT (Sigma-Aldrich) during 15 min. Following stimulation, cells were placed on ice, washed with phosphate-buffered saline buffer and lysed with 1 ml of cold buffer [50 mM tris-HCl (pH 7.5), 150 mM NaCl, 1% Nonidet P-40, aprotinin (100 μg/ml), leupeptin (10 μg/ml), 1 mM sodium ortovanadate, and 10 mM sodium fluoride). After lysis by douncing (20 strokes), the lysates were centrifuged at 4°C, 10,000g for 15 min. The supernatants were incubated with 2 μg of anti-hemagglutinin (HA) antibody (Sigma-Aldrich) for 1 hour at 4°C with agitation. After this period of incubation, 20 μl of precleared protein A/G agarose beads (Santa Cruz Biotechnology) was added, and samples were rotated for 1 hour at 4°C. Subsequently, beads were centrifuged and washed three times with lysis buffer, and bound proteins were eluted by heating to 85°C with 40 μl of 2X SDS–polyacrylamide gel electrophoresis (SDS-PAGE) sample buffer. A/G agarose beads were pelleted, the eluted supernatants were separated by SDS-PAGE and transferred to nitrocellulose membranes, and Western blotting was performed against β-arrestin-1 (1:1000, BD Biosciences) and the receptor (anti-HA, 1:1000, Sigma-Aldrich). Densitometric values were obtained using ImageJ (https://imagej.nih.gov/ij/), and corresponding results were plotted using GraphPad (GraphPad Software Inc.). Statistical significance was determined using one-way analysis of variance (ANOVA) with Dunnett’s multiple comparison test using GraphPad Prism. A P value of <0.05 was considered statistically significant.
ERK1/2 phosphorylation assays
HEK293T cells were cultivated in DMEM (Sigma-Aldrich) with 10% (v/v) fetal bovine serum and glutamine (2 mM) in a 5% CO2 environment at 37°C. NTS1 and NTS1-V379P plasmids were transiently transfected into cells using Lipofectamine 2000 (Invitrogen) following the manufacturer’s instructions. Twenty-four hours after transfection, 3.0 × 10⁵ transfected cells were seeded on six-well plates in DMEM supplemented with 10% (v/v) serum fetal bovine and glutamine (2 mM) and maintained in a 5% CO2 environment at 37°C during 12 hours. Subsequently, cells were serum-starved overnight and then stimulated with 100 nM NT for the indicated period of time (0 to 30 min) and analyzed for ERK phosphorylation. After NT stimulation, cells were lysed with lysis buffer consisting of 50 mM tris-HCl (pH 7.4), 150 mM NaCl, 1% Nonidet P-40, and protease inhibitors [leupeptin (10 μg/ml), aprotinin (100 μg/ml), 1 mM sodium orthovanadate, and 10 mM sodium fluoride]. Following homogenization at 4°C during 30 min, cellular lysate was centrifuged at 4°C, 13,000g for 15 min, and total protein was quantified by bicinchonic acid (BCA) assay (Thermo Fisher Scientific). After that, 30 μg of total protein was separated by SDS-PAGE and transferred to nitrocellulose membrane, and Western blotting was performed against total ERK and phosphorylated ERK (pERK, both antibodies from Cell Signaling Technology). Densitometric values obtained with ImageJ (https://imagej.nih.gov/ij/) were used to calculate the ratio of pERK to total ERK, and corresponding results were plotted using GraphPad (GraphPad Software Inc.). Statistical significance was tested using a two-sample two-tailed t test using GraphPad Prism.
Supplementary Material
Acknowledgments
We thank the Centre of Advanced ESR (CAESR, University of Oxford) for access to EPR equipment and technical support, D. Staunton (University of Oxford) for technical support, P. Judge (University of Oxford) and S. van Weezel (Radboud University) for helpful discussion, and X. Zhao (East China Normal University) for giving us access to the Shanghai Supercomputer Center. We further acknowledge the high-performance computing resources provided by the Structural Bioinformatics and Computational Biochemistry unit (University of Oxford), the e-Infrastructure South Consortium Emerald cluster, and the Advanced Research Computing ARCUS cluster (University of Oxford). This project made use of time on ARCHER and JADE granted via the UK High-End Computing Consortium for Biomolecular Simulation, HECBioSim (www.hecbiosim.ac.uk/), supported by EPSRC (grant no. EP/R029407/1). Funding: This work was financially supported by the Medical Research Council (grant no. G0900076 to A.W., MR/S009213/1 to P.J.S., and studentship to S.R.L.), the Biotechnology and Biological Sciences Research Council (grant nos. BB/P01948X/1, BB/R002517/1, and BB/S003339/1 to P.J.S.), Wellcome (208361/Z/17/Z to P.J.S.), and UCB Celltech (to A.W.). P.S.K. and A.J.C.-F. thank FAPESP (grant nos. 2010/17662-8, 2011/21767-2, and 2012/20358-4) and CNPq. Author contributions: P.M.D. established the protocol for the site-directed spin labeling of NTS1 and associated EPR experiments, which were conducted by P.M.D., S.R.L., and P.S.K. P.M.D. analyzed the EPR data with input from S.R.L. P.M.D. conducted the CD experiments. J.C.M.-G. prepared the models for MD simulations. J.C.M.-G. and P.J.S. performed MD simulations. J.C.M.-G. and P.M.D. analyzed the MD results. R.I.d.R. conducted the NTS1 signaling studies and analysis. D.Y. designed and conducted EPR experiments with spin-labeled lipids. P.M.D., S.R.L., J.C.M.-G., R.I.d.R., and D.Y. wrote the manuscript with input from the other authors. A.J.C.-F. and A.W. supervised the project and secured the funding. Competing interests: The authors declare that they have no competing interests. Data and materials availability: All data needed to evaluate the conclusions in the paper are present in the paper and/or the Supplementary Materials. Additional data related to this paper may be requested from the authors.
SUPPLEMENTARY MATERIALS
Supplementary material for this article is available at http://advances.sciencemag.org/cgi/content/full/6/33/eaav8207/DC1
REFERENCES AND NOTES
- 1.Hauser A. S., Attwood M. M., Rask-Andersen M., Schiöth H. B., Gloriam D. E., Trends in GPCR drug discovery: New agents, targets and indications. Nat. Rev. Drug Discov. 16, 829–842 (2017). [DOI] [PMC free article] [PubMed] [Google Scholar]
- 2.Thal D. M., Vuckovic Z., Draper-Joyce C. J., Liang Y.-L., Glukhova A., Christopoulos A., Sexton P. M., Recent advances in the determination of G protein-coupled receptor structures. Curr. Opin. Struct. Biol. 51, 28–34 (2018). [DOI] [PubMed] [Google Scholar]
- 3.Delos Santos N. M., Gardner L. A., White S. W., Bahouth S. W., Characterization of the residues in helix 8 of the human β1-adrenergic receptor that are involved in coupling the receptor to G proteins. J. Biol. Chem. 281, 12896–12907 (2006). [DOI] [PubMed] [Google Scholar]
- 4.Anavi-Goffer S., Fleischer D., Hurst D. P., Lynch D. L., Barnett-Norris J., Shi S., Lewis D. L., Mukhopadhyay S., Howlett A. C., Reggio P. H., Abood M. E., Helix 8 Leu in the CB1 cannabinoid receptor contributes to selective signal transduction mechanisms. J. Biol. Chem. 282, 25100–25113 (2007). [DOI] [PubMed] [Google Scholar]
- 5.Huynh J., Thomas W. G., Aguilar M.-I., Pattenden L. K., Role of helix 8 in G protein-coupled receptors based on structure–function studies on the type 1 angiotensin receptor. Mol. Cell. Endocrinol. 302, 118–127 (2009). [DOI] [PubMed] [Google Scholar]
- 6.Feierler J., Wirth M., Welte B., Schüssler S., Jochum M., Faussner A., Helix 8 plays a crucial role in bradykinin B2 receptor trafficking and signaling. J. Biol. Chem. 286, 43282–43293 (2011). [DOI] [PMC free article] [PubMed] [Google Scholar]
- 7.Kaye R. G., Saldanha J. W., Lu Z.-L., Hulme E. C., Helix 8 of the M1 muscarinic acetylcholine receptor: Scanning mutagenesis delineates a G protein recognition site. Mol. Pharmacol. 79, 701–709 (2011). [DOI] [PMC free article] [PubMed] [Google Scholar]
- 8.Sounier R., Mas C., Steyaert J., Laeremans T., Manglik A., Huang W., Kobilka B. K., Déméné H., Granier S., Propagation of conformational changes during μ-opioid receptor activation. Nature 524, 375–378 (2015). [DOI] [PMC free article] [PubMed] [Google Scholar]
- 9.Liu J. J., Horst R., Katritch V., Stevens R. C., Wüthrich K., Biased signaling pathways in β2-adrenergic receptor characterized by 19F-NMR. Science 335, 1106–1110 (2012). [DOI] [PMC free article] [PubMed] [Google Scholar]
- 10.Altenbach C., Cai K., Gobind Khorana H., Hubbell W. L., Structural features and light-dependent changes in the sequence 306–322 extending from helix VII to the palmitoylation sites in rhodopsin: A site-directed spin-labeling study. Biochemistry 38, 7931–7937 (1999). [DOI] [PubMed] [Google Scholar]
- 11.Altenbach C., Kusnetzow A. K., Ernst O. P., Hofmann K. P., Hubbell W. L., High-resolution distance mapping in rhodopsin reveals the pattern of helix movement due to activation. Proc. Natl. Acad. Sci. U.S.A. 105, 7439–7444 (2008). [DOI] [PMC free article] [PubMed] [Google Scholar]
- 12.Kirchberg K., Kim T.-Y., Möller M., Skegro D., Dasara Raju G., Granzin J., Büldt G., Schlesinger R., Alexiev U., Conformational dynamics of helix 8 in the GPCR rhodopsin controls arrestin activation in the desensitization process. Proc. Natl. Acad. Sci. U.S.A. 108, 18690–18695 (2011). [DOI] [PMC free article] [PubMed] [Google Scholar]
- 13.White J. F., Noinaj N., Shibata Y., Love J., Kloss B., Xu F., Gvozdenovic-Jeremic J., Shah P., Shiloach J., Tate C. G., Grisshammer R., Structure of the agonist-bound neurotensin receptor. Nature 490, 508–513 (2012). [DOI] [PMC free article] [PubMed] [Google Scholar]
- 14.Egloff P., Hillenbrand M., Klenk C., Batyuk A., Heine P., Balada S., Schlinkmann K. M., Scott D. J., Schütz M., Plückthun A., Structure of signaling-competent neurotensin receptor 1 obtained by directed evolution in Escherichia coli. Proc. Natl. Acad. Sci. U.S.A. 111, E655–E662 (2014). [DOI] [PMC free article] [PubMed] [Google Scholar]
- 15.Krumm B. E., White J. F., Shah P., Grisshammer R., Structural prerequisites for G-protein activation by the neurotensin receptor. Nat. Commun. 6, 7895 (2015). [DOI] [PMC free article] [PubMed] [Google Scholar]
- 16.Krumm B. E., Lee S., Bhattacharya S., Botos I., White C. F., Du H., Vaidehi N., Grisshammer R., Structure and dynamics of a constitutively active neurotensin receptor. Sci. Rep. 6, 38564 (2016). [DOI] [PMC free article] [PubMed] [Google Scholar]
- 17.Dijkman P. M., Castell O. K., Goddard A. D., Munoz-Garcia J. C., de Graaf C., Wallace M. I., Watts A., Dynamic tuneable G protein-coupled receptor monomer-dimer populations. Nat. Commun. 9, 1710 (2018). [DOI] [PMC free article] [PubMed] [Google Scholar]
- 18.Oates J., Faust B., Attrill H., Harding P., Orwick M., Watts A., The role of cholesterol on the activity and stability of neurotensin receptor 1. Biochim. Biophys. Acta 1818, 2228–2233 (2012). [DOI] [PubMed] [Google Scholar]
- 19.Kusnetzow A. K., Altenbach C., Hubbell W. L., Conformational states and dynamics of rhodopsin in micelles and bilayers. Biochemistry 45, 5538–5550 (2006). [DOI] [PMC free article] [PubMed] [Google Scholar]
- 20.Cheng H.-T., Megha, London E., Preparation and properties of asymmetric vesicles that mimic cell membranes: Effect upon lipid raft formation and transmembrane helix orientation. J. Biol. Chem. 284, 6079–6092 (2009). [DOI] [PMC free article] [PubMed] [Google Scholar]
- 21.J. H. Freed, Theory of slowly tumbling ESR spectra for nitroxides, in Spin Labeling: Theory and Applications, L. J. Berliner, Ed. (Academic Press, 1976), vol. I, pp. 53–132. [Google Scholar]
- 22.Carpenter B., Tate C. G., Active state structures of G protein-coupled receptors highlight the similarities and differences in the G protein and arrestin coupling interfaces. Curr. Opin. Struct. Biol. 45, 124–132 (2017). [DOI] [PubMed] [Google Scholar]
- 23.Lee S., Bhattacharya S., Tate C. G., Grisshammer R., Vaidehi N., Structural dynamics and thermostabilization of neurotensin receptor 1. J. Phys. Chem. B 119, 4917–4928 (2015). [DOI] [PMC free article] [PubMed] [Google Scholar]
- 24.Rahmeh R., Damian M., Cottet M., Orcel H., Mendre C., Durroux T., Sharma K. S., Durand G., Pucci B., Trinquet E., Zwier J. M., Deupi X., Bron P., Banères J.-L., Mouillac B., Granier S., Structural insights into biased G protein-coupled receptor signaling revealed by fluorescence spectroscopy. Proc. Natl. Acad. Sci. U.S.A. 109, 6733–6738 (2012). [DOI] [PMC free article] [PubMed] [Google Scholar]
- 25.Fay J. F., Farrens D. L., Structural dynamics and energetics underlying allosteric inactivation of the cannabinoid receptor CB1. Proc. Natl. Acad. Sci. U.S.A. 112, 8469–8474 (2015). [DOI] [PMC free article] [PubMed] [Google Scholar]
- 26.Kato H. E., Zhang Y., Hu H., Suomivuori C.-M., Kadji F. M. N., Aoki J., Kumar K. K., Fonseca R., Hilger D., Huang W., Latorraca N. R., Inoue A., Dror R. O., Kobilka B. K., Skiniotis G., Conformational transitions of a neurotensin receptor 1–Gi1 complex. Nature 572, 80–85 (2019). [DOI] [PMC free article] [PubMed] [Google Scholar]
- 27.Najimi M., Gailly P., Maloteaux J. M., Hermans E., Distinct regions of C-terminus of the high affinity neurotensin receptor mediate the functional coupling with pertussis toxin sensitive and insensitive G-proteins. FEBS Lett. 512, 329–333 (2002). [DOI] [PubMed] [Google Scholar]
- 28.Kumar A., Plückthun A., In vivo assembly and large-scale purification of a GPCR - Gα fusion with Gβγ, and characterization of the active complex. PLOS ONE 14, e0210131 (2019). [DOI] [PMC free article] [PubMed] [Google Scholar]
- 29.García-Nafría J., Tate C. G., Cryo-EM structures of GPCRs coupled to Gs, Gi and Go. Mol. Cell. Endocrinol. 488, 1–13 (2019). [DOI] [PubMed] [Google Scholar]
- 30.Manglik A., Kim T. H., Masureel M., Altenbach C., Yang Z., Hilger D., Lerch M. T., Kobilka T. S., Thian F. S., Hubbell W. L., Prosser R. S., Kobilka B. K., Structural insights into the dynamic process of β2-adrenergic receptor signaling. Cell 161, 1101–1111 (2015). [DOI] [PMC free article] [PubMed] [Google Scholar]
- 31.Choi G., Guo J., Makriyannis A., The conformation of the cytoplasmic helix 8 of the CB1 cannabinoid receptor using NMR and circular dichroism. Biochim. Biophys. Acta 1668, 1–9 (2005). [DOI] [PubMed] [Google Scholar]
- 32.Katragadda M., Maciejewski M. W., Yeagle P. L., Structural studies of the putative helix 8 in the human β2 adrenergic receptor: An NMR study. Biochim. Biophys. Acta 1663, 74–81 (2004). [DOI] [PubMed] [Google Scholar]
- 33.Inagaki S., Ghirlando R., White J. F., Gvozdenovic-Jeremic J., Northup J. K., Grisshammer R., Modulation of the interaction between neurotensin receptor NTS1 and Gq protein by lipid. J. Mol. Biol. 417, 95–111 (2012). [DOI] [PMC free article] [PubMed] [Google Scholar]
- 34.Sensoy O., Weinstein H., A mechanistic role of helix 8 in GPCRs: Computational modeling of the dopamine D2 receptor interaction with the GIPC1–PDZ-domain. Biochim. Biophys. Acta 1848, 976–983 (2015). [DOI] [PMC free article] [PubMed] [Google Scholar]
- 35.Chini B., Parenti M., G-protein-coupled receptors, cholesterol and palmitoylation: Facts about fats. J. Mol. Endocrinol. 42, 371–379 (2009). [DOI] [PubMed] [Google Scholar]
- 36.Heakal Y., Woll M. P., Fox T., Seaton K., Levenson R., Kester M., Neurotensin receptor-1 inducible palmitoylation is required for efficient receptor-mediated mitogenic-signaling within structured membrane microdomains. Cancer Biol. Ther. 12, 427–435 (2011). [DOI] [PMC free article] [PubMed] [Google Scholar]
- 37.Stansfeld P. J., Goose J. E., Caffrey M., Carpenter E. P., Parker J. L., Newstead S., Sansom M. S. P., MemProtMD: Automated insertion of membrane protein structures into explicit lipid membranes. Structure 23, 1350–1361 (2015). [DOI] [PMC free article] [PubMed] [Google Scholar]
- 38.Koldsø H., Shorthouse D., Hélie J., Sansom M. S. P., Lipid clustering correlates with membrane curvature as revealed by molecular simulations of complex lipid bilayers. PLOS Comput. Biol. 10, e1003911 (2014). [DOI] [PMC free article] [PubMed] [Google Scholar]
- 39.Wassenaar T. A., Ingólfsson H. I., Böckmann R. A., Tieleman D. P., Marrink S. J., Computational lipidomics with insane: A versatile tool for generating custom membranes for molecular simulations. J. Chem. Theory Comput. 11, 2144–2155 (2015). [DOI] [PubMed] [Google Scholar]
- 40.Kruschke J. K., Bayesian estimation supersedes the t test. J. Exp. Psychol. Gen. 142, 573–603 (2013). [DOI] [PubMed] [Google Scholar]
- 41.Isberg V., Vroling B., van der Kant R., Li K., Vriend G., Gloriam D., GPCRDB: An information system for G protein-coupled receptors. Nucleic Acids Res. 42, D422–D425 (2014). [DOI] [PMC free article] [PubMed] [Google Scholar]
- 42.Crooks G. E., Hon G., Chandonia J.-M., Brenner S. E., WebLogo: A sequence logo generator. Genome Res. 14, 1188–1190 (2004). [DOI] [PMC free article] [PubMed] [Google Scholar]
- 43.Cheng R. K. Y., Segala E., Robertson N., Deflorian F., Doré A. S., Errey J. C., Fiez-Vandal C., Marshall F. H., Cooke R. M., Structures of human A1 and A2A adenosine receptors with xanthines reveal determinants of selectivity. Structure 25, 1275–1285.e4 (2017). [DOI] [PubMed] [Google Scholar]
- 44.Zhang H., Unal H., Desnoyer R., Han G. W., Patel N., Katritch V., Karnik S. S., Cherezov V., Stevens R. C., Structural basis for ligand recognition and functional selectivity at angiotensin receptor. J. Biol. Chem. 290, 29127–29139 (2015). [DOI] [PMC free article] [PubMed] [Google Scholar]
- 45.Taniguchi R., Inoue A., Sayama M., Uwamizu A., Yamashita K., Hirata K., Yoshida M., Tanaka Y., Kato H. E., Nakada-Nakura Y., Otani Y., Nishizawa T., Doi T., Ohwada T., Ishitani R., Aoki J., Nureki O., Structural insights into ligand recognition by the lysophosphatidic acid receptor LPA6. Nature 548, 356–360 (2017). [DOI] [PubMed] [Google Scholar]
- 46.Zhang D., Gao Z.-G., Zhang K., Kiselev E., Crane S., Wang J., Paoletta S., Yi C., Ma L., Zhang W., Han G. W., Liu H., Cherezov V., Katritch V., Jiang H., Stevens R. C., Jacobson K. A., Zhao Q., Wu B., Two disparate ligand-binding sites in the human P2Y1 receptor. Nature 520, 317–321 (2015). [DOI] [PMC free article] [PubMed] [Google Scholar]
- 47.Zhang K., Zhang J., Gao Z.-G., Zhang D., Zhu L., Han G. W., Moss S. M., Paoletta S., Kiselev E., Lu W., Fenalti G., Zhang W., Müller C. E., Yang H., Jiang H., Cherezov V., Katritch V., Jacobson K. A., Stevens R. C., Wu B., Zhao Q., Structure of the human P2Y12 receptor in complex with an antithrombotic drug. Nature 509, 115–118 (2014). [DOI] [PMC free article] [PubMed] [Google Scholar]
- 48.Cao C., Tan Q., Xu C., He L., Yang L., Zhou Y., Zhou Y., Qiao A., Lu M., Yi C., Han G. W., Wang X., Li X., Yang H., Rao Z., Jiang H., Zhao Y., Liu J., Stevens R. C., Zhao Q., Zhang X. C., Wu B., Structural basis for signal recognition and transduction by platelet-activating-factor receptor. Nat. Struct. Mol. Biol. 25, 488–495 (2018). [DOI] [PubMed] [Google Scholar]
- 49.Zhang C., Srinivasan Y., Arlow D. H., Fung J. J., Palmer D., Zheng Y., Green H. F., Pandey A., Dror R. O., Shaw D. E., Weis W. I., Coughlin S. R., Kobilka B. K., High-resolution crystal structure of human protease-activated receptor 1. Nature 492, 387–392 (2012). [DOI] [PMC free article] [PubMed] [Google Scholar]
- 50.Luginina A., Gusach A., Marin E., Mishin A., Brouillette R., Popov P., Shiriaeva A., Besserer-Offroy É., Longpré J.-M., Lyapina E., Ishchenko A., Patel N., Polovinkin V., Safronova N., Bogorodskiy A., Edelweiss E., Hu H., Weierstall U., Liu W., Batyuk A., Gordeliy V., Han G. W., Sarret P., Katritch V., Borshchevskiy V., Cherezov V., Structure-based mechanism of cysteinyl leukotriene receptor inhibition by antiasthmatic drugs. Sci. Adv. 5, eaax2518 (2019). [DOI] [PMC free article] [PubMed] [Google Scholar]
- 51.Gusach A., Luginina A., Marin E., Brouillette R. L., Besserer-Offroy É., Longpré J.-M., Ishchenko A., Popov P., Patel N., Fujimoto T., Maruyama T., Stauch B., Ergasheva M., Romanovskaia D., Stepko A., Kovalev K., Shevtsov M., Gordeliy V., Han G. W., Katritch V., Borshchevskiy V., Sarret P., Mishin A., Cherezov V., Structural basis of ligand selectivity and disease mutations in cysteinyl leukotriene receptors. Nat. Commun. 10, 5573 (2019). [DOI] [PMC free article] [PubMed] [Google Scholar]
- 52.Zhou Y., Cao C., He L., Wang X., Zhang X. C., Crystal structure of dopamine receptor D4 bound to the subtype selective ligand, L745870. eLife 8, e48822 (2019). [DOI] [PMC free article] [PubMed] [Google Scholar]
- 53.Apel A.-K., Cheng R. K. Y., Tautermann C. S., Brauchle M., Huang C.-Y., Pautsch A., Hennig M., Nar H., Schnapp G., Crystal structure of CC chemokine receptor 2A in complex with an orthosteric antagonist provides insights for the design of selective antagonists. Structure. 27, 427–438.e5 (2019). [DOI] [PubMed] [Google Scholar]
- 54.Che T., Majumdar S., Zaidi S. A., Ondachi P., McCorvy J. D., Wang S., Mosier P. D., Uprety R., Vardy E., Krumm B. E., Han G. W., Lee M.-Y., Pardon E., Steyaert J., Huang X.-P., Strachan R. T., Tribo A. R., Pasternak G. W., Carroll F. I., Stevens R. C., Cherezov V., Katritch V., Wacker D., Roth B. L., Structure of the nanobody-stabilized active state of the kappa opioid receptor. Cell 172, 55–67.e15 (2018). [DOI] [PMC free article] [PubMed] [Google Scholar]
- 55.Zhang H., Han G. W., Batyuk A., Ishchenko A., White K. L., Patel N., Sadybekov A., Zamlynny B., Rudd M. T., Hollenstein K., Tolstikova A., White T. A., Hunter M. S., Weierstall U., Liu W., Babaoglu K., Moore E. L., Katz R. D., Shipman J. M., Garcia-Calvo M., Sharma S., Sheth P., Soisson S. M., Stevens R. C., Katritch V., Cherezov V., Structural basis for selectivity and diversity in angiotensin II receptors. Nature 544, 327–332 (2017). [DOI] [PMC free article] [PubMed] [Google Scholar]
- 56.Asada H., Horita S., Hirata K., Shiroishi M., Shiimura Y., Iwanari H., Hamakubo T., Shimamura T., Nomura N., Kusano-arai O., Uemura T., Suno C., Kobayashi T., Iwata S., Crystal structure of the human angiotensin II type 2 receptor bound to an angiotensin II analog. Nat. Struct. Mol. Biol. 25, 570–576 (2018). [DOI] [PubMed] [Google Scholar]
- 57.Hori T., Okuno T., Hirata K., Yamashita K., Kawano Y., Yamamoto M., Hato M., Nakamura M., Shimizu T., Yokomizo T., Miyano M., Yokoyama S., Na+-mimicking ligands stabilize the inactive state of leukotriene B4 receptor BLT1. Nat. Chem. Biol. 14, 262–269 (2018). [DOI] [PubMed] [Google Scholar]
- 58.Wu B., Chien E. Y. T., Mol C. D., Fenalti G., Liu W., Katritch V., Abagyan R., Brooun A., Wells P., Bi F. C., Hamel D. J., Kuhn P., Handel T. M., Cherezov V., Stevens R. C., Structures of the CXCR4 chemokine GPCR with small-molecule and cyclic peptide antagonists. Science 330, 1066–1071 (2010). [DOI] [PMC free article] [PubMed] [Google Scholar]
- 59.Qin L., Kufareva I., Holden L. G., Wang C., Zheng Y., Zhao C., Fenalti G., Wu H., Han G. W., Cherezov V., Abagyan R., Stevens R. C., Handel T. M., Crystal structure of the chemokine receptor CXCR4 in complex with a viral chemokine. Science 347, 1117–1122 (2015). [DOI] [PMC free article] [PubMed] [Google Scholar]
- 60.Lu J., Byrne N., Wang J., Bricogne G., Brown F. K., Chobanian H. R., Colletti S. L., Di Salvo J., Thomas-Fowlkes B., Guo Y., Hall D. L., Hadix J., Hastings N. B., Hermes J. D., Ho T., Howard A. D., Josien H., Kornienko M., Lumb K. J., Miller M. W., Patel S. B., Pio B., Plummer C. W., Sherborne B. S., Sheth P., Souza S., Tummala S., Vonrhein C., Webb M., Allen S. J., Johnston J. M., Weinglass A. B., Sharma S., Soisson S. M., Structural basis for the cooperative allosteric activation of the free fatty acid receptor GPR40. Nat. Struct. Mol. Biol. 24, 570–577 (2017). [DOI] [PubMed] [Google Scholar]
- 61.Srivastava A., Yano J., Hirozane Y., Kefala G., Gruswitz F., Snell G., Lane W., Ivetac A., Aertgeerts K., Nguyen J., Jennings A., Okada K., High-resolution structure of the human GPR40 receptor bound to allosteric agonist TAK-875. Nature 513, 124–127 (2014). [DOI] [PubMed] [Google Scholar]
- 62.Ho J. D., Chau B., Rodgers L., Lu F., Wilbur K. L., Otto K. A., Chen Y., Song M., Riley J. P., Yang H.-C., Reynolds N. A., Kahl S. D., Patel Lewis A., Groshong C., Madsen R. E., Conners K., Lineswala J. P., Gheyi T., Decipulo Saflor M.-B., Lee M. R., Benach J., Baker K. A., Montrose-Rafizadeh C., Genin M. J., Miller A. R., Hamdouchi C., Structural basis for GPR40 allosteric agonism and incretin stimulation. Nat. Commun. 9, 1645 (2018). [DOI] [PMC free article] [PubMed] [Google Scholar]
- 63.Sreerama N., Venyaminov S. Y., Woody R. W., Estimation of the number of α-helical and β-strand segments in proteins using circular dichroism spectroscopy. Protein Sci. 8, 370–380 (1999). [DOI] [PMC free article] [PubMed] [Google Scholar]
- 64.Whitmore L., Wallace B. A., DICHROWEB, an online server for protein secondary structure analyses from circular dichroism spectroscopic data. Nucleic Acids Res. 32, W668–W673 (2004). [DOI] [PMC free article] [PubMed] [Google Scholar]
- 65.Andrade M. A., Chacón P., Merelo J. J., Morán F., Evaluation of secondary structure of proteins from UV circular dichroism spectra using an unsupervised learning neural network. Protein Eng. 6, 383–390 (1993). [DOI] [PubMed] [Google Scholar]
- 66.Provencher S. W., Glöckner J., Estimation of globular protein secondary structure from circular dichroism. Biochemistry 20, 33–37 (1981). [DOI] [PubMed] [Google Scholar]
- 67.Compton L. A., Johnson W. C. Jr., Analysis of protein circular dichroism spectra for secondary structure using a simple matrix multiplication. Anal. Biochem. 155, 155–167 (1986). [DOI] [PubMed] [Google Scholar]
- 68.Sreerama N., Woody R. W., A self-consistent method for the analysis of protein secondary structure from circular dichroism. Anal. Biochem. 209, 32–44 (1993). [DOI] [PubMed] [Google Scholar]
- 69.Abdul-Gader A., Miles A. J., Wallace B. A., A reference dataset for the analyses of membrane protein secondary structures and transmembrane residues using circular dichroism spectroscopy. Bioinformatics 27, 1630–1636 (2011). [DOI] [PubMed] [Google Scholar]
- 70.Lees J. G., Miles A. J., Wien F., Wallace B. A., A reference database for circular dichroism spectroscopy covering fold and secondary structure space. Bioinformatics 22, 1955–1962 (2006). [DOI] [PubMed] [Google Scholar]
- 71.Sreerama N., Venyaminov S. Y., Woody R. W., Estimation of protein secondary structure from circular dichroism spectra: Inclusion of denatured proteins with native proteins in the analysis. Anal. Biochem. 287, 243–251 (2000). [DOI] [PubMed] [Google Scholar]
- 72.Mao D., Wachter E., Wallace B. A., Folding of the mitochondrial proton adenosine triphosphatase proteolipid channel in phospholipid vesicles. Biochemistry 21, 4960–4968 (1982). [DOI] [PubMed] [Google Scholar]
Associated Data
This section collects any data citations, data availability statements, or supplementary materials included in this article.
Supplementary Materials
Supplementary material for this article is available at http://advances.sciencemag.org/cgi/content/full/6/33/eaav8207/DC1