Abstract
Background
Epistasis describes how gene‐gene interactions affect phenotypes, and could have a profound impact on human diseases such as coronary artery disease (CAD). The goal of this study was to identify gene‐gene interactions in CAD using an easily generalizable multi‐stage approach.
Methods and Results
Our forward genetic approach consists of multiple steps that combine statistical and functional approaches, and analyze information from global gene expression profiling, functional interactions, and genetic interactions to robustly identify gene‐gene interactions. Global gene expression profiling shows that knockdown of ANRIL (DQ485454) at 9p21.3 GWAS (genome‐wide association studies) CAD locus upregulates TMEM100 and TMEM106B. Functional studies indicate that the increased monocyte adhesion to endothelial cells and transendothelial migration of monocytes, 2 critical processes in the initiation of CAD, by ANRIL knockdown are reversed by knockdown of TMEM106B, but not of TMEM100. Furthermore, the decreased monocyte adhesion to endothelial cells and transendothelial migration of monocytes induced by ANRIL overexpression was reversed by overexpressing TMEM106B. TMEM106B expression was upregulated by >2‐fold in CAD coronary arteries. A significant association was found between variants in TMEM106B (but not in TMEM100) and CAD (P=1.9×10⁻⁸). Significant gene‐gene interaction was detected between ANRIL variant rs2383207 and TMEM106B variant rs3807865 (P=0.009). A similar approach also identifies significant interaction between rs6903956 in ADTRP and rs17465637 in MIA3 (P=0.005).
Conclusions
We demonstrate 2 pairs of epistatic interactions between GWAS loci for CAD and offer important insights into the genetic architecture and molecular mechanisms for the pathogenesis of CAD. Our strategy has broad applicability to the identification of epistasis in other human diseases.
Keywords: coronary artery disease, gene‐gene interactions, Genome‐wide Association Studies, long non‐coding RNA (lncRNA) ANRIL (CDKN2B‐AS1), TMEM106B
Subject Categories: Coronary Artery Disease; Atherosclerosis; Genetic, Association Studies; Gene Expression & Regulation; Functional Genomics
Clinical Perspective
What Is New?
Coronary artery disease loci identified by GWAS (genome‐wide association studies) interact with each other to confer an epistatic effect on risk of the disease, and ANRIL locus on chromosome 9p21.3 interacts with the TMEM106B locus on 7p21.3, whereas the MIA3 locus on 1q41 interacts with the ADTRP locus on 6p24.1.
TMEM106B expression is upregulated in coronary artery tissue samples from CAD patients, and correlated with downregulation of ANRIL (DQ485454); TMEM106B modulates the effects of ANRIL on endothelial functions involved in atherosclerosis and CAD.
ANRIL is the causal gene for CAD at the 9p21.3 locus, and TMEM106B is the causal gene at the 7q21.11 CAD locus.
What Are the Clinical Implications?
Identification of epistasis is paramount to our understanding of the genetic architecture of a human disease, and may have an important implication on future precision diagnosis and risk stratification of common human diseases based on polygenic risk scores and other methods.
The causal genes for CAD ANRIL and TMEM106B may serve as targets for development of drugs and other therapeutic agents to prevent and treat CAD.
Nonstandard Abbreviations and Acronyms.
ADTRP Androgen Dependent TFPI Regulating Protein
ANRIL Antisense Non‐coding RNA in the INK4 Locus
CAD Coronary Artery Disease
EC Endothelial Cell
GWAS Genome‐wide Association Studies
HCAEC Human Coronary Artery Endothelial Cells
MAF Minor Allele Frequency
MI Myocardial Infarction
MIA3 MIA SH3 domain ER export factor 3
TMEM100 Transmembrane protein 100
TMEM106B Transmembrane protein 106B
Introduction
Coronary artery disease (CAD) is the leading cause of death and disability worldwide.1, 2 CAD is caused by atherosclerosis in coronary arteries, which is initiated by monocyte adhesion to endothelial cells (ECs) upon stimulation of oxidized low‐density lipoprotein and other inflammatory factors.1, 2 The monocytes then transmigrate across the endothelium into the intima, and differentiate into macrophages, which are transformed into foam cells (plaques), the hallmark of atherosclerosis, in the walls of the coronary arteries.1, 2 The fissure, erosion, and rupture of plaques lead to possible thrombosis, myocardial infarction (MI) and sudden death.1, 2 GWAS (genome‐wide association studies) have identified >150 genomic loci associated with CAD and MI.3 However, identification of the causal gene(s) under each locus and functional characterization of causal genes are challenging. The first CAD locus on chromosome 9p21.3 identified by GWAS remains the most robust locus.3 More than 50 CAD‐associated genomic variants are located at the 9p21.3 CAD locus and multiple candidate genes for CAD were found at the locus, including ANRIL, CDKN2A, CDKN2B, and MTAP.4 Recently, we showed that the major transcript DQ485454 of ANRIL, which encodes a long non‐coding RNA, showed significant downregulation in CAD coronary arteries compared with non‐CAD arteries.5 A series of knockdown and overexpression studies in 2 different endothelial cells (ECs), EA.hy926 cells and human coronary artery endothelial cells (HCAECs), revealed that ANRIL regulates EC functions directly involved in atherosclerosis, and suggested that ANRIL is involved in the pathogenesis of CAD.5
The mechanisms by which ANRIL deregulation mediates the development of atherosclerosis are not well understood. We performed global gene expression profiling for ANRIL, and showed that knockdown of ANRIL downregulated expression of AHNAK2, CLIP1, CXCL11, ENC1, EZR, LYVE1, WASL, and TNFSF10 genes and upregulated TMEM100 and TMEM106B genes.5 We functionally characterized the downregulated genes by ANRIL knockdown and found that CLIP1, EZR, and LYVE1 were involved in modulating the function of ANRIL in ECs.5 however, the 2 upregulated genes were not functionally characterized further. In this study, we continued these studies, and focused on TMEM100 on chromosome 17q22 and TMEM106B on 7p21.3. TMEM100 encodes a transmembrane protein 100 with 134 amino acids and 2 hypothetical transmembrane domains. TMEM100 was shown to be involved in arterial endothelium differentiation and vascular morphogenesis,6 endothelial‐mesenchymal transformation during atrioventricular canal cushion formation by endocardial calcium signaling,7 the maintenance of vascular integrity, and the formation of blood vessels.8 TMEM106B encodes another transmembrane protein 106 with 274 amino acids and a single pass, type‐II transmembrane domain. TMEM106B was found to be localized in cellular lysosomes, and regulates lysosome synthesis, size, trafficking, and localization in neurons and cancer cells.9, 10, 11 The function of TMEM106B in cardiovascular cells is unknown.
In this study, we found significant upregulation of the expression level of TMEM106B, but not TMEM100, in CAD coronary artery tissues and performed mechanistic studies to characterize the function of TMEM106B and TMEM100 in the context of ANRIL in endothelial cells, including monocyte adhesion to ECs and transendothelial migration of monocytes involved in atherosclerosis. We found that ANRIL affects EC functions by regulating the expression of TMEM106B, but not TMEM100. Genetic analysis revealed that genomic variants in TMEM106B, but not in TMEM100, were significantly associated with risk of CAD and a significant interaction between the ANRIL locus and the TMEM106B locus was found in conferring susceptibility of CAD in the UK Biobank. A similar approach also identified a significant interaction between 2 other GWAS loci for CAD, the ADTRP locus12, 13 on chromosome 6p24.1 and the MIA3 locus14, 15 on 1q41, also identified for CAD by GWAS.
Methods
The authors declare that all supporting data are available within the article.
Cell Culture and Transfection
Cell culture and transfection were performed as described by us previously.5, 16, 17 Primary human coronary artery endothelial cells (HCAECs) were cultured in a phenol‐red‐free endothelial growth medium supplemented with 2% fetal bovine serum (ThermoFisher Scientific, USA), 0.4% human fibroblast growth factor, 0.1% human epidermal growth factor, 0.1% vascular endothelial growth factor, 0.1% insulin‐like growth factor, 0.1% ascorbic acid, 0.1% heparin, 0.1% gentamicin/amphotericin‐B and 0.04% hydrocortisone. The EAhy926 endothelial cells and HepG2 cells were maintained in DMEM supplemented with 10% fetal bovine serum (ThermoFisher Scientific, USA). Human THP‐1 cells were maintained in the RPMI‐1640 medium supplemented with 10% fetal bovine serum (ThermoFisher Scientific, USA). All cells were purchased from ATCC (American Type Culture Collection, USA) and cultured at 37°C in a humidified incubator with 5% CO2. Transfection of mammalian expression plasmid DNA and small interfering RNAs (siRNAs) into HCAECs and EAhy926 cells were performed using the TransIT‐X2 Dynamic Delivery System (Mirus Bio, Madison, WI). Transfection of HepG2 cells was performed using Lipofectamine 2000 for plasmid DNA (1 μg), and Lipofectamine RNAi MAX for siRNA (80 nmol/L) according to the manufacturer's protocol (ThermoFisher Scientific).
Human Tissue Samples
This study involved 6 CAD patients and 6 age‐matched non‐CAD human tissue samples reportedly by Arckacki et al.18 The mean age was 51±4 years for both CAD and control groups (Table). RNA isolation, cDNA synthesis, and reverse transcription‐polymerase chain reaction (RT‐PCR) analysis was performed as described by us previously.5, 18, 19, 20, 21 We obtained coronary arteries from explanted hearts through the Cleveland Clinic Heart Transplant Program and unmatched or rejected donor hearts from Lifebanc of Northeast Ohio as reported.18 This study was approved by the Cleveland Clinic Institutional Review Board on Human Subject Research and written consent was obtained from the subjects. This study abides by the Declaration of Helsinki principles (Version 2008).
Table 1.
Coronary Artery Tissue Samples
| Sample | Age, y | Race and Sex | LAD Blockage | Past Medical History |
|---|---|---|---|---|
| CAD 1 | 48 | White, M | 40% | Cirrhosis |
| CAD 2 | 53 | White, M | 50% | N/A |
| CAD 3 | 53 | White, M | 90% | Stroke |
| CAD 4 | 47 | White, M | >95% | Drug overdose |
| CAD 5 | 50 | White, M | 100% | Ischemic myopathy |
| CAD 6 | 55 | White, M | 100% | Stroke |
| Control 1 | 48 | White, M | 0% | N/A |
| Control 2 | 53 | White, M | 0% | N/A |
| Control 3 | 53 | White, M | 0% | N/A |
| Control 4 | 47 | White, M | 0% | N/A |
| Control 5 | 50 | White, M | 0% | N/A |
| Control 6 | 55 | White, M | 0% | N/A |
Note that each coronary artery disease sample is matched by a non‐coronary artery disease control sample (eg, coronary artery disease 1 vs Control 1; coronary artery disease 2 vs Control 2; etc). CAD indicates coronary artery disease.
Plasmids and siRNA
A mammalian expression plasmid for ANRIL transcript DQ485454, referred to as pcDNA3.1‐ANRIL (DQ485454), was generated by us as described previously.5 An expression plasmid for TMEM106B was created by subcloning the Mammalian Gene Collection Fully Sequenced Human cDNA clone of TMEM106B (GE Dharmacon, USA) into the pcDNA3.1 vector. All plasmids were individually verified by Sanger sequence analysis.
Small interfering RNAs (siRNAs) for ANRIL, TMEM100, and TMEM106B were purchased from IDT (Integrated DNA Technologies) and the negative control siRNA (siNC) was from GE Dharmacon. The sequences of siRNAs are as follows:
ANRIL siRNA: ATCTGTGTTTTTGTCCAATGTCCTT
TMEM100 siRNA: GCUUAGAAGCACUGUUGUAAAAATG
TMEM106B siRNA: CUUAUGAUGGAGUCACAUCUGAAAA
MIA3 siRNA: GGUGAAGUCUGAAUGCCAUTT
siNC: Lincode control siRNA (GE Dharmacon, USA)
Real‐Time RT‐PCR Analysis
Quantitative RT‐PCR analysis was performed as described previously by us.5, 12, 22, 23 Each sample was run in triplicate and each experiment was repeated at least 3 times. The primer sequences of qRT‐PCR are as follows (from 5′ to 3′):
ANRIL Forward: CCACATCCCTTGGAGTAATGA
ANRIL Reverse: CCTTTTATCACCCAGCTTCG
GAPDH Forward: GTCTCCTCTGACTTCAACAGCG
GAPDH Reverse: ACCACCCTGTTGCTGTAGCCAA
TMEM100 Forward: ACAGTCCCTCTGGTCAGTGAGA
TMEM100 Reverse: GGCGATGAAGACAACCACAGCA
TMEM106B Forward: CCTACTTGTCAGGGAACAGGAAG
TMEM106B Reverse: AACACAGCCAATCCAGAAAGGAG
ADTRP Forward: GCCGCATCCTATGGCTCTACTTTG
ADTRP Reverse: CAAGTAGGTAGATGCTGGCGATGA
MIA3 Forward: TACAAGCGGAGAATTGAAGAAATGG
MIA3 Reverse: GCCAGTTTTCATGAGCTTTCTTCT
Endothelial Cell Functional Assays
HCAECs or EA.hy926 cells were transfected with plasmids or siRNAs as described above and used for various assays for assessment of endothelial cell functions, including monocyte adhesion to endothelial cells, and transendothelial migration of monocytes, as described by us previously.5, 19, 24, 25, 26, 27
Statistical Analysis
In GWAS, to determine the genetic effects of TMEM100 and TMEM106B on the risk of CAD, 1568 single nucleotide polymorphisms within 100 kb regions spanning the 2 genes were selected from 2 large GWAS data sets for CAD, including CADRDIoGRAMplusC4D28 (60 801 cases versus 123 504 controls) and GeneATLAS29 (Key=clinical_c_Block_I20‐I25; 33 387 cases versus 418 877 controls). The summary statistics of 1250 single nucleotide polymorphisms was downloaded from their web portals. Each single nucleotide polymorphism was examined for its association with CAD with a meta‐analysis of CADRDIoGRAMplusC4D and GeneATLAS using statistical program GWAMA30 under the fixed model. To facilitate the meta‐analysis, standard error was re‐estimated from the reported odds ratio and converted z value. Heterogeneity between the 2 studies was further evaluated for each variant by Cohen's Q tests. If significant heterogeneity (Q<0.05 and I2>70%) was identified, results from the random effect model were reported.
Gene‐gene interaction tests between the genetic variant pairs rs2383207 and rs3807865, and rs6903956 and rs17465637 on I20‐I25 Ischemic heart diseases (as defined previously,29 clinical_c_Block_I20‐I25) was performed using 343 145 unrelated White‐British ancestry individuals from UK Biobank. These individuals were a subset of UK Biobank 488 377 genotyped participants, excluding those who failed UK Biobank's own Quality Control because of genotyping missingness rate or heterogeneity, whose sex inferred from the genotypes did not match their self‐reported sex and who were not of white British ancestry. We restricted Quality Control even more and removed individuals with a genotype missingness rate >5% across variants. We only kept unrelated individuals, defined as having a Kinship coefficient smaller than 0.0442 between them. A genotypic interaction between the 2 genetic variants along with the main effects of the 2 variants was tested using a Logistic Regression Model where sex, array batch, UK Biobank Assessment Center, age, age2, the leading 20 genomic principal components as computed by UK Biobank were added as covariates.
In particular, we used the model:
where p i is the probability of the individual i being a case. μ is the model mean, is the vector of covariates for individual i, and β c the vector of covariate effects. and are matrices of dummy binary variables indicating the individual i genotype for the genetic variants s1 and s2, and β s1 and β s2 their effects, respectively. The imputed genotypes were called to the genotype with larger probability. Finally, is a dummy matrix of binary variables indicating the genotype combination between the genetic variants s1 and s2 for individual i. β s1s2 is the vector of effects. The model was fitted by using the Python StatsModels package. It computes the P value for a particular genotype combination by using a z‐test (a z‐score is computed as the ratio between the estimated effect and the error, and then the P value is computed by using a normal distribution to perform a 2‐tailed test). To preclude possible problems with data sparsity we confirmed that all variants had an MAF (Minor Allele Frequency) >0.28 on the UK Biobank population of European ancestry. The genotype combination having less individuals contained at least 878 individuals for cases and 13 040 for controls for the pair rs2383207 and rs3807865; and 302 individuals for cases and 3731 for controls for the variant pair rs6903956 and rs17465637 for I20‐I25 ischemic heart diseases.
Other quantitative data were presented as mean±SD. Statistical analysis was performed with unpaired, 2‐tailed Student t tests using the GraphPad Prism 8.2.1 software program or the R package. Statistical significance was considered at a P value of ≤0.05. The sample size (n) is indicated for each experiment in figure legends. For qRT‐PCR analysis, data of ≥3 SD were removed as outliers.
Results
Knockdown of TMEM106B Rescues ANRIL Knockdown Phenotype of Endothelial Cells Involved in Atherosclerosis
We found that ANRIL affects EC functions by regulating the expression of TMEM106B, but not TMEM100. We first assessed whether knockdown of TMEM100 and TMEM106B expression using siRNA reverses the effects of knockdown of ANRIL expression in 2 types of ECs, EA.hy926 cells (an EC line) and human coronary artery endothelial cells (HCAECs). As shown in Figure 1A through 1F, siRNA for TMEM100 significantly decreased the expression of TMEM100, but not that of TMEM106B or ANRIL in EA.hy926 cells HCAECs. Similarly, siRNA for TMEM106B significantly decreased the expression of TMEM106B, but not that of TMEM100 or ANRIL. As previously reported,5 ANRIL siRNA significantly decreased the expression of ANRIL (DQ485454), and increased the expression of TMEM100 and TMEM106B in EA.hy926 and HCAECs (Figure 1A through 1F). In assays for monocyte adhesion to ECs, knockdown of TMEM100, but not TMEM106B, showed a small but significantly increased effect on EA.hy926 and HCAECs, whereas a positive control, ANRIL siRNA, showed a stronger effect on increasing monocyte adhesion to EA.hy926 and HCAECs (Figure 2A and 2B). On the other hand, knockdown of neither TMEM100 nor TMEM106B in EA.hy926 and HCAECs showed any effect on transendothelial migration of monocytes although positive control ANRIL siRNA significantly increased transendothelial migration of monocytes (Figure 2C and 2D).
Figure 1.
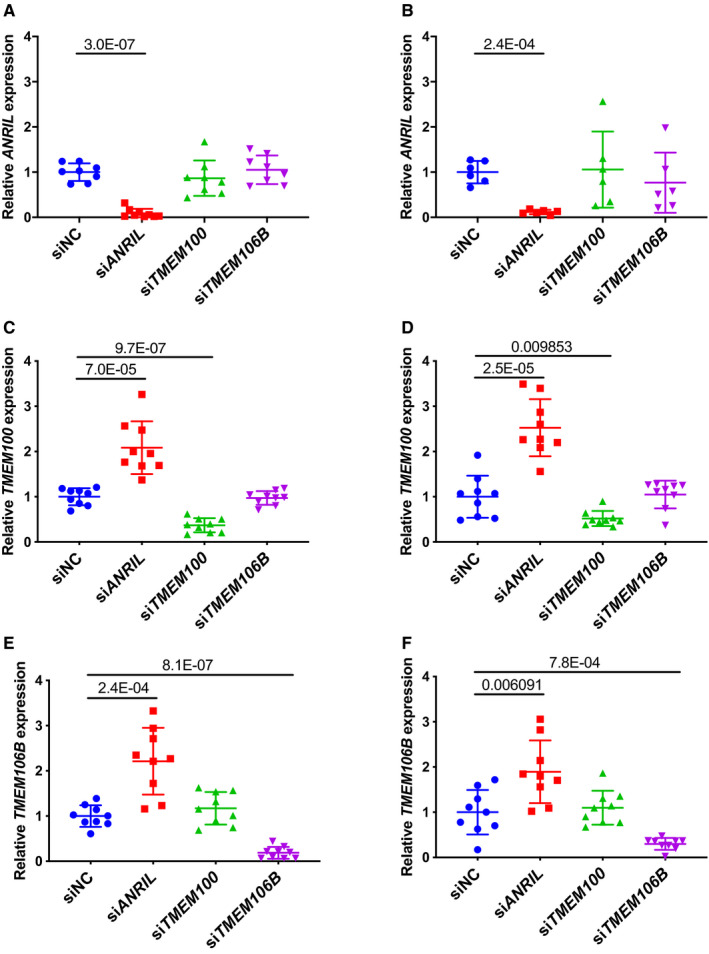
Real‐time quantitative reverse transcription‐polymerase chain reaction analysis of expression of ANRIL, TMEM100, and TMEM106B in endothelial cells (ECs) transfected with different small interfering (si)RNA.
A, Relative expression of ANRIL in EA.hy926 cells transiently transfected with siNC, siANRIL, siTMEM100, or siTMEM106B (n=8 samples/group; 3 wells/experiment with each experiment repeated twice again; data points of ≥3 SD were removed as outliers). B, Relative expression of ANRIL in human coronary artery endothelial cells transiently transfected with siNC, siANRIL, siTMEM100, or siTMEM106B (n=6 samples/group; 3 wells/experiment with each experiment repeated again). C, Relative expression of TMEM100 in EA.hy926 cells transiently transfected with siNC, siANRIL, siTMEM100, or siTMEM106B (n=9 samples/group; 3 wells/experiment with each experiment repeated twice again). D, Relative expression of TMEM100 in human coronary artery endothelial cells transiently transfected with siNC, siANRIL, siTMEM100, or siTMEM106B (n=9 samples/group; 3 wells/experiment with each experiment repeated twice again). E, Relative expression of TMEM106B in EA.hy926 cells transiently transfected with siNC, siANRIL, siTMEM100, or siTMEM106B (n=9 samples/group; 3 wells/experiment with each experiment repeated twice again). F, Relative expression of TMEM106B in human coronary artery endothelial cells transiently transfected with siNC, siANRIL, siTMEM100, or siTMEM106B (n=9 samples/group; 3 wells/experiment with each experiment repeated twice again). Statistical analysis was performed using unpaired, 2‐tailed Student t tests. Si indicates small interfering.
Figure 2.
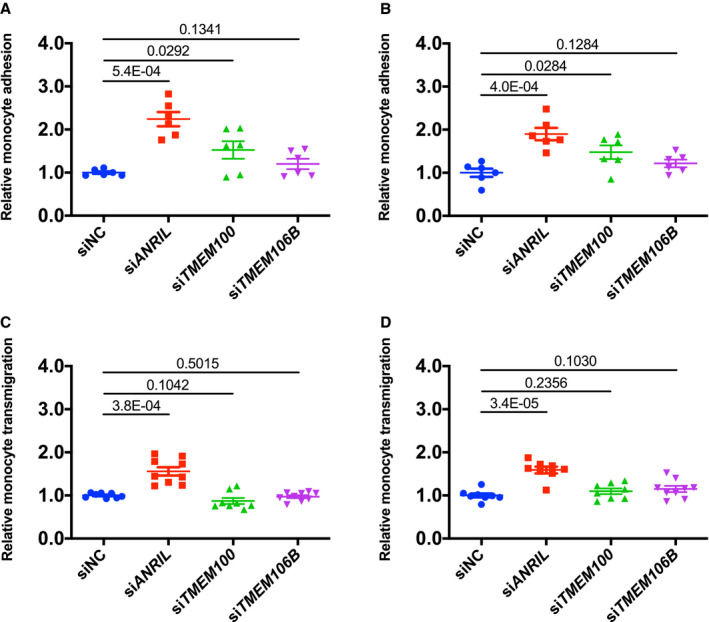
Analysis of the effect of knockdown of TMEM100 or TMEM106B on monocyte adhesion to endothelial cells and transendothelial migration of monocytes.
A, Relative adhesion of monocytes to EA.hy926 cells transfected with small interfering (si)NC, siANRIL, siTMEM100, or siTMEM106B (n=6 samples/group; 3 wells/experiment with each experiment repeated again). B, Relative adhesion of monocytes to human coronary artery endothelial cells transfected with siNC, siANRIL, siTMEM100, or siTMEM106B (n=6 samples/group; 3 wells/experiment with each experiment repeated again). C, Relative transmigration of monocytes across a layer of EA.hy926 cells transfected with siNC, siANRIL, siTMEM100, or siTMEM106B (n=9 samples/group; 3 wells/experiment with each experiment repeated twice again). D, Relative transmigration of monocytes across human coronary artery endothelial cells transfected with siNC, siANRIL, siTMEM100, or siTMEM106B (n=9 samples/group; 3 wells/experiment with each experiment repeated twice again). Statistical analysis was performed using unpaired, 2‐tailed Student t‐tests. Si indicates small interfering.
As ANRIL knockdown increased TMEM100 and TMEM106B expression, we next examined whether knockdown of TMEM100 and TMEM106B could reverse the effects of ANRIL on ECs. We first confirmed that in EAhy926 and HCAECs co‐transfected with ANRIL siRNA and TMEM100 siRNA or TMEM106B siRNA showed successful knockdown of both ANRIL and TMEM100 or knockdown of both ANRIL and TMEM106B (Figure 3A through 3F). Knockdown of TMEM106B effectively reversed the effect of ANRIL knockdown on monocyte adhesion to EA.hy926 (Figure 4A) and HCAECs (Figure 4B) and transendothelial migration of monocytes (Figure 4C and 4D). However, knockdown of TMEM100 did not have any significant impact on the effects of ANRIL knockdown on monocyte adhesion to ECs or transendothelial migration of monocytes in EA.hy926 (Figure 4A through 4D). These data suggest that ANRIL knockdown affects EC functions relevant to atherosclerosis by upregulating the expression of TMEM106B, but not TMEM100.
Figure 3.
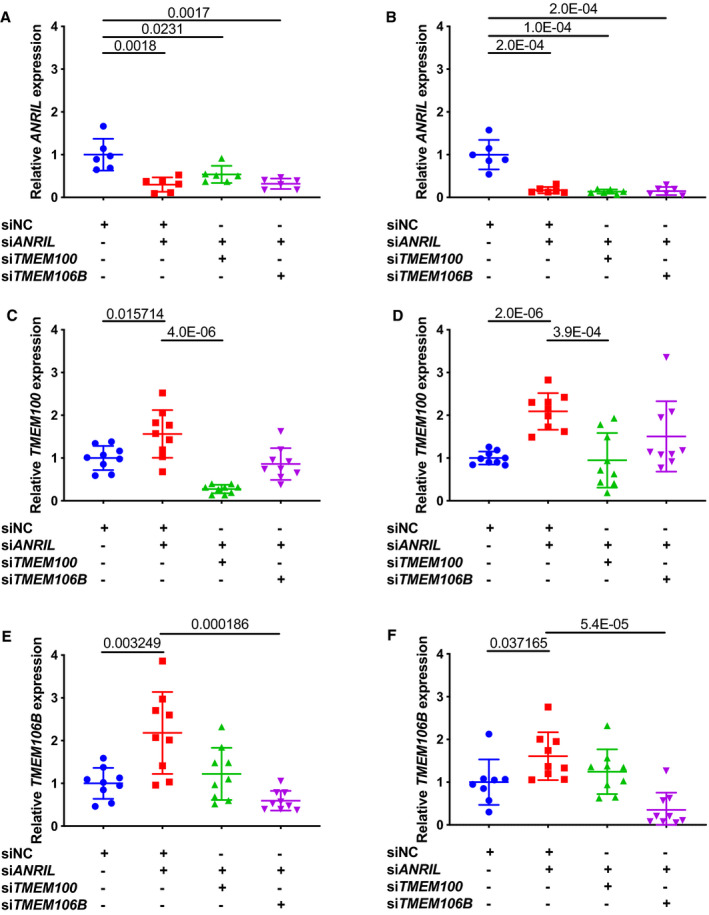
Real‐time reverse transcription‐polymerase chain reaction (RT‐PCR) analysis of expression of ANRIL, TMEM100, and TMEM106B in endothelial cells (ECs) transfected with different siRNA.
A, Relative expression of ANRIL in EA.hy926 cells transiently co‐transfected with different combinations of small interfering (si)NC (negative control siRNA), siANRIL, siTMEM100, or siTMEM106B was quantified by quantitative RT‐PCR (qRT‐PCR) (n=6 samples/group; 3 wells/experiment with each experiment repeated again). B, Relative expression of ANRIL in human coronary artery endothelial cells transiently co‐transfected with different combinations of siNC, siANRIL, siTMEM100, or siTMEM106B (n=6 samples/group; 3 wells/experiment with each experiment repeated again) was quantified by qRT‐PCR. C, Relative expression of TMEM100 in EA.hy926 cells transiently co‐transfected with different combinations of siNC, siANRIL, siTMEM100, or siTMEM106B (n=9 samples/group; 3 wells/experiment with each experiment repeated twice again) was quantified by qRT‐PCR. D, Relative expression of TMEM100 in human coronary artery endothelial cells transiently co‐transfected with different combinations of siNC, siANRIL, siTMEM100, or siTMEM106B (n=9 samples/group; 3 wells/experiment with each experiment repeated twice again) was quantified by qRT‐PCR. E, Relative expression of TMEM106B in EA.hy926 cells transiently co‐transfected with different combinations of siNC, siANRIL, siTMEM100, or siTMEM106B (n=9 samples/group; 3 wells/experiment with each experiment repeated twice again) was quantified by qRT‐PCR. F, Relative expression of TMEM106B in human coronary artery endothelial cells transiently co‐transfected with different combinations of siNC, siANRIL, siTMEM100, or siTMEM106B (n=9 samples/group; 3 wells/experiment with each experiment repeated twice again) was quantified by qRT‐PCR. Statistical analysis was performed using unpaired, 2‐tailed Student t‐tests. Si indicates small interfering.
Figure 4.
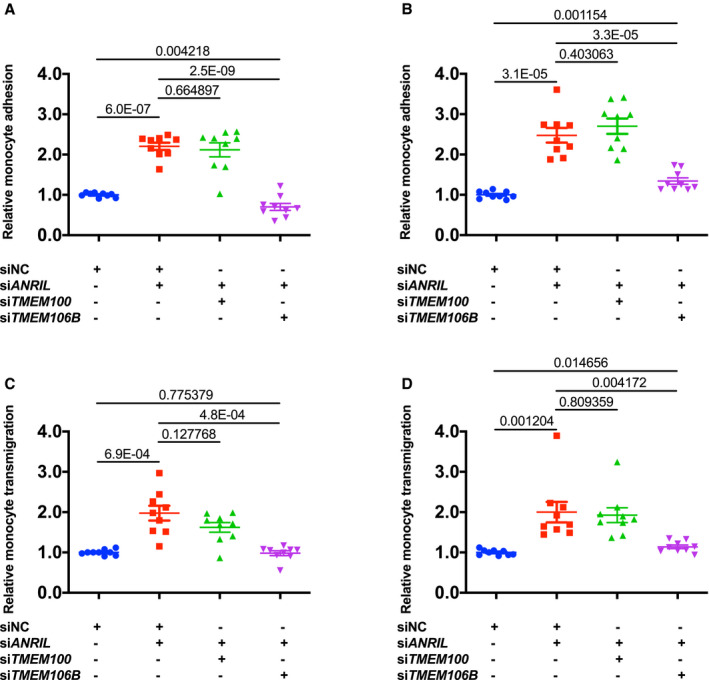
Knockdown of TMEM106B, but not TMEM100, reverses the effects of knockdown of ANRIL on monocyte adhesion to endothelial cells and transendothelial migration of monocytes.
A, Relative adhesion of monocytes to EA.hy926 cells transiently co‐transfected with different combinations of small interfering (si)NC (negative control siRNA), siANRIL, siTMEM100, or siTMEM106B (n=9 samples/group; 3 wells/experiment with each experiment repeated twice again). B, Relative adhesion of monocytes to human coronary artery endothelial cells transiently co‐transfected with different combinations of siNC, siANRIL, siTMEM100, or siTMEM106B (n=9 samples/group; 3 wells/experiment with each experiment repeated twice again). C, Relative transmigration of monocytes across a layer of EA.hy926 cells transiently co‐transfected with different combinations with siNC, siANRIL, siTMEM100, or siTMEM106B (n=9 samples/group; 3 wells/experiment with each experiment repeated twice again). D, Relative transmigration of monocytes across human coronary artery endothelial cells transiently co‐transfected with different combinations with siNC, siANRIL, siTMEM100, or siTMEM106B (n=9 samples/group; 3 wells/experiment with each experiment repeated twice again). Statistical analysis was performed using unpaired, 2‐tailed Student t‐tests. Si indicates small interfering.
Overexpression of TMEM106B Rescues ANRIL Overexpression Phenotype of Endothelial Cells Involved in Atherosclerosis
We also characterized the effect of TMEM106B overexpression on function of ANRIL overexpression in ECs. We previously reported that overexpression of ANRIL transcript DQ485454 significantly reduced monocyte adhesion to ECs and transendothelial migration of monocytes.5 EA.hy926 cells and HCAECs were co‐transfected with pcDNA3.1‐ANRIL and pcDNA3.1‐TMEM106B, and ANRIL and TMEM106B were successfully co‐expressed (Figure 5A through 5D). Overexpression of ANRIL significantly decreased monocyte adhesion to EA.hy926 cells and HCAECs and transendothelial migration of monocytes, however, the effects were fully reversed by overexpression of TMEM106B (Figure 5E through 5H). Overexpression of TMEM106B alone (eg without overexpression of ANRIL) did not show much effect on monocyte adhesion to EA.hy926 cells and HCAECs and transendothelial migration of monocytes (Figure 6A through 6H). These data suggest that overexpression of TMEM106B fully reverses the inhibitory function of ANRIL in monocyte adhesion to ECs and transendothelial migration of monocytes involved in atherosclerosis.
Figure 5.
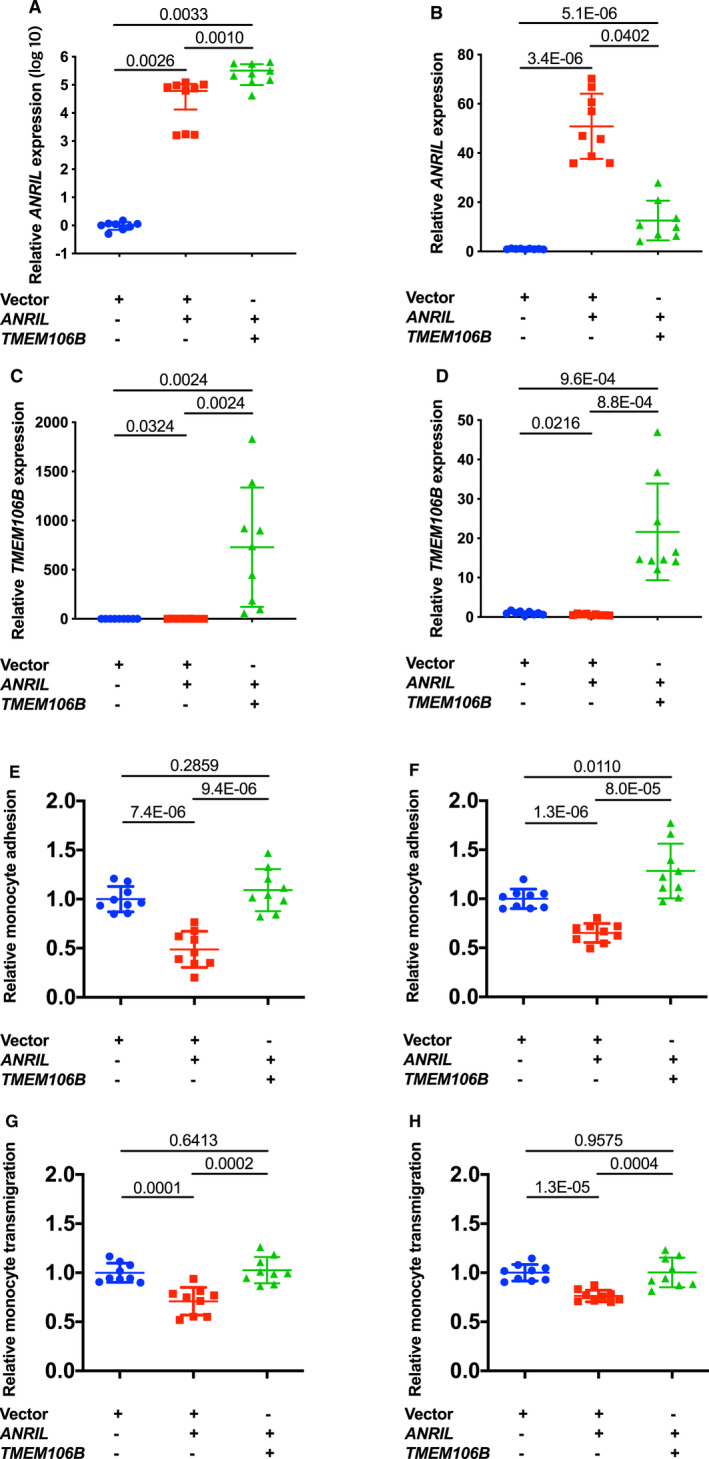
Overexpression of TMEM106B reverses the effects of ANRIL overexpression on monocyte adhesion to endothelial cells and transendothelial migration of monocytes.
A, Relative expression of ANRIL in a scale of log10 in EA.hy926 cells transiently co‐transfected with different combinations of pcDNA3.1, pcDNA3.1‐ANRIL, or pcDNA3.1‐TMEM106B (n=9 samples/group; 3 wells/experiment with each experiment repeated twice again). B, Relative expression of ANRIL in human coronary artery endothelial cells transiently co‐transfected with different combinations of pcDNA3.1, pcDNA3.1‐ANRIL, or pcDNA3.1‐TMEM106B (n=9 samples/group; 3 wells/experiment with each experiment repeated twice again). C, Relative expression of TMEM106B in EA.hy926 transiently co‐transfected with different combinations of pcDNA3.1, pcDNA3.1‐ANRIL, or pcDNA3.1‐TMEM106B (n=9 samples/group; 3 wells/experiment with each experiment repeated twice again). D, Relative expression of TMEM106B in human coronary artery endothelial cells transiently co‐transfected with different combinations of pcDNA3.1, pcDNA3.1‐ANRIL, or pcDNA3.1‐TMEM106B (n=9 samples/group; 3 wells/experiment with each experiment repeated twice again). E, Relative adhesion of monocytes to EA.hy926 cells transiently co‐transfected with different combinations of pcDNA3.1, pcDNA3.1‐ANRIL, or pcDNA3.1‐TMEM106B (n=9 samples/group; 3 wells/experiment with each experiment repeated twice again). F, Relative adhesion of monocytes to human coronary artery endothelial cells transiently co‐transfected with different combinations of pcDNA3.1, pcDNA3.1‐ANRIL, or pcDNA3.1‐TMEM106B (n=9 samples/group; 3 wells/experiment with each experiment repeated twice again). G, Relative transmigration of monocytes across a layer of EA.hy926 cells transiently co‐transfected with different combinations of pcDNA3.1, pcDNA3.1‐ANRIL, or pcDNA3.1‐TMEM106B was quantified (n=9 samples/group; 3 wells/experiment with each experiment repeated twice again). H, Relative transmigration of monocytes across human coronary artery endothelial cells transiently co‐transfected with different combinations of pcDNA3.1, pcDNA3.1‐ANRIL, or pcDNA3.1‐TMEM106B (n=9 samples/group; 3 wells/experiment with each experiment repeated twice again). Statistical analysis was performed using unpaired, 2‐tailed Student t‐tests.
Figure 6.
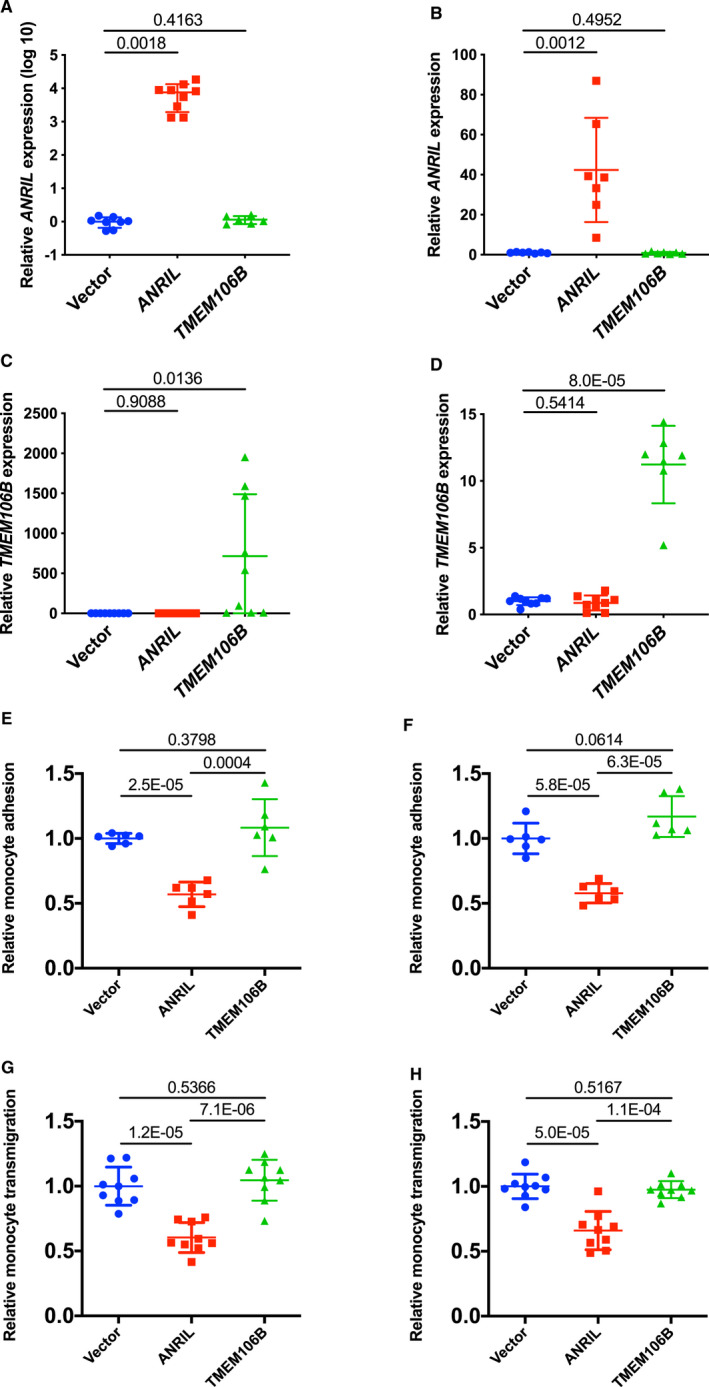
Overexpression of TMEM106B alone does not have any effects on monocyte adhesion to endothelial cells and transendothelial migration of monocytes.
A, Relative expression of ANRIL in a scale of log10 in EA.hy926 cells transiently transfected with pcDNA3.1, pcDNA3.1‐ANRIL, or pcDNA3.1‐TMEM106B (n=9 samples/group; 3 wells/experiment with each experiment repeated twice again). B, Relative expression of ANRIL in human coronary artery endothelial cells transiently transfected with pcDNA3.1, pcDNA3.1‐ANRIL, or pcDNA3.1‐TMEM106B (n=9 samples/group; 3 wells/experiment with each experiment repeated twice again). C, Relative expression of TMEM106B in EA.hy926 cells transiently transfected with pcDNA3.1, pcDNA3.1‐ANRIL, or pcDNA3.1‐TMEM106B (n=9 samples/group; 3 wells/experiment with each experiment repeated twice again). D, Relative expression of TMEM106B in human coronary artery endothelial cells transiently transfected with pcDNA3.1, pcDNA3.1‐ANRIL, or pcDNA3.1‐TMEM106B (n=9 samples/group; 3 wells/experiment with each experiment repeated twice again). E, Relative adhesion of monocytes to EA.hy926 cells transfected with pcDNA3.1, pcDNA3.1‐ANRIL, or pcDNA3.1‐TMEM106B (n=6 samples/group; 3 wells/experiment with each experiment repeated again). F, Relative adhesion of monocytes to HCAECs transfected with pcDNA3.1, pcDNA3.1‐ANRIL, or pcDNA3.1‐TMEM106B (n=6 samples/group; 3 wells/experiment with each experiment repeated again). G, Relative transmigration of monocytes across a layer of EA.hy926 cells transfected with pcDNA3.1, pcDNA3.1‐ANRIL, or pcDNA3.1‐TMEM106B (n=6 samples/group; 3 wells/experiment with each experiment repeated again). H, Relative transmigration of monocytes across HCAECs transfected with pcDNA3.1, pcDNA3.1‐ANRIL, or pcDNA3.1‐TMEM106B (n=9 samples/group; 3 wells/experiment with each experiment repeated twice again). Statistical analysis was performed using unpaired, 2‐tailed Student t‐tests.
TMEM106B, But Not TMEM100, is Upregulated in CAD Coronary Arteries
We found that TMEM106B is upregulated in CAD coronary arteries, which is consistent with its key role in the pathogenesis of CAD. We assessed the expression level of TMEM106B in coronary arteries from CAD patients with coronary artery stenosis of 40% to 100% as compared with those from the age‐, sex‐, and race‐matched non‐CAD control subjects (Table). As previously reported,5 the expression level of ANRIL (DQ485454) was significantly lower in CAD patients by >100‐fold compared with that of the age‐matched healthy controls (P=0.026) (Figure 7A). Interestingly, TMEM106B expression was significantly increased by more than 2‐fold in CAD coronary arteries compared with control coronary arteries (P=0.0006) (Figure 7B). However, there was no significant difference for the expression level of TMEM100 between CAD coronary arteries and control coronary arteries (Figure 7C). Together, the data are consistent with earlier functional data showing that overexpression of ANRIL showed a protective effect on atherosclerosis, ie, reduced monocyte adhesion to ECs and transendothelial migration of monocytes, however, the effect was fully antagonized by overexpression of TMEM106B, but not TMEM100.
Figure 7.
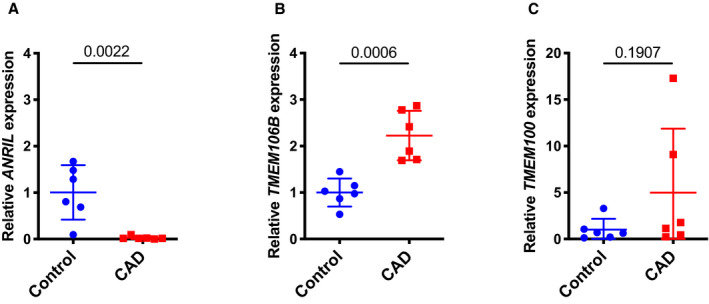
TMEM106B, but not TMEM100, is significantly upregulated in coronary arteries from coronary artery disease (CAD) patients and correlated with downregulation of ANRIL.
A, Relative expression levels of ANRIL as determined by quantitative reverse transcription‐polymerase chain reaction from coronary artery tissues from CAD patients and the age‐matched non‐CAD individuals (n=6 tissues or study subjects/group). B, Relative expression levels of TMEM106B as determined by quantitative reverse transcription‐polymerase chain reaction from coronary artery tissues from CAD patients and the age‐matched non‐CAD individuals (n=6 tissues or study subjects/group). C, Relative expression levels of TMEM100 as determined by qRT‐PCR from coronary artery tissues from CAD patients and the age‐matched non‐CAD individuals (n=6 tissues or study subjects/group). Statistical analysis was performed using unpaired, 2‐tailed Student t tests.
TMEM100B Does Not Affect the Expression Level of CDKN2A, CDKN2B, or MTAP Genes at the 9p21.3 CAD Locus
We recently reported that knockdown of ANRIL (DQ485454) significantly decreased the expression level of CDKN2A and CDKN2B but not MTAP at the 9p21.3 CAD locus, whereas overexpression of ANRIL significantly increased the expression level of CDKN2B but not CDKN2A and MTAP in HCAECs.5 We performed a similar study for TMEM106B (Figure 8). Overexpression of TMEM106B did not significantly affect the expression level of CDKN2A, CDKN2B, or MTAP in HCAECs (Figure 8A). Knockdown of TMEM106B by siRNA did not significantly affect the expression level of CDKN2A, CDKN2B, or MTAP in HCAECs (Figure 8B). Therefore, although ANRIL regulates the expression of CDKN2A or CDKN2B, neither overexpression nor knockdown of TMEM106B had any significant effect on the expression level of CDKN2A, CDKN2B, or MTAP in HCAECs.
Figure 8.
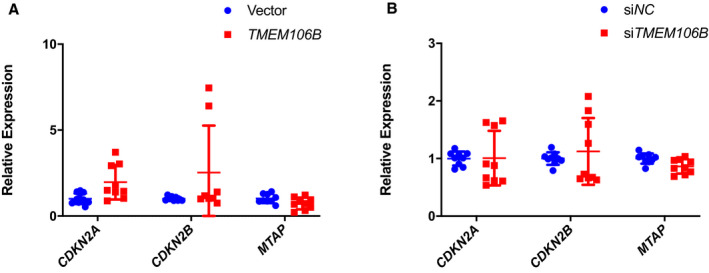
Neither overexpression nor knockdown of TMEM106B affects the expression of the CDKN2A, CDKN2B, and MTAP genes at the 9p21.3 CAD locus.
A, Relative expression level of CDKN2A, CDKN2B, and MTAP as determined by quantitative reverse transcription‐polymerase chain reaction analysis from human coronary artery endothelial cells transiently transfected with either pcDNA3.1 vector or pcDNA‐TMEM106B (n=9 samples/group; 3 wells/experiment with each experiment repeated twice again). B, Relative expression level of CDKN2A, CDKN2B, and MTAP in human coronary artery endothelial cells transiently transfected with either small interfering NC or small interfering TMEM106B as determined by quantitative reverse transcription‐polymerase chain reaction (n=9 samples/group; 3 wells/experiment with each experiment repeated twice again). Statistical analysis was performed using unpaired, 2‐tailed Student t‐tests. Si indicates small interfering.
Genomic Variants in TMEM106B are Significantly Associated With Risk of CAD
Because TMEM106B regulates the function of ANRIL on EC functions involved in atherosclerosis, we hypothesized that genomic variants in TMEM106B are associated with risk of CAD. We used 2 large existing GWAS data sets (CADRDIoGRAMplusC4D and GeneATLAS [phenotype code: I20‐I25]) to determine the association between genomic variants in a 100 kb genomic region flanking TMEM106B and CAD. A total of 887 variants in the TMEM106B region were selected for a meta‐analysis of 636 539 samples. One variant, rs11509880 located in intron 4 of TMEM106B, was found to be robustly associated with CAD (P=1.9×10⁻⁸, odds ratio=1.03, 95% CI=1.02–1.05) (Figure 9A). No significant association with CAD was detected for genomic variants in and around CLIP1, EZR, and LYVE1, 3 genes previously shown to be involved in regulation of ANRIL functions (data not shown). These data suggest that genomic variants in TMEM106B, but not in other ANRIL downstream genes TMEM100, CLIP1, EZR, and LYVE1, are significantly associated with risk of CAD.
Figure 9.
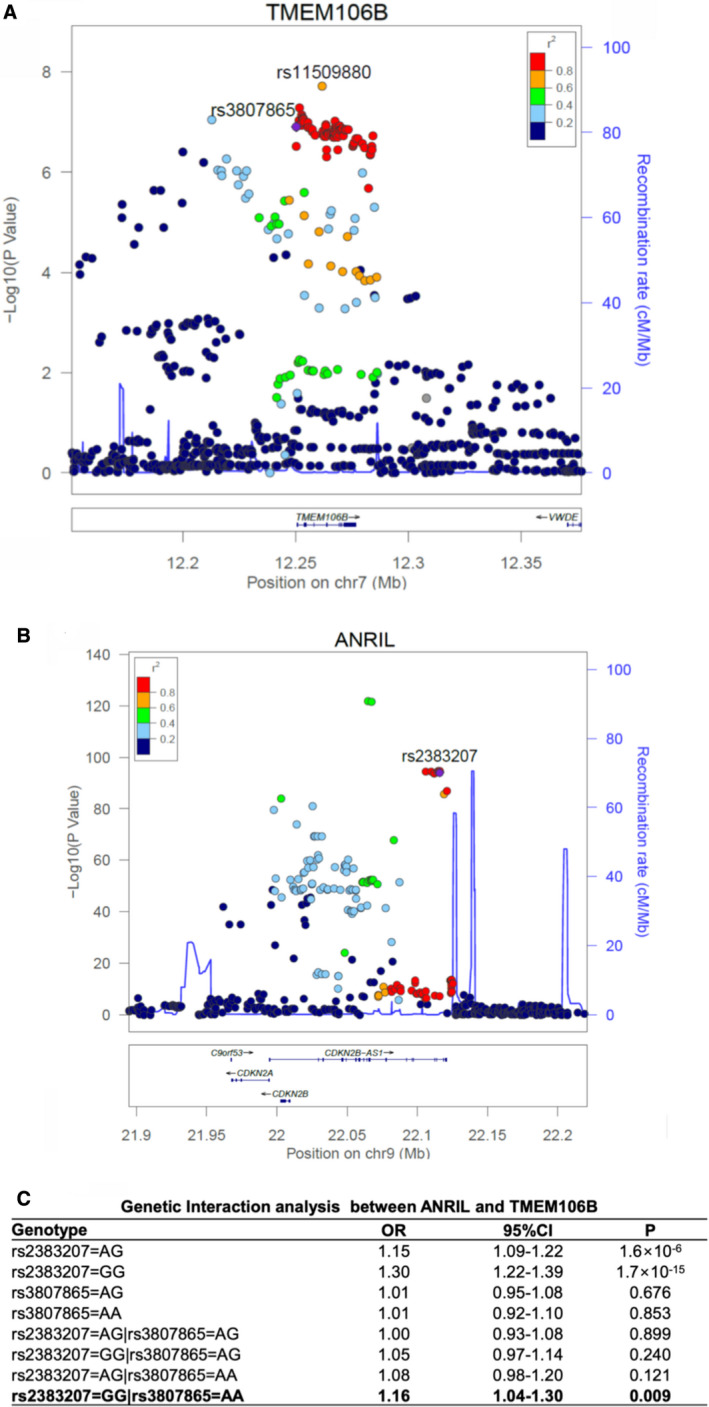
Genetic evidence for epistasis involving the ANRIL and TMEM106B GWAS (genome‐wide association studies) loci for coronary artery disease (CAD).
A, Regional association plot of TMEM106B from a meta‐analysis of 2 large CAD GWAS data sets. The recombination rate as plotted in centi‐morgan (cM)/Mb (a million base pair) and genetic association as plotted in the scale of ‐log10 are shown. Color of the individual dot indicates the linkage disequilibrium between the lead single nucleotide polymorphism (purple dot) and other single nucleotide polymorphisms. The displayed linkage disequilibrium data and recombination rates are based on the European population in the 1000 Genome database. B, Regional association plot of ANRIL from a meta‐analysis of 2 large CAD GWAS data sets. C, Significant genetic interaction between ANRIL variant rs2383207 and TMEM106B variant rs3807865 in 343 145 unrelated samples in UK Biobank. Genetic interactions between 2 genes were assessed using a logistic regression model, in which 2 main effects of each gene and 4 interactions between genes were modeled. The non‐risk homozygote was set as the reference for each gene. Statistical analysis was performed as described in Methods section. OR indicates odds ratio; P, P value from the logistic regression model with adjustment of covariates.
Significant Gene‐Gene Interaction Between the ANRIL Locus and the TMEM106B Locus
Because ANRIL negatively regulates the expression of TMEM106B, and TMEM106B antagonizes the function of ANRIL in ECs, we hypothesized that genetically, the ANRIL locus may interact with the TMEM106B locus in exerting an epistasis effect on CAD. To test this hypothesis, we selected genetic variant rs2383207 in the ANRIL locus for the analysis, which is a tag single nucleotide polymorphism for the ≈60 kb CAD haplotype at 9p21 (Figure 9B). For the TMEM106B locus, we selected variant rs3807865 (Figure 9A), which shows a significant and strong eQTL (Expression Quantitative Trait Locus) for TMEM106B and is located in a strong H3K27Ac and DNase cluster site. Analysis of the genotyping data for I20‐I25 Ischemic heart diseases in UK Biobank using a logistic regression model detected a significant epistatic interaction between the 2 variants when both are in the homozygous state (odds ratio=1.16, P=0.0087) (Figure 9C). These results suggest that the ANRIL locus and the TMEM106B locus genetically interact with each other, which is consistent with the finding of functional interaction between the 2 genes.
Validation of the Forward Genetic Approach in Identification of the Second Pair of Gene‐Gene Interaction Between ADTRP and MIA3 Loci for CAD
All data above suggest that we have developed a novel forward genetic approach that is effective in identifying epistasis involved in common human diseases. It consists of multiple steps that combine statistical and functional approaches to functionally characterize GWAS variants. As proof of principle, we combined information from global gene expression profiling, functional interactions, and genetic interactions to robustly identify the gene‐gene interaction between the ANRIL locus and the TMEM106B locus involved in CAD. To generalize the multi‐stage forward genetic approach, we characterize 2 other GWAS loci for CAD, the ADTRP locus12, 13 on chromosome 6p24.1 and the MIA3 locus14, 15 on 1q41, both of which were identified also by GWAS for CAD. We previously reported the functional interaction between ADTRP and MIA3 (also referred to as TANGO1).26 ADTRP is involved in endothelial cell proliferation, migration, cell cycle and apoptosis regulation, primitive myelopoiesis, definitive hematopoiesis, and vascular development.25, 31, 32 MIA3 is involved in the transport of large cargos such as collagen into membrane‐bound carriers and export from the endoplasmic reticulum.33 Our global gene expression microarray analysis with knockdown of ADTRP expression identified MIA3 as one of the downstream genes. Mechanistic studies revealed that ADTRP positively regulates expression of MIA3 by upregulating PIK3R3 and activating AKT.26 Knockdown of ADTRP expression significantly increased oxidized low‐density lipoprotein‐mediated monocyte adhesion to endothelial cells and transendothelial migration of monocytes, however, the effects were reversed by overexpression of MIA3 overexpression.26 Moreover, we found that MIA3 negatively regulates the expression level of ADTRP in both HepG2 cells (Figure 10A through 10D) and EA.hy926 endothelial cells (Figure 10E and 10F). Therefore, functional regulatory interaction between ADTRP and MIA3 was identified. Because the large data set at UK Biobank recently becomes available, we tested the genetic interaction between the 2 genes using 2 genomic variants showing the most significant association with CAD, rs6903956 in ADTRP 12 and rs17465637 in MIA3 15 (Figure 11A and 11B). Interestingly, we observed a significant epistatic interaction between rs6903956 in ADTRP and rs17465637 in MIA3 (odds ratio=0.80, P=0.005) (Figure 11C).
Figure 10.
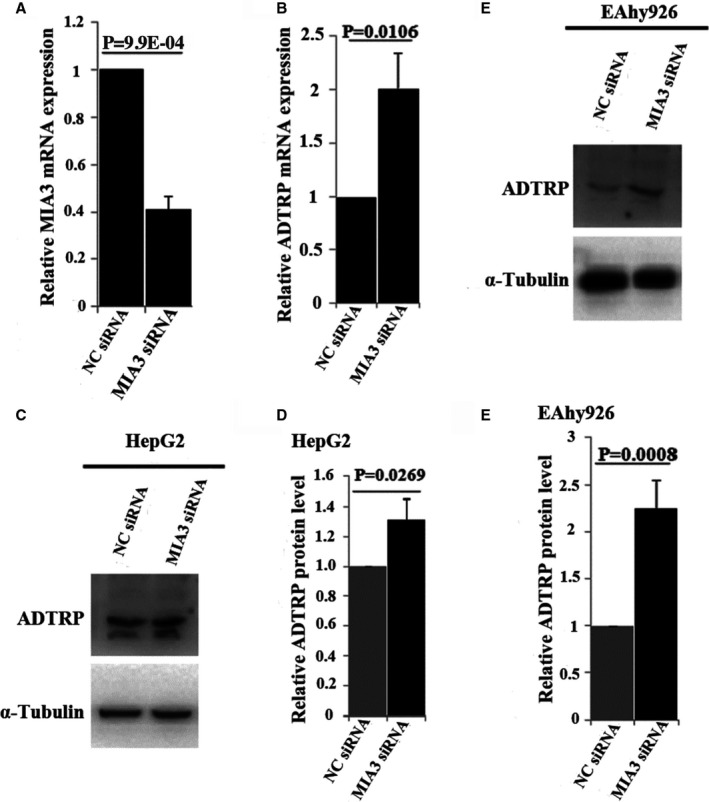
MIA3 negatively regulates the expression level of ADTRP.
A, Real‐time RT‐PCR analysis showing that MIA3 small interfering (si)RNA significantly reduces its expression. B, Real‐time RT‐PCR analysis showing that MIA3 siRNA significantly increases the expression of ADTRP mRNA. C, Western blot analysis showing that MIA3 siRNA significantly increases the expression of the ADTRP protein in HepG2 cells. D, Quantification of Western blot images in (C) and statistical analysis showing that MIA3 siRNA significantly increases the expression of the ADTRP protein in HepG2 cells. E, Western blot analysis showing that MIA3 siRNA significantly increases the expression of the ADTRP protein in EA.hy926 ECs. F, Quantification of Western blot images in E and statistical analysis showing that MIA3 siRNA significantly increases the expression of the ADTRP protein in EA.hy926 ECs. α‐Tubulin was used as loading control for Western blot analysis. n=3 samples/group from 3 independent experiments. Statistical analysis was performed using unpaired, 2‐tailed Student t tests. Si indicates small interfering.
Figure 11.
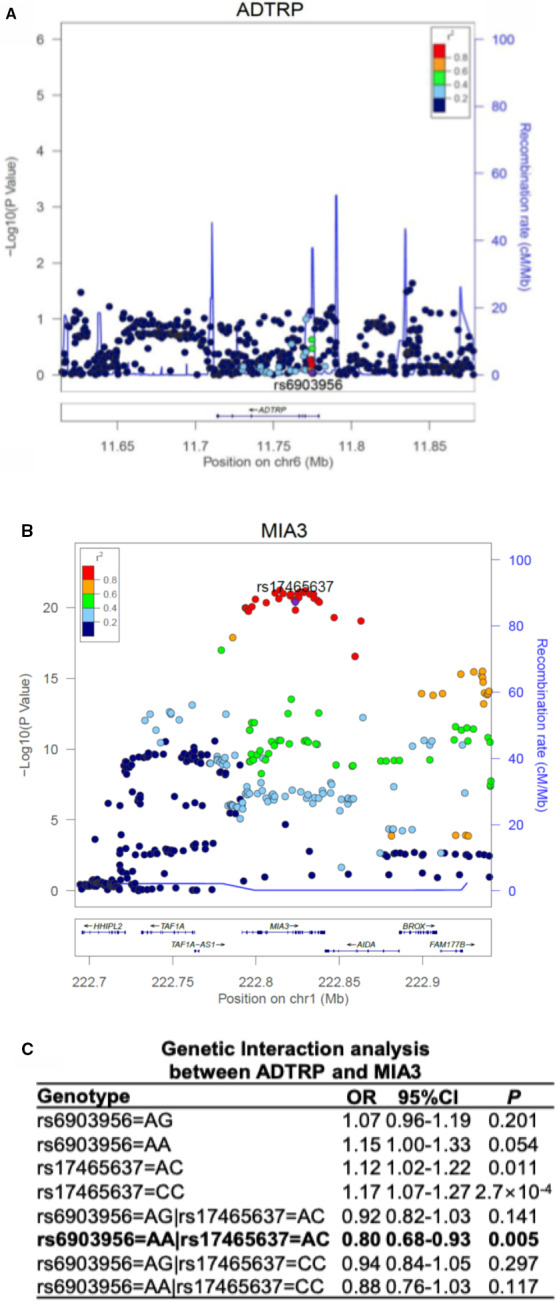
Genetic evidence for epistasis involving the ADTRP and MIA3 GWAS (genome‐wide association studies) loci for coronary artery disease (CAD).
A, Regional association plot of ADTRP from a meta‐analysis of 2 large CAD GWAS data sets. B, Regional association plot of MIA3 from a meta‐analysis of 2 large CAD GWAS data sets. The recombination rate as plotted in cM/Mb and genetic association as plotted in the scale of −log10 are shown. Color of the individual dot indicates the linkage disequilibrium between the lead single nucleotide polymorphism (purple dot) and other single nucleotide polymorphisms. The displayed linkage disequilibrium data and recombination rates are based on the European population in the 1000 Genome database. C, Significant genetic interaction between ADTRP variant rs6903956 and MIA3 variant rs17465637 in 343 145 unrelated samples in UK Biobank. Genetic interactions between 2 genes were assessed using a logistic regression model, in which 2 main effects of each gene and 4 interactions between genes were modeled. The non‐risk homozygote was set as the reference for each gene. Statistical analysis was performed as described in Methods section. OR indicates odds ratio; P, P value from the logistic regression model with adjustment of covariates.
Discussion
One interesting finding from this study is that molecular characterization of one susceptibility gene for CAD from GWAS (ie, ANRIL) leads to the genetic identification of another CAD susceptibility gene (ie, TMEM106B). Most GWAS for common human diseases are almost exhausted in identifying additional new susceptibility genes with ever increasing sample sizes of close to a million study subjects. It will be difficult to further increase the sample size to find new susceptibility variant or loci. The combination of functional characterization of existing susceptibility genes for downstream genes and follow‐up genetic association analysis, as demonstrated in this study, may be a viable strategy to identify some new susceptibility genes in the future.
Among the 2 genes upregulated by knockdown of ANRIL expression (TMEM100 and TMEM106B), it was surprising that knockdown of TMEM100 did not impact the effects of ANRIL knockdown on monocyte adhesion to EA.hy926 cells and HCAECs or transendothelial migration of monocytes (Figure 4). Consistent with the finding, we did not find significant genetic association between TMEM100 variants and CAD (Figure 9) or deregulation in CAD contrary arteries as compared with control arteries (Figure 8). TMEM100 was found to be an upregulated gene by BMP9 (Bone Morphogenic Protein 9) and BMP10 (Bone Morphogenic Protein 10) through their ALK1 receptor, all of which regulate embryonic vascular development.6 Global knockout or EC‐specific knockout mice for TMEM100 showed abnormal differentiation of arterial endothelium and defects of vascular morphogenesis during embryogenesis6 and defective maintenance of vascular integrity and various vascular abnormalities during the adult stage.8 Despite these interesting roles of TMEM100 in endothelial differentiation and vascular development, it showed only a modest effect on monocyte adhesion to ECs, and no effect on transendothelial migration of monocytes or ANRIL functions in endothelial cells (Figure 4).
In contrast to TMEM100, we found that TMEM106B was required for the functional effects of ANRIL knockdown because the increased monocyte adhesion to EA.hy926 cells and HCAECs or transendothelial migration of monocytes induced by ANRIL knockdown disappeared when TMEM106B expression was also knocked down (Figure 4). We also showed that the expression level of TMEM106B was significantly higher by 2‐fold in coronary arteries from CAD patients than from age‐matched controls (Figure 7B). TMEM106B was shown to play a role of regulating lysosomal morphology, size, trafficking, and function.9, 10, 11, 34 Knockout of TMEM106B in mice caused reduction of several lysosomal enzymes.34 Overexpression of TMEM106B was shown to induce enlargement of lysosomes and a reduction in lysosome numbers, and caused a defect in the later stages of late endosome/lysosome fusion or lysosomal degradation.11 Enlarged lysosomes may trap more cholesterol inside lysosomes, and lysosomal cholesterol accumulation was hypothesized to be involved in the development of inflammation during atherosclerosis.35 In macrophages, lipids were mostly deposited in lysosomal organelles, and free cholesterol efflux from lysosomes was inhibited by CD38 knockout, which leads to lysosomal cholesterol accumulation in macrophages and development of atherosclerosis in mice.36 Moreover, macrophages isolated from atherosclerotic plaques showed dysfunction of lysosomes, and increased lysosome biogenesis in macrophages had an antiatherogenic effect.37, 38 It should be interesting to investigate whether the ANRIL‐TMEM106B regulatory network plays a role in free cholesterol efflux from lysosomes in macrophages in the future. Similarly, it should be interesting to characterize whether lysosome dysfunction plays a role in endothelial function such as monocyte adhesion to ECs and transendothelial migration of monocytes and to define the underlying molecular mechanism. Enlarged lysosomes may trap more cholesterol and lipids and cause inflammation, which may promote monocyte adhesion to ECs and transendothelial migration of monocytes.
The molecular mechanism by which ANRIL regulates the expression of TMEM106B and other downstream target genes in endothelial cells is not clear. ANRIL was reported to interact with the components of PRC1/2 such as EZH2, SUZ12, and CBX7 to facilitate the recruitment of the chromatin‐modifying complex to promoter/regulatory regions, which can then regulate expression of adjacent genes.39, 40, 41, 42 ANRIL was also found to act as a sponge for some microRNAs in regulating expression of downstream genes in nasopharyngeal carcinoma (let‐7a),43 lipopolysaccharide‐induced inflammatory injury of HK‐2 cells (miR‐9),44 hypoxia‐induced injury in H9C2 cells (miR‐7‐5p/SIRT1),45 oxygen and glucose deprivation‐induced injury in PC‐12 cells (miR‐127/Mcl‐1),46 lipopolysaccharides‐ and pyrrolidine dithiocarbamate‐treated endothelial cells (miR‐181b/NF‐κB),47 cell senescence of vascular smooth muscle cells (miR‐181a/Sirt1),48 and wound healing in diabetes mellitus (miR‐181a/Prox1).49 One or more of these molecular regulatory mechanisms may be used by ANRIL to regulate the expression of TMEM106B and other downstream target genes in endothelial cells, although we cannot exclude the possibility of other novel mechanisms. Future studies will focus on identification of molecular mechanisms by which ANRIL regulates TMEM106B and other genes involved in the pathogenesis of CAD.
Although GWAS have identified >150 genomic loci associated with CAD and MI,3 identification of the causal gene(s) under each locus and functional characterization of causal genes are challenging. The data from this study further confirm the notion from us and others that ANRIL is the causal gene for CAD at the 9p21.3 locus.4, 5 Moreover, our data suggest that TMEM106B is the causal gene at the 7q21.11 CAD locus (Figure 9A).
Epistasis has been poorly characterized in human diseases because even the largest databases for CAD such as UK Biobank and CADRDIoGRAMplusC4D may not have a sufficient power for a successful genome‐wide gene‐gene interaction study to satisfy the genome‐wide significance. This is because of 2 major limitations. First, the number of tests for genome‐wide gene‐gene interaction studies will be exponential as compared with GWAS and poses an enormous challenge for correction for multiple testing. Second, the frequencies of rare genotypes may be too low to do reliable testing for gene‐gene interactions, particularly for genomic variants with moderate or low minor allele frequencies. Out study provides a potential strategy for detecting epistasis for human diseases despite the fact that it has low throughput and is labor intensive. The strategy consists of several key steps: (1) selection of a GWAS variant or locus, (2) identification of a candidate causal gene based on bioinformatic analysis and existing genetic and biological data and functional validation, (3) identification of downstream genes for the candidate causal gene by expression microarrays or RNAseq, (4) functional rescue studies between the candidate causal gene and each downstream gene to identify the gene pairs showing functional interaction, and (5) genetic association between the gene pairs showing functional interaction. Identification of epistasis provides significant insights into the genetic architecture of common human diseases, and could have a far‐reaching impact on recent advances on exploration of polygenic risk scores, which are emerging as potentially powerful biomarkers to predict the risk to develop different human diseases.
Detailed analysis suggests that the type of gene‐gene interaction between ANRIL and TMEM106B belongs to “negative epistasis”,50 whereas the epistatic interaction between ADTRP and MIA3 belongs to “sign epistasis”.51 The 2 different types of epistasis may result from distinctly different gene regulatory patterns underlying each pair of GWAS genes. In the first case of ANRIL‐TMEM106B interaction, ANRIL negatively regulates the expression of TMEM106B, whereas TMEM106B did not have any effect on the expression of ANRIL (Figure 1A through 1F). Since the effect of TMEM106B on CAD is masked by or depends on ANRIL, the 2 genes together result in a reduced disease risk because of negative epistasis. In the case of ADTRP‐MIA3 interaction, ADTRP positively regulates the expression of MIA3, 26 however, we showed here that MIA3 negatively regulated the expression of ADTRP (Figure 10). Our previous studies showed that the risk allele of ADTRP was correlated with the decreased ADTRP expression level,12 which could lead to downregulation of MIA3 and abnormal EC functions associated with CAD.26 However, the effect of the ADTRP risk allele (or downregulation of ADTRP) on CAD may be weakened or reversed by downregulation of MIA3, which could upregulate the expression of ADTRP. Thus, the observed sign epistasis between ADTRP and MIA3 may arise from the bidirectional negative feedback gene regulation. Identification of different types of epistasis, for example, negative epistasis and sign epistasis as shown here, among different GWAS genes is critical to a better understanding of polygenic contribution in CAD and other complex diseases. More importantly, as studies on polygenic risk scores for disease risk stratification and prognosis become popular these days, a careful consideration of epistasis is needed because different types of epistasis can have an important effect of either increasing or decreasing polygenic risk scores.
This study has a limitation. Our gene‐gene interaction analysis did not include other clinical covariates such as body weight or body mass index, blood pressure, lipids, hypertension, diabetes mellitus, and other risk factors because inclusion of additional clinical covariates will exclude too many subjects without such data, which will significantly reduce the discovering power of gene‐gene interaction analysis. It is also likely that adjusting for covariates may reduce the significance of the current results.
In summary, the data in this study demonstrate the effectiveness of an interesting strategy to detect epistasis involved in phenotypic determination of human diseases. Our data further support the hypothesis that ANRIL is the causal gene for CAD at the 9p21.3 locus, and TMEM106B is the causal gene at the 7q21.11 CAD locus. Mechanistically, TMEM106B regulates endothelial functions and atherosclerosis in connection with long non‐coding RNA ANRIL. Knockdown of TMEM106B fully rescued ANRIL knockdown phenotypes in endothelial cells involved in atherosclerosis, whereas overexpression of TMEM106B fully rescued ANRIL overexpression phenotypes. Moreover, TMEM106B is upregulated in CAD coronary arteries. Our study also identified 2 pairs of novel gene‐gene interactions (epistasis) involved in CAD, a pair involving the ANRIL locus and the TMEM106B locus and the other pair involving the ADTRP locus and the MIA3 locus. Identification of epistasis is paramount to our understanding of the genetic architecture of a human disease, and may have an important implication on future precision diagnosis and risk stratification of common human diseases based on polygenic risk scores and other methods.
Sources of Funding
This work was supported by National Institutes of Health/National Heart, Lung, and Blood Institute grants R01 HL121358 (Q. K. Wang), R01 HL126729 (Q. K. Wang), and R01 HL138465 (Q. K. Wang and Chen) and in part by China Natural Science Foundation grant 31430047 (Xu). This research has been conducted using the UK Biobank Resource under project 8447. Tenesa, and Rawlik acknowledge funding from the Medical Research Council grant MR/P015514/1, UK Research and Innovation Biotechnology and Biological Sciences Research Council grant BBS/E/D/30002276 and the Medical Research Council grant MR/N003179/1, and Canela‐Xandri from the Medical Research Council fellowship MR/R025851/1.
Disclosures
None.
Acknowledgments
We greatly appreciate earlier initiating work on TMEM106B by Dr. Fan. Thanks to Ms. Annabel Z. Wang. Wang at Harvard Medical School and other members of Wang laboratory for helpful discussion and assistance.
Author contributions: Study design: Q. K. Wang, Xu, Cho, Li, and Chen; Experiments on ANRIL, TMEM100 and TMEM106B: Cho, and Li; Experiments on MIA3 and ADTRP (Figure 10): Luo; Association analysis of TMEM100 and TMEM106B variants: F. Wang; Gene‐gene interaction analysis: Canela‐Xandri, Rawlik, and Tenesa; Data analysis: all authors; Drafting manuscript: Cho, Li, F. Wang, Chen, and Q. K. Wang; Revision of manuscript: all authors; Study supervision: Q. K. Wang, Xu, and Chen.
(J Am Heart Assoc. 2020;9:e014146. DOI: 10.1161/JAHA.119.014146.)
For Sources of Funding and Disclosures, see page 20.
Contributor Information
Qiuyun Chen, Email: wangq2@ccf.org.
Qing Kenneth Wang, Email: chenq3@ccf.org.
References
- 1. Wang Q. Molecular genetics of coronary artery disease. Curr Opin Cardiol. 2005;20:182–188. [DOI] [PMC free article] [PubMed] [Google Scholar]
- 2. Wang Q. Advances in the genetic basis of coronary artery disease. Curr Atheroscler Rep. 2005;7:235–241. [DOI] [PMC free article] [PubMed] [Google Scholar]
- 3. Musunuru K, Kathiresan S. Genetics of common, complex coronary artery disease. Cell. 2019;177:132–145. [DOI] [PubMed] [Google Scholar]
- 4. Lo Sardo V, Chubukov P, Ferguson W, Kumar A, Teng EL, Duran M, Zhang L, Cost G, Engler AJ, Urnov F, et al. Unveiling the role of the most impactful cardiovascular risk locus through haplotype editing. Cell. 2018;175:1796–1810.e20. [DOI] [PMC free article] [PubMed] [Google Scholar]
- 5. Cho H, Shen GQ, Wang X, Wang F, Archacki S, Li Y, Yu G, Chakrabarti S, Chen Q, Wang QK. Long noncoding RNA ANRIL regulates endothelial cell activities associated with coronary artery disease by up‐regulating CLIP1, EZR, and LYVE1 genes. J Biol Chem. 2019;294:3881–3898. [DOI] [PMC free article] [PubMed] [Google Scholar]
- 6. Somekawa S, Imagawa K, Hayashi H, Sakabe M, Ioka T, Sato GE, Inada K, Iwamoto T, Mori T, Uemura S, et al. Tmem100, an ALK1 receptor signaling‐dependent gene essential for arterial endothelium differentiation and vascular morphogenesis. Proc Natl Acad Sci USA. 2012;109:12064–12069. [DOI] [PMC free article] [PubMed] [Google Scholar]
- 7. Mizuta K, Sakabe M, Hashimoto A, Ioka T, Sakai C, Okumura K, Hattammaru M, Fujita M, Araki M, Somekawa S, et al. Impairment of endothelial‐mesenchymal transformation during atrioventricular cushion formation in Tmem100 null embryos. Dev Dyn. 2015;244:31–42. [DOI] [PubMed] [Google Scholar]
- 8. Moon EH, Kim YS, Seo J, Lee S, Lee YJ, Oh SP. Essential role for TMEM100 in vascular integrity but limited contributions to the pathogenesis of hereditary haemorrhagic telangiectasia. Cardiovasc Res. 2015;105:353–360. [DOI] [PMC free article] [PubMed] [Google Scholar]
- 9. Kundu ST, Grzeskowiak CL, Fradette JJ, Gibson LA, Rodriguez LB, Creighton CJ, Scott KL, Gibbons DL. TMEM106B drives lung cancer metastasis by inducing TFEB‐dependent lysosome synthesis and secretion of cathepsins. Nat Commun. 2018;9:2731. [DOI] [PMC free article] [PubMed] [Google Scholar]
- 10. Stagi M, Klein ZA, Gould TJ, Bewersdorf J, Strittmatter SM. Lysosome size, motility and stress response regulated by fronto‐temporal dementia modifier TMEM106B. Mol Cell Neurosci. 2014;61:226–240. [DOI] [PMC free article] [PubMed] [Google Scholar]
- 11. Brady OA, Zheng Y, Murphy K, Huang M, Hu F. The frontotemporal lobar degeneration risk factor, TMEM106B, regulates lysosomal morphology and function. Hum Mol Genet. 2013;22:685–695. [DOI] [PMC free article] [PubMed] [Google Scholar]
- 12. Wang F, Xu CQ, He Q, Cai JP, Li XC, Wang D, Xiong X, Liao YH, Zeng QT, Yang YZ, et al. Genome‐wide association identifies a susceptibility locus for coronary artery disease in the Chinese Han population. Nat Genet. 2011;43:345–349. [DOI] [PubMed] [Google Scholar]
- 13. Tayebi N, Ke T, Foo JN, Friedlander Y, Liu J, Heng CK. Association of single nucleotide polymorphism rs6903956 on chromosome 6p24.1 with coronary artery disease and lipid levels in different ethnic groups of the Singaporean population. Clin Biochem. 2013;46:755–759. [DOI] [PubMed] [Google Scholar]
- 14. Li X, Huang Y, Yin D, Wang D, Xu C, Wang F, Yang Q, Wang X, Li S, Chen S, et al. Meta‐analysis identifies robust association between SNP rs17465637 in MIA3 on chromosome 1q41 and coronary artery disease. Atherosclerosis. 2013;231:136–140. [DOI] [PubMed] [Google Scholar]
- 15. Wang AZ, Li L, Zhang B, Shen GQ, Wang QK. Association of SNP rs17465637 on chromosome 1q41 and rs599839 on 1p13.3 with myocardial infarction in an American caucasian population. Ann Hum Genet. 2011;38:149–156. [DOI] [PMC free article] [PubMed] [Google Scholar]
- 16. Lu Q, Yao Y, Hu Z, Hu C, Song Q, Ye J, Xu C, Wang AZ, Chen Q, Wang QK. Angiogenic factor AGGF1 activates autophagy with an essential role in therapeutic angiogenesis for heart disease. PLoS Biol. 2016;14:e1002529. [DOI] [PMC free article] [PubMed] [Google Scholar]
- 17. Yao Y, Lu Q, Hu Z, Yu Y, Chen Q, Wang QK. A non‐canonical pathway regulates ER stress signaling and blocks ER stress‐induced apoptosis and heart failure. Nat Commun. 2017;8:133. [DOI] [PMC free article] [PubMed] [Google Scholar]
- 18. Archacki SR, Angheloiu G, Tian XL, Tan FL, DiPaola N, Shen GQ, Moravec C, Ellis S, Topol EJ, Wang Q. Identification of new genes differentially expressed in coronary artery disease by expression profiling. Physiol Genomics. 2003;15:65–74. [DOI] [PubMed] [Google Scholar]
- 19. Archacki SR, Angheloiu G, Moravec CS, Liu H, Topol EJ, Wang QK. Comparative gene expression analysis between coronary arteries and internal mammary arteries identifies a role for the TES gene in endothelial cell functions relevant to coronary artery disease. Hum Mol Genet. 2012;21:1364–1373. [DOI] [PubMed] [Google Scholar]
- 20. Tu X, Nie S, Liao Y, Zhang H, Fan Q, Xu C, Bai Y, Wang F, Ren X, Tang T, et al. The IL‐33‐ST2L pathway is associated with coronary artery disease in a Chinese Han population. Am J Hum Genet. 2013;93:652–660. [DOI] [PMC free article] [PubMed] [Google Scholar]
- 21. You SA, Archacki SR, Angheloiu G, Moravec CS, Rao S, Kinter M, Topol EJ, Wang Q. Proteomic approach to coronary atherosclerosis shows ferritin light chain as a significant marker: evidence consistent with iron hypothesis in atherosclerosis. Physiol Genomics. 2003;13:25–30. [DOI] [PubMed] [Google Scholar]
- 22. Bai Y, Nie S, Jiang G, Zhou Y, Zhou M, Zhao Y, Li S, Wang F, Lv Q, Huang Y, et al. Regulation of CARD8 expression by ANRIL and association of CARD8 single nucleotide polymorphism rs2043211 (p.C10X) with ischemic stroke. Stroke. 2014;45:383–388. [DOI] [PMC free article] [PubMed] [Google Scholar]
- 23. Chen S, Wang X, Wang J, Zhao Y, Wang D, Tan C, Fa J, Zhang R, Wang F, Xu C, et al. Genomic variant in CAV1 increases susceptibility to coronary artery disease and myocardial infarction. Atherosclerosis. 2016;246:148–156. [DOI] [PMC free article] [PubMed] [Google Scholar]
- 24. Luo C, Pook E, Tang B, Zhang W, Li S, Leineweber K, Cheung SH, Chen Q, Bechem M, Hu JS, et al. Androgen inhibits key atherosclerotic processes by directly activating ADTRP transcription. Biochim Biophys Acta Mol Basis Dis. 2017;1863:2319–2332. [DOI] [PMC free article] [PubMed] [Google Scholar]
- 25. Luo C, Wang F, Qin S, Chen Q, Wang Q. Coronary artery disease susceptibility gene ADTRP regulates cell cycle progression, proliferation and apoptosis by global gene expression regulation. Physiol Genomics. 2016;48:554–564. [DOI] [PMC free article] [PubMed] [Google Scholar]
- 26. Luo CY, Wang F, Ren X, Ke T, Xu CQ, Tang B, Qin SB, Yao YF, Chen QY, Wang QK. Identification of a molecular signaling gene‐gene regulatory network between GWAS susceptibility genes ADTRP and MIA3/TANGO1 for coronary artery disease. Biochim Biophys Acta Mol Basis Dis. 2017;1863:1640–1653. [DOI] [PMC free article] [PubMed] [Google Scholar]
- 27. Wang J, Fa J, Wang P, Jia X, Peng H, Chen J, Wang Y, Wang C, Chen Q, Tu X, et al. NINJ2‐ a novel regulator of endothelial inflammation and activation. Cell Signal. 2017;35:231–241. [DOI] [PubMed] [Google Scholar]
- 28. Nikpay M, Goel A, Won HH, Hall LM, Willenborg C, Kanoni S, Saleheen D, Kyriakou T, Nelson CP, Hopewell JC, et al. A comprehensive 1,000 Genomes‐based genome‐wide association meta‐analysis of coronary artery disease. Nat Genet. 2015;47:1121–1130. [DOI] [PMC free article] [PubMed] [Google Scholar]
- 29. Canela‐Xandri O, Rawlik K, Tenesa A. An atlas of genetic associations in UK Biobank. Nat Genet. 2018;50:1593–1599. [DOI] [PMC free article] [PubMed] [Google Scholar]
- 30. Magi R, Morris AP. GWAMA: software for genome‐wide association meta‐analysis. BMC Bioinformatics. 2010;11:288. [DOI] [PMC free article] [PubMed] [Google Scholar]
- 31. Wang L, Wang X, Wang L, Yousaf M, Li J, Zuo M, Yang Z, Gou D, Bao B, Li L, et al. Identification of a new adtrp1‐tfpi regulatory axis for the specification of primitive myelopoiesis and definitive hematopoiesis. FASEB J. 2018;32:183–194. [DOI] [PMC free article] [PubMed] [Google Scholar]
- 32. Patel MM, Behar AR, Silasi R, Regmi G, Sansam CL, Keshari RS, Lupu F, Lupu C. Role of ADTRP (androgen‐dependent tissue factor pathway inhibitor regulating protein) in vascular development and function. J Am Heart Assoc. 2018;7:e010690 DOI: 10.1161/JAHA.118.010690. [DOI] [PMC free article] [PubMed] [Google Scholar]
- 33. Raote I, Ortega‐Bellido M, Santos AJ, Foresti O, Zhang C, Garcia‐Parajo MF, Campelo F, Malhotra V. TANGO1 builds a machine for collagen export by recruiting and spatially organizing COPII, tethers and membranes. Elife. 2018;7:e32723. [DOI] [PMC free article] [PubMed] [Google Scholar]
- 34. Klein ZA, Takahashi H, Ma M, Stagi M, Zhou M, Lam TT, Strittmatter SM. Loss of TMEM106B ameliorates lysosomal and frontotemporal dementia‐related phenotypes in progranulin‐deficient mice. Neuron. 2017;95:281–296.e6. [DOI] [PMC free article] [PubMed] [Google Scholar]
- 35. Hendrikx T, Walenbergh SM, Hofker MH, Shiri‐Sverdlov R. Lysosomal cholesterol accumulation: driver on the road to inflammation during atherosclerosis and non‐alcoholic steatohepatitis. Obes Rev. 2014;15:424–433. [DOI] [PubMed] [Google Scholar]
- 36. Xu X, Yuan X, Li N, Dewey WL, Li PL, Zhang F. Lysosomal cholesterol accumulation in macrophages leading to coronary atherosclerosis in CD38(‐/‐) mice. J Cell Mol Med. 2016;20:1001–1013. [DOI] [PMC free article] [PubMed] [Google Scholar]
- 37. Emanuel R, Sergin I, Bhattacharya S, Turner J, Epelman S, Settembre C, Diwan A, Ballabio A, Razani B. Induction of lysosomal biogenesis in atherosclerotic macrophages can rescue lipid‐induced lysosomal dysfunction and downstream sequelae. Arterioscler Thromb Vasc Biol. 2014;34:1942–1952. [DOI] [PMC free article] [PubMed] [Google Scholar]
- 38. Sergin I, Evans TD, Zhang X, Bhattacharya S, Stokes CJ, Song E, Ali S, Dehestani B, Holloway KB, Micevych PS, et al. Exploiting macrophage autophagy‐lysosomal biogenesis as a therapy for atherosclerosis. Nat Commun. 2017;8:15750. [DOI] [PMC free article] [PubMed] [Google Scholar]
- 39. Zhang EB, Kong R, Yin DD, You LH, Sun M, Han L, Xu TP, Xia R, Yang JS, De W, et al. Long noncoding RNA ANRIL indicates a poor prognosis of gastric cancer and promotes tumor growth by epigenetically silencing of miR‐99a/miR‐449a. Oncotarget. 2014;5:2276–2292. [DOI] [PMC free article] [PubMed] [Google Scholar]
- 40. Sarkar D, Leung EY, Baguley BC, Finlay GJ, Askarian‐Amiri ME. Epigenetic regulation in human melanoma: past and future. Epigenetics. 2015;10:103–121. [DOI] [PMC free article] [PubMed] [Google Scholar]
- 41. Meseure D, Vacher S, Alsibai KD, Nicolas A, Chemlali W, Caly M, Lidereau R, Pasmant E, Callens C, Bieche I. Expression of ANRIL‐polycomb complexes‐CDKN2A/B/ARF genes in breast tumors: identification of a two‐gene (EZH2/CBX7) signature with independent prognostic value. Mol Cancer Res. 2016;14:623–633. [DOI] [PubMed] [Google Scholar]
- 42. Chi JS, Li JZ, Jia JJ, Zhang T, Liu XM, Yi L. Long non‐coding RNA ANRIL in gene regulation and its duality in atherosclerosis. J Huazhong Univ Sci Technolog Med Sci. 2017;37:816–822. [DOI] [PubMed] [Google Scholar]
- 43. Wang Y, Cheng N, Luo J. Downregulation of lncRNA ANRIL represses tumorigenicity and enhances cisplatin‐induced cytotoxicity via regulating microRNA let‐7a in nasopharyngeal carcinoma. J Biochem Mol Toxicol. 2017;31:e21904 Available at: 10.1002/jbt.21904 [DOI] [PubMed] [Google Scholar]
- 44. Deng W, Chen K, Liu S, Wang Y. Silencing circular ANRIL protects HK‐2 cells from lipopolysaccharide‐induced inflammatory injury through up‐regulating microRNA‐9. Artif Cells Nanomed Biotechnol. 2019;47:3478–3484. [DOI] [PubMed] [Google Scholar]
- 45. Shu L, Zhang W, Huang C, Huang G, Su G, Xu J. lncRNA ANRIL protects H9c2 cells against hypoxia‐induced injury through targeting the miR‐7‐5p/SIRT1 axis. J Cell Physiol. 2020;235:1175–1183. [DOI] [PubMed] [Google Scholar]
- 46. Liu B, Cao W, Xue J. LncRNA ANRIL protects against oxygen and glucose deprivation (OGD)‐induced injury in PC‐12 cells: potential role in ischaemic stroke. Artif Cells Nanomed Biotechnol. 2019;47:1384–1395. [DOI] [PubMed] [Google Scholar]
- 47. Guo F, Tang C, Li Y, Liu Y, Lv P, Wang W, Mu Y. The interplay of LncRNA ANRIL and miR‐181b on the inflammation‐relevant coronary artery disease through mediating NF‐kappaB signalling pathway. J Cell Mol Med. 2018;22:5062–5075. [DOI] [PMC free article] [PubMed] [Google Scholar]
- 48. Tan P, Guo YH, Zhan JK, Long LM, Xu ML, Ye L, Ma XY, Cui XJ, Wang HQ. LncRNA‐ANRIL inhibits cell senescence of vascular smooth muscle cells by regulating miR‐181a/Sirt1. Biochem Cell Biol. 2019;97:571–580. [DOI] [PubMed] [Google Scholar]
- 49. He ZY, Wei TH, Zhang PH, Zhou J, Huang XY. Long noncoding RNA‐antisense noncoding RNA in the INK4 locus accelerates wound healing in diabetes by promoting lymphangiogenesis via regulating miR‐181a/Prox1 axis. J Cell Physiol. 2019;234:4627–4640. [DOI] [PubMed] [Google Scholar]
- 50. Phillips PC. Epistasis—the essential role of gene interactions in the structure and evolution of genetic systems. Nat Rev Genet. 2008;9:855–867. [DOI] [PMC free article] [PubMed] [Google Scholar]
- 51. Nghe P, Kogenaru M, Tans SJ. Sign epistasis caused by hierarchy within signalling cascades. Nat Commun. 2018;9:1451. [DOI] [PMC free article] [PubMed] [Google Scholar]


