

Abstract
Background
We aim to evaluate the association of within‐individual changes in consumption of total and specific types of nuts and the subsequent risk of incident cardiovascular disease (CVD) in US men and women.
Methods and Results
We included 34 103 men from the HPFS (Health Professionals Follow‐Up Study) (1986–2012), 77 815 women from the NHS (Nurses’ Health Study) (1986–2012), and 80 737 women from the NHS II (1991–2013). We assessed nut consumption every 4 years using validated food frequency questionnaires. We used multivariable Cox proportional hazards regression models to examine the association between 4‐year changes in nut consumption and risk of confirmed CVD end points in the subsequent 4 years. Per 0.5 serving/day increase in total nut consumption was associated with lower risk of CVD (relative risk [RR], 0.92; 95% CI, 0.86–0.98), coronary heart disease (RR, 0.94; 95% CI, 0.89–0.99), and stroke (RR, 0.89; 95% CI, 0.83–0.95). Compared with individuals who remained nonconsumers in a 4‐year interval, those who had higher consumption of total nuts (≥0.5 servings/day) had a lower risk of CVD (RR, 0.75; 95% CI, 0.67–0.84), coronary heart disease (RR, 0.80; 95% CI, 0.69–0.93), and stroke (RR, 0.68; 95% CI, 0.57–0.82) in next 4 years. Individuals who decreased nut consumption by ≥0.50 servings/day had a higher risk of developing CVD (RR, 1.14; 95% CI, 0.99–1.32), coronary heart disease (RR, 1.06; 95% CI, 0.88–1.28), and stroke (RR, 1.28; 95% CI, 1.02–1.60) when compared with those who maintained their nut consumption.
Conclusions
Increasing total consumption of nuts and intake of individual types of nuts (eg, walnuts, other tree nuts, and peanuts) was associated with a subsequent lower risk of CVD. These data support the role of nut intake in the primary prevention of CVD.
Registration
URL: http://www.clinicaltrials.gov. Unique identifiers: NCT00005152 and NCT00005182.
Keywords: cardiovascular disease, cohorts, nuts, peanuts, prevention, stroke
Subject Categories: Cardiovascular Disease, Epidemiology, Diet and Nutrition, Lifestyle, Primary Prevention
Nonstandard Abbreviations and Acronyms
- CVD
cardiovascular disease
- CHD
coronary heart disease
- HPFS
Health Professionals Follow‐Up Study
- NHS
Nurses’ Health Study
- RR
relative risk
- FFQ
food frequency questionnaire
Clinical Perspective
What Is New?
We evaluated whether dynamic changes in total nut consumption and consumption of specific types of nuts over time (ie, from nonconsumers to consumers) are associated with lower risk of cardiovascular disease (CVD).
Increasing intake of total consumption of nuts, and intake of specific types of nuts, including walnuts, other tree nuts, or peanuts, was associated with a subsequent lower risk of CVD.
What Are the Clinical Implications?
Maintaining a regular consumption of nuts is associated with lower risk for CVD.
Incorporating nuts into diet is beneficial for the prevention of CVD, even among those who previously did not consume nuts.
Substituting less healthful food items with nuts is associated with reduced risk of developing CVD.
Introduction
Cardiovascular disease (CVD) is the leading cause of death worldwide and largely preventable through improving diet quality and other lifestyle factors.1, 2 Diet quality has modestly improved among US adults over the past 2 decades, mainly because of increases in intakes of whole grains, nuts, and seeds and decreases in sugar‐sweetened beverages and trans fatty acids.3 As an important component of a healthy diet in the United States, nuts are nutrient‐dense foods rich in unsaturated fatty acids, proteins, vitamins, minerals, and fibers.4 At the same time, nuts are also rich in fats and thus energy dense, which may lead some to perceive nuts as an unhealthful food choice. However, considerable evidence from both epidemiological studies and clinical trials suggests that nuts are not associated with weight gain and may, in fact, help to lose weight when incorporated to an energy restricted diet.5
Nuts have cardioprotective benefits.6, 7 A recent meta‐analysis of 12 prospective studies reported a dose‐response, inverse association between nuts and risk of CVD. Each additional 28 g/d was associated with a 21% lower risk of CVD and a 29% lower risk of coronary heart disease (CHD).6 Higher nut consumption was also associated with a lower risk of CHD mortality.7 Results from the PREDIMED (Prevención con Dieta Mediterránea) study, a primary‐prevention randomized trial, are consistent with findings from observational studies. In the PREDIMED trial, randomization to consume 30 g/d of mixed nuts in the context of a Mediterranean diet reduced major cardiovascular events by 28% over 5 years mean follow‐up, and the risk reduction was similar to that among participants randomized to the Mediterranean diet supplemented with extra virgin olive oil.8
The consumption of nuts and seeds has played an increasingly important role in the US diet: the intake of these foods has increased from 0.5 servings/day in 1999 to 0.75 servings/day in 2012.9 Despite consistent evidence demonstrating a dose‐response association between nut consumption and CVD risk, there are no epidemiological studies evaluating whether dynamic within‐person changes in nut consumption over time (ie, from nonconsumers to consumers) are associated with subsequent risk of CVD. Also, most previous studies have focused on total nut consumption; however, the consumption of specific types of nuts remains largely uninvestigated. Therefore, in the present analyses, we aim to examine the association of changes in total consumption of nuts, and in specific types of nuts (eg, walnuts, other tree nuts, and peanuts), with risk of developing major cardiovascular events in 3 large prospective cohorts of US men and women.
Methods
The authors confirm that the data supporting the findings of this study are available within the article and its supplementary materials. Please see the study websites for more information: https://www.hsph.harvard.edu/hpfs/hpfs_collaborators.htm, and http://www.nurseshealthstudy.org/researchers.
Study Population
Population Characteristics
We conducted a pooled analysis of 3 large US prospective cohort studies: the HPFS (Health Professionals Follow‐Up Study), the NHS (Nurses’ Health Study), and the NHS II. In the HPFS, 51 529 male health professionals between 40 and 75 years of age were enrolled in 1986 from 50 states. The NHS was composed of 121 701 nurses between 35 and 55 years of age when they were enrolled in 1976 from 11 states, and the NHS II included 116 430 younger nurses aged 24 to 44 years when enrolled in 1989 from 14 states.10 Approximately 97% of study participants are white.11 Information on participants’ medical history, newly diagnosed diseases, lifestyle, and dietary factors was collected at baseline and during follow‐up through mailed questionnaires every 2 to 4 years. The response rate was ≈90% for each cycle in the 3 cohorts.10 Participants gave informed consent via the return of questionnaires.
The study was approved by the institutional review boards of Brigham and Women's Hospital and Harvard T.H. Chan School of Public Health. Completion of self‐administered information was considered to imply informed consent.
Outcome Ascertainment
Our primary end point was incident total CVD, a composite outcome including nonfatal myocardial infarction, fatal CHD, and stroke (nonfatal or fatal).
When participants reported nonfatal cardiovascular events on any biennial questionnaires, we requested permission from participants for study physicians to review their medical records. Nonfatal myocardial infarction was confirmed using the diagnostic criteria of the World Health Organization, specifically, on the basis of symptoms and either electrocardiographic changes or elevated cardiac enzyme concentrations.12 Nonfatal stroke was defined according to the diagnostic criteria of National Survey of Strokes criteria, requiring evidence of a neurological deficit with sudden or rapid onset that persisted for >24 hours or until death.13 CHD and stroke events that could not be confirmed by medical records but with other confirmatory information that was obtained through telephone interview or letter were classified as probable. In the current study, we included both confirmed and probable cases of CHD and stroke, as results including both confirmed and probable CVD events were nearly identical to those obtained with confirmed cases alone.14
Deaths were identified through searches of the National Death Index,13 or were reported by family members or the postal authorities.13 Fatal CHD was confirmed by medical records, autopsy reports, or death certificates, if CHD was listed as the underlying and only plausible cause of death on the death certificate with previous evidence of CHD in the medical records. Similarly, fatal stroke was identified and confirmed by reviewing death certificates, hospital records, or autopsy records.
Dietary Assessment
A semiquantitative validated food frequency questionnaire (FFQ) containing ≈130 foods was administrated to participants every 4 years starting in 1986 in the NHS and HPFS and in 1991 in the NHS II. These time points were used as baseline for the current analysis.
Participants were asked to report the frequency on consumption of a standard portion size of each food or beverage, from “never or less than once per month” to “≥6 times per day” on average over the past year. Validation of the questionnaire has been reported previously.15, 16, 17 Nut consumption assessed by FFQ questionnaire provided reasonable accuracy in reflecting daily nut consumption when compared with a 7‐days diet record, as evidenced by a correlation coefficient of 0.75 for both total nuts and peanut butter.18
For nuts, participants were asked how often they consumed 1 serving (28 g or 1 ounce) of nuts and peanuts. We converted frequency categories of nut consumption (never or less than once per month, 1–3 per month, 1 per week, 2–4 per week, 5–6 per week, 1 per day, 2–3 per day, 4–6 per day, or ≥6 times per day) to servings per day. Consumption of peanut butter was also assessed with the same 9 frequency categories in 1 tablespoon (15 g) servings.
Questions on walnuts and “other tree nuts” were first added to the FFQ in 1998 in NHS and HPFS, and in 1999 in NHS II, after which we derived total consumption of tree nuts as the sum of other tree nuts and walnuts. Botanically, peanuts are legumes19; however, in this analysis, we included peanuts within the total nut category, because they are considered as nuts by consumers and have a nutrient composition similar to tree nuts.2 In the present study, we analyzed total consumption of nuts (ie, walnuts, other tree nuts, and peanuts), tree nuts (walnuts and other tree nuts), walnuts, other tree nuts not including walnuts, peanuts (without peanut butter), and peanut butter.
Statistical Analysis
We used Cox proportional‐hazards regression models to examine the associations between changes in total nut intake or intake of specific types of nuts during a 4‐year interval with the relative risk (RR) of developing CVD, CHD, and stroke during the subsequent 4 years with a total of up to 26 (NHS and HPFS) or 22 (NHS II) years of follow‐up. Individuals contributed to person‐time from the return of the baseline FFQ until the date of diagnosis of CVD, death, or the end of the follow‐up period (January 2012 for HPFS, June 2012 for NHS, and June 2013 for NHS II), whichever came first.
We excluded participants who reported CVD, cancer, diabetes mellitus, or missing body mass index before or during the first 4‐year interval. For individuals who had missing FFQ or missing data on nut consumption or reported implausible energy intake (<600 or >3500 kcal/d for women or <800 or >4200 kcal/d for men), we further excluded their person‐time from corresponding intervals but otherwise continued to count their person‐times in subsequent intervals with valid data.
Our basic model (model 1) was stratified by age, cohort, sex, and calendar year in 4‐year intervals. In model 2, we further adjusted for the initial nut intake at the beginning of each 4‐year period. In model 3, we further adjusted for race (white, other), family history of myocardial infarction, menopausal status (premenopausal or postmenopausal), hormone therapy use (never, past, or current), oral contraceptive use (never, current, past, missing indicator, in NHS II), number of teeth at baseline (0, 1–16, 17–24, 25–32, in NHS and HPFS), updated teeth lost during follow‐up (continuous, in NHS and HPFS), initial and change in smoking status (never to never, never to current, past to past, current to past, current to current, missing indicator), initial alcohol intake (g/d: 0.0, 0.1–4.9, 5.0–14.9, 15.0–29.9, and ≥30.0), change in alcohol intake (decrease, no change, increase), and initial (metabolic equivalent h/wk: quintiles), and change in physical activity level (metabolic equivalent h/wk: <−5.0, −5.0 to 4.9, ≥5.0). In the final model 4, we further adjusted for initial body mass index (kg/m2: <21.0, 21.0–24.9, 25.0–29.9, 30.0–31.9, >32.0), updated history of hypercholesterolemia, and high blood pressure at the start of each 4‐year interval, initial (kcal/d: quintiles) and changes in total energy intake (kcal/d: <−250, −250 to 250, ≥250), and initial and change in Alternative Healthy Eating Index score (calculated without the alcohol and nut components:<−2, −2 to 5, ≥5) over each 4‐year period.
Changes in intakes of nuts and other dietary factors were modeled as continuous variables in 0.5 servings/day. Those with lower than the 0.5th percentile or higher than the 99.5th percentile were assigned to values of 0.5th percentile or 99.5th percentile, respectively, to minimize the influence of outliers.20
We categorized the change in nut consumption over 4 years into 5 groups: (1) minimal change (±0.00 servings/day), (2) increase between 0.01 and 0.49 servings/day, (3) decrease between 0.01 and 0.49 servings/day, (4) increase ≥0.50 servings/day, and (5) decrease ≥0.50 servings/day. Individuals with no change or relatively stable consumption were assigned as the reference group. The median values of each category were modeled as continuous variables to examine the linear trend. Missing data from categorical variables were assigned a missing indicator to minimize sample reduction caused by missing covariates.
We also categorized participants by their habitual nut intake, assessed by consistency across 2 consecutive FFQs into 9 groups (jointly defined by nonconsumer [0 servings/day], low intake [<0.5 servings/day], and high intake [≥0.50 servings/day] at the beginning and the assessment at 4 years of each 4‐year interval) and subsequently examined the association with risk of total CVD, CHD, and stroke. Those who were nonconsumers at both time points were assigned as the reference group.
We conducted statistical substitution analysis to estimate the potential effect of substituting nuts for other foods on CVD risk. We further adjusted model 3 for initial and change in intake (serving/day) of red meat, processed meat, refined grain, French fries, dessert, and chips. We calculated the differences in β coefficients of changes of nuts and other food items, which can be interpreted as the estimated effects on CVD risk when increasing 0.5 servings/day (3.5 servings/week) of nuts while simultaneously decreasing the equal serving of other foods.
We also conducted prespecified subgroup analyses by potential effect modifiers of the association between changes in nut intake and CVD risk. We stratified the analyses on the basis of participants’ age (<60 or ≥60 years), smoking status (never smoking or ever smoking), and changes in energy, alcohol intake, physical activity level, Alternative Healthy Eating Index score, and body weight. Two change categories were used: “no changes or decreased” and “increased.” We conducted 2 sensitivity analyses to test the robustness of our results. First, we further adjusted our final model (model 4) for concurrent 4‐year changes in body weight to estimate the extent to which weight change mediates the association between changes in nut intake with CVD risk. Second, we further censored follow‐up of men and women who developed incident diabetes mellitus during the follow‐up period.
We pooled data from the 3 cohorts for the main analysis, and considered the cohort‐specific results for secondary analyses. We used SAS version 9.4 (SAS Institute) to analyze the data, and set statistical significance at a 2‐tailed P<0.05.
Results
Baseline Characteristics
The current study included 34 103 men in the HPFS, 77 815 women in the NHS, and 80 737 women in the NHS II. Table 1 presents participants’ characteristics based on baseline 4‐year change in nut consumption. Individuals who increased nut consumption over time had a lower initial consumption, higher initial energy intake, and better diet quality (higher Alternative Healthy Eating Index score) than those who maintained a stable nut consumption. Decrease in nut consumption was observed along with decrease in energy intake and diet quality and a higher initial consumption.
Table 1.
Age‐Adjusted Characteristics of Participants According to the First 4‐Year Changes in Total Nut Consumption
| Variable | Changes in Total Nut Consumption (Servings/d)a | ||||
|---|---|---|---|---|---|
| Decrease | No Change | Increase | |||
| ≥0.50 | 0.01–0.49 | 0.00 | 0.01–0.49 | ≥0.50 | |
| HPFS | |||||
| Participants, n | 2243 | 10 576 | 10 339 | 9180 | 1765 |
| Initial nut intake, servings/d | 1.3 (1.1) | 0.3 (0.2) | 0.1 (0.2) | 0.1 (0.2) | 0.3 (0.4) |
| Change in nut intake, servings/d | −1.1 (0.9) | −0.2 (0.1) | 0.0 (0.0) | 0.2 (0.1) | 1.0 (0.8) |
| Age, yb | 58.8 (9.8) | 57.7 (9.8) | 58.1 (9.9) | 58.4 (9.8) | 60.8 (9.4) |
| Initial body mass index, kg/m2 | 25.3 (3.1) | 25.5 (3.2) | 25.4 (3.2) | 25.5 (3.2) | 25.2 (3.2) |
| Weight change, kg | 0.6 (4.8) | 0.6 (4.1) | 0.6 (4.2) | 0.7 (4.2) | 0.5 (4.9) |
| Current smoker, % | 7.4 | 8.1 | 8.6 | 8.3 | 8.4 |
| Initial physical activity, metabolic equivalent h/wk | 22.6 (30.7) | 19.9 (24.0) | 19.5 (26.0) | 19.7 (26.2) | 21.7 (25.4) |
| Change in physical activity, metabolic equivalent h/wk | 1.0 (30.0) | 1.7 (22.8) | 1.8 (24.6) | 2.0 (25.3) | 1.9 (23.1) |
| Initial alcohol intake, g/d | 13.6 (16.6) | 11.5 (14.9) | 10.6 (14.8) | 11.3 (15.0) | 12.6 (16.0) |
| Change in alcohol intake, g/d | −1.5 (11.7) | −1.1 (10.1) | −0.7 (10.2) | −0.2 (10.6) | 0.1 (11.0) |
| Initial total energy intake, kcal/d | 2383.8 (653.8) | 2022.3 (604.5) | 1898.0 (590.5) | 1951.7 (588.1) | 2129.0 (638.1) |
| Change in total energy intake, kcal/d | −327.3 (563.9) | −133.6 (504.2) | −37.0 (490.9) | 60.6 (504.7) | 228.5 (566.5) |
| Initial Alternate Healthy Eating Index score | 45.4 (10.4) | 43.1 (9.9) | 42.7 (10.2) | 42.7 (10.1) | 43.9 (10.4) |
| Change in Alternate Healthy Eating Index score | −0.3 (7.4) | 0.9 (7.3) | 1.0 (7.5) | 1.2 (7.2) | 2.8 (7.8) |
| Family history of myocardial infarction, % | 31.3 | 31.8 | 32.8 | 31.6 | 30.2 |
| Initial high blood pressure, % | 21.1 | 21.0 | 20.8 | 21.6 | 21.4 |
| Initial hypercholesterolemia, % | 16.7 | 16.9 | 16.8 | 18.4 | 20.2 |
| NHS | |||||
| Participants, n | 2839 | 23 544 | 32 269 | 17 016 | 2147 |
| Initial nut intake, servings/d | 1.1 (0.8) | 0.2 (0.2) | 0.0 (0.1) | 0.1 (0.1) | 0.2 (0.3) |
| Change in nut intake, servings/d | −1.0 (0.7) | −0.1 (0.1) | 0.0 (0.0) | 0.1 (0.1) | 1.0 (0.8) |
| Age, yb | 58.9 (7.8) | 57.7 (7.8) | 58.4 (8.0) | 58.7 (7.9) | 61.0 (8.1) |
| Initial body mass index, kg/m2 | 24.7 (4.4) | 25.3 (4.7) | 25.6 (4.9) | 25.5 (4.8) | 25.0 (4.7) |
| Weight change, kg | 1.0 (5.2) | 1.0 (5.3) | 1.2 (5.4) | 1.4 (5.2) | 0.8 (5.4) |
| Current smoker, % | 17.8 | 18.0 | 19.3 | 18.3 | 17.7 |
| Initial physical activity, metabolic equivalent h/wk | 17.0 (25.7) | 14.9 (20.8) | 14.2 (20.7) | 15.0 (21.1) | 16.9 (22.1) |
| Change in physical activity, metabolic equivalent h/wk | 2.1 (26.6) | 1.9 (21.5) | 1.7 (22.5) | 1.9 (23.2) | 2.0 (22.7) |
| Initial alcohol intake, g/d | 7.4 (11.1) | 6.3 (10.4) | 5.3 (9.8) | 6.1 (10.7) | 6.7 (10.6) |
| Change in alcohol intake, g/d | −1.2 (7.7) | −1.0 (7.4) | −0.6 (6.8) | −0.5 (7.5) | −0.2 (7.6) |
| Initial total energy intake, kcal/d | 2151.4 (553.8) | 1823.4 (524.8) | 1663.6 (510.1) | 1762.3 (519.7) | 1877.9 (537.4) |
| Change in total energy intake, kcal/d | −260.3 (490.3) | −88.7 (455.0) | −9.8 (442.1) | 74.5 (455.5) | 223.9 (484.5) |
| Initial Alternate Healthy Eating Index score | 47.9 (9.9) | 45.0 (9.7) | 44.3 (10.0) | 44.5 (9.8) | 46.0 (10.5) |
| Change in Alternate Healthy Eating Index score | −0.7 (7.7) | 0.8 (7.5) | 0.9 (7.6) | 1.3 (7.4) | 3.0 (8.1) |
| Family history of myocardial infarction, % | 23.9 | 25.3 | 24.8 | 24.3 | 23.4 |
| Baseline premenopausal, % | 23.0 | 22.9 | 23.2 | 23.6 | 22.5 |
| Initial high blood pressure, % | 22.9 | 25.1 | 27.3 | 27.4 | 23.9 |
| Initial hypercholesterolemia, % | 20.3 | 20.8 | 22.5 | 24.1 | 27.2 |
| NHS II | |||||
| Participants, n | 1011 | 18 883 | 41 799 | 17 450 | 1594 |
| Initial nut intake, servings/d | 1.0 (0.6) | 0.2 (0.1) | 0.0 (0.1) | 0.0 (0.1) | 0.1 (0.2) |
| Change in nut intake, servings/d | −0.9 (0.6) | −0.1 (0.1) | 0.0 (0.0) | 0.1 (0.1) | 1.0 (0.7) |
| Age, yb | 45.0 (7.4) | 41.1 (5.5) | 40.8 (5.2) | 42.2 (5.8) | 46.5 (6.7) |
| Initial body mass index, kg/m2 | 24.1 (5.2) | 24.7 (5.4) | 24.8 (5.3) | 24.7 (5.4) | 24.1 (5.4) |
| Weight change, kg | 2.8 (6.3) | 2.9 (6.2) | 3.1 (6.6) | 3.0 (6.5) | 1.9 (6.5) |
| Current smoker, % | 13.7 | 11.9 | 11.0 | 12.0 | 11.2 |
| Initial physical activity, metabolic equivalent h/wk | 27.2 (33.5) | 24.0 (34.9) | 23.5 (33.9) | 23.3 (33.3) | 26.9 (42.9) |
| Change in physical activity, metabolic equivalent h/wk | −0.3 (31.3) | −3.0 (32.7) | −3.0 (32.1) | −2.8 (32.3) | −0.6 (33.8) |
| Initial alcohol intake, g/d | 4.3 (7.7) | 3.7 (6.8) | 3.0 (6.0) | 3.5 (6.5) | 4.0 (7.6) |
| Change in alcohol intake, g/d | 0.2 (6.6) | 0.2 (5.5) | 0.3 (5.2) | 0.7 (5.6) | 0.7 (6.2) |
| Initial total energy intake, kcal/d | 2223.3 (586.6) | 1919.3 (549.2) | 1702.1 (527.9) | 1814.1 (541.8) | 1969.5 (570.0) |
| Change in total energy intake, kcal/d | −258.1 (560.0) | −77.5 (503.3) | 20.6 (481.1) | 127.3 (505.1) | 267.1 (594.1) |
| Initial Alternate Healthy Eating Index score | 46.0 (10.6) | 41.7 (9.8) | 41.8 (10.0) | 41.8 (9.9) | 44.0 (10.2) |
| Change in Alternate Healthy Eating Index score | −1.1 (8.2) | 0.5 (8.0) | 0.3 (8.3) | 0.7 (8.2) | 3.8 (9.4) |
| Family history of myocardial infarction, % | 37.5 | 40.3 | 40.6 | 39.1 | 36.7 |
| Baseline premenopausal, % | 87.4 | 86.0 | 86.3 | 86.2 | 85.8 |
| Baseline use of oral contraceptive, % | 7.1 | 8.2 | 8.5 | 9.1 | 8.5 |
| Initial high blood pressure, % | 6.7 | 7.1 | 7.1 | 7.2 | 6.0 |
| Initial hypercholesterolemia, % | 15.6 | 15.8 | 15.6 | 16.4 | 14.2 |
HPFS indicates Health Professionals Follow‐Up Study; and NHS, Nurses’ Health Study.
The first 4‐year period refers to the first period during which changes in nut consumption were calculated for each subjects. Values are means (SDs) or percentages and are standardized to the age distribution of the study population.
Value is not age adjusted.
Changes in Nut Consumption and Risk of CVD, CHD, and Stroke
Table 2 shows the associations between changes in nut consumption and risks of CVD, CHD, and stroke. Compared with individuals who did not change their total intake of nuts, those who increased nut consumption ≥0.50 servings/day were associated with lower risk of CVD (RR, 0.86; 95% CI, 0.78–0.94), CHD (RR, 0.88; 95% CI, 0.78–1.00), and stroke (RR, 0.82; 95% CI, 0.71–0.96) independent of initial nut consumption and other lifestyle factors. In contrast, participants who decreased nut consumption by ≥0.50 servings/day had a higher risk of CVD (RR, 1.14; 95% CI, 0.99–1.32), CHD (RR, 1.06; 95% CI, 0.88–1.28), and stroke (RR, 1.28; 95% CI, 1.02–1.60) when compared with individuals who maintained their nut consumption stable over 4 years (model 2–4 adjusted for initial intake). An increase of 0.5 servings/day in total nut consumption was associated with an 8% lower risk of CVD (RR, 0.92; 95% CI, 0.86–0.98), 6% lower risk of CHD (RR, 0.94; 95% CI, 0.89–0.99), and 11% lower risk of stroke (RR, 0.89; 95% CI, 0.83–0.95) (Figure 1). Increasing intakes of tree nuts, walnuts, and peanuts, per 0.5 servings/day, were each significantly associated with lower risk of CVD. Increase in consumption of tree nuts and peanuts (0.5 servings/day) was associated with lower risk of CHD. An increase in walnut consumption was associated with lower risk of stroke.
Table 2.
Multivariable Adjusted RR (95% CI) for Incident Cardiovascular Disease According to Categories of Updated 4‐Year Changes in Total Nut Consumption Based on Pooled Data of NHS, NHS II, and the HPFS
| Variable | Changes in Total Nut Consumption Frequency (Servings/d) | P Trend | ||||
|---|---|---|---|---|---|---|
| Decrease | No Change | Increase | ||||
| Range | ≤−0.50 | −0.49 to −0.01 | 0 | 0.01 to 0.49 | ≥0.50 | |
| Cumulative initial intake, mean (SD) | 1.37 (0.99) | 0.26 (0.27) | 0.06 (0.16) | 0.11 (0.21) | 0.26 (0.37) | |
| Cumulative 4‐y changes, mean (SD) | −1.04 (0.79) | −0.15 (0.11) | 0 | 0.16 (0.11) | 1.05 (0.77) | |
| Cardiovascular disease | ||||||
| Cases, n | 384 | 2085 | 3075 | 2355 | 561 | |
| Model 1 | 0.87 (0.78–0.97) | 0.92 (0.87–0.98) | 1.0 (Reference) | 0.87 (0.82–0.92) | 0.74 (0.68–0.82) | 0.0001 |
| Model 2 | 1.18 (1.02–1.36) | 0.97 (0.91–1.03) | 1.0 (Reference) | 0.88 (0.83–0.93) | 0.78 (0.71–0.85) | <0.0001 |
| Model 3 | 1.17 (1.01–1.35) | 1.00 (0.94–1.06) | 1.0 (Reference) | 0.93 (0.88–0.98) | 0.85 (0.77–0.93) | <0.0001 |
| Model 4 | 1.14 (0.99–1.32) | 0.99 (0.94–1.05) | 1.0 (Reference) | 0.93 (0.88–0.99) | 0.86 (0.78–0.94) | <0.0001 |
| Coronary heart disease | ||||||
| Cases, n | 225 | 1268 | 1745 | 1405 | 334 | |
| Model 1 | 0.85 (0.74–0.98) | 0.95 (0.88–1.02) | 1.0 (Reference) | 0.89 (0.83–0.96) | 0.75 (0.67–0.85) | 0.007 |
| Model 2 | 1.11 (0.92–1.33) | 0.99 (0.92–1.07) | 1.0 (Reference) | 0.90 (0.83–0.96) | 0.78 (0.69–0.88) | <0.0001 |
| Model 3 | 1.10 (0.91–1.32) | 1.03 (0.95–1.11) | 1.0 (Reference) | 0.96 (0.89–1.03) | 0.86 (0.76–0.97) | 0.002 |
| Model 4 | 1.06 (0.88–1.28) | 1.02 (0.94–1.10) | 1.0 (Reference) | 0.96 (0.89–1.03) | 0.88 (0.78–1.00) | 0.01 |
| Stroke | ||||||
| Cases, n | 159 | 817 | 1330 | 950 | 227 | |
| Model 1 | 0.91 (0.77–1.08) | 0.89 (0.81–0.97) | 1.0 (Reference) | 0.85 (0.78–0.92) | 0.73 (0.64–0.85) | 0.005 |
| Model 2 | 1.31 (1.04–1.63) | 0.94 (0.86–1.03) | 1.0 (Reference) | 0.86 (0.79–0.93) | 0.77 (0.67–0.89) | <0.0001 |
| Model 3 | 1.29 (1.03–1.61) | 0.96 (0.87–1.05) | 1.0 (Reference) | 0.90 (0.82–0.98) | 0.83 (0.71–0.96) | 0.0003 |
| Model 4 | 1.28 (1.02–1.60) | 0.96 (0.87–1.05) | 1.0 (Reference) | 0.89 (0.82–0.97) | 0.82 (0.71–0.96) | 0.0004 |
Model 1 was stratified by age, sex, and calendar year in 4‐year intervals; model 2 was model 1 further adjusted for initial total nut intake; model 3 was model 2 further adjusted for race (white or nonwhite), family history of myocardial infarction, initial and change in smoking status (never to never, never to current, past to past, current to past, current to current, missing indicator), menopausal status and postmenopausal hormone use (premenopausal, postmenopausal+current use, postmenopausal+past use, postmenopausal+never use, missing indicator, in NHS and NHS II), number of teeth at baseline (0, 1–16, 17–24, 25–32, in NHS and HPFS) and updated teeth loss during follow‐up (continuous, in NHS and HPFS), oral contraceptive use (never, current, past, missing indicator, in NHS II), initial (g/d: 0, 0.1–4.9, 5–14.9, 15–29.9, and ≥30) and change in alcohol intake (decrease, no change, or increase), and initial (metabolic equivalent h/wk, quintiles) and change in physical activity level (metabolic equivalent h/wk: <−5, −5 to 4.9, or ≥5); model 4 was model 3 further adjusted for initial body mass index (<21.0, 21.0–24.9, 25.0–29.9, 30.0–31.9, or >32.0 kg/m2), initial history of hypercholesterolemia and high blood pressure at the start of each 4‐year interval, initial (quintiles) and changes in energy intakes (kcal/d: <−250, −250 to 250, or ≥250), and initial (calculated without the alcohol component and nuts, quintile) and change in Alternate Healthy Eating Index score (<−2, −2 to 5, or ≥5) over each 4‐year period. HPFS indicates Health Professionals Follow‐Up Study; NHS, Nurses’ Health Study; and RR, relative risk.
Figure 1.
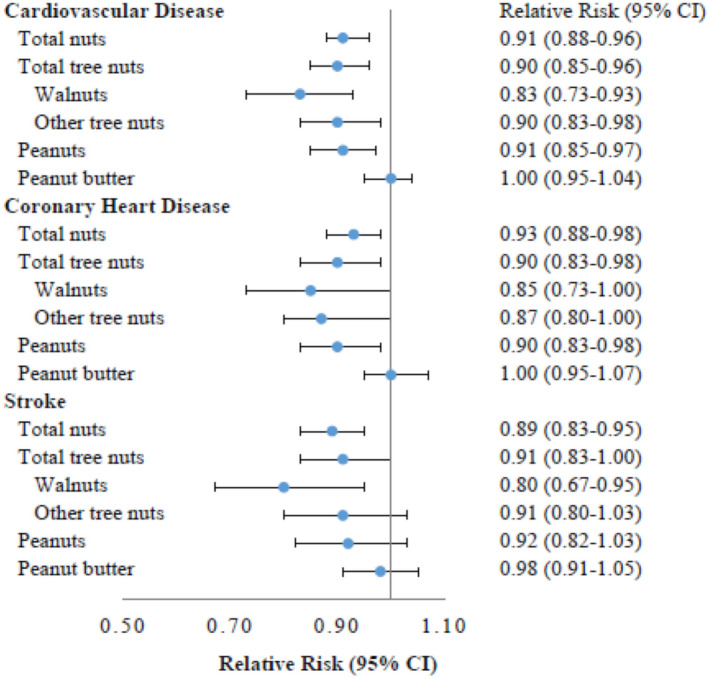
Risk for incident cardiovascular disease, per 0.5‐serving/day increase in consumption of different types of nuts during follow‐up.
Multivariate adjusted model was stratified by age, sex, and calendar year in 4‐year intervals and adjusted for initial total nut intake, race (white or nonwhite), family history of myocardial infarction, initial and change in smoking status (never to never, never to current, past to past, current to past, current to current, missing indicator), menopausal status, postmenopausal hormone use (premenopausal, postmenopausal+current use, postmenopausal+past use, postmenopausal+never use, missing indicator, in NHS [Nurses’ Health Study] and NHS II), number of teeth at baseline (0, 1–16, 17–24, 25–32, in NHS and HPFS [Health Professionals Follow‐Up Study]) and updated teeth loss during follow‐up (continuous, in NHS and HPFS), oral contraceptive use (never, current, past, missing indicator, in NHS II), initial (g/d: 0, 0.1–4.9, 5–14.9, 15–29.9, and ≥30) and change in alcohol intake (decrease, no change, or increase), initial (metabolic equivalent h/wk, quintiles) and change in physical activity level (metabolic equivalent h/wk: <−5, −5 to 4.9, ≥5), initial body mass index (<21.0, 21.0–24.9, 25.0–29.9, 30.0–31.9, and >32.0 kg/m2), initial (quintiles) and changes in energy intakes (kcal/d: <−250, −250 to 250, or ≥250), initial (calculated without the alcohol component and nuts, quintile) and change in Alternate Healthy Eating Index score (<−2, −2 to 5, or ≥5) over each 4‐year period, and initial history of hypercholesterolemia and high blood pressure at the start of each 4‐year interval; model was further mutually adjusted for changes in total tree nuts, peanuts, and peanut butter; analysis of walnuts and other tree nuts was based on the subcohort data started from 1998 (NHS/HPFS) or 1999 (NHS II), and further mutually adjusted for changes in walnut, other tree nuts, peanuts, and peanut butter.
We evaluated the joint association of habitual nut intake at the beginning and end of each 4‐year interval with the risk of developing CVD, CHD, and stroke in subsequent 4 years throughout study follow‐up (Figure 2). Compared with individuals who remained nonconsumers over 4 years, those who maintained consistently high nut consumption of ≥0.5 servings/day over 4 years had a lower risk of CVD (RR, 0.75; 95% CI, 0.67–0.84), CHD (RR, 0.80; 95% CI, 0.69–0.93), and stroke (RR, 0.68; 95% CI, 0.57–0.82). When compared with nonconsumers, individuals who increased their nut consumption over 4‐year period from 0 to ≥0.5 servings/day also had lower risks of developing CVD, CHD, and stroke in the next 4 years. The magnitude of this joint association was consistent across the 3 cohorts (Table S1).
Figure 2.
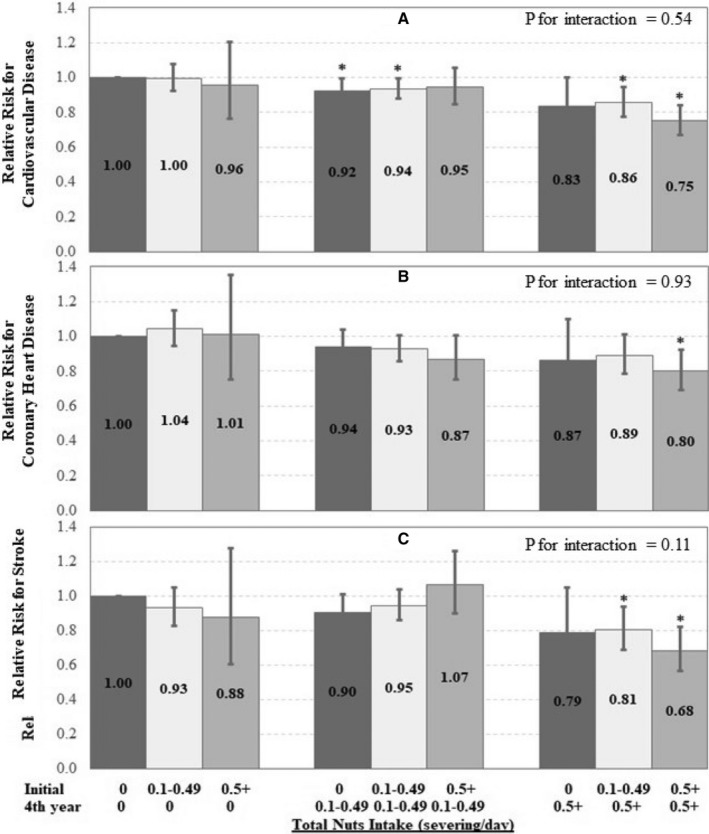
Risk for incident cardiovascular disease (CVD) (A), coronary heart disease (CHD) (B), and stroke (C) according to the joint categories of total consumption of nuts.
Multivariate adjusted model was stratified by age, sex, and calendar year in 4‐year intervals and adjusted for initial total nut intake, race (white or nonwhite), family history of myocardial infarction, initial and change in smoking status (never to never, never to current, past to past, current to past, current to current, missing indicator), menopausal status, postmenopausal hormone use (premenopausal, postmenopausal+current use, postmenopausal+past use, postmenopausal+never use, missing indicator, in NHS [Nurses’ Health Study] and NHS II), number of teeth at baseline (0, 1–16, 17–24, 25–32, in NHS and HPFS [Health Professionals Follow‐Up Study]) and updated teeth loss during follow‐up (continuous, in NHS and HPFS), oral contraceptive use (never, current, past, missing indicator, in NHS II), initial (g/d: 0, 0.1–4.9, 5–14.9, 15–29.9, and ≥30) and change in alcohol intake (decrease, no change, or increase), initial (metabolic equivalent h/wk, quintiles) and change in physical activity level (metabolic equivalent h/wk: <−5, −5 to 4.9, ≥5), initial body mass index (<21.0, 21.0–24.9, 25.0–29.9, 30.0–31.9, and >32.0 kg/m2), initial (quintiles) and changes in energy intakes (kcal/d: <−250, −250 to 250, or ≥250), initial (calculated without the alcohol component and nuts, quintile) and change in Alternate Healthy Eating Index score (<−2, −2 to 5, or ≥5) over each 4‐year period, and initial history of hypercholesterolemia and high blood pressure at the start of each 4‐year interval. *P for interaction between the initial year and the fourth year nut consumption over each 4‐year period.
Statistically substituting nuts for meat, processed meat, refined grain, French fries, and dessert (including chocolates, candy bars, cookies, cakes, sweet roll, pies, and donuts) was associated with lower risks of CVD, CHD, and stroke (Figure S1). For example, increasing nut intake by 0.5 servings/day (3.5 servings/week) with a simultaneous decrease in red meat by 0.5 servings/day was associated with 7% to 13% lower risks of CVD, CHD, and stroke. Replacing desserts, refined grains, and French fries by 0.5 servings/day with the equivalent of 0.5 servings of nuts per day has demonstrated similar inverse association with risks of major cardiovascular events (Figure S1).
The inverse associations of changes in nut consumption and CVD risk were consistent across subgroups stratified by age and 4‐year changes in diet, lifestyle factors, and body weight (Table S2). Among participants who were ever smokers, nut consumption was associated with significant lower risk of stroke (RR, 0.81; 95% CI, 0.73–0.88; P for interaction=0.008). In sensitivity analyses of further adjustment for 4‐year change in body weight, increasing total consumption of nuts by 0.5 servings/day remained associated with a lower risk of CVD (RR, 0.92; 95% CI, 0.88–0.96), CHD (RR, 0.94; 95% CI, 0.89–0.99), and stroke (RR, 0.89; 95% CI, 0.83–0.95). When we further censored participants with incident diabetes mellitus during follow‐up period, the RRs were 0.91 for CVD (95% CI, 0.87–0.95), 0.93 for CHD (95% CI, 0.88–0.98), and 0.88 for stroke (95% CI, 0.82–0.94).
Discussion
Compared with participants who made no changes to their nut intake, participants who increased their total nut consumption had a lower risk of CVD, CHD, and stroke in 3 prospective cohorts of US men and women followed for up to 26 years. Consistent inverse associations with the risk of CVD were observed with increases in the consumption of tree nuts, walnuts, and peanuts. We found that a relatively large increment in nut consumption (from 0 to ≥0.5 servings/day) was associated with lower CVD risk when compared with consistent nonconsumers. Indeed, a consistent higher nut consumption (≥0.5 servings/day) was associated with even lower risks of CVD, CHD, and stroke, suggesting that long‐term higher intake may play an important role in the prevention of CVD. These results support, among nonconsumers, relatively rapid changes in risk of CVD, CHD, and stroke after a large increase in nut consumption.
Results from the present study are in line with previous observational cohort findings.6, 21, 22 In a dose‐response meta‐analysis of 12 prospective studies, each 1‐serving/day increment in nut consumption was associated with lower risk of CVD (RR, 0.79; 95% CI, 0.70–0.88) and CHD (RR, 0.71; 95% CI, 0.63–0.80).6 In another dose‐response meta‐analysis including 5 prospective cohorts and 1 randomized clinical trial, consumption of 4 servings of nuts per week (0.6 servings/day) was associated with a 24% (RR, 0.76; 95% CI, 0.69–0.84) lower risk of fatal ischemic heart disease.23 The magnitude of inverse associations with CVD risk was similar between specific types of nuts. Our findings provide further support for previous epidemiological findings.
We observed that an increase in total nut consumption and consumption of walnuts by ≥0.5 servings/day was inversely associated with risk for stroke, and consumption of other types of nuts was also inversely associated with risk for stroke, but these associations were not statistically significant. Evidence for an association of nut consumption, especially individual types of nuts, with risk of stroke is inconsistent. Two prospective cohorts, the SMHS (Shanghai Men's Health Study)24 and the NLCS (Netherlands Cohort Study)25 reported inverse associations between peanut consumption and risk for stroke. In the PREDIMED study, participants who consumed 30 g of mixed nuts per day (including 15 g of walnuts) had a significant lower risk of stroke compared with those who were in the control group.26 In a meta‐analysis including 11 prospective cohorts, intake of nuts was not significantly associated with stroke risk (for 1 serving/day: RR, 0.93; 95% CI, 0.83–1.05).6 There was evidence of a nonlinear J‐shaped relationship between nut intake and stroke risk, with the most reduction in stroke risk observed at intakes up to 10 to 15 g/day (0.5 servings/day) and a slightly positive association with an intake of 30 g/day.6 Further research on the dose‐response association between nut consumption and stroke risk is warranted.
Cardiovascular and metabolic benefits of nut consumption have been supported by several lines of evidence. Nuts contain many healthful components, including unsaturated fatty acids, proteins, fiber, phytochemicals, antioxidant compounds, vitamins and minerals, and other bioactive compounds.2 The mechanisms underlying the cardioprotective effects of nut consumption may be related to their benefits that have been observed on blood lipids, endothelium function,27 systemic inflammation, oxidative stress, and insulin sensitivity.28, 29, 30, 31 In a pooled analysis of 25 controlled trials, daily nut consumption reduced total cholesterol concentration and low‐density lipoprotein cholesterol concentration by 10.9 and 10.2 mg/dL, respectively; nut consumption also reduced triglycerides in subjects with higher baseline levels (>150 mg/dL).32 A relatively large clinical trial (n=305) demonstrated a blood pressure–lowering effect of daily consumption of walnuts (30–60 g/d, depending on energy requirements) in elderly individuals,33 which may partially explain the lower risk of stroke associated with walnut consumption reported herein. The potential mechanisms through which nuts may exert their health benefits also include improvements in circulating metabolites (eg, by reducing branch chain amino acid and acylcarnitines) and modifying the gut microbiome.34, 35, 36
Despite the relatively high energy density, intake of nuts was actually associated with less weight gain, lower risk of obesity, and lower risk of moderate weight gain in prospective studies.37, 38 Our results remained significant after we accounted for change in energy intake and weight that may accompany increases in nut consumption. Nuts are rich in fiber, which requires increased efforts and/or time of mastication, which can lead to a decreased rate of ingestion.39 The high fiber content of nuts also can delay gastric emptying,39 increase satiety,5, 40 suppress hunger, and promote fullness.41 The deficit of metabolizable energy (>20%) with nut consumption (ie, almonds, walnuts) leads to inefficient energy absorption and increases in fecal fat excretion.5 Of note, although peanut butter shares a similar nutrient profile with peanuts, the absence of effort in oral processing and other additives in peanut butter, such as sugar, may reduce its beneficial effects on cardiometabolic health.
In our analysis, increasing nuts while decreasing red meat or processed meats was associated with a significantly lower risk of both CHD and stroke. Furthermore, there may also be benefits of incorporating nuts in place of animal sources of protein (meats or other associated foods) with an impact beyond human health. Given the urgent need for a transforming global food system to provide health and environmental sustainability, experts recommend a global reduction in the consumption of animal‐based foods and a doubling of the consumption of nuts and seeds.42 Nuts are among the most environmentally sustainable foods to grow with the least carbon footprint.43, 44, 45 Incorporating environmental‐friendly plant‐based protein at the expense of animal source protein that with high demands for agricultural resources could potentially improve the sustainability of our food system and reduce the public health burden through their cardioprotective effects.
The prospective design of the study, the long duration of follow‐up, the high follow‐up rate, the large sample size, and the repeated measures of dietary and lifestyle variables are strengths of the present study. Because of the large sample size and long follow‐up period, we have the unique opportunity to investigate not only change in total consumption of nuts, but also intake of individual types of nuts. The repeated, validated measures of diet allowed assessment of within‐person changes in dietary intake, reducing the possibility of reverse causation.46 Last, analyses on substitutional associations provided direct estimate of disease associations for replacing less healthful food items with nuts. We also acknowledge several limitations. First, because nut consumption and other lifestyle factors were self‐reported, measurement errors are inevitable. The use of repeated measurements reduced random measurement errors caused by within‐person variation and accommodated dietary changes over time. In addition, the errors are independent from the CVD case ascertainment and thus nondifferential and may be more likely to bias the association toward the null. In our study, information on how nuts were prepared was unspecified, and, thus, we were unable to examine the influence of preparation methods of nuts on risk of major cardiovascular events. The participants from our cohorts are health professionals, and most are whites, which may help reduce confounding by socioeconomic status, although such a relatively homogeneous socioeconomic/ethnic composition may also limit the generalization of our results. However, we do not expect the mechanisms to be different in other populations.
Conclusions
In conclusion, our results indicate that increasing total consumption of nuts and specific types of nuts (eg, tree nuts, walnuts, and peanuts) in 3 US prospective cohorts is associated with a lower risk of CVD. Our analysis provides further evidence that incorporating nuts into diet is beneficial for CVD risk, even among those who previously did not consume nuts. Our findings support the recommendation on including a variety of nuts as part of healthy dietary patterns is cardioprotective and provide theoretical evidence that replacing animal‐based protein with plant‐based protein can be helpful in the prevention of CVD.
Sources of Funding
This study was supported by research grants UM1 CA186107, UM1 CA176726, UM1 CA167552, HL035464, HL034594, HL088521, HL145386, and DK120870 from the National Institutes of Health. Dr Liu received other research support from The Peanut Institution. Dr Li was partly funded by the California Walnut Commission. Dr Drouin‐Chartier is being supported by a Banting Postdoctoral Fellowship from the Canadian Institutes of Health Research (BPF‐156628). Dr Guasch‐Ferré is supported by the American Diabetes Association grant 1‐18‐PMF‐029. The funders have no roles in study design, data collection and interpretation, and decision on manuscript publication.
Disclosures
Dr Drouin‐Chartier received speaker and consulting honoraria from the Dairy Farmers of Canada in 2016 and 2018, outside the submitted work. Dr Li reported receiving research support from the California Walnut Commission. Dr Liu received other research support from The Peanut Institution. The remaining authors have no disclosures to report.
Supporting information
Tables S1–S2Figure S1Tables S1 to S2Figure S1
Acknowledgments
We would like to thank the participants and staff of the NHS (Nurses’ Health Study), NHS II, and the HPFS (Health Professionals Follow‐Up Study) who contributed data for their valuable contributions.
(J Am Heart Assoc. 2020;9:e013877 DOI: 10.1161/JAHA.119.013877.)
Contributor Information
Qi Sun, Email: yanping@hsph.harvard.edu.
Yanping Li, Email: qisun@hsph.harvard.edu.
References
- 1. Global, regional, and national age‐sex specific all‐cause and cause‐specific mortality for 240 causes of death, 1990–2013: a systematic analysis for the Global Burden of Disease Study 2013. Lancet. 2015;385:117–171. [DOI] [PMC free article] [PubMed] [Google Scholar]
- 2. Ros E. Nuts and CVD. Br J Nutr. 2015;113(suppl 2):S111–S120. [DOI] [PubMed] [Google Scholar]
- 3. Mozaffarian D. Dietary and policy priorities for cardiovascular disease, diabetes, and obesity: a comprehensive review. Circulation. 2016;133:187–225. [DOI] [PMC free article] [PubMed] [Google Scholar]
- 4. de Souza RGM, Schincaglia RM, Pimentel GD, Mota JF. Nuts and human health outcomes: a systematic review. Nutrients. 2017;9:E1311. [DOI] [PMC free article] [PubMed] [Google Scholar]
- 5. Tan SY, Mattes RD. Appetitive, dietary and health effects of almonds consumed with meals or as snacks: a randomized, controlled trial. Eur J Clin Nutr. 2013;67:1205–1214. [DOI] [PMC free article] [PubMed] [Google Scholar]
- 6. Aune D, Keum N, Giovannucci E, Fadnes LT, Boffetta P, Greenwood DC, Tonstad S, Vatten LJ, Riboli E, Norat T. Nut consumption and risk of cardiovascular disease, total cancer, all‐cause and cause‐specific mortality: a systematic review and dose‐response meta‐analysis of prospective studies. BMC Med. 2016;14:207. [DOI] [PMC free article] [PubMed] [Google Scholar]
- 7. Luo C, Zhang Y, Ding Y, Shan Z, Chen S, Yu M, Hu FB, Liu L. Nut consumption and risk of type 2 diabetes, cardiovascular disease, and all‐cause mortality: a systematic review and meta‐analysis. Am J Clin Nutr. 2014;100:256–269. [DOI] [PubMed] [Google Scholar]
- 8. Estruch R, Ros E, Salas‐Salvado J, Covas MI, Corella D, Aros F, Gomez‐Gracia E, Ruiz‐Gutierrez V, Fiol M, Lapetra J, Lamuela‐Raventos RM, et al. Retraction and republication: primary prevention of cardiovascular disease with a Mediterranean diet: N Engl J Med 2013;368:1279‐90. N Engl J Med. 2018;378:2441–2442. [DOI] [PubMed] [Google Scholar]
- 9. Rehm CD, Penalvo JL, Afshin A, Mozaffarian D. Dietary intake among US adults, 1999–2012. JAMA. 2016;315:2542–2553. [DOI] [PMC free article] [PubMed] [Google Scholar]
- 10. Rimm EB, Stampfer MJ, Colditz GA, Giovannucci E, Willett WC. Effectiveness of various mailing strategies among nonrespondents in a prospective cohort study. Am J Epidemiol. 1990;131:1068–1071. [DOI] [PubMed] [Google Scholar]
- 11. Rimm EB, Giovannucci EL, Willett WC, Colditz GA, Ascherio A, Rosner B, Stampfer MJ. Prospective study of alcohol consumption and risk of coronary disease in men. Lancet. 1991;338:464–468. [DOI] [PubMed] [Google Scholar]
- 12. Rose GA, Blackburn H, Gillum RF, Prineas RJ. Cardiovascular survey methods. Monogr Ser World Health Organ. 1982;56:178. [PubMed] [Google Scholar]
- 13. Stampfer MJ, Willett WC, Speizer FE, Dysert DC, Lipnick R, Rosner B, Hennekens CH. Test of the national death index. Am J Epidemiol. 1984;119:837–839. [DOI] [PubMed] [Google Scholar]
- 14. Willett WC, Green A, Stampfer MJ, Speizer FE, Colditz GA, Rosner B, Monson RR, Stason W, Hennekens CH. Relative and absolute excess risks of coronary heart disease among women who smoke cigarettes. N Engl J Med. 1987;317:1303–1309. [DOI] [PubMed] [Google Scholar]
- 15. Rimm EB, Giovannucci EL, Stampfer MJ, Colditz GA, Litin LB, Willett WC. Reproducibility and validity of an expanded self‐administered semiquantitative food frequency questionnaire among male health professionals. Am J Epidemiol. 1992;135:1114–1126. [DOI] [PubMed] [Google Scholar]
- 16. Willett WC. Nutritional Epidemiology. 3rd ed New York, NY: Oxford University Press; 2012. [Google Scholar]
- 17. Willett WC, Sampson L, Stampfer MJ, Rosner B, Bain C, Witschi J, Hennekens CH, Speizer FE. Reproducibility and validity of a semiquantitative food frequency questionnaire. Am J Epidemiol. 1985;122:51–65. [DOI] [PubMed] [Google Scholar]
- 18. Salvini S, Hunter DJ, Sampson L, Stampfer MJ, Colditz GA, Rosner B, Willett WC. Food‐based validation of a dietary questionnaire: the effects of week‐to‐week variation in food consumption. Int J Epidemiol. 1989;18:858–867. [DOI] [PubMed] [Google Scholar]
- 19. Ros E, Tapsell LC, Sabate J. Nuts and berries for heart health. Curr Atheroscler Rep. 2010;12:397–406. [DOI] [PubMed] [Google Scholar]
- 20. Mozaffarian D, Hao T, Rimm EB, Willett WC, Hu FB. Changes in diet and lifestyle and long‐term weight gain in women and men. N Engl J Med. 2011;364:2392–2404. [DOI] [PMC free article] [PubMed] [Google Scholar]
- 21. Guasch‐Ferre M, Liu X, Malik VS, Sun Q, Willett WC, Manson JE, Rexrode KM, Li Y, Hu FB, Bhupathiraju SN. Nut consumption and risk of cardiovascular disease. J Am Coll Cardiol. 2017;70:2519–2532. [DOI] [PMC free article] [PubMed] [Google Scholar]
- 22. Bao Y, Han J, Hu FB, Giovannucci EL, Stampfer MJ, Willett WC, Fuchs CS. Association of nut consumption with total and cause‐specific mortality. N Engl J Med. 2013;369:2001–2011. [DOI] [PMC free article] [PubMed] [Google Scholar]
- 23. Afshin A, Micha R, Khatibzadeh S, Mozaffarian D. Consumption of nuts and legumes and risk of incident ischemic heart disease, stroke, and diabetes: a systematic review and meta‐analysis. Am J Clin Nutr. 2014;100:278–288. [DOI] [PMC free article] [PubMed] [Google Scholar]
- 24. Luu HN, Blot WJ, Xiang YB, Cai H, Hargreaves MK, Li H, Yang G, Signorello L, Gao YT, Zheng W, et al. Prospective evaluation of the association of nut/peanut consumption with total and cause‐specific mortality. JAMA Intern Med. 2015;175:755–766. [DOI] [PMC free article] [PubMed] [Google Scholar]
- 25. van den Brandt PA, Schouten LJ. Relationship of tree nut, peanut and peanut butter intake with total and cause‐specific mortality: a cohort study and meta‐analysis. Int J Epidemiol. 2015;44:1038–1049. [DOI] [PubMed] [Google Scholar]
- 26. Estruch R, Ros E, Salas‐Salvado J, Covas MI, Corella D, Aros F, Gomez‐Gracia E, Ruiz‐Gutierrez V, Fiol M, Lapetra J, et al. Primary prevention of cardiovascular disease with a Mediterranean diet supplemented with extra‐virgin olive oil or nuts. N Engl J Med. 2018;378:e34. [DOI] [PubMed] [Google Scholar]
- 27. Xiao Y, Huang W, Peng C, Zhang J, Wong C, Kim JH, Yeoh EK, Su X. Effect of nut consumption on vascular endothelial function: a systematic review and meta‐analysis of randomized controlled trials. Clin Nutr. 2018;37:831–839. [DOI] [PubMed] [Google Scholar]
- 28. Sauder KA, McCrea CE, Ulbrecht JS, Kris‐Etherton PM, West SG. Effects of pistachios on the lipid/lipoprotein profile, glycemic control, inflammation, and endothelial function in type 2 diabetes: a randomized trial. Metabolism. 2015;64:1521–1529. [DOI] [PMC free article] [PubMed] [Google Scholar]
- 29. Kim Y, Keogh JB, Clifton PM. Benefits of nut consumption on insulin resistance and cardiovascular risk factors: multiple potential mechanisms of actions. Nutrients. 2017;9:E1271. [DOI] [PMC free article] [PubMed] [Google Scholar]
- 30. Guasch‐Ferre M, Li J, Hu FB, Salas‐Salvado J, Tobias DK. Effects of walnut consumption on blood lipids and other cardiovascular risk factors: an updated meta‐analysis and systematic review of controlled trials. Am J Clin Nutr. 2018;108:174–187. [DOI] [PMC free article] [PubMed] [Google Scholar]
- 31. Del Gobbo LC, Falk MC, Feldman R, Lewis K, Mozaffarian D. Effects of tree nuts on blood lipids, apolipoproteins, and blood pressure: systematic review, meta‐analysis, and dose‐response of 61 controlled intervention trials. Am J Clin Nutr. 2015;102:1347–1356. [DOI] [PMC free article] [PubMed] [Google Scholar]
- 32. Sabate J, Oda K, Ros E. Nut consumption and blood lipid levels: a pooled analysis of 25 intervention trials. Arch Intern Med. 2010;170:821–827. [DOI] [PubMed] [Google Scholar]
- 33. Domenech M, Serra‐Mir M, Roth I, Freitas‐Simoes T, Valls‐Pedret C, Cofan M, Lopez A, Sala‐Vila A, Calvo C, Rajaram S, et al. Effect of a walnut diet on office and 24‐hour ambulatory blood pressure in elderly individuals. Hypertension. 2019;73:1049–1057. [DOI] [PMC free article] [PubMed] [Google Scholar]
- 34. Mora‐Cubillos X, Tulipani S, Garcia‐Aloy M, Bullo M, Tinahones FJ, Andres‐Lacueva C. Plasma metabolomic biomarkers of mixed nuts exposure inversely correlate with severity of metabolic syndrome. Mol Nutr Food Res. 2015;59:2480–2490. [DOI] [PubMed] [Google Scholar]
- 35. Lamuel‐Raventos RM, Onge MS. Prebiotic nut compounds and human microbiota. Crit Rev Food Sci Nutr. 2017;57:3154–3163. [DOI] [PMC free article] [PubMed] [Google Scholar]
- 36. Freisling H, Noh H, Slimani N, Chajes V, May AM, Peeters PH, Weiderpass E, Cross AJ, Skeie G, Jenab M, et al. Nut intake and 5‐year changes in body weight and obesity risk in adults: results from the EPIC‐PANACEA study. Eur J Nutr. 2018;57:2399–2408. [DOI] [PubMed] [Google Scholar]
- 37. Bes‐Rastrollo M, Sabate J, Gomez‐Gracia E, Alonso A, Martinez JA, Martinez‐Gonzalez MA. Nut consumption and weight gain in a Mediterranean cohort: the SUN study. Obesity (Silver Spring). 2007;15:107–116. [DOI] [PubMed] [Google Scholar]
- 38. Bes‐Rastrollo M, Wedick NM, Martinez‐Gonzalez MA, Li TY, Sampson L, Hu FB. Prospective study of nut consumption, long‐term weight change, and obesity risk in women. Am J Clin Nutr. 2009;89:1913–1919. [DOI] [PMC free article] [PubMed] [Google Scholar]
- 39. Slavin JL. Dietary fiber and body weight. Nutrition. 2005;21:411–418. [DOI] [PubMed] [Google Scholar]
- 40. Zaveri S, Drummond S. The effect of including a conventional snack (cereal bar) and a nonconventional snack (almonds) on hunger, eating frequency, dietary intake and body weight. J Hum Nutr Diet. 2009;22:461–468. [DOI] [PubMed] [Google Scholar]
- 41. Kirkmeyer SV, Mattes RD. Effects of food attributes on hunger and food intake. Int J Obes Relat Metab Disord. 2000;24:1167–1175. [DOI] [PubMed] [Google Scholar]
- 42. Willett W, Rockstrom J, Loken B, Springmann M, Lang T, Vermeulen S, Garnett T, Tilman D, DeClerck F, Wood A, et al. Food in the anthropocene: the EAT‐Lancet Commission on healthy diets from sustainable food systems. Lancet. 2019;393:447–492. [DOI] [PubMed] [Google Scholar]
- 43. Eshel G, Shepon A, Makov T, Milo R. Land, irrigation water, greenhouse gas, and reactive nitrogen burdens of meat, eggs, and dairy production in the United States. Proc Natl Acad Sci USA. 2014;111:11996–12001. [DOI] [PMC free article] [PubMed] [Google Scholar]
- 44. Pimentel D, Pimentel M. Sustainability of meat‐based and plant‐based diets and the environment. Am J Clin Nutr. 2003;78:660S–663S. [DOI] [PubMed] [Google Scholar]
- 45. Tilman D, Clark M. Global diets link environmental sustainability and human health. Nature. 2014;515:518–522. [DOI] [PubMed] [Google Scholar]
- 46. Smith JD, Hou T, Hu FB, Rimm EB, Spiegelman D, Willett WC, Mozaffarian D. A comparison of different methods for evaluating diet, physical activity, and long‐term weight gain in 3 prospective cohort studies. J Nutr. 2015;145:2527–2534. [DOI] [PMC free article] [PubMed] [Google Scholar]
Associated Data
This section collects any data citations, data availability statements, or supplementary materials included in this article.
Supplementary Materials
Tables S1–S2Figure S1Tables S1 to S2Figure S1