

Abstract
Background
Renal artery stenosis is a common cause of renal ischemia, contributing to the development of chronic kidney disease. To investigate the role of local CD40 expression in renal artery stenosis, Goldblatt 2‐kidney 1‐clip surgery was performed on hypertensive Dahl salt‐sensitive rats (S rats) and genetically modified S rats in which CD40 function is abolished (Cd40 mutant).
Methods and Results
Four weeks following the 2‐kidney 1‐clip procedure, Cd40 mutant rats demonstrated significantly reduced blood pressure and renal fibrosis in the ischemic kidneys compared with S rat controls. Similarly, disruption of Cd40 resulted in reduced 24‐hour urinary protein excretion in Cd40 mutant rats versus S rat controls (46.2±1.9 versus 118.4±5.3 mg/24 h; P<0.01), as well as protection from oxidative stress, as indicated by increased paraoxonase activity in Cd40 mutant rats versus S rat controls (P<0.01). Ischemic kidneys from Cd40 mutant rats demonstrated a significant decrease in gene expression of the profibrotic mediator, plasminogen activator inhibitor‐1 (P<0.05), and the proinflammatory mediators, C‐C motif chemokine ligand 19 (P<0.01), C‐X‐C Motif Chemokine Ligand 9 (P<0.01), and interleukin‐6 receptor (P<0.001), compared with S rat ischemic kidneys, as assessed by quantitative PCR assay. Reciprocal renal transplantation documented that CD40 exclusively expressed in the kidney contributes to ischemia‐induced renal fibrosis. Furthermore, human CD40‐knockout proximal tubule epithelial cells suggested that suppression of CD40 signaling significantly inhibited expression of proinflammatory and ‐fibrotic genes.
Conclusions
Taken together, our data suggest that activation of CD40 induces a significant proinflammatory and ‐fibrotic response and represents an attractive therapeutic target for treatment of ischemic renal disease.
Keywords: CD40, renal fibrosis, renal ischemia
Subject Categories: Fibrosis, Ischemia, Nephrology and Kidney
Clinical Perspective
What Is New?
Activation of CD40 receptor significantly contributes to development of renal fibrosis in experimental renal ischemia, and disruption of CD40 attenuates renal injury and oxidant stress in this setting.
Activation of CD40 induces gene expression involved in inflammation and fibrosis in renal proximal tubule epithelial cells, and CD40 activation contributes to proinflammatory and ‐fibrotic responses.
What Are the Clinical Implications?
Although CD40 has been shown to be a prominent immune‐response mediator, the current study demonstrates that disruption of CD40 attenuates renal fibrosis induced by renal ischemia.
Kidney‐specific expression of CD40 contributes to development of renal fibrosis and impaired renal function.
CD40 expressed within the kidney may be an important therapeutic target for reducing inflammation and alleviating fibrotic responses, which contribute to development and progression of ischemic renal disease.
Nonstandard Acronyms and Abbreviations.
2K1C 2‐kidney 1‐clip
BP blood pressure
CKD chronic kidney disease
GFR glomerular filtration rate
PCR polymerase chain reaction
RAS renal artery stenosis
sCD40L soluble CD40 ligand
TBARS thiobarbituric acid reactive substances
UPE urinary protein excretion
Introduction
Renal artery stenosis (RAS) is common in patients with peripheral and coronary artery disease, which significantly contributes to uncontrolled hypertension in up to 3 million patients in the United States.1, 2, 3, 4 More than 50% of patients with RAS have complications with concomitant renal dysfunction.5 Although clinical evidence and experimental models of RAS indicate that multifactorial elements, including infiltration of inflammatory cells and release of cytokines and growth factors, are involved in the disease process,6, 7, 8 the exact mechanisms leading to renal dysfunction and renal fibrosis remain to be elucidated.
The type‐1 transmembrane receptor, CD40, is a member of the TNF (tumor necrosis factor) receptor superfamily. CD40 receptors are expressed in various cell types, including renal proximal tubule epithelial cells, wherein their activation by soluble CD40 ligand (sCD40L) stimulates proinflammatory and ‐fibrotic signaling.9, 10, 11, 12 Although CD40/CD40L signaling has been investigated extensively for its integral role in adaptive immunity and inflammation,10 our work suggests that local kidney CD40 expression is an important mediator of both chronic and ischemic renal disease.13, 14, 15, 16 We also previously reported that higher baseline levels of circulating CD40 (sCD40) were associated with an improved renal function, as measured by an estimated glomerular filtration rate (GFR) at 1 year follow‐up in patients with RAS.14, 15 In contrast, high circulating levels of CD40L (sCD40L) with low levels of sCD40 receptor predicted a significant decline of estimated GFR at 1‐year follow‐up in a chronic kidney disease (CKD) cohort.16 The association of sCD40 and sCD40L levels with renal function suggests an antagonistic effect of sCD40 against sCD40L. In this setting, the local kidney CD40 signaling regulated by sCD40L levels may represent a novel mechanism, contributing to the development of renal injury. Based on both experimental and clinical evidence implicating kidney CD40 in the development of renal disease, we have recently created a novel Cd40 mutant rat model (Cd40 mutant) on the background of the Dahl salt‐sensitive (S/Jr or S) rat prone to development of hypertensive renal disease in which Cd40 receptor function is absent.13 Cd40 mutant rats demonstrate a significant improvement in renal function and significantly reduced renal fibrosis compared with hypertensive S rats on both low‐ and high‐salt diet.13
We subjected Cd40 mutant rats and S rats to the Goldblatt 2‐kidney 1‐clip (2K1C) model of renal ischemia to test the hypothesis that CD40 significantly contributes to the development of renal fibrosis in ischemic renal disease. Furthermore, we created a CD40‐knockout cell line in human proximal tubular epithelial cells to investigate proximal tubule‐specific CD40 proinflammatory and ‐fibrotic signaling. Our results suggest that local CD40 signaling is responsible for fibrosis in kidneys and therefore represents an attractive therapeutic target for treatment of RAS.
Methods
The data that support the findings of this study are available from the corresponding author upon reasonable request.
Animals
Male Cd40 mutant rats were generated on the background of the Dahl salt‐sensitive (S/Jr or S) rat strain as described.13 Age‐matched male S rats (n=8 type 2K1C, n=8 sham) and Cd40 mutant rats (n=8 type 2K1C, n=8 sham) were subject to 2K1C (2‐kidney 1‐clip) surgery at 8 weeks of age and investigated for 4 weeks. The 2K1C surgery was performed under isoflurane anesthesia as described.17 Briefly, a small incision was made in the left flank, through which the left kidney was exposed. A U‐shaped stainless‐steel surgical clip with an internal diameter of 0.2 mm was placed around the left renal artery. The kidney was placed back into the abdominal cavity, and the surgical wound was closed with nylon sutures. Sham surgery was performed identically without placement of the clip. All animal experimentation described in this article was conducted in accordance with the National Institutes of Health Guide for the Care and Use of Laboratory Animals under protocols approved by the University of Toledo Institutional Animal Care and Use Committee.
Urinary Protein Excretion
During the fourth week post‐2K1C surgery, 24‐hour urinary protein excretion (UPE) was performed as previously described.13, 18
Glomerular Filtration Rate
Estimation of GFR was performed after UPE collection as described as follows19: FITC‐sinistrin (Fresenius Kabi Austria GmbH, Graz, Austria) was injected intravenously at the dose of 5 mg per 100 g of body weight by the tail vein, and a transdermal probe was fixed on the back of the rat using a sticky tape to record the transcutaneous signal of FITC for 2 hours, followed by analysis of the excretion kinetic curve using the following equation:
Blood Pressure Measurements
Systolic blood pressure (BP) and diastolic BP measurements were obtained on rats at the end of 4 weeks post‐2K1C surgery (following urine collection for UPE) by radiotelemetry as previously reported.20 Both S rats and Cd40 mutant rats were surgically implanted with C40 radiotelemetry transmitters, such that the body of the transmitter was placed into the left flanks and the probe was inserted into the femoral arteries all the way into the lower abdominal aortae.13, 20 Rats were allowed to recover from surgery for 3 days and BP was monitored continuously for 72 hours, and pulse pressure was calculated by the differences between systolic BP and diastolic BP at each time point, after which animals were euthanized after measuring BP and total body weights and organ weights were collected.
Histology
Kidney sections were immediately fixed in 4% formalin buffer solution (pH 7.2) for 18 hours, dehydrated in 70% ethanol, embedded in paraffin, and then cut into 5‐micron sections. CD3 antibody was purchased from Abcam (1:150 dilution; ab16669; Abcam Biotechnology, Cambridge, UK), and the Vestastain Elite‐ABC kit (PK‐6101; Vector Laboratories, Burlingame, CA) was used according to the manufacturer's protocol. Severity of CD3 staining was examined by giving a score from 0 to 3 based on appearance. Masson's trichrome staining was performed on kidney tissues for evaluation of fibrosis. Images (10×) were obtained using an Olympus VS120 virtual slide scanning microscope (Olympus, Tokyo, Japan). Quantitative morphometric analysis was performed on images, and collagen volume was determined using automated and customized algorithms for batch analysis (ImageIQ Inc., Cleveland, OH), written for Image Pro Plus 7.0, as we have described.21 Hematoxylin and eosin staining was utilized for semiquantitative morphometric analysis of renal injury. Lesion scoring strategies were adapted from the Banff Classification of Allograft Pathology.22 Specifically, percent inflammation and hyaline cast severity was determined by dividing the whole kidney into equal‐sized grid sections. Each grid section was then checked for inflammation, and those positive for inflammation would be given a score of 1 whereas grids without inflammation were given a 0. Total score of all grid sections for a kidney was divided by the number of total grid sections analyzed, and this was reported as a percentage representative of the whole‐kidney image. Hyaline cast severity was examined by giving each grid section a score from 0 to 3 based on the appearance and number of casts. Glomerular proliferation was scored as the number of glomerular halves with ≥3 instances of ≥3 overlapping nuclei. By this method, 20 glomeruli were scored from each kidney section and averaged. All images of whole‐kidney sections were generated at 20× magnification on a VS120 virtual slide microscope (Olympus).
Real‐Time Quantitative Polymerase Chain Reaction
Total RNA was purified from frozen renal cortex tissue or cell line samples using the RNeasy plus mini kit (Qiagen, Hilden, Germany). RNA quantification was performed using spectrophotometry (NanoDrop Technologies, Wilmington, DE). Five hundred nanograms of total RNA was reversed transcribed into cDNA using the RT2 First Strand kit (Qiagen), and gene expression was quantified by performing real‐time polymerase chain reaction (PCR) amplification reactions on a Rotor gene Q PCR cycler (Qiagen). Primers for genes of rat CD40 (Rn01423583_m1), rat SERPINE1 (PAI‐1 [plasminogen activator inhibitor 1]; Rn01481341_m1), rat TBP (TATA‐box binding protein; Rn01455646_m1), rat PON1 (paraoxonase 1; Rn01455909_m1), rat PON2 (paraoxonase 2; Rn01456019_m1), rat PON3 (paraoxonase 3; Rn01500926_m1), human SERPINE1 (Hs00167155_m1), human CCL2 (C‐C motif chemokine ligand 2; MCP‐1 [monocyte chemoattractant protein 1]; Hs00234140_m1), human CD40 (Hs00374176_m1), and eukaryotic 18s rRNA endogenous control (Hs99999901_s1) were purchased from ThermoFisherScientific company (Waltham, MA). Gene expression of animals subjected to the 2K1C procedure was normalized to their respective sham group, and gene expression of the CD40 knockout cell line was normalized to the HK2 control.
Tissue Plasminogen Activator Activity Assay
The tPA (tissue plasminogen activator) activity assay kit was purchased from BioVision (Cat. # K178‐100; BioVision Incorporated, San Francisco, CA). To perform the assay, 100 mg of renal cortex tissue was cut from sham and 2K1C animals (both contralateral and ischemic kidney) and homogenized using tPA assay buffer. Samples was then centrifuged at 12 000g for 10 minutes at 4°C, and supernatant was collected and assayed for tPA activity according to the manufacturer's protocol.
Creation of Human CD40‐Knockout Proximal Tubule Epithelial Cell Line and sCD40L Treatment
Human proximal tubule epithelial cells (HK2; CRL‐2190; ATCC, Manassas, VA) were transfected with a CRISPR (clusters of regularly interspaced short palindromic repeat)/Cas9 (CRISPR‐associated protein‐9) vector (sc‐40024; Santa Cruz Biotechnology, Santa Cruz, CA) to knock out the human Cd40 gene. Vector‐expression cells were sorted by monitoring GFP (green fluorescent protein) signaling using flow cytometry. Up to 3000 GFP‐positive cells were cultured and expanded to certain confluency, and CD40 expression was examined with western blot and reverse‐transcription PCR. Both wild‐type HK2 cells and CD40‐knockout cells (HK2‐CD40KO) were treated with/without sCD40L (100 ng/mL; Cat. # ALX‐522‐110‐C010; Enzo Life Sciences Inc, Ann Arbor, MI) for 24 hours at a concentration we have previously shown to stimulate CD40 signaling.23 In addition, cells were treated with TNF‐α (tumor necrosis factor alpha; 10 ng/mL; Cat. # 300‐01A; PeproTech Inc, Rocky Hill, NJ) for 24 hours as a positive control for triggering inflammatory responses.24 After 24 hours, cells were washed with 2 mL of PBS twice, and cell lysate was collected for testing gene expression.
Western Blot Analysis
For cultured cell lines, cells were lysed using ice‐cold radioimmunoprecipitation assay lysis buffer (pH 7.0; sc‐24948; Santa Cruz Biotechnology), followed by 30 seconds of vertexing and 20 minutes of shaking at 4°C. The cell homogenate was centrifuged at 14 000g for 15 minutes at 4°C. The supernatant was separated for protein quantification, and a total of 45 ug of protein was used for detection of CD40 (1:1000 dilution; ab13545; Abcam). Glyceraldehyde 3‐phosphate dehydrogenase (1:2000 dilution; antibody sc‐25778; Santa Cruz Biotechnology) was used as a loading control. Proteins were resolved by SDS‐PAGE. Following gel electrophoresis, proteins were electrotransferred from the gel onto nitrocellulose membranes (0.45 μm of PVDF transfer membrane; ThermoFisherScientific). Then, the membrane was blocked with 5% nonfat dry milk in TBST (1× Tris buffer saline and 0.1% Tween‐20). Images were obtained using the Syngene Western Blot Imager G: BOX (Syngene, Cambridge, UK) and analyzed by ImageJ software (NIH, Bethesda, MD).
Inflammatory Response and Autoimmunity Array and Fibrosis Array
Inflammatory response, autoimmunity, and fibrosis arrays for both rat (PARN‐077ZR and PARN‐120ZR) and human (PAHS‐077ZR and PAHS‐120ZR) samples were purchased from Qiagen. To perform the gene array, kidney samples from sham and 2K1C animals (ischemic kidney) were homogenized for RNA extraction and used for quantitative PCR analysis as we mentioned above. To reduce interindividual biological variability, samples were pooled from 8 samples per group as reported.25 For the human arrays, HK2 and HK2‐CD40KO cell lines treated with/without sCD40L (100 ng/mL) were homogenized for RNA extraction and subsequently used for quantitative PCR analysis.
Kidney Transplantation
A proof‐of‐concept kidney transplant study (n=3 per group) was performed in 10‐week‐old male Cd40 mutant rats and S rats as described as follows26: The donor operation is a nonsurvival surgery. An anesthetized donor is injected with heparin (20 units), and abdominal walls are cleaned with iodine 3 times and opened by a midline incision. The left kidney artery with a portion of the aorta and renal vein are isolated from surrounding tissues; the remaining blood vessels are tied off. The aorta is tied off above the kidney artery, and the kidney is perfused by injecting saline below the artery. The distal aorta with renal artery and renal vein are cut; the kidney ureter is separated from surrounding tissue and cut along with a portion of connected bladder. The freed kidney is kept in saline on ice. The anesthetized recipient is opened by a midline incision, and the left kidney with kidney artery and kidney vein are freed from surrounding tissues. The artery is tied off while a miniclamp is in place on the kidney vein; 2 major blood vessels (aorta and vena cava) are cleaned off from tissues. Incisions are made in the recipient aorta and kidney vein to perform anastomosis with the donor kidney aorta (end‐to‐side) and the donor kidney vein (end‐to‐end), respectively. The fragment of bladder with kidney ureter is connected to the recipient's bladder using a 10‐0 suture. Anastomoses are made by 10‐0 sutures run continuously. The abdomen is closed by 4‐0 sutures (nylon) in 2 layers. After a 4‐week recovery period, kidney transplant recipients were subject to the 2K1C procedure for 4 weeks as described above.
Paraoxonase Activity Measurement
Circulating paraoxonase lactonase activity was measured in plasma samples based on a fluorometric assay (Cat. # K999‐100; BioVision Incorporated). Paraoxonase lactonase activity was calculated as the hydrolytic activity of enzyme toward the fluorescent 7‐hydroxycoumarin substrate, according to the manufacturer's protocol.
Superoxide Dismutase Activity Assay
A superoxide dismutase activity assay kit was purchased from BioVision (Cat. # K335‐100; BioVision Incorporated). Plasma samples for sham and 2K1C animals were measured for superoxide dismutase activity based on the inhibition rate of production of water‐soluble tetrazolium‐1 formazan dye, and superoxide dismutase activity was calculated according to the manufacturer's protocol.
Thiobarbituric Acid Reactive Substances Assay
Thiobarbituric acid reactive substances (TBARS) were measured using a colorimetric TBARS microplate assay kit (SKU: FR40; Oxford Biomedical Research, Rochester Hills, MI). Twenty‐four‐hour urine after 2K1C surgery and proteins (50 ug) from renal cortex tissue of sham and 2K1C animal kidneys were analyzed according to the manufacturer's protocol.
Statistical Analysis
Data are presented as the mean±SEM. Data were analyzed by unpaired 2‐tailed Student t test to detect differences between 2 groups. For >2 groups, ANOVA and post hoc Tukey/Dunn's multiple comparisons tests were used and 2‐way ANOVA was used to test interactions. Repeated‐measures ANOVA were performed to test BP, heart rate, and pulse pressure. Normality was determined by performing the Shapiro–Wilk test. A P<0.05 was statistically significant. Statistical analysis was performed using GraphPad Prism software (version 7; GraphPad Software Inc., San Diego, CA).
Results
Disruption of Cd40 Demonstrates a Significant Decrease of Systolic BP Following 2K1C
There were no significant differences in body weight among S sham (391.2±7.7 g), S 2K1C (379.0±12.5 g), Cd40 mutant Sham (401.7±6.7 g), and Cd40 mutant 2K1C (402.4±9.1 g) rats 4 weeks post‐2K1C surgery (Table). Cd40 mutant sham rats also showed significantly lower kidney weight/body weight ratio (both kidneys; Table). There were no significant differences in ischemic kidney weight among S 2K1C rats and Cd40 mutant 2K1C rats. Cd40 mutant 2K1C rats demonstrated significantly lower contralateral kidney weight compared with S 2K1C rats (Table). Heart weight/body weight ratio was significantly lower in Cd40 mutant 2K1C rats compared with S 2K1C rats (Table). Three days of continuous BP monitoring indicated a significant reduction in systolic BP of Cd40 mutant rats compared with S rats (Figure 1A). There were no differences in diastolic BP as well as heart rate (Figure 1B). However, Cd40 mutant rats demonstrated significantly lower pulse pressure, compared with S rats, after surgery (Figure 1C).
Table 1.
Animal Weight and Organ Weight Following 2K1C Surgery
| Body Weight, g | HW/BW, g/kg | KW(I)/BW, g/kg | KW(C)/BW, g/kg | |
|---|---|---|---|---|
| S sham | 391.2±7.7 | 3.42±0.03 | 4.16±0.03 | 4.19±0.06 |
| Cd40 mutant sham | 401.7±6.7 | 3.40±0.03 | 3.69±0.04* | 3.73±0.04† |
| S 2K1C | 379.0±12.5 | 3.66±0.14 | 0.81±0.09 | 6.28±0.15 |
| Cd40 mutant 2K1C | 402.4±9.1 | 3.28±0.07‡ | 1.01±0.05 | 5.38±0.15§ |
Body weight (g; 2‐way ANOVA; genotype×2K1C: P=NS), heart weight/body weight ratio (HW/BW [g/kg]; 2‐way ANOVA; genotype×2K1C: P<0.05), kidney (ischemic) weight/body weight ratio (KW(I)/BW [g/kg]; 2‐way ANOVA; genotype×2K1C: P<0.0001), and kidney (contralateral) weight/body weight ratio (KW(C)/BW [g/kg]; 2‐way ANOVA; genotype×2K1C: P=NS). Data presented as mean±SEM, n=8 per group. 2K1C indicates 2‐kidney 1‐clip; and NS, not significant.
*P<0.0001 vs S sham; † P<0.01; ‡ P<0.01; § P<0.0001 vs S 2K1C.
Figure 1. Blood pressure and heart rate of animals after 2K1C (2‐kidney 1‐clip) surgery.
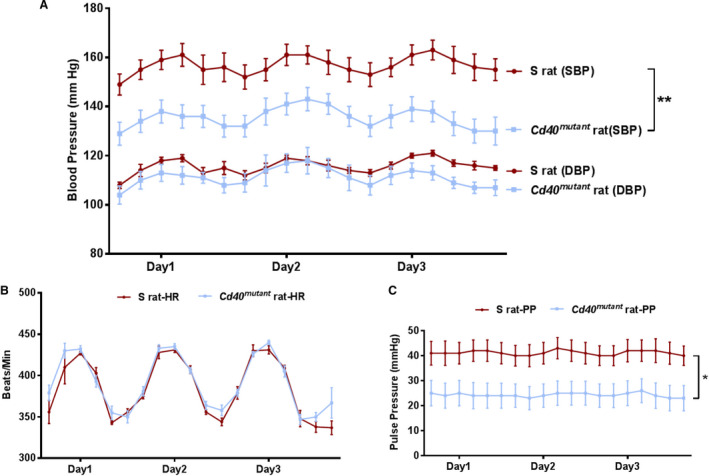
A, Systolic blood pressure (SBP) and diastolic blood pressure (DBP), (B) heart rate (HR), and (C) pulse pressure (PP) measurements of S rats and Cd40 mutant rats 4 weeks after 2K1C surgery. Data plotted are the recordings obtained every 5 minutes continuously for 24 hours and averaged for 4‐hour intervals over 3 days. Data presented as mean±SEM, n=8. *P<0.05; **P<0.01.
Disruption of Cd40 Significantly Improves UPE and Reduces Ischemia‐Induced Renal Fibrosis 4 Weeks Following 2K1C Surgery
Renal function was evaluated by GFR and 24‐hour UPE. Cd40 mutant rats demonstrated significantly lower levels of baseline UPE (58.0±7.2 versus 102.4±7.1 mg/24 h; P<0.0001) and postsurgery UPE levels (46.2±1.9 versus 118.4±5.3 mg/h; P<0.0001; Figure 2) compared with S rats. Additionally, Cd40 mutant rats demonstrated no significant differences in GFR compared with S rats following 2K1C surgery (S sham, 1.04±0.11; S 2K1C, 0.77±0.06; Cd40 mutant sham, 1.22±0.06; Cd40 mutant 2K1C, 0.86±0.04; n=8; unit, mL/min/100 g of body weight; all P=not significant, data not shown). Renal fibrosis, as measured by Masson's trichrome staining, demonstrated that clipped ischemic kidney of Cd40 mutant rats following 2K1C surgery had significantly decreased levels of whole‐kidney fibrosis (Figure S1) and renal cortex fibrosis compared with clipped ischemic kidneys in S rats (Figure 3A and 3B; P<0.001). In contrast to S rats, which developed significant fibrosis in their ischemic kidneys compared with sham kidneys (P<0.001), Cd40 mutant rats were protected from fibrosis. In addition, hematoxylin and eosin staining demonstrated that renal ischemia led to increased inflammatory cell infiltration in ischemic kidney of S rats compared with sham, whereas ischemic kidneys from Cd40 mutant rats demonstrated no differences (Figure 4A and 4C). Cd40 mutant rats also demonstrated significantly lower levels of glomerular proliferation (P<0.0001; Figure 4A, 4B, and 4D) as well as hyaline cast severity (P<0.01; Figure 4A and 4E) in ischemic kidney. We further evaluated whether inflammation in the 2K1C model was driven by T‐cell infiltration by performing immunostaining for CD3+ T cells, and there were no differences observed regarding kidney T‐cell infiltration (Figure S2A through S2C).
Figure 2. Renal function. Twenty‐four‐hour urinary protein excretion (UPE; 2‐way ANOVA; genotype×2K1C: P<0.05).
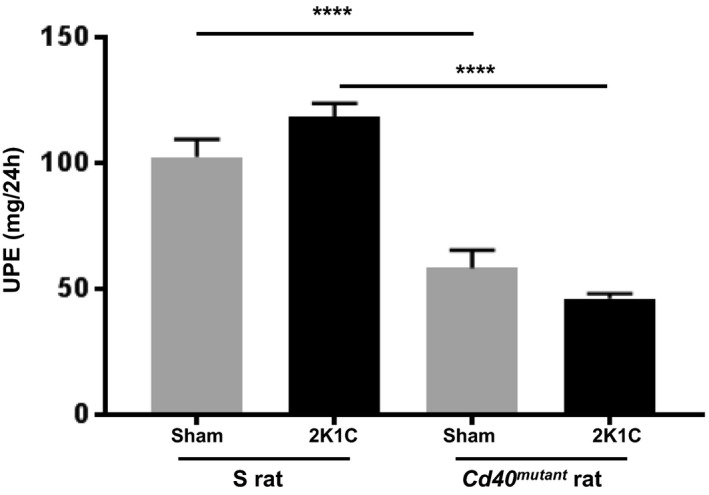
Data presented as mean±SEM, n=8 per group. ****P<0.0001. 2K1C indicates 2‐kidney 1‐clip.
Figure 3. Renal fibrosis analysis.
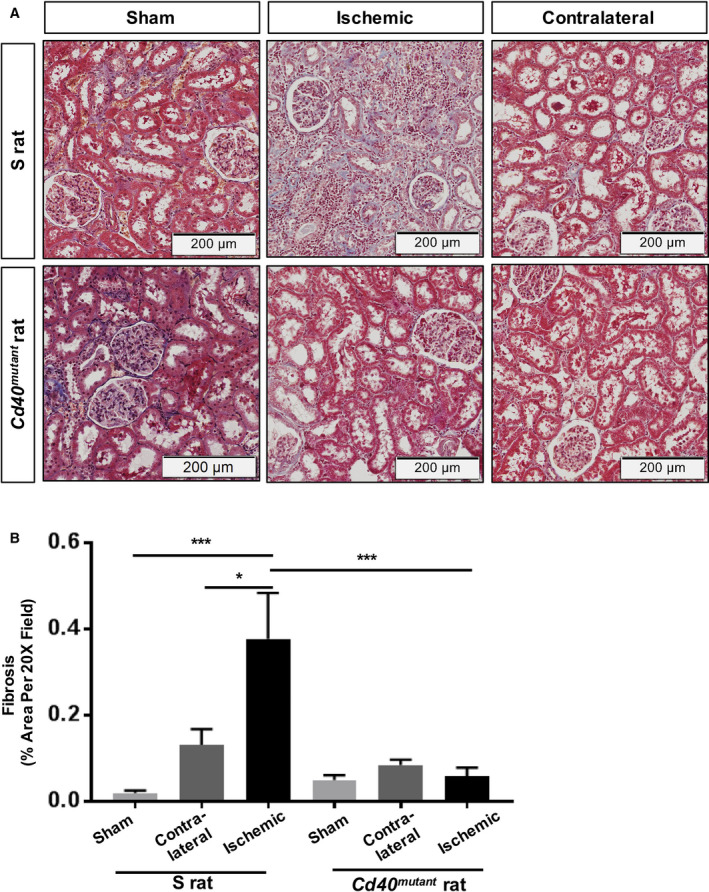
A, Representative trichrome staining figures for kidney tissue of surgery and sham S rats and Cd40 mutant rats (images at ×20 magnification) and (B) quantitative analysis of fibrosis in the kidney cortex (2‐way ANOVA; genotype×surgery: P<0.01). Data presented as mean±SEM, n=8 per group. *P<0.05; ***P<0.001.
Figure 4. Renal inflammation and lesion scores.
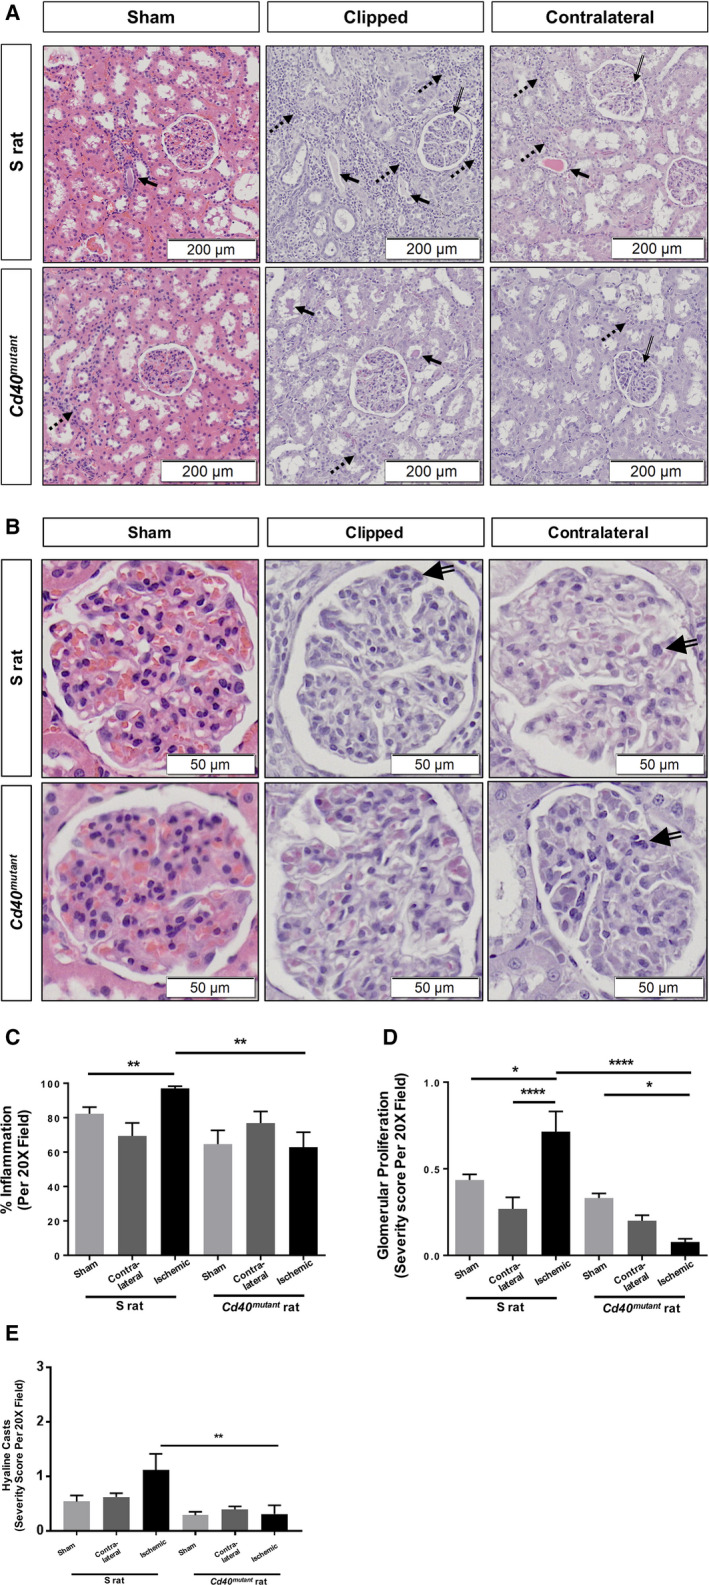
A, Representative histology of H&E‐stained kidney tissue (Images at ×20 magnification). (B) Close‐up images indicating glomerular proliferation (×40 magnification). Solid arrows, hyaline casts; broken arrows, inflammation; hollowed line arrows, glomerular proliferation. C, Renal inflammation (2‐way ANOVA; genotype×surgery: P<0.05); (D) glomerular proliferation scores (2‐way ANOVA; genotype×surgery: P<0.0001); and (E) hyaline casts scores (2‐way ANOVA; genotype×surgery: P=NS). Data presented as mean±SEM, n=8 per group. *P<0.05; **P<0.01; ****P<0.0001. H&E indicates hematoxylin and eosin; and NS, not significant.
Experimental Renal Ischemia Induces Gene Expression of CD40 and Disruption of Cd40 Significantly Reduces Gene Expression of the Profibrotic Factor, PAI‐1
Gene expression of CD40 was measured by reverse‐transcription PCR, and both contralateral and ischemic kidney demonstrated significantly increased CD40 expression in S rats, and Cd40 mutant rats showed significantly lower levels of CD40 compared with S rats (Figure 5A). The profibrotic factor, PAI‐1, has been shown to be regulated by CD40 signaling in proximal tubules in a process mediated by phosphorylation of Lyn kinase.12, 13 We measured gene expression of PAI‐1, which was significantly increased in both ischemic and contralateral kidneys of S rats, but not in Cd40 mutant rats (Figure 5B). In addition, we examined tPA activity in renal cortex tissue given that tPA is suppressed by PAI‐1 and tPA is the major plasminogen activator that alleviates renal fibrosis.27 We noted a significant increase in tPA activity in both contralateral and ischemic kidneys of Cd40 mutant rats compared with contralateral and ischemic kidneys of S rats (Figure S3).
Figure 5. Quantitative analysis of gene expression of (A) CD40 and (B) PAI‐1 in renal cortex tissue of Dahl S and Cd40 mutant rats after 2K1C surgery.
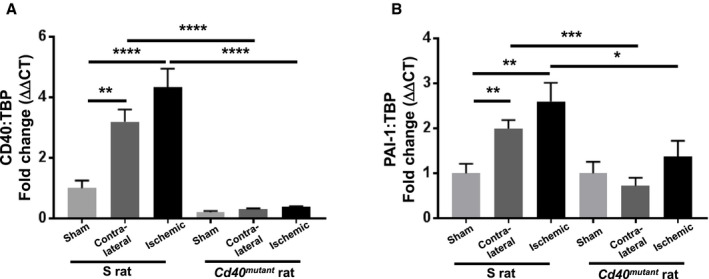
Gene expression was normalized to respective sham group (2‐way ANOVA; genotype×surgery: CD40: P<0.001; PAI‐1: P=NS). Data presented as mean±SEM, n=8 per group. *P<0.05; **P<0.01; ***P<0.001; ****P<0.0001. 2K1C indicates 2‐kidney 1‐clip; ΔΔCT, delta delta threshold cycle; NS, not significant; PAI‐1, plasminogen activator inhibitor 1; and TBP, TATA‐box binding protein.
Disruption of Cd40 Significantly Reduces Inflammatory Oxidant Stress in Experimental Renal Ischemia
To further detect alterations of genes involved in renal function and renal fibrosis in 2K1C rats, RNA was extracted from the ischemic renal cortex and gene profiler arrays were performed to compare inflammatory genes in ischemic kidneys versus sham kidneys. Gene array results indicated that 13 genes were significantly altered in ischemic kidneys of Cd40 mutant compared with S rats (Table S1, >2‐fold change). Among them, MMP8 (matrix metalloproteinase 8), Ccl19 (C‐C motif chemokine 19), Cxcl9 (C‐X‐C motif chemokine ligand 9), Il6r (interleukin‐6 receptor), and Cd40lg (CD40 ligand) were all significantly decreased in ischemic kidneys of Cd40 mutant rats compared with ischemic kidneys of S rats (Figure 6); all these genes have been previously reported to contribute to development of renal injury in several experimental models.28, 29, 30, 31, 32
Figure 6. Quantitative analysis of gene expression of profibrotic and ‐inflammatory genes.
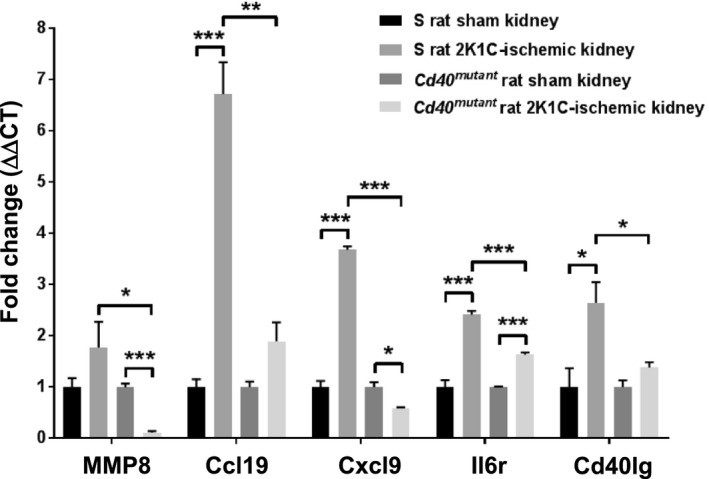
MMP8 (matrix metalloproteinase 8), Ccl19 (C‐C motif chemokine 19), Cxcl9 (C‐X‐C motif chemokine ligand 9), Il6r (interleukin 6 receptor), and Cd40lg (CD40 ligand) in renal cortex tissue of Dahl S and Cd40 mutant rats with/without 2K1C surgery. Samples were pooled from 8 animals from each group; gene expression was normalized to the respective sham group. Data presented as mean±SEM. *P<0.05; **P<0.01; ***P<0.001. 2K1C indicates 2‐kidney 1‐clip; and ΔΔCT, delta delta threshold cycle.
Given that diminished activity of the antioxidant paraoxonase enzyme is reported to be associated with development of CKD33, 34 and paraoxonase lactonase activity is shown to be inversely correlated with elevated CD40 levels in settings of vascular dysfunction,35 we evaluated the effect of Cd40 disruption on paraoxonase's antioxidant lactonase activity following 2K1C surgery. Here, we found that whereas 2K1C resulted in decreased circulating plasma paraoxonase's lactonase activity in S rats, this decrease was significantly attenuated by disruption of Cd40 after 2K1C (Figure 7A). In addition, we evaluated paraoxonase‐1, ‐2, and ‐3 gene expression in renal cortex, and we found that in both S and Cd40 mutant rat kidneys (sham), the predominant paraoxonase isoform was PON‐2 (≈96%), followed by PON‐3 (≈3%) and PON‐1 (≈1%; Figure S4A and S4B). Furthermore, we measured expression of each paraoxonase isoform in the renal cortex of sham and 2K1C surgery animals. There was a significant increase in PON‐2 expression in both contralateral and ischemic kidneys of Cd40 mutant rats (versus sham), whereas there was no increase in PON‐2 and PON‐3 in S rat kidneys (Figure S4C through S4E). We also evaluated superoxide dismutase36 activity and noted that it was nonspecifically decreased after 2K1C surgery in both S and Cd40 mutant rats (Figure S5).
Figure 7. Measurement of paraoxonase activity and urine excretion of TBARS (thiobarbituric acid reactive substances).
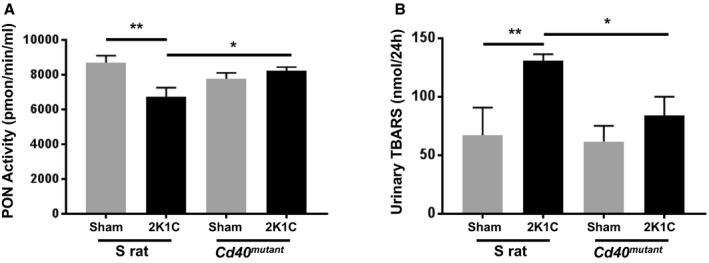
A, Lactonase activity of paraoxonase was measured in plasma obtained from S rats and Cd40 mutant rats 4 weeks after 2K1C surgery (2‐way ANOVA; genotype×2K1C: P<0.01). Data presented as mean±SEM, n=8 per group. B, Twenty‐four‐hour urinary excretion of TBARS (2‐way ANOVA; genotype×2K1C: P=NS). Data presented as mean±SEM, n=5‐8 per group. *P<0.05; **P<0.01. 2K1C indicates 2‐kidney 1‐clip; NS, not significant; and PON, paraoxonase.
In addition, in order to assess lipid peroxidation, we also measured 24‐hour urine excretion levels of TBARS after 2K1C and found that Cd40 mutant rats had significantly reduced levels compared with Dahl‐S (84.0±16.1 versus 130.9±5.5 nmol/24 h; P<0.05; Figure 7B). Similarly, we assessed TBARS in renal cortical tissue and found that in Dahl‐S animals, renal cortical TBARS was increased in ischemic kidneys compared with sham‐operated kidneys (0.05±0.004 versus 0.08±0.013 uM/ug; P=0.02; n=6–7 per group), whereas there was no increase in ischemic versus sham‐operated kidneys in Cd40 mutant rats (0.06±0.007 versus 0.05±0.012 μmol/L/μg; P=0.35; n=5–7 per group).
Disruption of Cd40 in the Kidney Specifically Attenuated Renal Fibrosis After Reciprocal Kidney Transplantation
To directly show that renal CD40 signaling contributes to development of renal fibrosis, we performed reciprocal renal transplantation as a proof‐of‐concept study using the following models: S rats as kidney donors were transplanted into Cd40 mutant rats as recipients (fully functional CD40 only in transplanted kidneys) versus Cd40 mutant rat kidney donors transplanted into S rat recipients (fully functional CD40 in all compartments except transplanted kidneys). Following a 4‐week recovery after surgery, the 2K1C procedure was performed on the transplanted kidney. Following an additional 4 weeks after 2K1C, renal fibrosis of ischemic kidneys and contralateral native kidneys was assessed. There were no differences in whole‐kidney fibrosis (Figure S6A), whereas S‐rat recipients of Cd40 mutant kidneys demonstrated a significant reduction in renal cortical fibrosis compared with Cd40 mutant recipients of S‐rat kidneys in their ischemic kidneys (Figure 8A and 8B, renal cortex region). In addition, hematoxylin and eosin staining demonstrated no differences in inflammation (Figure S6B) as well as hyaline cast severity (Figure S6C). These data confirmed that CD40 expressed in kidneys contributes to development of renal fibrosis in 2K1C ischemic renal injury.
Figure 8. Renal fibrosis analysis in kidney‐transplanted animals following 2K1C surgery.
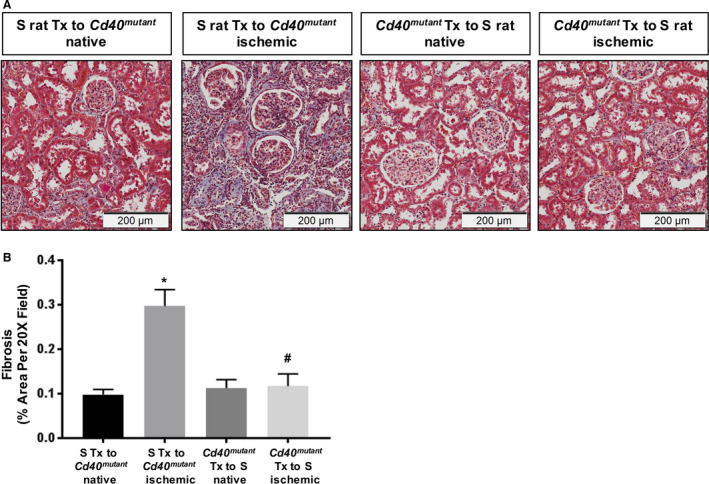
A, Representative trichrome staining figures and (B) quantitative analysis of fibrosis in the renal cortex region of kidney‐transplanted rats (2‐way ANOVA; genotype×2K1C: P<0.05). Data presented as mean±SEM, n=3. *P<0.05 vs S Tx to Cd40 mutant native; # P<0.05 vs S Tx to Cd40 mutant ischemic. 2K1C indicates 2‐kidney 1‐clip; and Tx, transplant.
Knockout of Cd40 in Human Proximal Tubule Epithelial Cells Significantly Reduces Expression of Genes Involved in Inflammation and Fibrosis
To study the role of CD40 in regulating renal fibrosis, we created a Cd40‐knockout cell line of human proximal tubule epithelial cells (HK2‐CD40KO). We confirmed Cd40 gene knockout by monitoring gene expression (Figure 9A) and CD40 protein expression (Figure 9B). Given that CD40 signaling induces MCP‐1 and PAI‐1 in proximal tubule epithelial cells,12 we evaluated MCP‐1 and PAI‐1 expression induced by sCD40L (100 ng/mL) and TNFα (10 ng/mL). The CD40‐deficient HK2‐CD40KO cell line showed a significant decrease in sCD40L‐stimulated MCP‐1 (>70%; Figure 9C) and PAI‐1 (50%; Figure 9D) gene expression compared with HK2 control cells. RNA samples from HK2 wild‐type and HK2‐CD40KO cells treated with sCD40L were further analyzed by using targeted inflammatory and fibrosis gene expression. Here, we found that expression of 18 genes were significantly different (>2‐fold change) in HK2 versus HK2‐CD40KO cells after sCD40L treatment (Table S2). Importantly, we noted that whereas key genes known to regulate kidney fibrosis were upregulated in HK2 controls cells, including CCL2 (MCP‐1), CXCR4 (C‐X‐C chemokine receptor type 4),37 EDN1 (endothelin 1),38 MMP9 (matrix metalloproteinase 9),39 and VEGFA (vascular endothelial growth factor A),40 this response was abolished in HK2‐CD40KO cells (Figure 10).
Figure 9. Knockout of Cd40 gene and disruption of CD40 signaling.
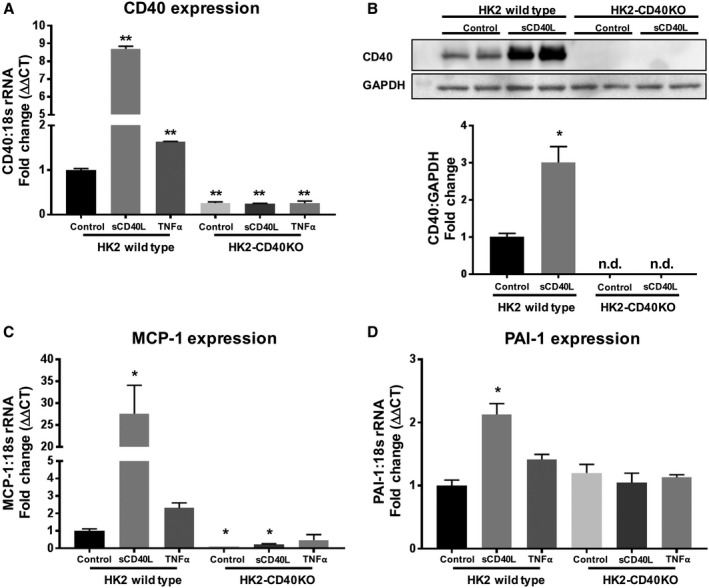
A, Quantitative analysis of gene expression of Cd40 in HK2‐CD40KO and HK2 wild‐type cells treated with sCD40L (100 ng/mL) or TNFα (10 ng/mL). B, Representative (upper) and quantitative analysis (lower) of CD40 protein expression using cell lysate from HK2 wild‐type and HK2‐CD40KO cells. C and D, Quantitative analysis of gene expression of MCP‐1(C) and PAI‐1(D) in HK2‐CD40KO and HK2 wild‐type cells treated with sCD40L (100 ng/mL) or TNFα (10 ng/mL). 18s rRNA was used as a housekeeping gene, and data were normalized to HK2 WT control. Data presented as mean±SEM. *P<0.05, **P<0.01 vs HK2 control. ΔΔCT indicates delta delta threshold cycle; MCP‐1, monocyte chemoattractant protein 1; n.d., not detectable; PAI‐1, plasminogen activator inhibitor 1; sCD40L, soluble CD40 ligand; TNFα, tumor necrosis factor alpha; and WT, wild type.
Figure 10. Quantitative analysis of gene expression of profibrotic and ‐inflammatory genes.
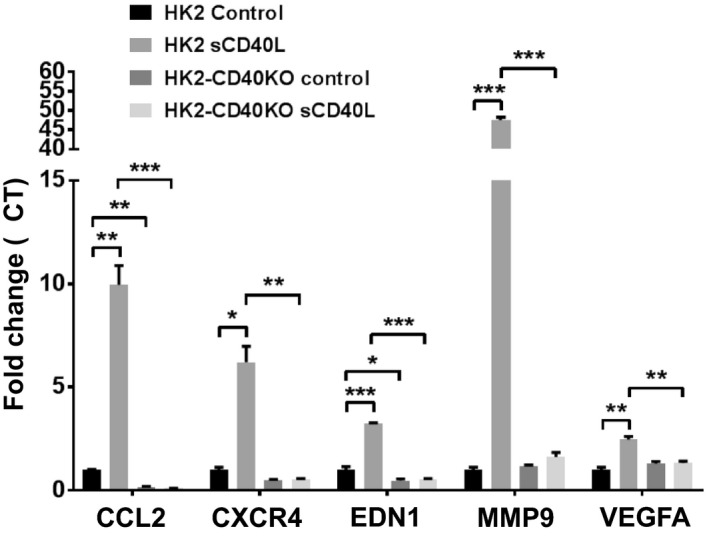
CCL2 (MCP‐1), CXCR4 (C‐X‐C chemokine receptor type 4), EDN1 (endothelin 1), MMP9 (matrix metalloproteinase 9), and VEGFA (vascular endothelial growth factor A) in HK2‐CD40KO and HK2 wild‐type cells treated with sCD40L (100 ng/mL). Data presented as mean±SEM. *P<0.05; **P<0.01; ***P<0.001. CCL2 indicates C‐C motif chemokine ligand 2; and MCP‐1, monocyte chemoattractant protein 1.
Discussion
Our study has demonstrated that disruption of Cd40 attenuates renal‐ischemia–induced renal fibrosis in the 2K1C model. Animals without CD40 function demonstrated significantly reduced systolic BP and improved antioxidant activity after 2K1C surgery. The CD40/CD40L signaling cascade has been implicated in the involvement of renal inflammation and fibrosis.12 We have previously reported that circulating levels of the CD40 receptor (sCD40) predict changes in renal function in patients with RAS and CKD, and circulating levels of sCD40L are significantly elevated in these settings.14, 16 In the 2K1C model of renal ischemia, we observed improved UPE in Cd40 mutant rats versus S rats. The fact that this was not associated with significant changes in GFR is most likely attributed to compensation from the contralateral kidney.41
By assessing gene expression of CD40 and PAI‐1, we demonstrated that CD40 was induced in both contralateral and ischemic kidneys in the model of renal ischemia and PAI‐1 is a potential mediator of renal fibrosis, which we and others have reported to be regulated by CD40 in the proximal tubule epithelium.12, 13 It was interesting to note that in S rats, despite the fact that both contralateral and ischemic kidneys had elevated levels of PAI‐1, only the ischemic kidneys had appreciable differences in fibrosis. Although the reasons for elevated PAI‐1 in both contralateral and ischemic kidneys are not entirely clear, similar results have been reported in other settings where both ischemic and contralateral kidneys had equivalent levels of proinflammatory cytokines and profibrotic mediators, such as IL‐6, TNF‐α, MCP‐1, and PAI‐1.7 Thus, it is possible that whereas the nonischemic contralateral kidney has the ability to compensate for these inflammatory insults, the ischemic kidney lacks this ability. In fact, Eirin et al demonstrated that despite equivalent levels of proinflammatory cytokines and profibrotic mediators between ischemic and contralateral kidneys, differences in circulating levels of CD34‐ and KDR‐positive progenitor cells may affect the reparative processes between ischemic verses nonischemic kidneys within the same person.7 The gene expression array results demonstrated that there was no difference in Cd40 immunoglobulin levels between Cd40 mutant shams and Cd40 mutant ischemic kidneys. However, Cd40 immunoglobulin was significantly elevated in the S rat ischemic kidney compared with S rat shams (P<0.039) and significantly elevated in the S rat ischemic kidney compared with the Cd40 mutant ischemic kidney (P<0.039). This supports our hypothesis that CD40 signaling is a significant contributor to development of renal fibrosis and is in agreement with our clinical studies, which show that elevated circulating CD40 ligand levels correlate with a decrease in renal function in CKD.16 The gene expression array results also demonstrate novel genes regulated by CD40, which have been shown to be associated with renal disease: MMP8, Ccl19, and Il6r have been reported to contribute to acute kidney injury,28, 29, 30, 32 and Cxcl9 is known to promote CXCR3 (C‐X‐C motif chemokine receptor 3)‐dependent immune‐mediated kidney disease.31 Previous studies demonstrated that expression of TNFα, MCP‐1, and p‐NF‐κB (phosphorylated nuclear factor kappa‐light‐chain‐enhancer of activated B cells) were upregulated in the 2K1C model,42 and MCP‐1 deficiency was reported to protect the ischemic kidney against RAS.8
We included measures of paraoxonase lactonase activity because reduced lactonase activity has been shown to be associated with increased lipid peroxidation as well as oxidative/nitrative stress and increased adverse clinical outcomes in the setting of CKD,33, 34 including CKD attributed to hypertension and renal ischemia.43 Furthermore, paraoxonase lactonase activity has been shown to be inversely correlated with elevated CD40 levels in settings of vascular dysfunction.35 We noted that paraoxonase enzyme activity is significantly elevated in Cd40 mutant rats compared with S rats after 2K1C and that urinary lipid peroxidation levels were decreased, suggesting that elevated paraoxonase activity in the absence of CD40 may be renal protective in this setting. In addition to PON lactonase activity, we evaluated the specific paraoxonase isoform expression in renal cortical tissues following the 2K1C procedure and noted that PON‐2 (≈96% of total isoform expression) and, to a lesser extent, PON‐3 (≈3% of total isoform expression) were the predominate isoforms in this model. After the 2K1C procedure, there was a significant increase in PON‐2 expression in Cd40 mutant rat kidney renal cortical tissue (sham versus both clipped and contralateral) whereas there was no increase in PON‐2 in Dahl‐S kidney renal cortical tissue (sham versus either clipped or contralateral). The predominance of PON‐2 in renal cortical tissue suggests that this may be a key renal protective enzyme involved in the reduced lipid peroxidation noted in Cd40 mutant rats after 2K1C.
To confirm that attenuation of ischemia‐induced renal fibrosis in Cd40 mutant rats is attributable to kidney‐specific CD40 expression, we performed reciprocal kidney transplantation followed by 2K1C surgery on the transplanted kidney. After analyzing the renal cortex region, we demonstrated that Cd40 mutant kidneys in S‐rat recipients had significantly less renal cortical fibrosis compared with S kidneys in Cd40 mutant recipients. This observation strongly suggests that local CD40 expressed within the cortex is a major driver of renal fibrosis in renal ischemia. CD40 signaling in proximal tubular epithelial cells has been shown to induce a proinflammatory and ‐fibrotic response.12 To further investigate CD40 signaling in proximal tubules, we created a CD40‐knockout cell line using human proximal tubule epithelial cells. The proximal tubule epithelium plays an important role in mediating the process of interstitial fibrosis by producing profibrotic and ‐inflammatory cytokines or reacting to cytokine infiltration.44 Tubular cells also either interact and activate fibroblasts or transform to myofibroblasts by epithelial‐mesenchymal transition upon activation.45, 46 The inflammatory gene array and fibrosis array analyses in proximal tubule cells demonstrated that MCP‐1 and EDN‐1 are regulated by CD40 signaling, given that CD40 knockout led to suppression of their expressions. MMP9, which can be induced by TNFα in proximal tubule cells,39 was dramatically increased by activation of CD40 signaling. The other 2 important pro‐inflammatory genes, CXCR4 and VEGFA, which are known to be associated with level of kidney fibrosis and renal disease,37, 40 were also found to be regulated by CD40 signaling. Our current study demonstrated that sCD40L, but not TNF‐α, significantly promoted expression of MCP‐1 and PAI‐1, indicating the specificity of CD40 signaling on regulating the profibrotic process.
Our study supports the significant role of CD40 in regulating ischemia‐induced renal injury; there are several limitations. Whereas in other models we did not observe a BP effect, we did observe a modest decrease in BP in Cd40 mutant rats compared with S rats following 2K1C. Although we do not think that this is driving the renoprotective phenotype, we cannot rule this out. However, our cell‐culture model suggests that activation of CD40 in the proximal tubule is a major driver of renal injury. Although we noted a significant increase in PAI‐1 gene expression in ischemic kidneys of S rats compared with Cd40 mutant rats along with elevated tPA activity in Cd40 mutant rats, we did not detect a significant difference in PAI‐1 protein expression. Future work is warranted as to the extent of PAI‐1 activation in the development of renal fibrosis in our 2K1C model. We have shown a specific role for the CD40 receptor, expressed within the kidney, in regulating the process of renal injury and in proximal tubule cells. Overall, we propose that CD40 signaling plays an important role in generating local inflammatory and profibrotic factors, whereas gene array analysis in proximal tubule cells and ischemic kidney tissue from 2K1C animals indicated a different pattern of responses when CD40 expression was disrupted. In fact, other types of kidney cells, such as podocytes and glomerular epithelial cells,47 may be involved in the CD40‐regulated response and interactions between proximal tubule cells, and those cell types will be important areas to address.
Sources of Funding
This work was supported by the National Institutes of Health (HL‐137004 and HL‐105649), the National Affiliate of the American Heart Association (14SDG18650010 and 16SDG27700030), the American Society of Nephrology (Pre‐doctoral Fellowship to Khalaf), the David and Helen Boone Foundation Research Fund, an Early Career Development Award from the Central Society for Clinical and Translational Research, the University of Toledo Women and Philanthropy Genetic Analysis Instrumentation Center, and the University of Toledo Medical Research Society.
Disclosures
Dr Kennedy discloses grants from the National Institutes of Health (NIH; HL‐137004), American Heart Association (14SDG18650010), David and Helen Boone Foundation Research Fund, Central Society for Clinical and Translational Research, University of Toledo Women and Philanthropy, and Cleveland Clinic Research Program Committee. Dr Tian discloses a US patent (US8981051 B2). Dr Tian discloses grants from the NIH (R01 HL‐105649) and the URFO Biomedical Research Innovation Program from the University of Toledo. The remaining authors have no disclosures to report.
Supporting information
Tables S1 and S2
Figures S1–S6
J Am Heart Assoc. 2020;9:e014072 DOI: 10.1161/JAHA.119.014072
A portion of this work was presented in abstract form at the Combined Annual Meeting of Central Society for Clinical and Translational Research and the Midwestern Section of the American Federation for Medical Research, March 29, 2017, in Chicago, Illinois, and at the American Society of Nephrology Kidney Week, October 23 to 28, 2018, in San Diego, California.
References
- 1. Derkx FH, Schalekamp MA. Renal artery stenosis and hypertension. Lancet. 1994;344:237–239. [DOI] [PubMed] [Google Scholar]
- 2. Ram CV. Renovascular hypertension. Curr Opin Nephrol Hypertens. 1997;6:575–579. [DOI] [PubMed] [Google Scholar]
- 3. Vokonas PS, Kannel WB, Cupples LA. Epidemiology and risk of hypertension in the elderly: the Framingham study. J Hypertens Suppl. 1988;6:S3–9. [PubMed] [Google Scholar]
- 4. Böhlke M, Barcellos FC. From the 1990s to coral (cardiovascular outcomes in renal atherosclerotic lesions) trial results and beyond: does stenting have a role in ischemic nephropathy? Am J Kidney Dis. 2015;65:611–622. [DOI] [PubMed] [Google Scholar]
- 5. Cooper CJ, Murphy TP, Cutlip DE, Jamerson K, Henrich W, Reid DM, Cohen DJ, Matsumoto AH, Steffes M, Jaff MR, et al; CORAL Investigators. Stenting and medical therapy for atherosclerotic renal‐artery stenosis. N Engl J Med. 2014;370:13–22. [DOI] [PMC free article] [PubMed] [Google Scholar]
- 6. Lerman LO, Textor SC, Grande JP. Mechanisms of tissue injury in renal artery stenosis: ischemia and beyond. Prog Cardiovasc Dis. 2009;52:196–203. [DOI] [PMC free article] [PubMed] [Google Scholar]
- 7. Eirin A, Gloviczki ML, Tang H, Gossl M, Jordan KL, Woollard JR, Lerman A, Grande JP, Textor SC, Lerman LO. Inflammatory and injury signals released from the post‐stenotic human kidney. Eur Heart J. 2013;34:540–548a. [DOI] [PMC free article] [PubMed] [Google Scholar]
- 8. Kashyap S, Osman M, Ferguson CM, Nath MC, Roy B, Lien KR, Nath KA, Garovic VD, Lerman LO, Grande JP. CCL2 deficiency protects against chronic renal injury in murine renovascular hypertension. Sci Rep. 2018;8:8598. [DOI] [PMC free article] [PubMed] [Google Scholar]
- 9. Li H, Nord EP. CD40 ligation stimulates MCP‐1 and IL‐8 production, TRAF6 recruitment, and MAPK activation in proximal tubule cells. Am J Physiol Renal Physiol. 2002;282:F1020–F1033. [DOI] [PubMed] [Google Scholar]
- 10. Cv Kooten, Banchereau J. Functions of CD40 on B cells, dendritic cells and other cells. Curr Opin Immunol. 1997;9:330–337. [DOI] [PubMed] [Google Scholar]
- 11. Rizvi M, Pathak D, Freedman JE, Chakrabarti S. CD40‐CD40 ligand interactions in oxidative stress, inflammation and vascular disease. Trends Mol Med. 2008;14:530–538. [DOI] [PubMed] [Google Scholar]
- 12. Pontrelli P, Ursi M, Ranieri E, Capobianco C, Schena FP, Gesualdo L, Grandaliano G. CD40L proinflammatory and profibrotic effects on proximal tubular epithelial cells: role of NF‐κB and Lyn. J Am Soc Nephrol. 2006;17:627–636. [DOI] [PubMed] [Google Scholar]
- 13. Haller ST, Kumarasamy S, Folt DA, Wuescher LM, Stepkowski S, Karamchandani M, Waghulde H, Mell B, Chaudhry M, Maxwell K, et al. Targeted disruption of CD40 in a genetically hypertensive rat model attenuates renal fibrosis and proteinuria, independent of blood pressure. Kidney Int. 2017;91:365–374. [DOI] [PMC free article] [PubMed] [Google Scholar]
- 14. Haller ST, Kalra PA, Ritchie JP, Chrysochou T, Brewster P, He W, Yu H, Shapiro JI, Cooper CJ. Effect of CD40 and SCD40L on renal function and survival in patients with renal artery stenosis. Hypertension. 2013;61:894–900. [DOI] [PMC free article] [PubMed] [Google Scholar]
- 15. Haller S, Adlakha S, Reed G, Brewster P, Kennedy D, Burket MW, Colyer W, Yu H, Zhang D, Shapiro JI, et al. Platelet activation in patients with atherosclerotic renal artery stenosis undergoing stent revascularization. Clin J Am Soc Nephrol. 2011;6:2185–2191. [DOI] [PMC free article] [PubMed] [Google Scholar]
- 16. Xie JX, Alderson H, Ritchie J, Kalra PA, Xie Y, Ren K, Nguyen H, Chen T, Brewster P, Gupta R, et al. Circulating CD40 and SCD40L predict changes in renal function in subjects with chronic kidney disease. Sci Rep. 2017;7:7942. [DOI] [PMC free article] [PubMed] [Google Scholar]
- 17. Muller DN, Klanke B, Feldt S, Cordasic N, Hartner A, Schmieder RE, Luft FC, Hilgers KF. (Pro)Renin receptor peptide inhibitor “handle‐region” peptide does not affect hypertensive nephrosclerosis in goldblatt rats. Hypertension. 2008;51:676–681. [DOI] [PubMed] [Google Scholar]
- 18. Kumarasamy S, Gopalakrishnan K, Toland EJ, Yerga‐Woolwine S, Farms P, Morgan EE, Joe B. Refined mapping of blood pressure quantitative trait loci using congenic strains developed from two genetically hypertensive rat models. Hypertens Res. 2011;34:1263–1270. [DOI] [PMC free article] [PubMed] [Google Scholar]
- 19. Schock‐Kusch D, Xie Q, Shulhevich Y, Hesser J, Stsepankou D, Sadick M, Koenig S, Hoecklin F, Pill J, Gretz N. Transcutaneous assessment of renal function in conscious rats with a device for measuring fitc‐sinistrin disappearance curves. Kidney Int. 2011;79:1254–1258. [DOI] [PubMed] [Google Scholar]
- 20. Kumarasamy S, Waghulde H, Cheng X, Haller ST, Mell B, Abhijith B, Ashraf UM, Atari E, Joe B. Targeted disruption of regulated endocrine‐specific protein (Resp18) in Dahl SS/Mcw rats aggravates salt‐induced hypertension and renal injury. Physiol Genomics. 2018;50:369–375. [DOI] [PMC free article] [PubMed] [Google Scholar]
- 21. Kennedy David J, Shrestha K, Sheehey B, Li Xinmin S, Guggilam A, Wu Y, Finucan M, Gabi A, Medert Charles M, Westfall K, et al. Elevated plasma marinobufagenin, an endogenous cardiotonic steroid, is associated with right ventricular dysfunction and nitrative stress in heart failure. Circ Heart Fail. 2015;8:1068–1076. [DOI] [PMC free article] [PubMed] [Google Scholar]
- 22. Loupy A, Haas M, Solez K, Racusen L, Glotz D, Seron D, Nankivell BJ, Colvin RB, Afrouzian M, Akalin E, et al. The Banff 2015 kidney meeting report: current challenges in rejection classification and prospects for adopting molecular pathology. Am J Transplant. 2017;17:28–41. [DOI] [PMC free article] [PubMed] [Google Scholar]
- 23. Kennedy DJ, Malhotra D, Khalaf FK, Xie JX, Tian J, Zhang S, Haller ST, Shapiro JI, Cui X, Yu H, et al. Na/K‐ATPase/src complex mediates regulation of CD40 in renal parenchyma. Nephrol Dial Transplant. 2017;33:1138–1149. [DOI] [PMC free article] [PubMed] [Google Scholar]
- 24. Ho AWY, Wong CK, Lam CWK. Tumor necrosis factor‐α up‐regulates the expression of CCL2 and adhesion molecules of human proximal tubular epithelial cells through MAPK signaling pathways. Immunobiology. 2008;213:533–544. [DOI] [PubMed] [Google Scholar]
- 25. Widholz B, Tsitlakidis S, Reible B, Moghaddam A, Westhauser F. Pooling of patient‐derived mesenchymal stromal cells reduces inter‐individual confounder‐associated variation without negative impact on cell viability, proliferation and osteogenic differentiation. Cells. 2019;8:633. [DOI] [PMC free article] [PubMed] [Google Scholar]
- 26. Chen W, Bennett CF, Wang ME, Dragun D, Tian L, Stecker K, Clark JH, Kahan BD, Stepkowski SM. Perfusion of kidneys with unformulated “naked” intercellular adhesion molecule‐1 antisense oligodeoxynucleotides prevents ischemic/reperfusion injury1. Transplantation. 1999;68:880–887. [DOI] [PubMed] [Google Scholar]
- 27. Hu K, Mars WM, Liu Y. Novel actions of tissue‐type plasminogen activator in chronic kidney disease. Front Biosci. 2008;13:5174–5186. [DOI] [PMC free article] [PubMed] [Google Scholar]
- 28. Tan RJ, Liu Y. Matrix metalloproteinases in kidney homeostasis and diseases. Am J Physiol Renal Physiol. 2012;302:F1351–F1361. [DOI] [PMC free article] [PubMed] [Google Scholar]
- 29. Basu RK, Donaworth E, Siroky B, Devarajan P, Wong HR. Loss of matrix metalloproteinase‐8 is associated with worsened recovery after ischemic kidney injury. Ren Fail. 2015;37:469–475. [DOI] [PMC free article] [PubMed] [Google Scholar]
- 30. Maarouf OH, Uehara M, Kasinath V, Solhjou Z, Banouni N, Bahmani B, Jiang L, Yilmam OA, Guleria I, Lovitch SB, et al. Repetitive ischemic injuries to the kidneys result in lymph node fibrosis and impaired healing. JCI Insight. 2018;3:e120546. [DOI] [PMC free article] [PubMed] [Google Scholar]
- 31. Menke J, Zeller GC, Kikawada E, Means TK, Huang XR, Lan HY, Lu B, Farber J, Luster AD, Kelley VR. CXCL9, but not CXCL10, promotes CXCR3‐dependent immune‐mediated kidney disease. J Am Soc Nephrol. 2008;19:1177–1189. [DOI] [PMC free article] [PubMed] [Google Scholar]
- 32. Nechemia‐Arbely Y, Barkan D, Pizov G, Shriki A, Rose‐John S, Galun E, Axelrod JH. IL‐6/IL‐6R axis plays a critical role in acute kidney injury. J Am Soc Nephrol. 2008;19:1106–1115. [DOI] [PMC free article] [PubMed] [Google Scholar]
- 33. Kennedy DJ, Tang WHW, Fan Y, Wu Y, Mann S, Pepoy M, Hazen SL. Diminished antioxidant activity of high‐density lipoprotein‐associated proteins in chronic kidney disease. J Am Heart Assoc. 2013;2:e000104 DOI: 10.1161/JAHA.112.000104. [DOI] [PMC free article] [PubMed] [Google Scholar]
- 34. Sztanek F, Seres I, Harangi M, Lőcsey L, Padra J, Paragh GJR, Asztalos L, Paragh G. Decreased paraoxonase 1 (PON1) lactonase activity in hemodialyzed and renal transplanted patients. A novel cardiovascular biomarker in end‐stage renal disease. Nephrol Dial Transplant. 2012;27:2866–2872. [DOI] [PubMed] [Google Scholar]
- 35. Szentpéteri A, Zsíros N, Varga VE, Lőrincz H, Katkó M, Seres I, Fülöp P, Paragh G, Harangi M. Paraoxonase‐1 and myeloperoxidase correlate with vascular biomarkers in overweight patients with newly diagnosed untreated hyperlipidaemia. Vasa. 2017;46:370–376. [DOI] [PubMed] [Google Scholar]
- 36. Ichikawa I, Kiyama S, Yoshioka T. Renal antioxidant enzymes: their regulation and function. Kidney Int. 1994;45:1–9. [DOI] [PubMed] [Google Scholar]
- 37. Yuan A, Lee Y, Choi U, Moeckel G, Karihaloo A. Chemokine receptor CXCR4 contributes to kidney fibrosis via multiple effectors. Am J Physiol Renal Physiol. 2015;308:F459–F472. [DOI] [PMC free article] [PubMed] [Google Scholar]
- 38. Zhang Y, Jose PA, Zeng C. Regulation of sodium transport in the proximal tubule by endothelin. Contrib Nephrol. 2011;172:63–75. [DOI] [PMC free article] [PubMed] [Google Scholar]
- 39. Nee LE, McMorrow T, Campbell E, Slattery C, Ryan MP. TNF‐alpha and IL‐1beta‐mediated regulation of MMP‐9 and TIMP‐1 in renal proximal tubular cells. Kidney Int. 2004;66:1376–1386. [DOI] [PubMed] [Google Scholar]
- 40. Rudnicki M, Perco P, Enrich J, Eder S, Heininger D, Bernthaler A, Wiesinger M, Sarközi R, Noppert S‐J, Schramek H, et al. Hypoxia response and VEGF‐a expression in human proximal tubular epithelial cells in stable and progressive renal disease. Lab Invest. 2009;89:337–346. [DOI] [PubMed] [Google Scholar]
- 41. Murphy WR, Coleman TG, Smith TL, Stanek KA. Effects of graded renal artery constriction on blood pressure, renal artery pressure, and plasma renin activity in goldblatt hypertension. Hypertension. 1984;6:68–74. [DOI] [PubMed] [Google Scholar]
- 42. Quadri SS, Culver S, Siragy HM. Prorenin receptor mediates inflammation in renal ischemia. Clin Exp Pharmacol Physiol. 2018;45:133–139. [DOI] [PMC free article] [PubMed] [Google Scholar]
- 43. Mohammed CJ, Xie Y, Brewster PS, Ghosh S, Dube P, Sarsour T, Kleinhenz AL, Crawford EL, Malhotra D, James RW, et al. Circulating lactonase activity but not protein level of PON‐1 predicts adverse outcomes in subjects with chronic kidney disease. J Clin Med. 2019;8:1034. [DOI] [PMC free article] [PubMed] [Google Scholar]
- 44. Gewin LS. Renal fibrosis: primacy of the proximal tubule. Matrix Biol. 2018;68–69:248–262. [DOI] [PMC free article] [PubMed] [Google Scholar]
- 45. Picard N, Baum O, Vogetseder A, Kaissling B, Le Hir M. Origin of renal myofibroblasts in the model of unilateral ureter obstruction in the rat. Histochem Cell Biol. 2008;130:141–155. [DOI] [PMC free article] [PubMed] [Google Scholar]
- 46. Takaori K, Nakamura J, Yamamoto S, Nakata H, Sato Y, Takase M, Nameta M, Yamamoto T, Economides AN, Kohno K, et al. Severity and frequency of proximal tubule injury determines renal prognosis. J Am Soc Nephrol. 2016;27:2393–2406. [DOI] [PMC free article] [PubMed] [Google Scholar]
- 47. Doublier S, Zennaro C, Musante L, Spatola T, Candiano G, Bruschi M, Besso L, Cedrino M, Carraro M, Ghiggeri GM, et al. Soluble CD40 ligand directly alters glomerular permeability and may act as a circulating permeability factor in FSGS. PLoS One. 2017;12:e0188045. [DOI] [PMC free article] [PubMed] [Google Scholar]
Associated Data
This section collects any data citations, data availability statements, or supplementary materials included in this article.
Supplementary Materials
Tables S1 and S2
Figures S1–S6