

Abstract
Although antimalarials are the primary treatment for cutaneous lupus erythematosus, not all patients are equally responsive. We investigated whether different inflammatory cell population and cytokine profiles in lesional cutaneous lupus erythematosus skin could affect antimalarial responsiveness, and whether hydroxychloroquine (HCQ) and quinacrine (QC) differentially suppress inflammatory cytokines. Cutaneous lupus erythematosus patients were grouped according to their response to antimalarials (HCQ vs. HCQ+QC). On immunohistochemistry, only the myeloid dendritic cell population was significantly increased in the HCQ+QC group compared to HCQ group. While the IFN scores calculated for the selected type I IFN–regulated genes (LYE6, OAS1, OASL, ISG15, and MX1) were significantly higher in the HCQ group than the HCQ+QC group, the TNF-α level was higher in the HCQ+QC group. QC was more effective than HCQ at inhibiting the toll receptor-mediated production of TNF-α and IL-6 in the peripheral blood mononuclear cells isolated from cutaneous lupus erythematosus patients, whereas QC and HCQ inhibited IFN-α equally. QC also suppressed phospho–NF-κB p65 more profoundly than HCQ. In conclusion, increased myeloid dendritic cell population with higher TNF-α expression might contribute to HCQ refractoriness and a better response to QC. Differential suppressive effects of HCQ and QC could also affect antimalarial responses in cutaneous lupus erythematosus patients.
INTRODUCTION
Lupus erythematosus (LE) is an autoimmune disease that encompasses a broad range of cutaneous symptoms, including malar rash, discoid rash, photosensitivity and oral ulcers, as well as systemic symptoms, such as arthritis, renal disease, and hematologic disease. Skin involvement (cutaneous lupus erythematosus [CLE]) occurs in 70–85% of all patients with LE (Fabbri et al., 2003). There are three types of histopathologic LE-specific skin lesions: acute CLE, subacute CLE (SCLE), and chronic CLE (Gilliam and Sontheimer, 1981). Chronic CLE includes subtypes, such as discoid LE (DLE), tumid LE, and LE panniculitis.
T lymphocytes are the predominant cell type found in lesional lupus skin, but plasmacytoid dendritic cells (pDCs) and myeloid dendritic cells (mDCs) also play a pivotal role in the pathogenesis. Type I IFNs produced mainly by pDCs are implicated in the pathogenesis of both CLE and SLE, and the expression of type I IFN–regulated genes are increased in peripheral blood of CLE and SLE patients (Braunstein et al., 2012; Feng et al., 2006). TNF-α is another critical proinflammatory cytokine involved in LE pathogenesis, and is increased in the lesional skin of DLE and SCLE compared to controls (Nabatian et al., 2012; Toro et al., 2000; Zampieri et al., 2006). Although the role of T helper type 17 cells in CLE is still not clear, IL-6, a cytokine involved in inflammation and differentiation of T helper type 17 cells, is likely responsible in part for T helper type 17 cell activity in CLE, and IL-6 was elevated in lesional CLE skin (Oh et al., 2011).
Oral antimalarials, including hydroxychloroquine (HCQ) and chloroquine (CQ) are first-line systemic therapy for all CLE sub-types. Although HCQ is effective in approximately 50% of patients (Chang et al., 2011; Wahie et al., 2011, Walling and Sontheimer, 2009), some patients still do not respond to antimalarials. The patients who are not responsive to HCQ alone could benefit from additional quinacrine (QC). The exact mechanism of action of antimalarials is still not completely understood, but is thought to consist of multiple interrelated anti-inflammatory and immunomodulatory effects, such as photoprotection, lysosomal stabilization, suppression of antigen presentation, inhibition of prostaglandin, cytokine synthesis, and endosomal toll-like receptor (TLR) signaling to limit B cell and dendritic cell activation (Kalia and Dutz, 2007; Kuhn et al., 2010; Wozniacka et al., 2002).
To determine the factors associated with the heterogeneity of treatment response to antimalarials in CLE patients, inflammatory cell infiltrates and cytokine profiles in lesional skin of CLE patients were evaluated. The suppressive ability of HCQ and QC on TLR-mediated production of proinflammatory cytokines, including IFN-α, TNF-α, and IL-6, and NF-κB phosphorylation was evaluated, to see whether HCQ and QC have a differential influence on the cytokine milieu in CLE.
RESULTS
Epidemiologic characteristics of the study population
Among 49 patients included in the study, 22 patients responded well to HCQ (HCQ group), and 27 patients required additional QC due to the insufficient efficacy of HCQ (HCQ+QC group). Age, sex, Cutaneous Lupus Erythematosus Disease Area and Severity Index (CLASI) activity score, CLE subtypes (DLE and SCLE), and the number of American College of Rheumatology criteria in SLE fulfilled were similar in the two groups (Table 1). Previously, several clinical factors, including smoking status (Chasset et al., 2015), presence of associated SLE, cicatricial alopecia, disseminated DLE (Wahie et al., 2011), and hypertrophic DLE (Spann et al., 1988) have been associated with the failure of HCQ in DLE patients. However, Fisher’s exact test and chisquare test found no significant difference regarding these factors between the two treatment response groups in this study. Although not statistically significant, the presence of cicatricial alopecia was relatively associated with a lower response to HCQ (P = 0.0628).
Table 1.
Epidemiologic characteristics of the study population according to the treatment response to the antimalarials
| Characteristics | HCQ (n = 22) |
HCQ + QC (n = 27) |
P-Value |
|---|---|---|---|
| Age, y, mean ± SEM | 52.18 ± 3.43 | 45.70 ± 2.56 | 0.1291 |
| Sex, n (%) | 1.0000 | ||
| Female | 19 (86.4) | 23 (85.2) | |
| Male | 3 (13.6) | 4 (14.8) | |
| Race, n (%) | 0.7681 | ||
| Caucasian | 15 (68.2) | 16 (59.3) | |
| Black | 6 (27.3) | 10 (37.0) | |
| Other | 1 (4.5) | 1 (3.7) | |
| CLASI activity score, mean ± SEM | 11.47 ± 2.07 | 15.17 ± 2.02 | 0.2133 |
| CLE subtype, n (%) | 0.2602 | ||
| SCLE | 11 (50) | 9 (33.3) | |
| DLE | 11 (50) | 18 (66.7) | |
| Associated SLE, n (%) | 0.5647 | ||
| Present | 7 (31.8) | 11 (40.7) | |
| Absent | 15 (68.2) | 16 (59.3) | |
| No. of ACR criteria in SLE fulfilled, mean ± SEM | 1.90 ± 0.50 | 2.56 ± 0.35 | 0.2718 |
| Smoking,1 n (%) | 0.4350 | ||
| Never | 9 (42.9) | 15 (60.0) | |
| Former | 5 (23.8) | 3 (12.0) | |
| Current | 7 (33.3) | 7 (28.0) | |
| Cicatricial alopecia,2 n (%) | 0.0628 | ||
| Present | 5 (26.3) | 14 (58.3) | |
| Absent | 14 (73.7) | 10 (41.7) | |
| Disseminated DLE,3n (%) | 0.6942 | ||
| Present | 3 (27.3) | 7 (38.9) | |
| Absent | 8 (72.7) | 11 (61.1) | |
| Hypertrophic DLE,3n (%) | 1.0000 | ||
| Present | 1 (9.1) | 3 (16.7) | |
| Absent | 10 (90.9) | 15 (83.3) |
Abbreviations: ACR, American College of Rheumatology; CLASI, Cutaneous Lupus Erythematosus Disease Area and Severity Index; CLE, cutaneous lupus erythematosus; DLE, discoid lupus erythematosus; HCQ, hydroxychloroquine; QC, quinacrine; SCLE, subacute cutaneous lupus erythematosus; SEM, standard error of mean; SLE, systemic lupus erythematosus.
The number of patients included in the analysis was 21 in HCQ group, and 25 in HCQ+QC group.
The number of patients included in the analysis was 19 in HCQ group, and 24 in HCQ+QC group.
Data were analyzed among DLE patients (n = 11 for HCQ group; n = 18 for HCQ+QC group).
Increased number of mDCs in the lesional skin of HCQ-refractory patients
The patients who were not responsive to HCQ and required additional QC (HCQ+QC group, n = 23) were found to have significantly more mDCs in their lesional skin compared to those who were responsive to HCQ single treatment (HCQ group, n = 16) (P = 0.0029) (Figure 1a, Table 2). Although the number of pDCs showed a tendency to be higher in HCQ than HCQ+QC (33.34 vs. 24.30), the difference was not statistically significant (P = 0.1984, Figure 1b). The number of neutrophils and macrophages were not different between HCQ and HCQ+QC groups (Figure 1c, 1d). The optimal cutoff number of mDCs per high-power field to predict failure to HCQ was 14.5, with a sensitivity of 86.96% and a specificity of 62.5%, based on the receiver operating characteristic curve (Supplementary Figure S1 online) and the maximal Youden’s J index (sensitivity + specificity − 100). Subgroup analysis depending on CLE subtypes showed that the number of mDCs were significantly different in SCLE between HCQ and HCQ+QC groups (P = 0.0042). In DLE, although not statistically significant, there was a trend to increased mDCs in the HCQ+QC group compared to the HCQ group (P = 0.0837) (Supplementary Figure S2 online). There was no significant correlation between the number of infiltrated cells in each cell population and CLASI activity score. There was still no difference when evaluated as CLASI-high (CLASI > 9) and CLASI-low (CLASI ≤ 9) (Klein et al., 2011).
Figure 1. Inflammatory cell population in lesional lupus skin varies with the treatment response.

In immunohistochemical analysis, (a) CD11c, (b) CD123, (c) MPO, and (d) MAC387 were stained to evaluate myeloid dendritic cells, plasmacytoid dendritic cells, neutrophils, and macrophages, respectively. Left two columns are representative photomicrographs of immunohistochemical staining of CD11c, CD123, MPO, and MAC387 in hydroxychloroquine (HCQ, n = 16) and hydroxychloroquine + quinacrine (HCQ+QC, n = 23) groups. Scale bar = 50 μm. HPF, high-power field; MPO, myeloperoxidase. Graphs show mean ± SEM. **P < 0.01.
Table 2.
The number of myeloid dendritic cells, plasmacytoid dendritic cells, neutrophils, and macrophages found in immunohistochemical staining with CD11c, CD123, myeloperoxidase, and MAC387, respectively, in each treatment response group
| Cell types | HCQ, Mean ± SEM (n = 16) |
HCQ + QC, Mean ± SEM (n = 23) |
P-Value |
|---|---|---|---|
| Myeloid dendritic cells1 | 16.19 ± 2.916 | 33.65 ± 4.086 | 0.0029 |
| Plasmacytoid dendritic cells | 33.34 ± 5.168 | 24.30 ± 4.497 | 0.1984 |
| Neutrophils | 15.24 ± 3.145 | 13.66 ± 1.544 | 0.6254 |
| Macrophages | 24.90 ± 4.476 | 22.26 ± 2.847 | 0.6045 |
Abbreviations: HCQ, hydroxychloroquine group; HCQ+QC, hydroxychloroquine + quinacrine group.
P < 0.01.
Upregulated gene expression of TNF-α with decreased type I IFN signatures in patients who required additional QC
Gene expression of type I IFN signatures in lesional CLE skin were significantly upregulated in the HCQ group (n = 10) compared to the HCQ+QC group (n = 11) (LYE P = 0.0037; OAS1 P = 0.0002; OASL P = 0.0227; ISG15 P = 0.0113;and MX1 P = 0.0083). The IFN score was calculated for five type I IFN–regulated genes (LYE6, OAS1, OASL, ISG15, and MX1). The IFN score was significantly higher in the HCQ group than the HCQ+QC group (mean ± standard deviation, 9.484 ± 1.570 vs. 2.731 ± 0.744, P = 0.0008). Consistent with the increased population of mDCs, TNF-α was significantly higher in the HCQ+QC group (P = 0.0062). However, mRNA expression of GBP1, IL18BP, and IL1B was not different between HCQ and HCQ+QC groups (Figure 2). There was no significant difference in TNF-α gene expression and IFN score in subgroup analysis according to CLE subtype and CLASI score.
Figure 2. Inflammatory cytokine gene expression in lesional lupus skin.
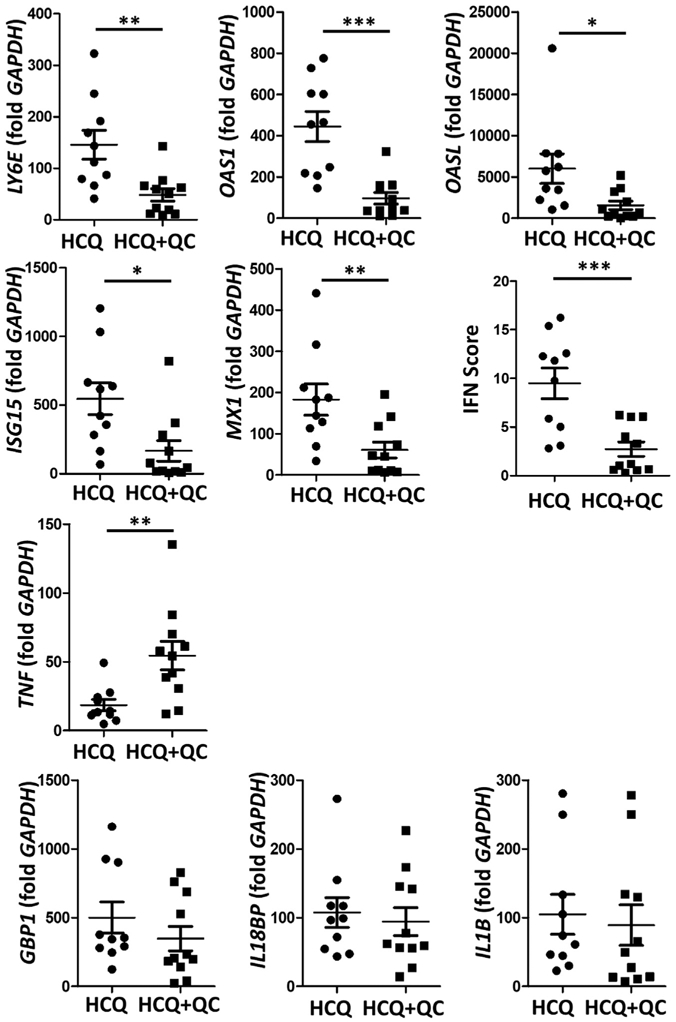
Gene expression of type I IFN signatures (LYE, OAS1, OASL, ISG15, and MX1), type II IFN signatures (IL18BP), and other inflammatory cytokines important in lupus pathogenesis (TNF and IL1B) were evaluated by real-time PCR. The mRNA of type I IFN signatures were significantly upregulated in the hydroxychloroquine (HCQ) group (n = 10) compared to the hydroxychloroquine + quinacrine (HCQ+QC) group (n = 11) (LYE P = 0.0037; OAS1 P = 0.0002; OASL P = 0.0067; ISG15 P = 0.01; and MX1 P = 0.0083), with a significantly higher IFN score calculated for 5 type I IFN–regulated genes in the HCQ group, while TNF was significantly higher in the HCQ+QC group (P = 0.003). The graphs show mean ± SEM. *P < 0.05; **P < 0.01; ***P < 0.001.
QC reduces the production of TNF-α and IL-6 from TLR3-, TLR7-, and TLR8-stimulated peripheral blood mononuclear cells more profoundly compared to HCQ
Effects of HCQ and QC on intracellular TLR-mediated inflammatory cytokine production were evaluated by ELISA. Peripheral blood mononuclear cells (PBMCs) isolated from CLE patients were stimulated with double-stranded RNA (dsRNA), imiquimod, and single-stranded RNA (ssRNA) to respectively evaluate the TLR3-, TLR7-, and TLR8-mediated production of TNF-α, IL-6, and IFN-α. QC significantly reduced TNF-α secretion from the dsRNA- (P < 0.01), imiquimod- (P < 0.01), and ssRNA- (P < 0.001) stimulated PBMCs of CLE patients, whereas HCQ was not able to inhibit TNF-α production (Figure 3a, 3d, and 3g). QC also significantly downregulated IL-6 secretion from the dsRNA- (P < 0.001), imiquimod- (P < 0.05), and ssRNA- (P < 0.001) stimulated PBMCs of CLE patients, while HCQ could not suppress the IL-6 production (Figure 3b, 3e, and 3h). However, IFN-α secretion from dsRNA-, imiquimod, and ssRNA-stimulated CLE PBMCs was significantly suppressed by both QC and HCQ (Figure 3c, 3f, and 3i).
Figure 3. Effects of HCQ and QC on intracellular TLR-mediated inflammatory cytokine production.
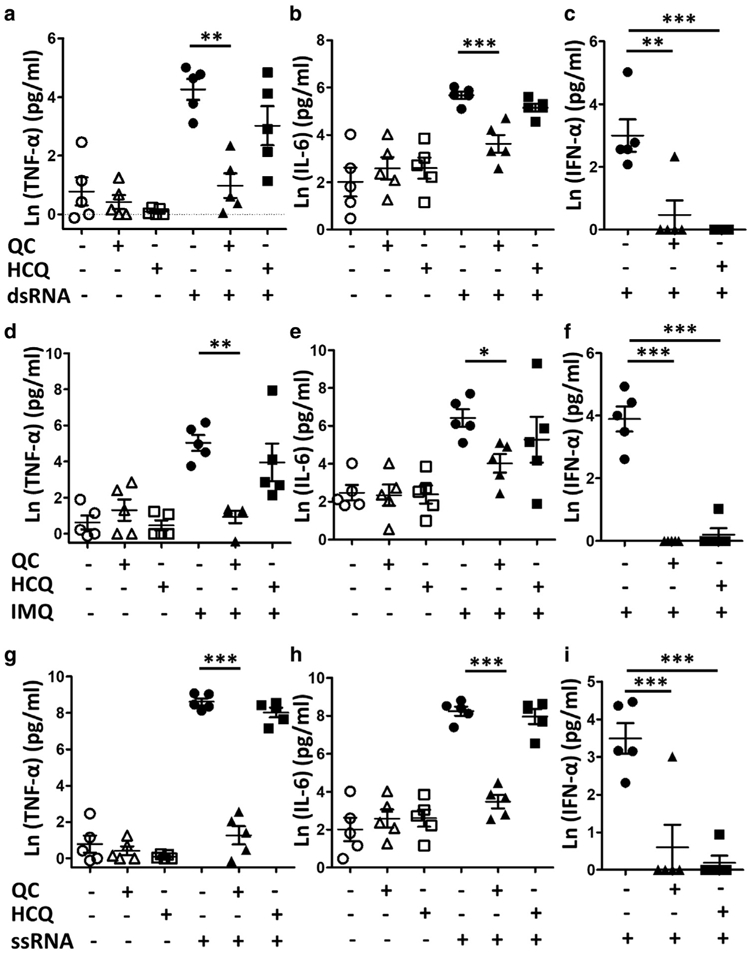
Peripheral blood mononuclear cells isolated from five cutaneous lupus erythematosus patients were stimulated with (a–c) dsRNA, (d–f) IMQ, and (g–i) ssRNA to evaluate the TLR3-, TLR7-, and TLR8-mediated production of (a, d, g) TNF-α, (b, e, h) IL-6, and (c, f, i) IFN-α by ELISA. The graphs show mean ± SEM and natural log of raw ELISA concentration values of each cytokine (n = 5). dsRNA, double-stranded RNA; HCQ, hydroxychloroquine; IMQ, imiquimod; QC, quinacrine; ssRNA, single-stranded RNA; TLR, toll-like receptor. *P < 0.05; **P < 0.01; ***P < 0.001.
Quinacrine decreases active NF-κB in PBMCs TLR8-stimulated PBMCs
p65 (Rel) is a subunit of NF-κB transcription complex, which plays a key role in inflammatory and immune responses, including TNF signaling cascades (Baud and Karin, 2001;Wulczyn et al., 1996). In this study, PBMCs isolated from CLE patients were treated with increasing concentrations of QC (0.25–1 μg/ml) and HCQ (1 μg/ml) for 3 hours, with or without ssRNA stimulation. The TNF-α level in the culture medium was evaluated by ELISA and activation of NF-κB was evaluated by Western blot for phospho-p65. Both concentrations of QC effectively inhibited TNF-α secretion and active NF-κB, while HCQ could not (Figure 4, P < 0.001). Higher concentration of QC (1 μg/ml) showed a stronger effect compared to lower concentration (0.25 μg/ml) (P < 0.001).
Figure 4. Effects of HCQ and QC on NF-κB activation.
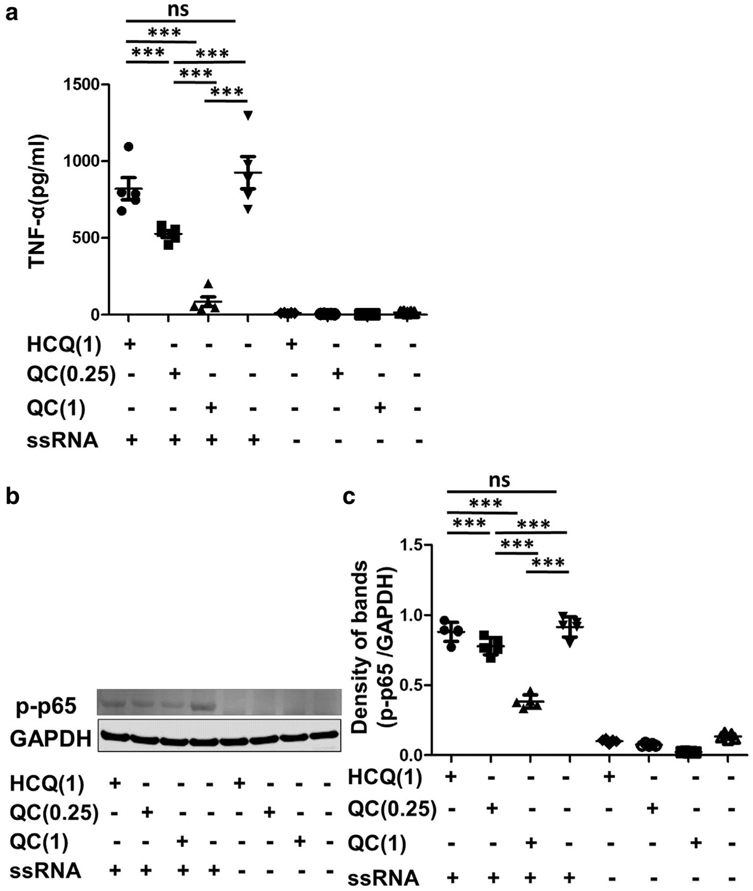
Peripheral blood mononuclear cells isolated from five cutaneous lupus patients were treated with increasing concentrations of QC (0.25–1 μg/ml) and HCQ (1 μg/ml) for 3 hours, with or without ssRNA stimulation. (a) TNF-α level in the culture medium after 3 hours was evaluated by ELISA. (b) Representative band from Western blot analysis for activated NF-κB (phospho-p65). GAPDH was used as the loading control. (c) The density of each band was analyzed with ImageJ software (National Institutes of Health, Bethesda, MD) and presented as fold changes normalized to GAPDH. p-p65, phospho-p65. The graphs show mean ± SEM (n = 5). GAPDH, glyceraldehyde-3-phosphate dehydrogenase; HCQ, hydroxychloroquine; QC, quinacrine; ssRNA, single-stranded RNA. ***P < 0.001.
DISCUSSION
Although antimalarials are treatment of choice for CLE, not all CLE patients respond equally to antimalarials (Walling and Sontheimer, 2009). Other than smoking, which has been well-demonstrated to directly exacerbate LE disease activity and interfere with the efficacy of antimalarials (Chasset et al., 2015; Jewell and McCauliffe, 2000), there have been no studies of the factors or mechanisms affecting the treatment responsiveness to antimalarials in CLE patients. Identifying biomarkers for responsiveness to a certain therapy would be helpful to individualize treatments and to improve patient compliance.
Our study investigated distinct features of the inflammatory cell population and proinflammatory cytokine pathways on antimalarial treatment response heterogeneity in CLE patients. Pro-inflammatory cytokines, including IFN-μ, TNF-α, and IL-6, are well known key players in the pathogenesis of CLE. Not only SLE but also CLE patients have increased type I IFN signaling and increased expression of type I IFN–regulated transcripts and proteins in lupus lesional skin (Meller et al., 2005;Wenzel et al., 2005, 2007). The IFNregulated gene signature was elevated in patients with SCLE and DLE, and correlated with the CLASI score (Braunstein et al., 2012). TNF-α was also upregulated in lesional skin of DLE and SCLE compared to controls (Toro et al., 2000; Zampieri et al., 2006). TNF-α was produced by PBMCs, to which monocytes and mDCs mainly contributed (Nabatian et al., 2012). In this study, we investigated whether the inflammatory cell composition and cytokine profiles are different among the patients with different responsiveness to antimalarials. While HCQ-responsive patients had significantly higher type I IFN–regulated transcripts, their TNF-α level was lower than HCQ-refractory patients. Patients who were refractory to HCQ, thus needing addition of QC (HCQ+QC), had significantly upregulated TNF-α gene expression along with increased mDCs in lesional skin, suggesting that increased population of mDCs and their production of TNF-α could contribute to HCQ refractoriness of CLE patients. Previously, TNF-α was demonstrated to be highly expressed in refractory skin lesions of patients with SCLE (Zampieri et al., 2006). There was no significant difference when we evaluated the differences in the number of mDCs, pDCs, and cytokine expression stratified by CLE subtype and CLASI activity score. We analyzed the effect of CLASI activity score by both correlation and CLASI high/low group analysis, and there was no difference with either analysis. The subgroup analysis by CLE subtype and CLASI activity score in each treatment response group showed that the number of mDCs were increased in the combined SCLE and DLE patients in the HCQ+QC group compared to the HCQ group. There was no meaningful difference according to the CLASI activity score.
The mode of action of antimalarials in CLE is still elusive, but potent inhibition of intracellular TLR is one of the possible mechanisms (Kuznik et al., 2011). TLRs are linked to signal transduction via a homophilic interaction involving their cytoplasmic TIR domain and a family of adaptor molecules that also contain the TIR sequence (Re and Strominger, 2004). Ten TLRs are grouped into extracellular and intracellular subtypes. Different components of microbial cells could activate extracellular TLRs, while TLR3, TLR7/TLR8, and TLR9 recognize viral dsRNA, ssRNA, and unmethylated CpG DNA, respectively. Activation of intracellular TLRs by immune complexes formed by the antimicrobial peptides, such as cathelicidin and human β-defensin-2, and self-nucleic acids released by impaired clearance initiate autoimmune processes (Lande et al., 2007). Self-DNA or RNA-containing immune complexes engage TLR9 or TLR7 expressed in pDCs, respectively, induce type I IFN production, finally leading to T-cell activation (Lovgren et al., 2004). The pDC-type I IFN axis is considered a key pathologic mechanism in lupus (Lovgren et al., 2004). Direct binding of antimalarials to nucleic acids masks their TLR-binding epitope and may also explain the TLR inhibition by antimalarials (Kuznik et al., 2011). Antimalarials also effectively decrease the production of inflammatory cytokines, including TNF-α, IL-6, IFN-μ, and IFN-γ (Alves et al., 2017; van den Borne et al., 1997; Wozniacka et al., 2006). Antimalarials inhibited IFN-α–enhanced TNF-α and STAT4 expression in monocytes (Lopez et al., 2014). In order to evaluate whether different antimalarials have different abilities to suppress the production of proinflammatory cytokines and the involvement of TLR, we stimulated TLR3, TLR7, and TLR8 in PBMCs isolated from healthy control and CLE patients. We found QC had greater inhibition of TLR3-, TLR7-, and TLR8-stimulated production of TNF-α and IL-6 compared to HCQ, while both QC and HCQ similarly inhibited IFN-μ production.
MyD88 and TRIF are two main adaptor pathways in TLR signaling transduction, leading to induction of gene expression via transcription factors, such as NF-κB, AP-1, or IFN response factors 1, 3, 5, and 7. TLR pathwayassociated proteins, including IRAK, TRAF, and NF-κB, are particularly dysregulated in autoimmune diseases (Chen et al., 2016). In this study, we found that QC significantly reduced active NF-κB from ssRNA-stimulated PBMCs, while HCQ was not able to inhibit active NF-κB production. This is consistent with the enhanced suppression of downstream inflammatory cytokines, TNF-α and IL-6, by QC relative to HCQ.
Although the results of this study were not validated in an independent cohort, this study suggests that increased numbers of mDCs with higher TNF-α expression might contribute to HCQ refractoriness, necessitating the addition of QC for control of certain CLE patients. Differential suppression of NF-κB activation, TNF-α, and IL-6 by HCQ and QC could also affect antimalarial response in CLE patients. The increased number of mDCs and higher TNF-α in CLE patients could be used as a predictive factor of refractoriness to HCQ and responsiveness to QC.
PATIENTS AND METHODS
Patients
Forty-nine patients diagnosed with CLE and nine healthy controls were recruited from the Department of Dermatology at the Hospital of the University of Pennsylvania in accordance with an approved Institutional Review Board protocol. All subjects provided written informed consent. The patients were grouped according to their response to antimalarial treatment: (i) HCQ group (n = 22), who were responsive to HCQ; and (ii) HCQ + QC group (n = 27), who were refractory to HCQ and responded to additional QC. We defined the treatment failure to HCQ as continued skin activity requiring a second intervention after at least 2 months of HCQ therapy. Lesional skin was biopsied before starting treatment with antimalarials.
Immunohistochemistry
Thirty-nine skin biopsies of CLE patients (SCLE; n = 16, DLE; n = 23) were immunohistochemically investigated for the presence of pDCs, mDCs, neutrophils, and macrophages by employing antibodies against CD123, CD11c, myeloperoxidase, and MAC387, respectively. Paraffin-embedded skin biopsies were cut into 5-μm sections and placed on glass slides. Slides were placed in a 60°C oven overnight, deparaffinized with xylene substitute (CitriSolv, Fisher Scientific, Fair Lawn, NJ), and rehydrated with serial ethanol dilutions. Peroxidase was deactivated using 0.3% H2O2 dissolved in deionized H2O for 5 minutes. Sections were blocked using protein block (Dako, Carpinteria, CA) and then incubated overnight at 4°C with primary antibodies to the following antigens CD123 (Clone 7G3, dilution 1:200; BD Biosciences, San Jose, CA), CD11c (Clone EP1347Y, dilution 1:200; Novus Biologicals, Littleton, CO), myeloperoxidase (Clone EPR4792, dilution 1:400; Abcam, Cambridge, MA), and macrophage (MAC387, dilution 1:150; Abcam) followed by biotinylated link universal and streptavidin-horseradish peroxidase (Dako). NOVAred chromogen (Vector Laboratories, Burlingame, CA) was used to develop stain. Sections were dehydrated, and set with Permount (Fisher Scientific, Fair Lawn, NJ) and glass coverslips. Skin sections were examined by Nikon Eclipse 80i digital microscope (Nikon Instruments Inc., Melville, NY) and positive stained cells were quantified at ×40 objective magnification in five non-overlapping adjacent microscopic fields in the dermis. The results were expressed as mean number of cells.
RNA extraction from formalin fixed paraffin-embedded tissue and quantitative real-time reverse transcriptase PCR
Skin samples from 21 CLE patients were analyzed by quantitative real-time reverse transcriptase PCR for gene expression of type I IFN signature genes (LY6E, OAS1, OASL, ISG15, MX1, GBP1, and IL18BP) and inflammatory cytokines TNF-α and IL-1β. Total RNA was extracted from formalin-fixed paraffin-embedded tissue with RNeasy FFPE Kit (Qiagen, CA), and cDNA was synthesized using a High-Capacity cDNA Reverse Transcription Kit (Applied Biosystems, Carlsbad, CA) in accordance with the manufacturer’s protocol. Real-time PCR was performed using the Taqman gene expression assays (LY6E, Hs00158942_m1; OAS1, Hs00242943_m1; OASL, Hs00388714_m1; ISG15, Hs00192713_m1; MX1, Hs00182073_m1; GBP1, Hs00977005_m1; IL18BP, Hs00271720_m1; TNF-α, Hs01113624_g1; IL1β, Hs01555409_g1; and GAPDH, Hs99999905_m1). The level of gene transcript was normalized to glyceraldehyde-3-phosphate dehydrogenase. For each sample, real-time PCR was performed in triplicate and quantified using the comparative CT method (ΔΔCt) (Livak and Schmittgen, 2001).
Calculation of IFN score
We calculated the IFN scores by first normalizing the expression values within each gene of the 5 type I IFN–regulated genes (LYE6, OAS1, OASL, ISG15, and MX1), so that the average value would be 1.0. Then the normalized values were summed for each sample to obtain the IFN score.
PBMCs isolation, stimulation, and culture
The PBMCs were isolated from heparinized venous blood of nine CLE patients and nine healthy controls on an endotoxin-free Ficoll-Paque PLUS gradient (GE Healthcare Bio-Sciences AB, Uppsala, Sweden). Isolated PBMCs (2.5 × 10⁶ PBMCs per well) were plated into cell culture plates containing 1.5 ml RPMI 1640 (1×) [+] L-glutamine [−] phenol red medium (Gibco Life Technologies, Grand Island, NY), 10% fetal bovine serum, and 1% penicillinstreptomycin. The PBMCs were subsequently treated with 3 μM concentrations of HCQ (Sigma-Aldrich, St. Louis, MO) or QC dihydrochloride (Sigma-Aldrich) for 18 hours at 37°C and 5% CO2. To also test the effect of these drugs on stimulated versus unstimulated PBMCs, 10 μg/ml polyinosinic-polycytidylic acid (dsRNA, TLR3 agonist), 1 μg/ml imiquimod (R837-TLR7 agonist), and 1 μg/ml ssRNA (TLR8 agonist) (InvivoGen, San Diego, CA) were employed to stimulate secretion of cytokines. After 18 hours, cell-free supernatants were collected. PBMC viability assessed by trypan blue staining showed that 99.2% of sham-treated cells, 97.8% of cells treated with 1 μg/ml QC and TLR8, and 98.2% of cells treated with 1 μg/ml HCQ and TLR8 were viable.
Quantification of TNF-α, IFN-μ, and IL-6 secretion by ELISA
The concentrations of TNF-α, IFN-μ, and IL-6 secreted into the supernatants were then quantified in triplicate via ELISA according to the manufacturer’s protocol (BD OptEIA Human TNF-α ELISA Set, BD Biosciences, San Diego, CA; VeriKine Human IFN-μ ELISA, PBL Assay Science, Piscataway, NJ; Human IL-6 ELISA, Thermo Scientific, Frederick, MD).
Western blot
Total cellular lysates were prepared using radioimmune precipitation assay lysis buffer (Cell Signaling Technology, Beverly, MA); 10 μg protein was loaded and separated on a 4–12% bis-Tris gel (Invitrogen, Carlsbad, CA) and then transferred to a polyvinylidene fluoride membrane (Novex, Carlsbad, CA). Membranes were blocked with Odyssey blocking buffer (LI-COR, Lincoln, NE) for 1 hour at room temperature and then incubated overnight at 4°C with primary antibodies to phospho-NF-κB p65 (Ser536) (93H1) were diluted in 1× phosphate buffered saline with 0.1% Tween 20. Thereafter, the membranes were washed with phosphate buffered saline with 0.1% Tween 20 and the bound antibodies were blotted with biotinylated-secondary antibody for 1 hour (Li-COR).
Statistical analysis
Statistical analysis was performed using GraphPad Prism software (GraphPad Software, Inc, La Jolla, CA). We used χ2 test or Fisher’s exact test to evaluate whether smoking status, presence of associated SLE, cicatricial alopecia, disseminated DLE, and hypertrophic DLE is associated with treatment response to antimalarials. One-way analysis of variance with Bonferroni’s multiple comparison test was used to compare the level of TNF-α, IFN-μ, and IL-6 after stimulation with each TLR agonist and treatment with HCQ and QC. Unpaired t test was used to compare CLASI activity score, the number of American College of Rheumatology criteria in SLE fulfilled, the number of each cell type and gene expression between HCQ and QC responsive groups. Values of P < 0.05 were considered significant.
Supplementary Material
ACKNOWLEDGMENTS
This work was supported by National Institutes of Health (R21 AR066286 and K24-AR 02207) and Veterans Affairs Merit Review (I01BX000706) to Victoria P. Werth.
Abbreviations:
- CLASI
Cutaneous Lupus Erythematosus Disease Area and Severity Index
- CLE
cutaneous lupus erythematosus
- DLE
discoid lupus erythematosus
- dsRNA
double-stranded RNA
- HCQ
hydroxychloroquine
- LE
lupus erythematosus
- mDC
myeloid dendritic cell
- PBMC
peripheral blood mononuclear cell
- pDC
plasmacytoid dendritic cell
- QC
quinacrine
- SCLE
subacute cutaneous lupus erythematosus
- ssRNA
single-stranded RNA
- TLR
toll-like receptor
Footnotes
CONFLICT OF INTEREST
The authors state no conflict of interest.
SUPPLEMENTARY MATERIAL
Supplementary material is linked to the online version of the paper at www.jidonline.org, and at https://doi.org/10.1016/j.jid.2018.07.041.
REFERENCES
- Alves P, Bashir MM, Wysocka M, Zeidi M, Feng R, Werth VP. Quinacrine suppresses tumor necrosis factor-alpha and IFN-μlpha in dermatomyositis and cutaneous lupus erythematosus. J Investig Dermatol Symp Proc 2017;18:S57–63. [DOI] [PMC free article] [PubMed] [Google Scholar]
- Baud V, Karin M. Signal transduction by tumor necrosis factor and its relatives. Trends Cell Biol 2001;11:372–7. [DOI] [PubMed] [Google Scholar]
- Braunstein I, Klein R, Okawa J, Werth VP. The interferon-regulated gene signature is elevated in subacute cutaneous lupus erythematosus and discoid lupus erythematosus and correlates with the cutaneous lupus area and severity index score. Br J Dermatol 2012;166:971–5. [DOI] [PMC free article] [PubMed] [Google Scholar]
- Chang AY, Piette EW, Foering KP, Tenhave TR, Okawa J, Werth VP. Response to antimalarial agents in cutaneous lupus erythematosus: a prospective analysis. Arch Dermatol 2011;147:1261–7. [DOI] [PMC free article] [PubMed] [Google Scholar]
- Chasset F, Frances C, Barete S, Amoura Z, Arnaud L. Influence of smoking on the efficacy of antimalarials in cutaneous lupus: a meta-analysis of the literature. J Am Acad Dermatol 2015;72:634–9. [DOI] [PubMed] [Google Scholar]
- Chen JQ, Szodoray P, Zeher M. Toll-like receptor pathways in autoimmune diseases. Clin Rev Allergy Immunol 2016;50:1–17. [DOI] [PubMed] [Google Scholar]
- Fabbri P, Cardinali C, Giomi B, Caproni M. Cutaneous lupus erythematosus: diagnosis and management. Am J Clin Dermatol 2003;4:449–65. [DOI] [PubMed] [Google Scholar]
- Feng X, Wu H, Grossman JM, Hanvivadhanakul P, FitzGerald JD, Park GS, et al. Association of increased interferon-inducible gene expression with disease activity and lupus nephritis in patients with systemic lupus erythematosus. Arthritis Rheum 2006;54:2951–62. [DOI] [PubMed] [Google Scholar]
- Gilliam JN, Sontheimer RD. Distinctive cutaneous subsets in the spectrum of lupus erythematosus. J Am Acad Dermatol 1981;4:471–5. [DOI] [PubMed] [Google Scholar]
- Jewell ML, McCauliffe DP. Patients with cutaneous lupus erythematosus who smoke are less responsive to antimalarial treatment. J Am Acad Dermatol 2000;42:983–7. [PubMed] [Google Scholar]
- Kalia S, Dutz JP. New concepts in antimalarial use and mode of action in dermatology. Dermatol Ther 2007;20:160–74. [DOI] [PMC free article] [PubMed] [Google Scholar]
- Klein R, Moghadam-Kia S, LoMonico J, Okawa J, Coley C, Taylor L, et al. Development of the CLASI as a tool to measure disease severity and responsiveness to therapy in cutaneous lupus erythematosus. Arch Dermatol 2011;147:203–8. [DOI] [PMC free article] [PubMed] [Google Scholar]
- Kuhn A, Ochsendorf F, Bonsmann G. Treatment of cutaneous lupus erythematosus. Lupus 2010;19:1125–36. [DOI] [PubMed] [Google Scholar]
- Kuznik A, Bencina M, Svajger U, Jeras M, Rozman B, Jerala R. Mechanism of endosomal TLR inhibition by antimalarial drugs and imidazoquinolines. J Immunol 2011;186:4794–804. [DOI] [PubMed] [Google Scholar]
- Lande R, Gregorio J, Facchinetti V, Chatterjee B, Wang YH, Homey B, et al. Plasmacytoid dendritic cells sense self-DNA coupled with antimicrobial peptide. Nature 2007;449(7162):564–9. [DOI] [PubMed] [Google Scholar]
- Livak KJ, Schmittgen TD. Analysis of relative gene expression data using real-time quantitative PCR and the 2(-Delta Delta C(T)) method. Methods 2001;25:402–8. [DOI] [PubMed] [Google Scholar]
- Lopez P, Rodriguez-Carrio J, Suarez A. Antimalarial drugs inhibit IFNalphaenhanced TNFalpha and STAT4 expression in monocytes: implication for systemic lupus erythematosus. Cytokine 2014;67:13–20. [DOI] [PubMed] [Google Scholar]
- Lovgren T, Eloranta ML, Bave U, Alm GV, Ronnblom L. Induction of interferon-alpha production in plasmacytoid dendritic cells by immune complexes containing nucleic acid released by necrotic or late apoptotic cells and lupus IgG. Arthritis Rheum 2004;50:1861–72. [DOI] [PubMed] [Google Scholar]
- Meller S, Winterberg F, Gilliet M, Muller A, Lauceviciute I, Rieker J, et al. Ultraviolet radiation-induced injury, chemokines, and leukocyte recruitment: an amplification cycle triggering cutaneous lupus erythematosus. Arthritis Rheum 2005;52:1504–16. [DOI] [PubMed] [Google Scholar]
- Nabatian AS, Bashir MM, Wysocka M, Sharma M, Werth VP. Tumor necrosis factor alpha release in peripheral blood mononuclear cells of cutaneous lupus and dermatomyositis patients. Arthritis Res Ther 2012;14(1):R1. [DOI] [PMC free article] [PubMed] [Google Scholar]
- Oh SH, Roh HJ, Kwon JE, Lee SH, Kim JY, Choi HJ, et al. Expression of interleukin-17 is correlated with interferon-alpha expression in cutaneous lesions of lupus erythematosus. Clin Exp Dermatol 2011;36:512–20. [DOI] [PubMed] [Google Scholar]
- Re F, Strominger JL. Heterogeneity of TLR-induced responses in dendritic cells: from innate to adaptive immunity. Immunobiology 2004;209:191–8. [DOI] [PubMed] [Google Scholar]
- Spann CR, Callen JP, Klein JB, Kulick KB. Clinical, serologic and immunogenetic studies in patients with chronic cutaneous (discoid) lupus erythematosus who have verrucous and/or hypertrophic skin lesions. J Rheumatol 1988;15:256–61. [PubMed] [Google Scholar]
- Toro JR, Finlay D, Dou X, Zheng SC, LeBoit PE, Connolly MK. Detection of type 1 cytokines in discoid lupus erythematosus. Arch Dermatol 2000;136: 1497–501. [DOI] [PubMed] [Google Scholar]
- van den Borne BE, Dijkmans BA, de Rooij HH, le Cessie S, Verweij CL. Chloroquine and hydroxychloroquine equally affect tumor necrosis factor-alpha, interleukin 6, and interferon-gamma production by peripheral blood mononuclear cells. J Rheumatol 1997;24:55–60. [PubMed] [Google Scholar]
- Wahie S, Daly AK, Cordell HJ, Goodfield MJ, Jones SK, Lovell CR, et al. Clinical and pharmacogenetic influences on response to hydroxychloroquine in discoid lupus erythematosus: a retrospective cohort study. J Invest Dermatol 2011;131:1981–6. [DOI] [PubMed] [Google Scholar]
- Walling HW, Sontheimer RD. Cutaneous lupus erythematosus: issues in diagnosis and treatment. Am J Clin Dermatol 2009;10:365–81. [DOI] [PubMed] [Google Scholar]
- Wenzel J, Worenkamper E, Freutel S, Henze S, Haller O, Bieber T, et al. Enhanced type I interferon signalling promotes Th1-biased inflammation in cutaneous lupus erythematosus. J Pathol 2005;205:435–42. [DOI] [PubMed] [Google Scholar]
- Wenzel J, Zahn S, Mikus S, Wiechert A, Bieber T, Tuting T. The expression pattern of interferon-inducible proteins reflects the characteristic histological distribution of infiltrating immune cells in different cutaneous lupus erythematosus subsets. Br J Dermatol 2007;157:752–7. [DOI] [PubMed] [Google Scholar]
- Wozniacka A, Carter A, McCauliffe DP. Antimalarials in cutaneous lupus erythematosus: mechanisms of therapeutic benefit. Lupus 2002;11:71–81. [DOI] [PubMed] [Google Scholar]
- Wozniacka A, Lesiak A, Narbutt J, McCauliffe DP, Sysa-Jedrzejowska A. Chloroquine treatment influences proinflammatory cytokine levels in systemic lupus erythematosus patients. Lupus 2006;15:268–75. [DOI] [PubMed] [Google Scholar]
- Wulczyn FG, Krappmann D, Scheidereit C. The NF-kappa B/Rel and I kappa B gene families: mediators of immune response and inflammation. J Mol Med (Berl) 1996;74(12):749–69. [DOI] [PubMed] [Google Scholar]
- Zampieri S, Alaibac M, Iaccarino L, Rondinone R, Ghirardello A, Sarzi-Puttini P, et al. Tumour necrosis factor alpha is expressed in refractory skin lesions from patients with subacute cutaneous lupus erythematosus. Ann Rheum Dis 2006;65:545–8. [DOI] [PMC free article] [PubMed] [Google Scholar]
Associated Data
This section collects any data citations, data availability statements, or supplementary materials included in this article.