

Abstract
Background
Physical activity (PA), particularly outdoor PA, may have dual effects on cardiovascular disease (CVD) risk: health benefits of exercise and potential harmful effects attributable to increased exposure to air pollution. We examined the combined effects of PA and air pollution on CVD.
Methods and Results
Sampling from a nationwide cohort study of the Korean National Health Insurance Service, we examined 189 771 adults aged ≥40 years who underwent health examination between 2009 and 2010. PA was measured with a questionnaire on the weekly frequency and intensity. Ambient levels of particulate matter 10, 2.5 (PM10, PM2.5) were estimated by the residency of participants. We conducted Cox proportional hazard regression analysis to estimate the relationship between CVD risk and combined effects of PA and air pollution. Subjects with moderate to vigorous PA ≥5 times/week and high PM10 exposure had lower risk of CVD (adjusted hazard ratio [aHR], 0.73; 95% CI, 0.62–0.87), coronary heart disease (aHR, 0.76; 95% CI, 0.59–0.98), and stroke (aHR, 0.70; 95% CI, 0.56–0.88). The inverse association between PA and CVD risk was consistent when the analysis was performed for subjects with low/moderate PM10 exposure. When using PM2.5 data, the results were also consistent.
Conclusions
Moderate to vigorous PA appeared to reduce the risk of CVD within groups of both high and low PM10 or PM2.5 levels. Further studies are needed to validate whether the health benefits of PA outweigh the potential harmful effects resulting from increased exposure to air pollution during PA.
Keywords: air pollution, cardiovascular disease, particulate matter, physical activity
Subject Categories: Cardiovascular Disease, Exercise, Epidemiology, Primary Prevention, Risk Factors
Nonstandard Abbreviations and Acronyms
- CVD
cardiovascular disease
- PA
physical activity
- HR
hazard ratio
- PM
particulate matter
- NHIS
National Health Insurance Service
- ICD
International Classification of Diseases
- CHD
coronary heart disease
Clinical Perspective
What Is New?
This study including 189 771 participants followed up for 3 years investigated whether the health benefits of physical activity outweigh the potential harmful effects caused by enhanced exposure to air pollution or not.
Participants engaging in moderate to vigorous physical activity ≥5 times/week had decreased risk of cardiovascular disease within groups of both high and low particulate matter 10.
The protective effect of moderate to vigorous physical activity on the risk of cardiovascular disease was maintained within groups of both high and low particulate matter 2.5 except for coronary heart disease.
What Are the Clinical Implications?
These results suggest that moderate to vigorous physical activity might be recommended for people without problems related to cardiopulmonary disease wherever they live.
Cardiovascular disease (CVD) remains the most common cause of death globally.1 According to The Global Burden of Disease study, an estimated 17.6 million global deaths per year were attributable to CVD between 2006 to 2016, which causes more deaths than any other disease.1 Thus, identifying and controlling the protective factors or risk factors of CVD that may contribute to the morbidity or mortality is important.
Many protective factors and risk factors of CVD have been discovered. Among them, the combined effects of physical activity (PA) and air pollution on CVD have been attracting great interest. Physical activity has long been recognized for its health benefits which are associated with the reduced all‐cause mortality including protective effects for CVD.2, 3, 4, 5 Outdoor PA, however, might be related with negated health benefits or increased CVD risk when exposing to air pollution. Exposure to air pollution which is associated with the increase in mortality has been known for its harmful effects on human health.6, 7, 8, 9 Especially, evidences emerge from recent studies that suggest the air pollution, such as particulate matter 10 (PM10) or PM2.5, is strongly associated with the CVD incidence and mortality.10, 11, 12 The trade‐off between the potential harmful effects induced by increased exposure to air pollution while doing outdoor PA and the health benefits attributable to increased PA are still in dispute.6
To date, only 1 study has examined the combined effects of PA and air pollution on CVD mortality in the Danish Diet, Cancer, and Health cohort. Yet, this study did not include CVD incidence as the outcome variable and PM10, PM2.5 as the exposure variables which are the strong risk factors for CVD as well as the most important components of air pollution.12 Furthermore, in this study, PA was not assessed by the frequency and intensity which are also important variables of PA to identify the precise combined effects that PA and air pollution have with CVD.
Until now, there is not enough evidence to better understand whether the health benefits of PA outweigh the potential harmful effects caused by augmented exposure to air pollution or not. We examined the exact combined effects of PA and air pollution on CVD.
Methods
The data will not be made available to other researchers for purposes of reproducing the results or replicating the procedure.
Study Population
The National Health Insurance Service (NHIS) provides obligatory health insurance for Korean population covering various forms of health care, and the health examinations are conducted biennially for all individuals aged 40 years or older.13 The NHIS‐National Sample Cohort, randomly sampled from the NHIS database to ensure the representativeness of Korean citizens, includes data from sociodemographic characteristics, medical treatment history, hospital admission, outpatient department visits, pharmaceutical prescription, and general health examination. A total of 1 025 340 eligible participants of the cohort (2.2% of the entire eligible population) was randomly extracted from 2002 NHIS database. These participants were followed until 2013.
In this study, participants who underwent health examination between 2009 and 2010 were selected because the contents of examination and questionnaire for PA were changed in 2009. When analyzing the combined effect of PA and PM10 on cardiovascular disease, among the 256 432 participants aged ≥40 years who took health examinations between 2009 and 2010, 51 820 participants who were diagnosed with CVD as well as 412 participants who died before the index date of January 1, 2011 were excluded. Then, 8280 participants with missing values on PM10 and 2439 participants with missing values on PA were also excluded. In addition, 3710 participants with missing values on covariates were excluded. Finally, 189 771 participants were included in this study and were followed up from January 1, 2011 to December 31, 2013. Figure 1 presents the flow diagram of selecting study participants.
Figure 1.
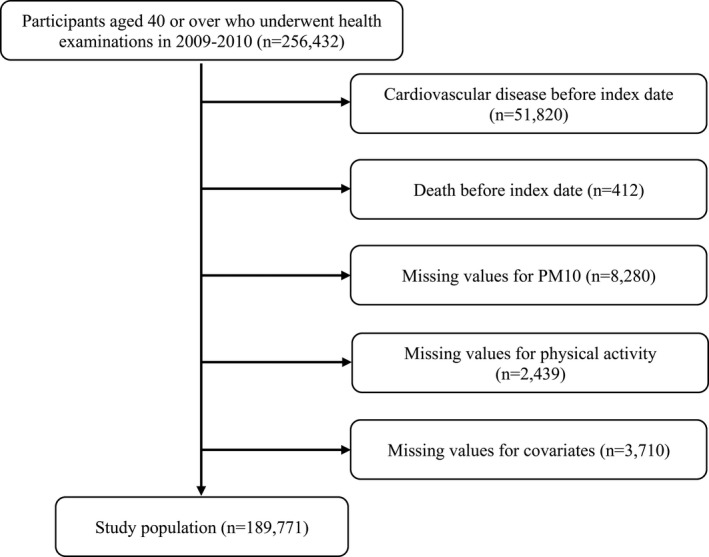
Flow diagram of selection of study participants.
When analyzing the combined effect of PA and PM2.5 on cardiovascular disease, participants residing in 3 metropolitan cities (Seoul, Busan, and Incheon) which are the first, second, and third most populated cities in South Korea were selected because only the 3 metropolitan cities have measured PM2.5 regularly. Although the regional factor might contribute to the discrepancy in the rates of cardiovascular events between PM10 cohort and PM2.5 cohort, considering that the 3 metropolitan cities’ dense population accounts for 1/3 of Korea's whole population, they are suitable locations for this study. There are detailed administrative residential districts in each city which are called “gu”, and there are 25 gus in Seoul, 16 gus in Busan, and 9 gus in Incheon. Figure S1 shows the distribution of population density of the cohort. Figure S2 shows the flow diagram of selecting study participants, and a total of 59 115 participants were included in this study. The study was approved by the Institutional Review Board at the Seoul National University Hospital (Institutional Review Board number: E‐1803‐045‐928). The requirement for informed consent from individuals was waived because NHIS‐National Sample Cohort database is anonymized according to the strict confidentiality guidelines.
Assessment of Physical Activity
PA was measured using health examination between 2009 and 2010 with a questionnaire on the weekly frequencies of PA, and it was categorized by 3 levels of intensity as follows: light (≥30 min/day; eg, light exercise, walk for work or for leisure), moderate (≥30 min/day; eg, fast/brisk walking, tennis, bicycle riding, cleaning), and vigorous (≥20 min/day; eg, running, aerobics, high‐speed cycling, mountain hiking). Exercises that induce normal level of breath, such as walking at a normal pace, were defined as light‐intensity PA. Exercises that induce slight shortness of breath, such as fast walking or tennis (doubles), were defined as moderate‐intensity PA. Exercises that induce shortness of breath, such as running or aerobics, were defined as vigorous‐intensity PA. We especially focused on moderate to vigorous‐intensity PA according to Physical Activity Guidelines for Americans, Second edition, in 201814, 15 and categorized into 4 groups: none, 1 to 2 times, 3 to 4 times, ≥5 times (recommendation of Physical Activity Guidelines for Americans, Second edition)/week.
Estimation of Individual Air Pollution Exposure
We obtained monitoring data on the PM10 and PM2.5 from the National Ambient air Monitoring System (https://www.airkorea.or.kr) to estimate each participant's air pollution exposure. Using National Ambient air Monitoring System, daily air pollution data can be collected from ≈300 atmospheric monitoring sites in Korea. We collected air pollution data from January 2009 to December 2010 and calculated the cumulative air pollutant levels of PM10 and PM2.5 for each participant using annual average concentrations. Since NHIS‐National Sample Cohort provides the information about residential district of each participant, calculated PM10 and PM2.5 levels were linked with the individuals’ residential district code. A total of 218 residential districts were identified from NHIS‐National Sample Cohort, and if there were unmonitored locations, we used data of PM10 and PM2.5 levels from the nearest monitoring spot. Figure S1 shows the distribution of air pollution (PM10 and PM2.5) exposure, and Figure S3 indicates the frequency distribution of PM10 and PM2.5 concentrations among the study participants. We categorized the air pollution exposure by 2 levels (high versus moderate/low) which is separated by the 70th percentile of exposure range (55.13 μg/m3 for PM 10 and 27.86 μg/m3 for PM2.5) in this cohort, which is presented using reference lines in Figure S3.
CVD Events
We used hospital admission records and International Classification of Diseases, Tenth Revision (ICD‐10) to identify CVD which is the primary outcome, coronary heart disease (CHD), and stroke which are the secondary outcomes. We defined CVD events as ≥2 days of hospitalization or death because of ICD‐10 codes which are main‐diagnosis or sub‐diagnosis on CVD to exclude the cases that did not occur to be genuine CVD.16 According to American Health Association guidelines, we used ICD‐10 codes to identify the CVD including CHD and stroke which are divided from CVD as follows: cardiovascular disease (ICD‐10 codes, I20–I25, I60–I69), coronary heart disease (ICD‐10 codes, I20–I25), and stroke (ICD‐10 codes, I60–I69).17
Statistical Analysis
Individuals in this study were followed up starting on January 1, 2011, and they were censored at the date of the event of CVD including CHD and stroke, or December 31, 2013, whichever came first. We performed Cox proportional hazards regression analysis to estimate the hazard ratios (HR) and 95% CI of CVD, CHD, and stroke based on the combined effects of the moderate to vigorous PA and PM10 or PM2.5 exposure. The effects of joint categories of the moderate to vigorous PA and PM10 or PM2.5 exposure were calculated by comparing all category groups with a reference group which includes participants with no moderate to vigorous PA and low/moderate PM10 or PM2.5 exposure. We developed multivariable model adjusting for age, sex, household income (first, second, third, and fourth quartiles), body mass index, smoking (never, former, and current smoker), alcohol intake (0, 1–2, 3–4, and ≥5 times/week), systolic blood pressure, fasting serum glucose, total cholesterol, and Charlson Comorbidity Index. Household income was estimated based on each participant's insurance premium. We used ICD‐10 codes for major comorbidities from 2009 to 2010 to estimate Charlson Comorbidity Index. The scaled Schoenfeld residual method was used to examine the proportional hazard assumption.
Secondary Cox proportional hazards regression analyses were conducted to estimate the HR and 95% CI of CVD, CHD, and stroke according to moderate to vigorous PA categories when stratified by the level of PM10 or PM2.5, and presented an interaction term between each PA and PM10 or PM2.5. In addition, subgroup analyses were performed by various factors such as sociodemographic factors (age, sex, and income) or health behavior and health status (smoking status, alcohol consumption, body mass index, and Charlson Comorbidity Index).
The statistical significance level was defined as P<0.05, and the probability values were 2‐sided. We conducted all analyses and data collection using STATA ver. 13.0 (STATA Corp) and SAS ver. 9.4 (SAS Institute Inc).
Results
Table 1 (whole country) and Table S1 (3 metropolitan cities) show the descriptive characteristics of study participants which were examined using descriptive statistics. According to Table 1, during the 561 299 person‐years of follow‐up, a total of 3393 CVD events (1478 CHD events; 1946 stroke events) occurred. Participants doing more PA tended to be relatively younger, men, and never or former smokers. They also had normal range of body mass index, higher income, higher blood pressure, higher fasting glucose, and lower total cholesterol values. In addition, participants with low/moderate level of PM10 or PM2.5 exposure were more physically active compared with those with high level of PM10 or PM2.5 exposure.
Table 1.
General Characteristics of the Study Participants
| None | Frequencies of Moderate to Vigorous PA (Per Wk) | |||
|---|---|---|---|---|
| 1 to 2 | 3 to 4 | ≥5 | ||
| Number of people | 94 300 | 33 737 | 25 252 | 36 482 |
| Air pollution, mean (SD) | ||||
| PM10, μg/m3 | 52.22 (7.33) | 52.45 (7.28) | 52.25 (7.27) | 52.01 (7.22) |
| Age, y, mean (SD) | 52.5 (10.5) | 49.1 (8.5) | 50.2 (9.1) | 52.2 (9.5) |
| Age, y, n (%) | ||||
| 40 to 50 | 36 610 (38.82) | 17 388 (51.54) | 11 534 (45.68) | 13 388 (36.70) |
| 50 to 60 | 29 297 (31.74) | 10 812 (32.05) | 8562 (33.91) | 12 846 (35.21) |
| 60 to 70 | 17 736 (18.81) | 4027 (11.94) | 3831 (15.17) | 7501 (20.56) |
| ≥70 | 10 027 (10.63) | 1510 (4.48) | 1325 (5.25) | 2747 (7.53) |
| Body mass index, kg/m2, mean (SD) | 23.7 (3.1) | 23.8 (3.0) | 23.9 (3.0) | 24.0 (2.8) |
| Body mass index, kg/m2, n (%) | ||||
| <18.5 | 2871 (3.04) | 830 (2.46) | 511 (2.02) | 620 (1.70) |
| 18.5 to 22.9 | 37 087 (39.33) | 13 025 (38.61) | 9394 (37.20) | 13 172 (36.11) |
| 23.0 to 24.9 | 24.213 (25.68) | 9107 (26.99) | 6817 (27.00) | 10 389 (28.48) |
| 25.0 to 29.9 | 27 169 (28.81) | 9799 (26.99) | 7762 (30.74) | 11 281 (30.92) |
| ≥30.0 | 2960 (3.14) | 976 (2.89) | 768 (3.04) | 1020 (2.80) |
| Sex, n (%) | ||||
| Men | 39 399 (41.78) | 18 771 (55.64) | 13 734 (54.39) | 19 408 (53.20) |
| Women | 54 901 (58.22) | 14 966 (44.36) | 11 518 (45.61) | 17 074 (46.80) |
| Household income, quartile, n (%) | ||||
| First (highest) | 25 989 (27.56) | 12 142 (35.99) | 9537 (37.77) | 13 262 (36.35) |
| Second | 29 131 (30.89) | 10 142 (30.06) | 7447 (29.49) | 10 627 (29.13) |
| Third | 23 016 (24.41) | 6990 (20.72) | 4828 (19.12) | 7397 (20.28) |
| Fourth (lowest) | 16 164 (17.14) | 4463 (13.23) | 3440 (13.62) | 5196 (14.24) |
| Smoking, n (%) | ||||
| Never | 65 454 (69.41) | 19 363 (57.39) | 14 984 (59.34) | 22 574 (61.88) |
| Former | 9834 (10.43) | 5751 (17.05) | 4726 (18.26) | 7198 (19.73) |
| Current | 19 012 (20.16) | 8623 (25.56) | 5542 (21.95) | 6710 (18.39) |
| Alcohol intake, times per week, mean (SD) | 0.9 (1.6) | 1.1 (1.4) | 1.1 (1.5) | 1.1 (1.6) |
| Alcohol intake, times per wk, n (%) | ||||
| 0 | 61 135 (64.83) | 15 903 (47.14) | 12 314 (48.76) | 19 068 (52.27) |
| 1 to 2 | 20 967 (22.23) | 13 006 (38.55) | 9118 (36.11) | 11 361 (31.14) |
| 3 to 4 | 7466 (7.92) | 3602 (10.68) | 2866 (11.35) | 4095 (11.22) |
| ≥5 | 4732 (5.02) | 1226 (3.63) | 954 (3.78) | 1958 (5.37) |
| Systolic blood pressure, mm Hg, mean (SD) | 123.5 (15.8) | 122.5 (14.8) | 122.8 (14.8) | 123.9 (15.07) |
| Fasting serum glucose, mg/dL, mean (SD) | 99.2 (25.1) | 98.5 (24.0) | 99.2 (24.6) | 99.8 (24.4) |
| Total cholesterol, mg/dL, mean (SD) | 200.3 (37.4) | 200.1 (36.2) | 199.9 (36.5) | 199.2 (36.7) |
| Charlson Comorbidity Index, mean (SD) | 1.5 (1.4) | 1.3 (1.3) | 1.4 (1.4) | 1.5 (1.5) |
| Charlson Comorbidity Index, n (%) | ||||
| 0 | 26 074 (27.65) | 10 778 (31.95) | 7563 (29.95) | 10 196 (27.95) |
| 1 | 30 875 (32.74) | 11 626 (34.46) | 8503 (33.67) | 11 843 (32.46) |
| ≥2 | 37 351 (39.61) | 11 333 (33.59) | 9186 (36.38) | 14 443 (39.59) |
PA indicates physical activity; and PM, particulate matter.
Figure 2 showed that higher frequency of moderate to vigorous PA was significantly associated with lower risk of CVD, CHD, and stroke among individuals with low/moderate level of PM10 exposure and individuals with high level of PM10 exposure. Compared with individuals in the no moderate to vigorous PA and low/moderate PM10 exposure group, participants with moderate to vigorous PA ≥5 times/week and high PM10 exposure had lower risk of CVD (adjusted hazard ratio [aHR], 0.73; 95% CI, 0.62–0.87), CHD (aHR, 0.76; 95% CI, 0.59–0.98), and stroke (aHR, 0.70; 95% CI, 0.56–0.88). Subjects with moderate to vigorous PA ≥5 times/week and low/moderate PM10 exposure also had lower risk of CVD (aHR, 0.84; 95% CI, 0.75–0.93), CHD (aHR, 0.80; 95% CI, 0.68–0.95), and stroke (aHR, 0.86; 95% CI, 0.75–0.99). The inverse association between the frequency of moderate to vigorous PA and stroke was stronger among subjects with low/moderate level of PM10 exposure. According to Table 2, these trends did not change when stratifying the participants into low/moderate PM10 exposure and high PM10 exposure groups, and no significant effect modification of the negative relationship between moderate to vigorous PA and the risk of CVD (P for interaction=0.692), CHD (P for interaction=0.879), and stroke (P for interaction=0.515) was detected by the level of PM10 exposure.
Figure 2. Combined effects of moderate to vigorous PA and PM10 on (A) CVD, (B) CHD, and (C) stroke risk.
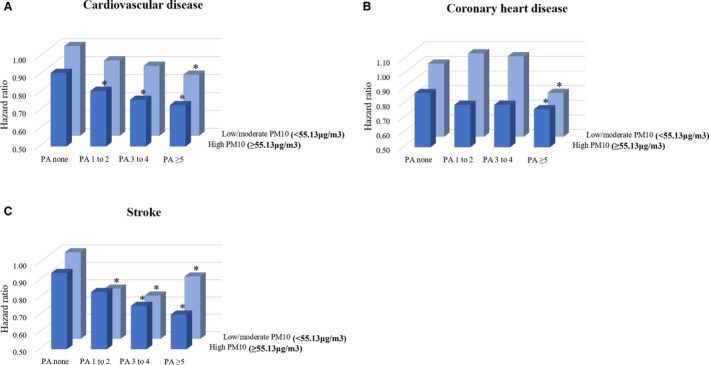
aHR (95% CI) were calculated using Cox proportional hazards regression analysis after adjusting for age, sex, household income, body mass index, smoking, alcohol intake, systolic blood pressure, fasting serum glucose, total cholesterol, and Charlson Comorbidity Index (where *P<0.05). Individuals with no moderate to vigorous PA and low/moderate PM10 exposure are the reference group for all aHRs. aHR indicates adjusted hazard ratio; CHD, coronary heart disease; CVD, cardiovascular disease; PA, physical activity; and PM, particulate matter.
Table 2.
Hazard Ratios for Cardiovascular Disease Risk According to Frequencies of Moderate to Vigorous PA Stratified by Level of PM10
| Frequencies of Moderate to Vigorous PA (Per Wk) | P for Trend | P for Interaction | ||||
|---|---|---|---|---|---|---|
| None | 1 to 2 | 3 to 4 | ≥5 | |||
| Number of people | ||||||
| Low/moderate PM10 (<55.13 μg/m3) | 65 296 | 23 110 | 17 635 | 25 951 | <0.001 | |
| High PM10 (≥55.13 μg/m3) | 29 004 | 10 627 | 7617 | 10 531 | ||
| Cardiovascular disease | ||||||
| Low/Moderate PM10 (<55.13 μg/m3) | 0.7 | |||||
| Events, n (%) | 1389 (2.13) | 350 (1.51) | 281 (1.59) | 448 (1.73) | ||
| Person‐years | 192 508 | 68 589 | 52 293 | 76 847 | ||
| aHR (95% CI) | 1.00 (reference) | 0.92 (0.82–1.04) | 0.89 (0.78–1.01) | 0.83 (0.74–0.92) | <0.001 | |
| High PM10 (≥55.13 μg/m3) | ||||||
| Events, n (%) | 539 (1.86) | 135 (1.27) | 97 (1.27) | 154 (1.46) | ||
| Person‐years | 85 681 | 31 559 | 22 602 | 31 220 | ||
| aHR (95% CI) | 1.00 (reference) | 0.89 (0.73–1.08) | 0.85 (0.68–1.06) | 0.82 (0.69–0.99) | 0.020 | |
| Coronary heart disease | ||||||
| Low/moderate PM10 (<55.13 μg/m3) | 0.9 | |||||
| Events, n (%) | 572 (0.88) | 182 (0.79) | 147 (0.83) | 188 (0.72) | ||
| Person‐years | 192 508 | 68 589 | 52 293 | 76 847 | ||
| aHR (95% CI) | 1.00 (reference) | 1.08 (0.91–1.29) | 1.05 (0.87–1.26) | 0.80 (0.67–0.94) | 0.027 | |
| High PM10 (≥55.13 μg/m3) | ||||||
| Events, n (%) | 215 (0.74) | 59 (0.56) | 45 (0.56) | 70 (0.66) | ||
| Person‐years | 85 681 | 31 559 | 22 602 | 31 220 | ||
| aHR (95% CI) | 1.00 (reference) | 0.88 (0.66–1.19) | 0.90 (0.65–1.25) | 0.89 (0.67–1.17) | 0.3 | |
| Stroke | ||||||
| Low/moderate PM10 (<55.13 μg/m3) | 0.5 | |||||
| Events, n (%) | 832 (1.27) | 171 (0.74) | 134 (0.76) | 262 (1.01) | ||
| Person‐years | 192 508 | 68 589 | 52 293 | 76 847 | ||
| aHR (95% CI) | 1.00 (reference) | 0.79 (0.67–0.94) | 0.75 (0.62–0.90) | 0.85 (0.74–0.98) | 0.003 | |
| High PM10 (≥55.13 μg/m3) | ||||||
| Events, n (%) | 332 (1.14) | 78 (0.73) | 53 (0.70) | 84 (0.80) | ||
| Person‐years | 85 681 | 31 559 | 22 602 | 31 220 | ||
| aHR (95% CI) | 1.00 (reference) | 0.89 (0.69–1.14) | 0.81 (0.60–1.08) | 0.76 (0.60–0.97) | 0.016 | |
Adjusted hazard ratio (95% CI) were calculated using Cox proportional hazards regression analysis after adjusting for age, sex, household income, body mass index, smoking, alcohol intake, systolic blood pressure, fasting serum glucose, total cholesterol, and Charlson Comorbidity Index. aHR indicates adjusted hazard ratio; PA, physical activity; and PM, particulate matter.
When conducting subgroup analyses, although the statistical significance was attenuated in several subgroups, the results and trends of most subgroup analyses were consistent with the overall result of whole group analysis for CVD risk except for subjects with body mass index <18.5 and low/moderate PM10 exposure (aHR, 2.25; 95% CI, 1.21–4.18). Results of subgroup analyses were summarized in Figure 3 and Figure S4.
Figure 3. Adjusted hazard ratio (95% CI) of CVD by subgroups according to the (A) low PM10 and (B) high PM10.
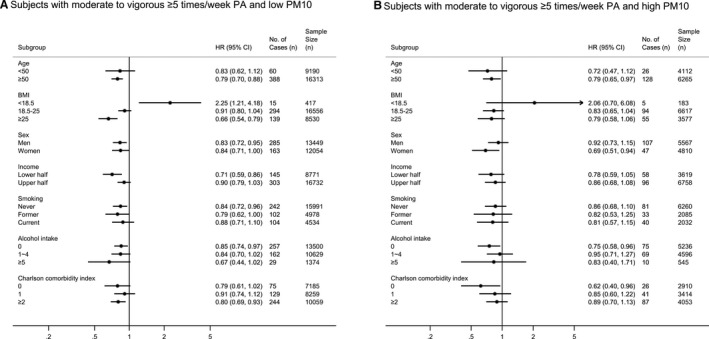
All adjusted hazard ratios (95% CI) shown above are adjusted for age, sex, household income, body mass index, smoking, alcohol intake, systolic blood pressure, fasting serum glucose, total cholesterol, and Charlson Comorbidity Index. Individuals with no moderate to vigorous PA are the reference group for all subgroup analyses. aHR indicates adjusted hazard ratio; CVD, cardiovascular disease; PA, physical activity; and PM, particulate matter.
When using PM2.5 as an exposure variable instead of PM10, overall results and trends were similar with those of PM10. Figure 4 indicated higher frequency of moderate to vigorous PA was significantly related with lower risk of CVD and stroke among individuals with low/moderate level of PM2.5 exposure and individuals with high level of PM2.5 exposure. Compared with individuals in the no moderate to vigorous PA and low/moderate PM2.5 exposure group, Subjects with moderate to vigorous PA ≥5 times/week and high PM2.5 exposure had decreased risk of CVD (aHR, 0.62; 95% CI, 0.45–0.86) and stroke (aHR, 0.52; 95% CI, 0.32–0.83). Participants with moderate to vigorous PA ≥5 times/week and low/moderate PM2.5 exposure also had lower risk of CVD (aHR, 0.74; 95% CI, 0.60–0.91) and stroke (aHR, 0.68; 95% CI, 0.50–0.91). On the other hand, these inverse associations were attenuated in the relationship between higher frequency of moderate to vigorous PA and CHD. The inverse association between the frequency of moderate to vigorous PA and stroke was stronger among subjects with low/moderate level of PM2.5 exposure. Table 3 indicated that these trends were consistent when stratifying the participants into low/moderate PM2.5 exposure and high PM2.5 exposure groups, and no significant effect modification of the negative relationship between moderate to vigorous PA and the risk of CVD (P for interaction=0.501) and stroke (P for interaction=0.689) was detected by the level of PM2.5 exposure.
Figure 4. Combined effects of moderate to vigorous PA and PM2.5 on (A) CVD, (B) CHD, and (C) stroke risk.
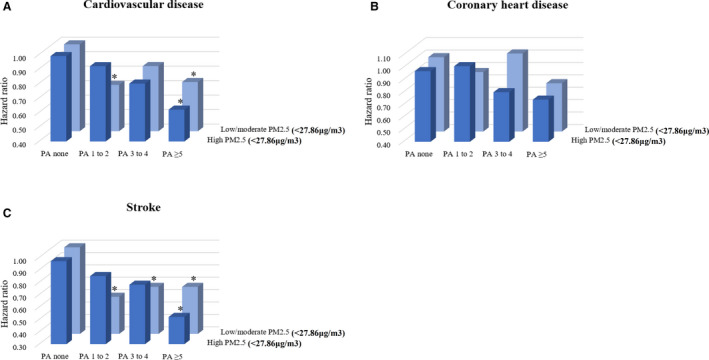
Adjusted hazard ratio (95% CI) were calculated using Cox proportional hazards regression analysis after adjusting for age, sex, household income, body mass index, smoking, alcohol intake, systolic blood pressure, fasting serum glucose, total cholesterol, and Charlson Comorbidity Index (where *P<0.05). Individuals with no moderate to vigorous PA and low/moderate PM2.5 exposure are the reference group for all adjusted hazard ratios. aHR indicates adjusted hazard ratio; CHD, coronary heart disease; CVD, cardiovascular disease; PA, physical activity; and PM, particulate matter.
Table 3.
Hazard Ratios for Cardiovascular Disease Risk According to Frequencies of Moderate to Vigorous PA Stratified by Level of PM2.5
| Frequencies of Moderate to Vigorous PA (Per Wk) | P for Trend | P for Interaction | ||||
|---|---|---|---|---|---|---|
| None | 1 to 2 | 3 to 4 | ≥5 | |||
| Number of people | ||||||
| Low/moderate PM2.5 (<27.86 μg/m3) | 18 947 | 7792 | 5843 | 8419 | ||
| High PM2.5 (≥27.86 μg/m3) | 8990 | 3241 | 2395 | 3488 | ||
| Cardiovascular disease | ||||||
| Low/moderate PM2.5 (<27.86 μg/m3) | 0.5 | |||||
| Events, n (%) | 337 (1.78) | 85 (1.09) | 83 (1.42) | 118 (1.40) | ||
| Person‐years | 56 039 | 23 191 | 17 353 | 24 974 | ||
| aHR (95% CI) | 1.00 (reference) | 0.73 (0.57–0.93) | 0.86 (0.67–1.09) | 0.74 (0.60–0.91) | 0.005 | |
| High PM2.5 (≥27.86 μg/m3) | ||||||
| Events, n (%) | 161 (1.79) | 46 (1.42) | 32 (1.34) | 41 (1.18) | ||
| Person‐years | 26 587 | 9620 | 7106 | 10 348 | ||
| aHR (95% CI) | 1.00 (reference) | 0.91 (0.65–1.27) | 0.80 (0.54–1.17) | 0.62 (0.44–0.88) | 0.006 | |
| Coronary heart disease | ||||||
| Low/moderate PM2.5 (<27.86 μg/m3) | 0.7 | |||||
| Events, n (%) | 150 (0.79) | 49 (0.63) | 48 (0.82) | 59 (0.70) | ||
| Person‐years | 56 039 | 23 191 | 17 353 | 24 974 | ||
| aHR (95% CI) | 1.00 (reference) | 0.89 (0.64–1.24) | 1.05 (0.75–1.46) | 0.79 (0.59–1.08) | 0.2 | |
| High PM2.5 (≥27.86 μg/m3) | ||||||
| Events, n (%) | 69 (0.77) | 24 (0.74) | 15 (0.63) | 22 (0.63) | ||
| Person‐years | 26 587 | 9620 | 7106 | 10 348 | ||
| aHR (95% CI) | 1.00 (reference) | 1.00 (0.62–1.61) | 0.82 (0.46–1.44) | 0.73 (0.45–1.19) | 0.2 | |
| Stroke | ||||||
| Low/moderate PM2.5 (<27.86 μg/m3) | 0.7 | |||||
| Events, n (%) | 193 (1.02) | 38 (0.49) | 35 (0.60) | 59 (0.70) | ||
| Person‐years | 56 039 | 23 191 | 17 353 | 24 974 | ||
| aHR (95% CI) | 1.00 (reference) | 0.61 (0.43–0.86) | 0.68 (0.47–0.97) | 0.68 (0.50–0.91) | 0.003 | |
| High PM2.5 (≥27.86 μg/m3) | ||||||
| Events, n (%) | 92 (1.02) | 23 (0.71) | 17 (0.71) | 19 (0.54) | ||
| Person‐years | 26 587 | 9620 | 7106 | 10 348 | ||
| aHR (95% CI) | 1.00 (reference) | 0.86 (0.54–1.37) | 0.78 (0.46–1.32) | 0.53 (0.32–0.87) | 0.012 | |
Adjusted hazard ratios (95% CI) were calculated using Cox proportional hazards regression analysis after adjusting for age, sex, household income, body mass index, smoking, alcohol intake, systolic blood pressure, fasting serum glucose, total cholesterol, and Charlson Comorbidity Index. aHR indicates adjusted hazard ratio; PA, physical activity; and PM, particulate matter.
Figure 5 and Figure S5 presented the results of subgroup analyses. Although the statistical significance was attenuated in some subgroups, the results and trends of most subgroup analyses were similar with the overall result of whole group analysis for CVD risk.
Figure 5. Adjusted hazard ratio (95% CI) of CVD by subgroups according to the (A) low PM2.5 and (B) high PM2.5.
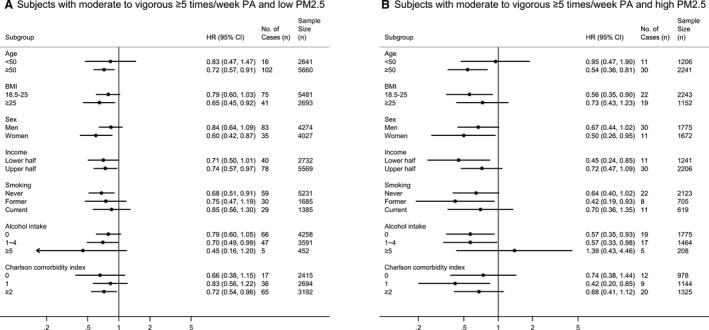
All adjusted hazard ratios (95% CI) shown above are adjusted for age, sex, household income, body mass index, smoking, alcohol intake, systolic blood pressure, fasting serum glucose, total cholesterol, and Charlson Comorbidity Index. Individuals with no moderate to vigorous PA are the reference group for all subgroup analyses. aHR indicates adjusted hazard ratio; CVD, cardiovascular disease; PA, physical activity; and PM, particulate matter.
Although there was a discrepancy in the proportion of gus with high PM2.5 among 3 metropolitan cities (3 of 25 gus in Seoul, 3 of 16 gus in Busan, and 8 of 9 gus in Incheon with high PM2.5), according to Table S2, the overall results were consistent after adjusting for location.
Discussion
In a nationwide, longitudinal, large cohort study, we found that engaging in moderate to vigorous PA ≥5 times/week was significantly associated with a decreased risk of CVD which was defined as ≥2 days of hospitalization or death because of ICD‐10 codes on CVD within groups of both high and low PM10 among individuals without CVD previously. The protective effect of moderate to vigorous PA on CVD risk was maintained within groups of both high and low PM2.5 except for coronary heart disease. The level of PM10 or PM2.5 did not significantly modify the health effects of moderate to vigorous PA on CVD. To our knowledge, this is the first study to identify that high frequency of moderate to vigorous PA is associated with lower risk of CVD within groups of both high and low levels of PM10 or PM2.5 exposure.
According to a previous study, the trade‐off between the potential harmful effects caused by augmented exposure to air pollution while doing outdoor PA and the positive health effects because of increased PA remains unclear.6 Several studies emphasized the augmented harmful effects of air pollution because outdoor PA may induce the amplified inhalation and deposition of air pollutants attributable to high frequency breathing.6 In terms of the underlying mechanisms for the negative impacts of PM on CVD, there are 2 kinds of pathways. The first is the direct pathway that PM2.5 directly penetrates into the blood stream and is deposited on target organ, especially heart, after migration. The others are the indirect pathways. For the indirect pathways, the effects of PM on CVD are mediated by pulmonary oxidative stress and systemic inflammatory response, and these indirect pathways happen after a few hours or days of inhalation.18, 19 Communication on the autonomic nervous system through specific lung receptors is also an indirect pathway.18 These pathways may contribute to cardiovascular damage and cause CVD. Therefore, doing PA in a polluted environment might cause higher harmful health effects because of the amplified inhalation of air pollutants despite the health benefits of PA.20
Despite previously stated adverse effects of air pollution, PA may still exert the health benefits and modify or reduce the health risks or mortality from air pollution by improving cardiopulmonary function.21, 22, 23 PA greatly enhances aerobic capacity and improves cardiorespiratory fitness and metabolic factors on CVD.24 Furthermore, PA is considerably beneficial to control various CVD risk factors, including controlling body weight, improving insulin sensitivity, glycemic control, and inflammatory defense systems. PA has also beneficial effects for reducing blood pressure, atherogenic dyslipidemia (such as high triglycerides, reduced high‐density lipoprotein cholesterol, elevated low‐density lipoprotein cholesterol, and various lipoprotein disorders), fibrinolysis, and endothelial dysfunction.25 Therefore, doing PA in polluted atmosphere may not be always harmful to health. Rather, the beneficial effects of PA may outweigh the harmful effects caused by air pollution.
Interestingly, although harmful effects of chronic exposure to PM on CVD are well known as mentioned above, the increased moderate to vigorous PA, especially when following the Physical Activity Guidelines for Americans, was significantly correlated with the decreased risk of CVD within groups of both high and low levels of PM10 or PM2.5 in this study. This result might indicate that acute damages to cardiovascular system, such as vascular impairment, arterial stiffness, and reduced blood flow,26, 27, 28 which are caused by short‐term exposure to PM during PA, may be temporary or recoverable and do not diminish long‐term positive effects of PA on CVD.23 In addition, this might indicate that additional inhalation of air pollutants induced by PA because of increased inhalation during PA seems to not be enough to enhance the risk of the incidence or mortality of CVD because it only accounts for a small portion of total inhalation of air pollutants in a day.29
Recently, the importance of PA was reemphasized by publication of the Physical Activity Guidelines for Americans,14 which suggest that PA promotes normal growth and prevents many chronic diseases including CVD. According to the current Physical Activity Guidelines from US Department of Health and Human Services/Physical Activity Guidelines Advisory Committee, ≥150 min/week of moderate‐intensity or 75 min/week of vigorous‐intensity aerobic PA or an equivalent combination are recommended for adults to gain health benefits.14, 15 In addition, additional positive health effects are obtained when doing PA over the equivalent of 300 min/week of moderate‐intensity PA.14 Our results strengthen the Physical Activity Guidelines even for subjects who live in areas with severe air pollution level because those who did moderate to vigorous PA ≥5 times/week, which is the same as the recommendation of Physical Activity Guidelines, were significantly associated with the reduced risk of CVD within groups of both high and low levels of PM10 or PM2.5.
Despite the health benefits of PA and recommendations from Physical Activity Guidelines, many adults don't participate in moderate to vigorous PA regularly.14 Among the reasons, air pollution can be considered as a barrier to PA, and previous research showed that some patients exercised less often when the ambient air pollution level was severe, which means the air pollution might discourage PA behavior.30, 31 According to our study results, for individuals without problems related to cardiopulmonary disease, moderate to vigorous PA should not be discouraged because of concerns related to poor air pollution to prevent CVD.
There are some strengths in this study. To our knowledge, this is the first large cohort study to identify the combined effects of PA and air pollution on the risk of CVD, and this is also the first large cohort study for the Asian population to evaluate individual‐level health benefits of moderate to vigorous PA on CVD while also considering individual exposure to air pollution. A study of long‐term effects of air pollution on mortality in Denmark, which has several‐fold lower levels of air pollution than in South Korea, found that those who did PA regularly had lower mortality than those who did not exercise regardless of the level of NO2 (a proxy of air pollution). Our study which identified the combined effect of PA and air pollution, especially on the risk of CVD, was consistent with the results of previous studies even in the areas with more severe air pollution levels. Furthermore, our study supports the results of a rising number of health impact modeling studies which suggest that positive health effects caused by PA (eg, cycling, walking) outweigh the health risks because of augmented inhalation of air pollution during PA.32, 33
This study has several limitations. First, the questionnaire related to PA is not comprehensive enough to represent the outdoor PA because of the limitation of data information. There is lack of information on the changes in each individual's exercise pattern or location if air quality was reported as unhealthy and whether subjects engage in PA outdoors (eg, running in a park), or indoors (eg, running in a gym). Limitation of this data information might contribute to underestimate the harmful effects of air pollution. Most contents of the questionnaires related to PA, however, consist of outdoor physical activities such as tennis, bicycle riding, high‐speed cycling (except for spinning which is indoor exercise), and mountain hiking. Second, the metabolic equivalent times were not estimated for further analyses because the questionnaire related to PA is composed of a minimum time for PA, not the exact quantitative time for PA (eg, frequency [times per week] of ≥20 minutes of vigorous‐intensity PA). Third, we calculated levels of PM10 or PM2.5 at unmonitored sites using data from the nearest monitoring site instead of using geographic information systems which is a tool for interpolation technique. This imperfect estimation might have distorted the results. Fourth, each individual's changes in PA frequency to reduce their exposure when air pollution was severe were not analyzed because of the lack of information in a cohort database. It would be more helpful if further studies are performed based on the accurate measure of exposure to air pollution using the changes in PA frequency depending on the air pollution level. Fifth, the effect of exposure to air pollution in this study was long‐term effect, which is different from the short‐term effect of air pollution exposure. According to a recent study, the combined effect of short‐term exposure to air pollution and PA may be related to higher risk of potential health problems of cardiopulmonary function.34 Therefore, further studies should be conducted to identify the combined effects of short‐term exposure to air pollution and PA on CVD risk. In addition, the results in this study should not be misinterpreted that individuals, especially those with cardiopulmonary disease, are recommended to ignore daily air quality alert and exercise outdoors anytime no matter how severe the air pollution is. Finally, there might be a bias caused by the discrepancy of the prevalence of subclinical CVD or chronic obstructive pulmonary disease among the groups because these conditions may contribute to each individual's level of PA. Although we could not distinguish individuals with subclinical CVD or chronic obstructive pulmonary disease from each group because of the limitation of data information, future studies should consider and address this potential bias.
In conclusion, the increased moderate to vigorous PA seems to have negative association with the risk of CVD within groups of both high and low levels of PM10 or PM2.5. These findings suggest that the health benefits of PA are not modified even for residents in cities with high PM10 or PM2.5 levels, and moderate to vigorous PA might be recommended for older adults without problems related to CVD wherever they live. It will be interesting if further studies are conducted for young people in cohort studies of clinical trials because they grew up with the benefit of PM filtering systems which were developed dramatically during daily activities and work. In addition, further studies should be conducted to identify the exact effects of PM10 or PM2.5 on CVD independent from the effects of PA on CVD, especially using Asian data, because PM levels could influence PA levels. Therefore, although moderate to vigorous PA appeared to reduce the risk of CVD regardless of PM10 or PM2.5 levels, future prospective studies are needed to validate our findings.
Sources of Funding
This study was supported by the Data Science Research Project 2018 by the Seoul National University Big Data Institute (grant number: 2018‐0000) and Seoul National University Hospital Research Fund (grant number: 04‐2018‐0370), and Korea Centers for Disease Control and Prevention (grant number: 2019060E80A‐00). Dr. S.C. received support from the Brain Korea 21‐Plus Education Program by the National Research Foundation of Korea (grant number: 5262‐20180102). Prof. N.K. is supported by a funding from the National Research Foundation of Korea (NRF‐2018R1C1B6008822; NRF‐2018R1A4A1022589).
Disclosures
None.
Supporting information
Tables S1–S2
Figures S1–S5
(J Am Heart Assoc. 2020;9:e013611 DOI: 10.1161/JAHA.119.013611.)
See Editorial by xxx
For Sources of Funding and Disclosures, see page 12.
References
- 1. GBD 2016 Causes of Death Collaborators . Global, regional, and national age‐sex specific mortality for 264 causes of death, 1980–2016: a systematic analysis for the Global Burden of Disease Study 2016. Lancet. 2017;390:1151–1210. [DOI] [PMC free article] [PubMed] [Google Scholar]
- 2. Thompson PD, Buchner D, Pina IL, Balady GJ, Williams MA, Marcus BH, Berra K, Blair SN, Costa F, Franklin B, et al. Exercise and physical activity in the prevention and treatment of atherosclerotic cardiovascular disease: a statement from the Council on Clinical Cardiology (subcommittee on exercise, rehabilitation, and prevention) and the Council on Nutrition, Physical Activity, and Metabolism (subcommittee on physical activity). Circulation. 2003;107:3109–3116. [DOI] [PubMed] [Google Scholar]
- 3. Johnsen NF, Ekblond A, Thomsen BL, Overvad K, Tjonneland A. Leisure time physical activity and mortality. Epidemiology. 2013;24:717–725. [DOI] [PubMed] [Google Scholar]
- 4. Samitz G, Egger M, Zwahlen M. Domains of physical activity and all‐cause mortality: systematic review and dose‐response meta‐analysis of cohort studies. Int J Epidemiol. 2011;40:1382–1400. [DOI] [PubMed] [Google Scholar]
- 5. Schnohr P, Lange P, Scharling H, Jensen JS. Long‐term physical activity in leisure time and mortality from coronary heart disease, stroke, respiratory diseases, and cancer. The Copenhagen City Heart Study. Eur J Cardiovasc Prev Rehabil. 2006;13:173–179. [DOI] [PubMed] [Google Scholar]
- 6. Lu J, Liang L, Feng Y, Li R, Liu Y. Air pollution exposure and physical activity in China: current knowledge, public health implications, and future research needs. Int J Environ Res Public Health. 2015;12:14887–14897. [DOI] [PMC free article] [PubMed] [Google Scholar]
- 7. Miller KA, Siscovick DS, Sheppard L, Shepherd K, Sullivan JH, Anderson GL, Kaufman JD. Long‐term exposure to air pollution and incidence of cardiovascular events in women. N Engl J Med. 2007;356:447–458. [DOI] [PubMed] [Google Scholar]
- 8. Pope CA III, Burnett RT, Thun MJ, Calle EE, Krewski D, Ito K, Thurston GD. Lung cancer, cardiopulmonary mortality, and long‐term exposure to fine particulate air pollution. JAMA. 2002;287:1132–1141. [DOI] [PMC free article] [PubMed] [Google Scholar]
- 9. Pope CA III, Ezzati M, Dockery DW. Fine‐particulate air pollution and life expectancy in the United States. N Engl J Med. 2009;360:376–386. [DOI] [PMC free article] [PubMed] [Google Scholar]
- 10. Luscher TF. Inflammation: the new cardiovascular risk factor. Eur Heart J. 2018;39:3483–3487. [DOI] [PubMed] [Google Scholar]
- 11. Newby DE, Mannucci PM, Tell GS, Baccarelli AA, Brook RD, Donaldson K, Forastiere F, Franchini M, Franco OH, Graham I, et al. Expert position paper on air pollution and cardiovascular disease. Eur Heart J. 2015;36:83–93. [DOI] [PMC free article] [PubMed] [Google Scholar]
- 12. Brook RD, Rajagopalan S, Pope CA III, Brook JR, Bhatnagar A, Diez‐Roux AV, Holguin F, Hong Y, Luepker RV, Mittleman MA, et al. Particulate matter air pollution and cardiovascular disease: an update to the scientific statement from the American Heart Association. Circulation. 2010;121:2331–2378. [DOI] [PubMed] [Google Scholar]
- 13. Cheol Seong S, Kim YY, Khang YH, Heon Park J, Kang HJ, Lee H, Do CH, Song JS, Hyon Bang J, Ha S, et al. Data resource profile: the National Health Information Database of the National Health Insurance Service in South Korea. Int J Epidemiol. 2017;46:799–800. [DOI] [PMC free article] [PubMed] [Google Scholar]
- 14. Piercy KL, Troiano RP, Ballard RM, Carlson SA, Fulton JE, Galuska DA, George SM, Olson RD. The physical activity guidelines for Americans. JAMA. 2018;320:2020–2028. [DOI] [PMC free article] [PubMed] [Google Scholar]
- 15. Powell KE, King AC, Buchner DM, Campbell WW, DiPietro L, Erickson KI, Hillman CH, Jakicic JM, Janz KF, Katzmarzyk PT, et al. The scientific foundation for the physical activity guidelines for Americans, 2nd edition. J Phys Act Health. 2018;16:1–11. [DOI] [PubMed] [Google Scholar]
- 16. Son JS, Choi S, Kim K, Kim SM, Choi D, Lee G, Jeong SM, Park SY, Kim YY, Yun JM, et al. Association of blood pressure classification in Korean young adults according to the 2017 American College of Cardiology/American Heart Association guidelines with subsequent cardiovascular disease events. JAMA. 2018;320:1783–1792. [DOI] [PMC free article] [PubMed] [Google Scholar]
- 17. Writing Group M , Mozaffarian D, Benjamin EJ, Go AS, Arnett DK, Blaha MJ, Cushman M, Das SR, de Ferranti S, Despres JP, Fullerton HJ, et al. Heart disease and stroke statistics—2016 update: a report from the American Heart Association. Circulation. 2016;133:e38–e360. [DOI] [PubMed] [Google Scholar]
- 18. Dockery DW, Stone PH. Cardiovascular risks from fine particulate air pollution. N Engl J Med. 2007;356:511–513. [DOI] [PubMed] [Google Scholar]
- 19. Shrey K, Suchit A, Deepika D, Shruti K, Vibha R. Air pollutants: the key stages in the pathway towards the development of cardiovascular disorders. Environ Toxicol Pharmacol. 2011;31:1–9. [DOI] [PubMed] [Google Scholar]
- 20. Giles LV, Koehle MS. The health effects of exercising in air pollution. Sports Med. 2014;44:223–249. [DOI] [PubMed] [Google Scholar]
- 21. Yu IT, Wong TW, Liu HJ. Impact of air pollution on cardiopulmonary fitness in schoolchildren. J Occup Environ Med. 2004;46:946–952. [DOI] [PubMed] [Google Scholar]
- 22. Kubesch N, De Nazelle A, Guerra S, Westerdahl D, Martinez D, Bouso L, Carrasco‐Turigas G, Hoffmann B, Nieuwenhuijsen MJ. Arterial blood pressure responses to short‐term exposure to low and high traffic‐related air pollution with and without moderate physical activity. Eur J Prev Cardiol. 2015;22:548–557. [DOI] [PubMed] [Google Scholar]
- 23. Andersen ZJ, de Nazelle A, Mendez MA, Garcia‐Aymerich J, Hertel O, Tjonneland A, Overvad K, Raaschou‐Nielsen O, Nieuwenhuijsen MJ. A study of the combined effects of physical activity and air pollution on mortality in elderly urban residents: the Danish Diet, Cancer, and Health Cohort. Environ Health Perspect. 2015;123:557–563. [DOI] [PMC free article] [PubMed] [Google Scholar]
- 24. Williams MA, Haskell WL, Ades PA, Amsterdam EA, Bittner V, Franklin BA, Gulanick M, Laing ST, Stewart KJ; American Heart Association Council on Clinical C . Resistance exercise in individuals with and without cardiovascular disease: 2007 update: a scientific statement from the American Heart Association Council on Clinical Cardiology and Council on Nutrition, Physical Activity, and Metabolism. Circulation. 2007;116:572–584. [DOI] [PubMed] [Google Scholar]
- 25. Bassuk SS, Manson JE. Epidemiological evidence for the role of physical activity in reducing risk of type 2 diabetes and cardiovascular disease. J Appl Physiol (1985). 2005;99:1193–1204. [DOI] [PubMed] [Google Scholar]
- 26. Lundback M, Mills NL, Lucking A, Barath S, Donaldson K, Newby DE, Sandstrom T, Blomberg A. Experimental exposure to diesel exhaust increases arterial stiffness in man. Part Fibre Toxicol. 2009;6:7. [DOI] [PMC free article] [PubMed] [Google Scholar]
- 27. Rundell KW, Caviston R. Ultrafine and fine particulate matter inhalation decreases exercise performance in healthy subjects. J Strength Cond Res. 2008;22:2–5. [DOI] [PubMed] [Google Scholar]
- 28. Shah AP, Pietropaoli AP, Frasier LM, Speers DM, Chalupa DC, Delehanty JM, Huang LS, Utell MJ, Frampton MW. Effect of inhaled carbon ultrafine particles on reactive hyperemia in healthy human subjects. Environ Health Perspect. 2008;116:375–380. [DOI] [PMC free article] [PubMed] [Google Scholar]
- 29. Rojas‐Rueda D, de Nazelle A, Tainio M, Nieuwenhuijsen MJ. The health risks and benefits of cycling in urban environments compared with car use: health impact assessment study. BMJ. 2011;343:d4521. [DOI] [PMC free article] [PubMed] [Google Scholar]
- 30. Fisher JE, Loft S, Ulrik CS, Raaschou‐Nielsen O, Hertel O, Tjonneland A, Overvad K, Nieuwenhuijsen MJ, Andersen ZJ. Physical activity, air pollution, and the risk of asthma and chronic obstructive pulmonary disease. Am J Respir Crit Care Med. 2016;194:855–865. [DOI] [PubMed] [Google Scholar]
- 31. An R, Zhang S, Ji M, Guan C. Impact of ambient air pollution on physical activity among adults: a systematic review and meta‐analysis. Perspect Public Health. 2018;138:111–121. [DOI] [PubMed] [Google Scholar]
- 32. Tainio M, de Nazelle AJ, Götschi T, Kahlmeier S, Rojas‐Rueda D, Nieuwenhuijsen MJ, de Sá TH, Kelly P, Woodcock J. Can air pollution negate the health benefits of cycling and walking? Prev Med. 2016;87:233–236. [DOI] [PMC free article] [PubMed] [Google Scholar]
- 33. Mueller N, Rojas‐Rueda D, Cole‐Hunter T, de Nazelle A, Dons E, Gerike R, Gotschi T, Int Panis L, Kahlmeier S, Nieuwenhuijsen M. Health impact assessment of active transportation: a systematic review. Prev Med. 2015;76:103–114. [DOI] [PubMed] [Google Scholar]
- 34. Qin F, Yang Y, Wang ST, Dong YN, Xu MX, Wang ZW, Zhao JX. Exercise and air pollutants exposure: a systematic review and meta‐analysis. Life Sci. 2019;218:153–164. [DOI] [PubMed] [Google Scholar]
Associated Data
This section collects any data citations, data availability statements, or supplementary materials included in this article.
Supplementary Materials
Tables S1–S2
Figures S1–S5