

Abstract
Background
Primary hypertension in children is often characterized by high pulse pressure that could be attributable to increased ventricular ejection velocities and volumes and/or increased arterial stiffness. The objective of this study was to examine the contributions of cardiac (ventricular ejection) and vascular (systemic vascular resistance, arterial stiffness, and pressure wave reflection) properties to primary hypertension in children and adolescents.
Methods and Results
Children aged 8 to 18 years referred to a tertiary center for evaluation of hypertension and found to have primary hypertension (n=31) were compared with normotensive controls of similar age (n=50). Peripheral (brachial) and central (carotid) blood pressure waveforms and carotid‐femoral pulse wave velocity were measured by tonometry. Left ventricular outflow tract velocities and ejection volumes were measured by echocardiography. Wave separation and wave intensity analysis were used to assess pressure wave propagation. Increased mean arterial pressure in hypertensive children (90±15 versus 76±10 mmHg in hypertensive versus normotensive children; means±SD; P<0.001) was explained by increased heart rate and cardiac output (5.3±2.0 versus 4.5±1.2 L/min adjusted for age and sex; P<0.05) rather than increased systemic vascular resistance (18.0±4.6 versus 19.3±7.3 mmHg/min/mL; P=0.374). A more‐marked increase in pulsatility (peripheral pulse pressure 66±21 versus 46±12 mmHg; P<0.001) was explained by increased proximal aortic stiffness (pulse wave velocity, 3.3±1.4 versus 2.5±0.8 m/s; P<0.005) and increased left ventricular ejection velocity (1.33±0.24 versus 1.21±0.18 m/s; P<0.05).
Conclusions
Cardiac overactivity characterized by increased heart rate and left ventricular ejection velocities and increased proximal pulse wave velocity may be the main cause of primary hypertension in children.
Keywords: arterial pressure, cardiac output, cardiovascular disease, hemodynamics, primary hypertension
Subject Categories: Hypertension, High Blood Pressure
Clinical Perspective
What Is New?
Hypertension in children with primary hypertension is predominantly attributed to overactivity of the heart (increased heart rate and increased ejection velocities) and increased proximal aortic stiffening.
What Are the Clinical Implications?
Given the tracking of hypertension from children to adults, the finding of a cardiac/aortic rather than peripheral vascular cause of primary hypertension has implications for the etiology of hypertension both in children and adults.
It also has implications for the best treatment in children: Clinical trials of interventions designed to reduce cardiac overactivity should be considered.
Hypertension is one of the most important global public health problems, but its etiology, particularly in children, is still poorly understood. In children and young adults, hypertension often takes the form of isolated systolic hypertension with a wide pulse pressure.1 High pulse pressure is also observed in old age, where it has been attributed to stiffening of large elastic arteries limiting the cushioning of blood ejected by the left ventricle by the arterial tree and possibly other hemodynamic effects.2 Arterial stiffening is well recognized as part of an age‐related degenerative process.3 In children, a degenerative process seems unlikely, but other mechanisms of arterial stiffening could occur and there may be other causes of increased pulse pressure, such as an increase in ventricular ejection or increased pressure wave reflection.
The aim of the present study was to characterize central arterial hemodynamics and investigate the mechanisms of primary hypertension in children and adolescents, specifically to examine the contributions of cardiac (left ventricular [LV] ejection velocities and volumes) and vascular (systemic vascular resistance, arterial stiffness, and pressure wave reflection) properties to hypertension.
Methods
Study Population
Data used in this study will be made available to any researcher for the purposes of reproducing the results reported or use in other studies.
Children and adolescents (subsequently referred to as “children”) up to age 18 with primary hypertension referred to the pediatric hypertension clinic of the Evelina London Children's Hospital (London, UK) were consecutively recruited to a prospective observational study investigating the relationship of target organ damage to blood pressure (BP). Age‐matched healthy children were recruited contemporaneously from the local community. Hypertension was defined as average systolic or diastolic BP ≥95th percentile (equivalent to z‐score ≥1.645) or if the patient was on antihypertensive therapy, according to definitions of hypertension in the fourth report on the diagnosis, evaluation, and treatment of high BP in children and adolescents.4 Children with chronic kidney disease or other causes of secondary hypertension were excluded from the study. Additional exclusion criteria included those with congenital heart disease, cardiac arrhythmias, and inability to obtain high‐quality cardiovascular measurements. The institutional ethics committee approved the study, children gave their assent, and all parents gave written informed consent. Anthropometric, clinical, and laboratory data were collected on the day of the research investigations. Healthy children underwent all examinations except for venesection.
BP, Arterial Tonometry, and Pulse Wave Velocity
Hemodynamic measurements were made with children in a supine position in a quiet environment. Peripheral systolic and diastolic BP were measured in triplicate by a trained observer by auscultation, using a calibrated aneroid sphygmomanometer and an appropriate‐size arm cuff according to the British and Irish Hypertension Society guidelines. Given the age‐related change in BP throughout childhood, all peripheral BP measurements were expressed as z‐scores (the number of SDs above or below a population mean assigned a value of zero).4 Radial and carotid pressure waveforms were obtained by applanation tonometry performed by an experienced operator using the SphygmoCor system (AtCor Medical Pty Ltd, Sydney, NSW, Australia). Approximately 10 cardiac cycles were ensemble averaged. Waveforms that did not meet the in‐built quality‐control criteria in the SphygmoCor system were rejected. Peripheral systolic and diastolic BP were used to calibrate radial waveforms and thus to obtain a mean arterial pressure (MAP) through integration of the radial waveform. Carotid waveforms were calibrated from MAP and diastolic brachial BPs on the assumption of the equality of these pressures at central and peripheral sites.5 Carotid‐femoral pulse wave velocity (PWV) was calculated from sequential recordings of the carotid and femoral artery pressure waveforms using the same SphygmoCor device and transducer. The difference in time of pulse arrival between the 2 sites referenced to the R‐wave of the ECG was taken as the transit time. The path length between these 2 sites was estimated from the distance between the sternal notch and femoral artery at the point of applanation and PWV calculated as the quotient of path length and transit time. All measurements were made in triplicate, and mean values were used for analysis.
LV Outflow Tract Flow Velocity and Ejection Volumes
Ultrasound imaging was performed by an experienced operator using the Philips IE33 or Epiq ultrasound system (Philips Healthcare, Andover, MA). Flow velocity in the LV outflow tract (LVOT) was recorded using pulsed wave Doppler obtained from an apical 5‐chamber view. Flow velocity measurements were averaged over at least 3 cardiac cycles. Internal diameter of the LVOT was measured in the parasternal long‐axis view and LVOT area calculated assuming circularity. Direct measurements of time‐resolved LV volume, end‐diastolic volume and end‐systolic volume were also measured using the Philips QLab analysis package (Philips Healthcare) from 2‐dimensional apical views.
Waveform Postprocessing
BP pressure waveforms obtained by tonometry and LVOT flow velocity waveforms were processed offline using custom software written in MATLAB (The MathWorks, Inc, Natick, MA) to characterize waveform morphology, perform forward and backward waveform separation, and hence determine reflection coefficients.
BP Pressure Wave Morphology
The first (P1) and second (P2) systolic shoulders/peaks and end‐systolic (Pes) points of the carotid pressure waveform, and their timings (T1, T2, and Tes) relative to the upstroke of the pressure waveform (Figure 1) were identified as the first and second local minima of the first derivative of the carotid pressure curve and confirmed by visual inspection by an observer blinded to the results. Pulsatile components of pressure at these points (PP1, PP2, and PPes) were obtained by subtracting diastolic BP from P1, P2, and Pes. Augmentation pressure was taken as the difference between P2 and P1. Augmentation index (AIx) was defined as augmentation pressure/central pulse pressure×100%.
Figure 1.
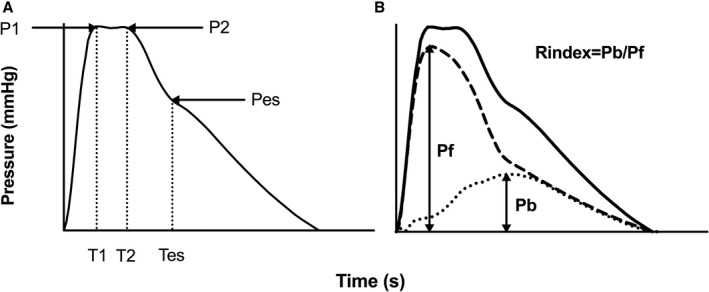
Central (carotid) pressure waveform. (A) Pressure at first systolic shoulder (P1) and second systolic shoulder (P2). (B) Forward (dashed line) and backward (dotted line) wave components that summate to equal total pressure (solid line). Reflection index (Rindex) is defined as the ratio of the magnitude of backward wave (Pb) to that of forward wave (Pf). Pulse pressures at P1, P2, and Pes are denoted by PP1, PP2, and PPes and can be divided into forward and backward components: PP1=PP1f+PP1b.
Flow and Volume Measurements
Aortic flow velocity was multiplied by the LVOT cross‐sectional area to obtain flow, which was integrated over time to obtain the stroke volume (SVflow) and cardiac output (CO) as the product of SV and heart rate (HR). SV was also obtained as the difference between LV end‐diastolic and end‐systolic volumes (SVvol). Ejection volumes (V1 and V2) corresponding to times T1 and T2 were obtained by integration of the aortic flow waveform from the start of systole to T1 and T2.
Forward and Backward Pressure Wave Decomposition and Wave Intensity Analysis
Pressure wave decomposition was performed using Parker's time‐domain approach,6 based on conservation of mass and momentum, to obtain forward (Pf) and backward (Pb) pressure components of central pulse pressure so that: Pf+Pb=P–Pd, where P is total pressure and Pd is the diastolic pressure. Pf and Pb are given by (Equations 1 and 2):
| (1) |
| (2) |
where U is flow velocity, ρ is blood density, and c is proximal aortic PWV, which was estimated using the method of the sum‐of‐squares (PWVss).7 Reflection index was defined as the ratio of amplitude of backward to that of forward wave.
Wave intensity, the flux of wave energy per unit area, was calculated as dI=dPdU and separated into forward and backward components (Equation 3):
| (3) |
Wave intensity is positive for forward waves and negative for those that are traveling in a backward direction. Total wave energy can be obtained by integrating Equation 3 with respect to time.
Determinants of Steady State and Pulsatile Components of BP
Contributions of cardiac and arterial properties to the steady‐state component of BP in hypertensive versus normotensive children were assessed by comparing the percentage difference between MAP in hypertensive and normotensive children with that of CO and systemic vascular resistance (SVR) using the relation MAP=CO×SVR. Cardiac and arterial contributions to greater PP1 (which, in most children, was equal to the central pulse pressure) in hypertensive versus normotensive children were assessed by comparing the difference in PP1 in hypertensive versus normotensive children with that of PWVss and U1, given that previous work has shown that, to a first approximation, for similar LVOT/proximal aortic geometry, PP1 is proportional to PWVss×U1.8
Statistical Analysis
Subject characteristics are presented as means±SD. Comparison of hemodynamic variables between hypertensive and normotensive groups was made using 1‐way ANCOVA, with age and sex included as covariates. Results are presented as adjusted values (means±SE). Comparison of variables between untreated hypertensive and normotensive subjects was also performed. Analysis was performed using SPSS software (version 25; SPSS, Inc, Chicago, IL), and P<0.05 was taken as significant.
Results
Subject Characteristics
Table 1 shows the characteristics of children with hypertension (n=31) and normotensive controls of similar age (n=50). The proportion of male children was greater in the hypertensive compared with the normotensive group, and hypertensive children were taller and heavier, but with similar body mass index. Fifty‐eight percent of children with hypertension had isolated systolic hypertension and 42% systolic‐diastolic hypertension. Sixty‐four percent were taking antihypertensive medication.
Table 1.
Characteristics of Normotensive and Hypertensive Children
| Characteristica | Normotensive (n=50) | Hypertensive (n=31)b | P Value |
|---|---|---|---|
| Age, y | 14±3 | 15±3 | 0.150 |
| Sex, male/female | 23/27 | 22/9 | 0.028 |
| Height, cm | 158±13 | 166±14 | 0.015 |
| Weight, kg | 53.5±17.4 | 64.0±18.6 | 0.012 |
| BMI, kg/m2 | 21.0±5.1 | 22.8±4.9 | 0.113 |
| BMI z‐score | 0.22±1.20 | 0.67±0.92 | 0.069 |
| Heart rate, bpm | 73±11 | 81±15 | 0.010 |
| SBP, mmHg | 107±13 | 137±17 | <0.001 |
| SBP z‐score | −0.21±0.97 | 2.2±1.5 | <0.001 |
| DBP, mmHg | 62±11 | 71±16 | 0.004 |
| DBP z‐score | −0.26±0.95 | 0.44±1.40 | 0.009 |
| MAP, mmHg | 76±10 | 90±15 | <0.001 |
| Antihypertensive drugs (n, %) | 20, 64.5 | <0.001 |
BMI indicates body mass index; DBP, diastolic blood pressure; MAP, mean arterial pressure; SBP, peripheral systolic blood pressure.
Values are numbers, %, or means±SD.
Values are adjusted for age and sex. Z‐scores represent the number of SDs from values in a reference population.4
Peripheral and Central BP and Aortic PWV
As per definition, those with hypertension had significantly higher peripheral BP with systolic and diastolic BP 30±3 and 9±3 mmHg, respectively, greater in the hypertensive compared with normotensive groups, so that there was a more‐marked increase in pulsatility rather than mean BP. Central BP pressure components and PWV are summarized in Table 2. Average values of P1 were greater than those of P2 in normotensive and hypertensive groups so that augmentation pressure and AIx were negative. Both P1 and P2 were greater in hypertensive children compared with normotensive children, but the difference was proportionately greater for P1 than P2 so that augmentation pressure and AIx were similar in the 2 groups. Pulsatile components of central BP were all significantly greater in hypertensive compared with normotensive children, with the greatest difference being for PP1 (Table 2). Both P1 and P2 occurred earlier in systole in hypertensive compared with normotensive children with values of T1 and T2 15±6 and 16±5 ms lower, respectively, in hypertensive compared with normotensive children. The rate of initial pressure rise (PP1/T1) was therefore markedly greater in hypertensive compared with normotensive children (Table 2). Carotid‐femoral PWV was similar in both groups, but PWVss was higher in hypertensive compared with normotensive children (3.3±0.20 versus 2.5±0.16 m/s; P=0.004).
Table 2.
Central Hemodynamics: Pressure Wave Morphology and Pulse Wave Velocity
| Measure | Normotensive (n=50) | Hypertensive (n=31)a | P Value |
|---|---|---|---|
| Central systolic pressure points and timing | |||
| P1, mmHg | 90.0±1.7 | 111.6±2.0 | <0.001 |
| P2, mmHg | 88.9±1.8 | 108.0±2.2 | <0.001 |
| Pes, mmHg | 80.6±1.9 | 95.4±2.3 | <0.001 |
| T1, ms | 120±4 | 105±5 | 0.041 |
| T2, ms | 225±3 | 209±4 | 0.005 |
| Tes, ms | 309±3 | 298±4 | 0.031 |
| Central pulse pressures | |||
| PP1, mmHg | 28.0±1.7 | 39.7±2.1 | <0.001 |
| PP2, mmHg | 26.9±1.5 | 37.1±1.8 | <0.001 |
| PPes, mmHg | 18.7±1.1 | 24.5±1.3 | 0.001 |
| Augmentation pressure and index | |||
| AP, mmHg | −1.00±0.99 | −2.6±1.2 | 0.322 |
| AIx, % | −3.6±2.4 | −4.1±3.0 | 0.913 |
| Pulse wave velocities | |||
| PWVss, m/s | 2.5±0.16 | 3.3±0.20 | 0.004 |
| PWVcf, m/s | 5.9±0.18 | 5.9±0.19 | 0.802 |
AIx indicates augmentation index; AP, augmentation pressure; P1, blood pressure at the first systolic shoulder; P2, blood pressure at the second systolic shoulder; Pes, end‐systolic blood pressure; PP1, pulse pressure at P1; PP2, pulse pressure at P2; PPes, pulse pressure at Pes; PWVcf, carotid‐femoral pulse wave velocity; PWVss, pulse wave velocity by sum‐of‐squares; T1, timing of first systolic shoulder of central pressure: T2, timing of second systolic shoulder of central pressure; Tes, timing of the end‐systolic blood pressure.
Values are adjusted for age and sex.
LVOT Flow, SV, CO, and SVR
Flow waveform characteristics are presented in Table 3. Compared with normotensive children, children with hypertension had significantly higher maximal flow velocity (Umax) and mean flow velocity (Umean). Despite the earlier timing, T1 of P1 and U1, values of U1 were greater in hypertensive compared with normotensive children. Values of U2, V1, and V2 also tended to be greater in hypertensive compared with normotensive children (Figure 2) but the differences were not statistically significant. SVs calculated by integration of the flow waveform and from LV volumes were slightly greater in hypertensive children (3.2±5.3% and 3.5±5.5% greater for SVflow and SVvol, respectively) compared with normotensive children, but the differences were not significant (Table 3). Because of both greater SV and HR (by 8±3 beats per minute) in hypertensive children, mean CO was 0.8±0.30 L/min (18.1±8.1%) greater in hypertensive compared with normotensive children. The percentage difference between CO in hypertensive compared with normotensive children was similar to that of MAP, so that SVR was similar in normotensive and hypertensive children (18.0±0.87 versus 19.3±1.1 mmHg/min/mL; P=0.374; Table 3).
Table 3.
Central Hemodynamics: LVOT Flow Velocity, Flow, Stroke Volume, and Cardiac Output
| Measure | Normotensive (n=50) | Hypertensive (n=31)a | P Value |
|---|---|---|---|
| LVOT flow velocity | |||
| Umax, m/s | 1.21±0.03 | 1.33±0.04 | 0.032 |
| Umean, m/s | 0.29±0.01 | 0.35±0.02 | 0.005 |
| U1, m/s | 1.13±0.03 | 1.26±0.04 | 0.010 |
| U2, m/s | 0.75±0.03 | 0.86±0.04 | 0.051 |
| LVOT area and ejection volumes | |||
| LVOT area, cm2 | 2.53±0.07 | 2.52±0.08 | 0.924 |
| V1, mL | 24.1±1.7 | 22.3±2.1 | 0.529 |
| V2, mL | 50.3±2.1 | 50.6±2.6 | 0.921 |
| SVflow, mL | 62.5±2.6 | 64.4±3.1 | 0.648 |
| SVvol, mL | 50.0±1.7 | 51.7±2.1 | 0.532 |
| CO, L/min | 4.5±0.23 | 5.30±0.27 | 0.029 |
| SVR, mmHg/min/mL | 18.00±0.87 | 19.3±1.1 | 0.374 |
CO indicates cardiac output; LVOT area, left ventricular outflow tract area; SVflow, stroke volume obtained by integration of LVOT flow; SVR, systemic vascular resistance; SVVol, stroke volume obtained from ventricular dimensions; U1, flow velocity at T1; U2, flow velocity at T2; Umax, peak of flow velocity; Umean, mean of flow velocity; V1, ejection volume at T1; V2, ejection volume at T2.
Values are adjusted for age and sex.
Figure 2.
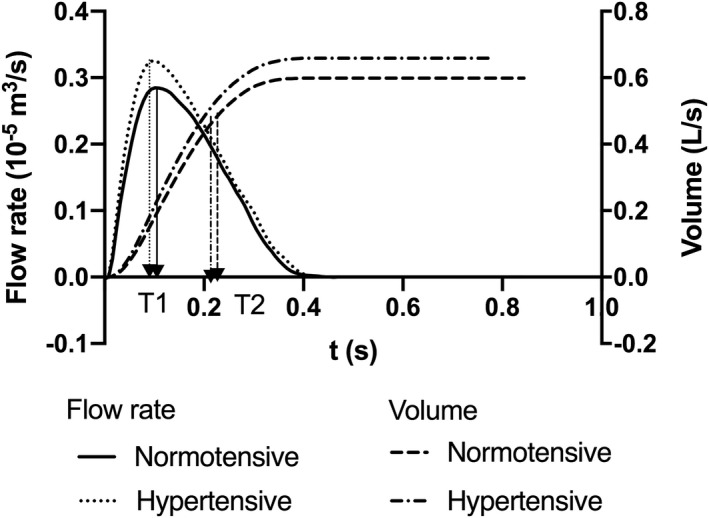
Average left ventricular flows and volumes in normotensive and hypertensive children.
Wave Separation and Intensity Analysis
Average central pressure and the corresponding decomposed forward and backward pressure waveforms in normotensive and hypertensive children are presented in Figure 3. Peak amplitudes of the forward and backward pressure waves and of values of individual forward and backward components of pressure at characteristic points on the pressure waveform (P1, P2, and Pes) and timings of these are shown in Table 4. Both peak forward and backward amplitudes were greater in hypertensive compared with normotensive children. P1 and P2 were determined mainly by the forward wave in both hypertensive and normotensive children, and components of the forward wave for these values were greater in hypertensive compared with normotensive children. Reflection index, calculated as the ratio of the maximal amplitude of the backward to forward wave, was similar in hypertensive and normotensive children as were ratios of the backward to forward components of P1, P2, and Pes.
Figure 3.
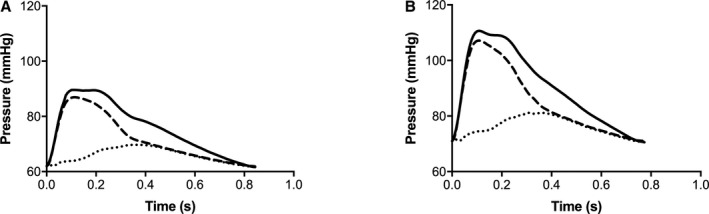
Average central pressure and corresponding decomposed forward and backward pressure waveforms in children. (A) Normotensive children and (B) hypertensive children. Solid lines show measured pressure, dashed lines show forward pressure, and dotted lines show backward pressure.
Table 4.
Forward and Backward Pressure Wave Decomposition
| Measurement | Normotensive (n=50) | Hypertensive (n=31)a | P Value |
|---|---|---|---|
| Amplitudes of pressure components | |||
| Max Pf, mmHg | 25.2±1.6 | 37.0±2.0 | <0.001 |
| Max Pb, mmHg | 9.30±0.53 | 11.50±0.65 | 0.012 |
| P1f, mmHg | 24.7±1.6 | 36.1±1.9 | <0.001 |
| P1b, mmHg | 3.30±0.36 | 3.60±0.45 | 0.632 |
| P2f, mmHg | 20.4±1.3 | 29.8±1.6 | <0.001 |
| P2b, mmHg | 6.50±0.62 | 7.30±0.76 | 0.466 |
| Pesf, mmHg | 11.20±0.71 | 15.80±0.88 | <0.001 |
| Pesb, mmHg | 6.70±0.56 | 7.50±0.69 | 0.338 |
| Reflection index and backward/forward ratios | |||
| Rindex | 0.39±0.02 | 0.34±0.03 | 0.177 |
| RP1 | 0.15±0.02 | 0.10±0.02 | 0.097 |
| RP2 | 0.35±0.03 | 0.26±0.04 | 0.134 |
| RPes | 0.73±0.10 | 0.50±0.13 | 0.160 |
| Timing of pressure components | |||
| Tarrival, ms | 99±8 | 92±10 | 0.585 |
| TmaxPf, ms | 117±5 | 121±6 | 0.603 |
| TmaxPb, ms | 342±8 | 323±10 | 0.175 |
Max Pb indicates peak value (amplitude) of backward pressure wave; Max Pf, peak value (amplitude) of forward pressure wave; P1b, backward component of P1; P1f, forward component of P1; P2b, backward component of P2; P2f, forward component of P2; Pesb, backward component of end‐systolic pressure; Pesf, forward component of end‐systolic pressure; Rindex: reflection index; RP1, ratio of P1b to P1f; RP2, ratio of P2b to P2f; RPes, ratio of Pesb to Pesf; Tarrival, arrival time of backward pressure wave; TmaxPb, timing of peak value of backward pressure wave.; TmaxPf, timing of peak value of forward pressure wave.
Values are adjusted for age and sex.
Wave intensities and timing of wave intensity components are shown in Table 5. All wave intensity components, including amplitudes and area of forward and backward wave intensities except the amplitude of the backward expansion wave, were greater in hypertensive compared with normotensive children. Size of the forward expansion wave, indicative of a braking action of the left ventricle on forward pressure wave propagation, was particularly marked in the hypertensive group (Table 5). The peak of the backward expansion wave arrived earlier in hypertensive children (Table 5) but timings of other waves were not significantly different between normotensive and hypertensive children (Table 5).
Table 5.
Wave Intensity Analysis
| Measurement | Normotensive (n=50) | Hypertensive (n=31)a | P Value |
|---|---|---|---|
| Amplitudes of wave intensity components | |||
| Fcomp, W/m2 | 91.5±10.2 | 166.3±12.6 | <0.001 |
| Bcomp, W/m2 | 6.0±1.2 | 11.6±1.5 | 0.006 |
| Fexp, W/m2 | 15.1±1.9 | 27.7±2.3 | <0.001 |
| Bexp, W/m2 | 4.8±1.5 | 6.7±1.9 | 0.454 |
| Areas of wave intensity components | |||
| Fcomp area, J/m2 | 3.50±0.35 | 6.10±0.42 | <0.001 |
| Bcomp area, J/m2 | 0.22±0.03 | 0.34±0.03 | 0.004 |
| Fexp area, J/m2 | 0.88±0.10 | 1.60±0.12 | <0.001 |
| Bexp area, J/m2 | 0.39±0.04 | 0.64±0.05 | <0.001 |
| Timing of wave intensity components (maximal amplitude) | |||
| TFcomp, ms | 30±1 | 29±1 | 0.439 |
| TBcomp, ms | 88±10 | 95±12 | 0.696 |
| TFexp, ms | 284±6 | 272±7 | 0.227 |
| TBexp, ms | 306±25 | 207±31 | 0.018 |
Bcomp area indicates area of backward wave intensity; Bcomp, peak value (amplitude) of backward wave intensity; Bexp area, area of backward expansion wave intensity; Bexp, peak value of backward expansion wave intensity; Fcomp area, area of forward wave intensity; Fcomp, peak value (amplitude) of forward wave intensity; Fexp area, area of forward expansion wave intensity; Fexp, peak value of forward expansion wave intensity; TBcomp, timing of peak of backward wave intensity; TBexp, timing of peak of backward expansion wave intensity; TFcomp, timing of peak of forward wave intensity; TFexp, timing of peak of forward expansion wave intensity.
Values are adjusted for age and sex.
Cardiac and Arterial Contributions to the Difference in Steady‐Sate and Pulsatile Components of BP Between Hypertensive and Normotensive Children
The greater MAP in hypertensive compared with normotensive children was explained by greater CO rather than SVR (Figure 4). Greater PP1 in hypertensive compared with normotensive children was explained by a combination of greater PWVss and greater early ejection velocities (Figure 4).
Figure 4.
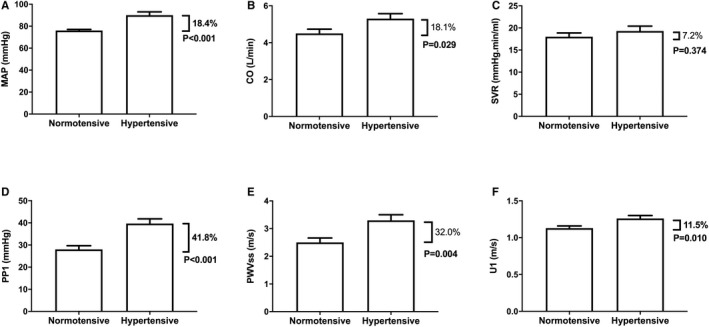
Major hemodynamic measures in normotensive (NT) and hypertensive (HT) children. (A) Mean arterial pressure (MAP), (B) cardiac output (CO), (C) systemic vascular resistance (SVR), (D) central pulsatile pressure at the first systolic shoulder (PP1), (E) proximal aortic pulse wave velocity (PWVss), and (F) left ventricular outflow velocity at the first systolic shoulder. Percentages refer to differences between normotensive and hypertensive children.
Influence of Treatment and Adjustment for Height and Body Surface Area on Differences Between Hypertensive and Normotensive Children
Results were not materially altered when comparisons were made between untreated hypertensive and normotensive children (Tables S1 through S5). Differences between hypertensive and control groups in key hemodynamic measures (CO, SV, SVR, U1, PWVss, and carotid‐femoral PWV) were similar irrespective of whether the comparison was adjusted for age, sex, height, and body surface area and (in the case of PWV) MAP, HR, and LVOT cross‐sectional area (Table S6). In subsample analysis in boys alone, similar differences between hypertensive and control groups were noted, but not all differences that were significant in the whole sample reached statistical significance in the subsample because of the smaller sample size of the latter. Correction for body surface area, but not height, did attenuate the difference between CO in the hypertensive and normotensive groups, consistent with greater mass being a driver of increased CO.
Discussion
To the best of our knowledge, this is the first comprehensive characterization of central hemodynamics in children with primary hypertension. There are 2 major findings. First, increased MAP, the steady‐state component of BP, in hypertension is attributable to an increase in HR and CO rather than increase in SVR. Second, increased pulsatility of BP in children with primary hypertension, which is more marked than the increase in MAP, is explained by a combination of increased proximal aortic stiffness (as measured by PWVss) and increased LV ejection velocity. These findings are consistent with, and extend previous studies in, adolescents and in young adults. Chirico et al9 measured CO by echocardiography in adolescents with primary hypertension and found elevated BP to be explained by increased CO rather than SVR. Arterial properties were not measured in the study by Chirico et al, but, in the ENIGMA population study on young adults, CO (by inert‐gas rebreathing) and PWV were measured and elevated BP was explained by increased SV and PWV rather than increased SVR.10 The present study extends the findings of the ENIGMA study with respect to proximal PWV as a determinant of pulsatility in primary hypertension in young adults to children and also identifies increased LV ejection velocity as an additional determinant of pulsatility in such children.
Measurement of flow velocity in addition to pressure allowed us to perform a comprehensive wave separation and intensity analysis, which confirmed that the main difference between hypertensive and normotensive children was an increase in the forward compression wave indicative of a hyperkinetic state. While backward wave components were also increased, this was likely secondary to the increase in the forward wave. Increased pressure wave “reflection,” usually inferred from pressure wave morphology (eg, from AIx, which is now recognized to be influenced by ventricular dynamics as well as by reflection), has been implicated in systolic hypertension in adults. However, in the present study, we found no evidence of increased reflection as measured by AIx or by the ratio of backward to forward wave components in hypertensive children.
When considering the primary hemodynamic alteration in children with hypertension, it is important to consider whether the increased proximal PWV we observed was a primary phenomenon or secondary to the increased MAP. Pressure dependence of PWV attributed to distension of the arterial wall transferring wall stress to stiffer elements within the wall is well recognized. In adults, acute modulation of transmural pressure (equivalent to an acute increase in MAP) or direct modulation of MAP using vasoactive drugs increases carotid‐femoral PWV and intrathoracic PWV (which theoretically is more closely related to PWVss) over a range of ≈0.5 to 1.0 m/s per 10 mmHg.11, 12 In the present study, the difference between PWVss in the hypertensive and control groups was 0.8 m/s and that for MAP 14 mmHg giving ratios of 0.6 m/s per 10 mmHg. Thus, the increase in PWV could be secondary to the increased MAP. Statistical adjustment for MAP did not alter the difference in proximal PWV between hypertensive and normotensive subjects, but this adjustment could have been limited by the relatively small number of subjects. The findings of the present study that primary hypertension in children is mainly a phenomenon arising from overactivity of the heart and proximal aorta is in stark contrast to the established view of primary hypertension as being a condition caused by increased resistance of the microvasculature. Given the tracking of BP from childhood to adulthood,13 this calls into question the focus on the microvasculature as the main cause of primary hypertension in adults.14, 15 It is possible that microvascular dysfunction occurs through remodeling secondary to increased MAP or pulsatility as proposed by Folkow.14, 16 Furthermore, it suggests that therapies, such as beta‐adrenergic antagonists, that reduce cardiac activity may be more effective in children than in adults.
Our study did not address the underlying etiology of the hemodynamic determinants of hypertension. However, increased sympathetic activity has been suggested as the underlying cause for primary hypertension in children, particularly when hypertension is associated with obesity.17 Sympathetic activity was not measured in the present study, but increased sympathetic activity would be entirely consistent with the increased HR and increased ventricular ejection velocities we observed. It could also contribute to the elevated proximal PWV independent of effects of MAP. In the present study, body mass index was similar in hypertensive and normotensive groups, and increased sympathetic activity could be an important cause of primary hypertension in nonobese children. Renal sodium handling is likely to be another important cause of the difference between hypertensive and normotensive children. The current study did not directly measure sympathetic activity nor address renal sodium handling and, as such, does not fully characterize what is likely to be a complex and heterogeneous phenotype.
There are a number of other important limitations to our study. We studied a relatively small number of hypertensive children and were not able to meaningfully stratify our analysis by age and sex. Further studies are required to characterize hypertension in different age groups and according to other characteristics. Many of our hypertensive children were on some antihypertensive treatment, and although adjustment for treatment or analysis in untreated children made no difference to our conclusions, further studies on a larger group of untreated children are indicated. Noninvasive measurements of hemodynamics are inevitably subject to experimental error and measurements of peripheral and central BP are subject to calibration error. Our method of calibration of carotid waveforms by MAP derived from radial tonometry and brachial and diastolic BP is subject to error attributable to brachial to radial amplification.18 While these errors may have influenced absolute values of BP, they are unlikely to have influenced values in the hypertensive relative to the normotensive group, which was the main focus of the present study.
In conclusion, the present study suggests that primary hypertension in children results from cardiac overactivity characterized by increased HR and LV ejection velocities and increased proximal aortic stiffness.
Sources of Funding
This work was supported by a British Heart Foundation Project grant PG/17/50/32903. The study also received support from the National Institute for Health Research Clinical Research Facility and Biomedical Research Centre based at Guy’s and St. Thomas’ NHS Foundation Trust and King’s College London.
Disclosures
None.
Supporting information
Table S1. Characteristics of Normotensive and Hypertensive Children: Comparison of Values in Untreated Hypertensive and Normotensive Children
Table S2. Central Hemodynamics: Pressure Wave Morphology and Pulse Wave Velocity: Comparison of Values in Untreated Hypertensive and Normotensive Children
Table S3. Central Hemodynamics: LVOT Flow Velocity, Flow, Stroke Volume, and Cardiac Output: Comparison of Values in Untreated Hypertensive and Normotensive Children
Table S4. Forward and Backward Pressure Wave Decomposition: Comparison of Values in Untreated Hypertensive and Normotensive Children
Table S5. Wave Intensity Analysis: Comparison of Values in Untreated Hypertensive and Normotensive Children
Table S6. Influence of Adjustment for Age, Sex, Height, Body Surface Area, and Other Factors on Key Hemodynamic Measures
(J Am Heart Assoc. 2020;9:e015097. DOI: 10.1161/JAHA.119.015097.)
References
- 1. Sorof JM. Prevalence and consequence of systolic hypertension in children. Am J Hypertens. 2002;15:57s–60s. [DOI] [PubMed] [Google Scholar]
- 2. Lakatta EG, Levy D. Arterial and cardiac aging: major shareholders in cardiovascular disease enterprises: part I: aging arteries: a “set up” for vascular disease. Circulation. 2003;107:139–146. [DOI] [PubMed] [Google Scholar]
- 3. Cecelja M, Chowienczyk P. Molecular mechanisms of arterial stiffening. Pulse (Basel). 2016;4:43–48. [DOI] [PMC free article] [PubMed] [Google Scholar]
- 4. National High Blood Pressure Education Program Working Group on High Blood Pressure in Children and Adolescents . The fourth report on the diagnosis evaluation, and treatment of high blood pressure in children and adolescents. Pediatrics. 2004;114:555–576. [PubMed] [Google Scholar]
- 5. Pauca AL, Wallenhaupt SL, Kon ND, Tucker WY. Does radial artery pressure accurately reflect aortic pressure? Chest. 1992;102:1193–1198. [DOI] [PubMed] [Google Scholar]
- 6. Parker KH, Jones CJ. Forward and backward running waves in the arteries: analysis using the method of characteristics. J Biomech Eng. 1990;112:322–326. [DOI] [PubMed] [Google Scholar]
- 7. Davies JE, Whinnett ZI, Francis DP, Willson K, Foale RA, Malik IS, Hughes AD, Parker KH, Mayet J. Use of simultaneous pressure and velocity measurements to estimate arterial wave speed at a single site in humans. Am J Physiol Heart Circ Physiol. 2006;290:H878–H885. [DOI] [PubMed] [Google Scholar]
- 8. Vennin S, Li Y, Willemet M, Fok H, Gu H, Charlton P, Alastruey J, Chowienczyk P. Identifying hemodynamic determinants of pulse pressure: a combined numerical and physiological approach. Hypertension. 2017;70:1176–1182. [DOI] [PubMed] [Google Scholar]
- 9. Chirico D, Wade TJ, Cairney J, Klentrou P, O'Leary DD. Evidence of a hyperkinetic state in children with elevated blood pressure. Ann Hum Biol. 2015;42:246–252. [DOI] [PubMed] [Google Scholar]
- 10. McEniery CM, Yasmin Wallace S, Maki‐Petaja K, McDonnell B, Sharman JE, Retallick C, Franklin SS, Brown MJ, Lloyd RC, Cockcroft JR, Wilkinson IB. Increased stroke volume and aortic stiffness contribute to isolated systolic hypertension in young adults. Hypertension. 2005;46:221–226. [DOI] [PubMed] [Google Scholar]
- 11. Gaddum NR, Keehn L, Guilcher A, Gomez A, Brett S, Beerbaum P, Schaeffter T, Chowienczyk P. Altered dependence of aortic pulse wave velocity on transmural pressure in hypertension revealing structural change in the aortic wall. Hypertension. 2015;65:362–369. [DOI] [PubMed] [Google Scholar]
- 12. Stewart AD, Jiang B, Millasseau SC, Ritter JM, Chowienczyk PJ. Acute reduction of blood pressure by nitroglycerin does not normalize large artery stiffness in essential hypertension. Hypertension. 2006;48:404–410. [DOI] [PubMed] [Google Scholar]
- 13. Chen X, Wang Y. Tracking of blood pressure from childhood to adulthood: a systematic review and meta‐regression analysis. Circulation. 2008;117:3171–3180. [DOI] [PMC free article] [PubMed] [Google Scholar]
- 14. Folkow B. Physiological aspects of primary hypertension. Physiol Rev. 1982;62:347–504. [DOI] [PubMed] [Google Scholar]
- 15. Pickering TG. Sir George Pickering's Views on Hypertension In: Sambhi MP, ed. Fundamental Fault in Hypertension Dordrecht: Springer. Netherlands:; 1984:19–23. [Google Scholar]
- 16. Folkow B, Grimby G, Thulesius O. Adaptive structural changes of the vascular walls in hypertension and their relation to the control of the peripheral resistance. Acta Physiol Scand. 1958;44:255–272. [DOI] [PubMed] [Google Scholar]
- 17. Sorof J, Daniels S. Obesity hypertension in children: a problem of epidemic proportions. Hypertension. 2002;40:441–447. [DOI] [PubMed] [Google Scholar]
- 18. Verbeke F, Segers P, Heireman S, Vanholder R, Verdonck P, Van Bortel LM. Noninvasive assessment of local pulse pressure: importance of brachial‐to‐radial pressure amplification. Hypertension. 2005;46:244–248. [DOI] [PubMed] [Google Scholar]
Associated Data
This section collects any data citations, data availability statements, or supplementary materials included in this article.
Supplementary Materials
Table S1. Characteristics of Normotensive and Hypertensive Children: Comparison of Values in Untreated Hypertensive and Normotensive Children
Table S2. Central Hemodynamics: Pressure Wave Morphology and Pulse Wave Velocity: Comparison of Values in Untreated Hypertensive and Normotensive Children
Table S3. Central Hemodynamics: LVOT Flow Velocity, Flow, Stroke Volume, and Cardiac Output: Comparison of Values in Untreated Hypertensive and Normotensive Children
Table S4. Forward and Backward Pressure Wave Decomposition: Comparison of Values in Untreated Hypertensive and Normotensive Children
Table S5. Wave Intensity Analysis: Comparison of Values in Untreated Hypertensive and Normotensive Children
Table S6. Influence of Adjustment for Age, Sex, Height, Body Surface Area, and Other Factors on Key Hemodynamic Measures