Abstract
Methyltransferases (MTases) play diverse roles in cellular processes. Aberrant methylation levels have been implicated in many diseases, indicating the need for the identification and development of small molecule inhibitors for each MTase. Specific inhibitors can serve as probes to investigate the function and validate therapeutic potential for the respective MTase. High-throughput screening (HTS) is a powerful method to identify initial hits for further optimization. Here, we report the development of a fluorescence-based MTase assay and compare this format with the recently developed MTase-Glo™ luminescence assay for the application in HTS. Using protein N-terminal methyltransferase 1 (NTMT1) as a model system, we miniaturized to 1,536-well quantitative HTS format. Through a pilot screen of 1,428 pharmacologically active compounds and subsequent validation, we discovered that MTase-Glo™ produced lower false positive rates than the fluorescence-based MTase assay. Nevertheless, both assays displayed robust performance along with low reagent requirements and can potentially be employed as general HTS formats for the discovery of inhibitors for any MTase.
Keywords: High-throughput screening, protein N-terminal methyltransferase 1, methyltransferase inhibitors, SAHH-coupled fluorescence assay, assay miniaturization
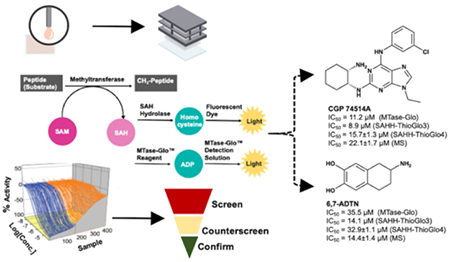
Graphical Abstract
Introduction
Methyltransferases (MTases) are a superfamily of enzymes that catalyze methylation reactions. Most MTases including protein, DNA, and RNA MTases transfer a methyl group from the cofactor S-adenosyl-methionine (SAM) to their respective substrates. The methylation of biomolecules impacts numerous biological processes including gene expression, transcriptional regulation, signal transduction, and DNA damage repair. Dysregulation of MTases has been implicated in various ailments including cancers, inflammation, metabolic, cardiovascular, and neurodegenerative diseases.1, 2 Hence, discovery and identification of small molecule inhibitors for MTases have drawn increasing attention in order to develop new therapeutic agents (Figure 1). Among them, DNA MTase inhibitors azacitidine and decitabine have been widely used as novel epigenetic therapeutic agents for treating myelodysplastic syndrome in the clinic. Tazemetostat, an EZH2 selective inhibitor, has just been approved for elapsed/refractory follicular lymphoma. In addition, several protein MTase inhibitors have entered clinical trials such as EPZ-5676, a DOT1L inhibitor for treating Acute Myeloid Leukemia and Mixed-lineage leukemia gene rearranged leukemia; JNJ-64619178 and PF-06939999 (structure not disclosed), protein arginine MTase 5 (PRMT5) inhibitors for advanced solid tumors.3–6 Furthermore, inhibitors have been developed for many type I and SET domain methyltransferases, such as BIX01294 for G9a, DC-S239 for SETD7, GSK2807 for SMYD3 and A-196 for SUV420H1 and SUV420H2.7 Despite the aforementioned progress, many MTases still have no selective and/or potent inhibitors available.8 Hence, there remains an urgent need to discover novel and selective small molecule inhibitors to elucidate the function and therapeutic potentials for various MTases.
Figure 1.
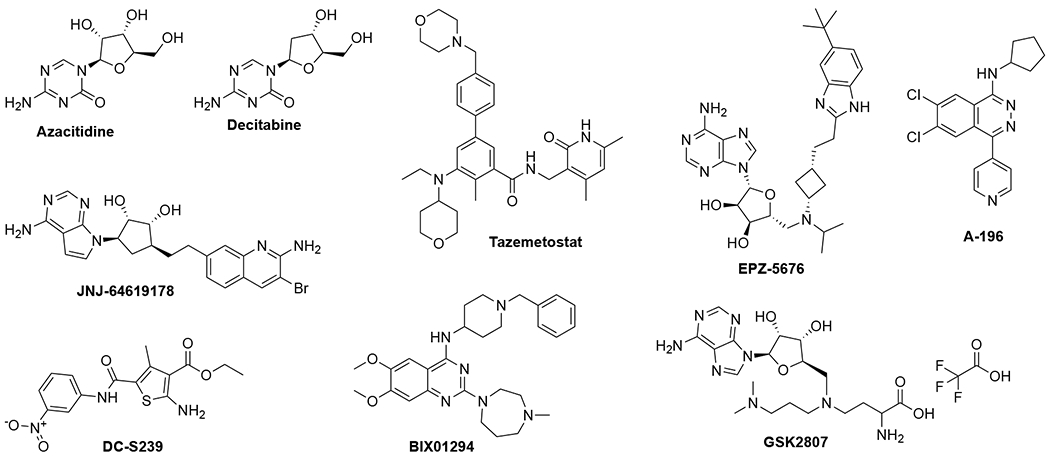
Reported methyltransferase inhibitors.
Protein N-terminal methyltransferase 1 (NTMT1) is a recently identified member of the MTases, and has been shown to catalyze the methylation of the α-N-terminal amine of proteins starting with the motif X-P-K/R (X prefers any amino acid except D/E).9–11 NTMT1 has been implicated in chromatin segregation and DNA damage repair through genetic studies.10, 12, 13 Bisubstrate inhibitors have displayed high potency and selectivity for NTMT1.14–16 However, poor cell permeability of these inhibitors limits their applications in cell-based studies. Thus, small molecule inhibitors will be valuable probes in understanding the physiological and pathological roles of NTMT1. Herein, we use NTMT1 as a model system to develop a platform of HTS to facilitate the discovery of small molecule inhibitors, which will be applicable to all SAM-dependent MTases.
High throughput screening (HTS) is a proven method to identify small molecule inhibitors as initial hits, which can be further modified to yield a cell-potent and selective inhibitor.8, 17 Current assays for MTase modulation either detect the production of methylated substrates or S-adenosyl-L-homocysteine (SAH). Methylation can be detected through radioisotope-labeled methyl group transfer from SAM to the substrates, mass spectrometry (MS), antibody-specific recognition in combination with fluorescence resonance energy transfer (FRET), or chemiluminescence.18–24 Depending on the substrate of the MTase, the detection method for the methylated substrate often needs to be changed and/or re-optimized. These assays either have low throughput or require specific assay kit, which limit their uses in high-throughput screening.18, 19 On the other hand, the detection of SAH is applicable to essentially any MTase because SAH is generated during the SAM-dependent methylation reaction. All SAH detection methods require a coupling enzyme to convert SAH to a product that can be quantified by absorbance, fluorescence, or luminescence.21–25 For example, a widely used SAH hydrolase (SAHH)-coupled fluorescence assay detects the production of SAH by hydrolysis of SAH to homocysteine, which is then formed a fluorescent ThioGlo-thiol adduct (Figure 2A).25 A commercially available MTase-Glo™ assay converts SAH to ATP, which catalyze the luciferase reaction to produce luminescence (Figure 2A).24
Figure 2.
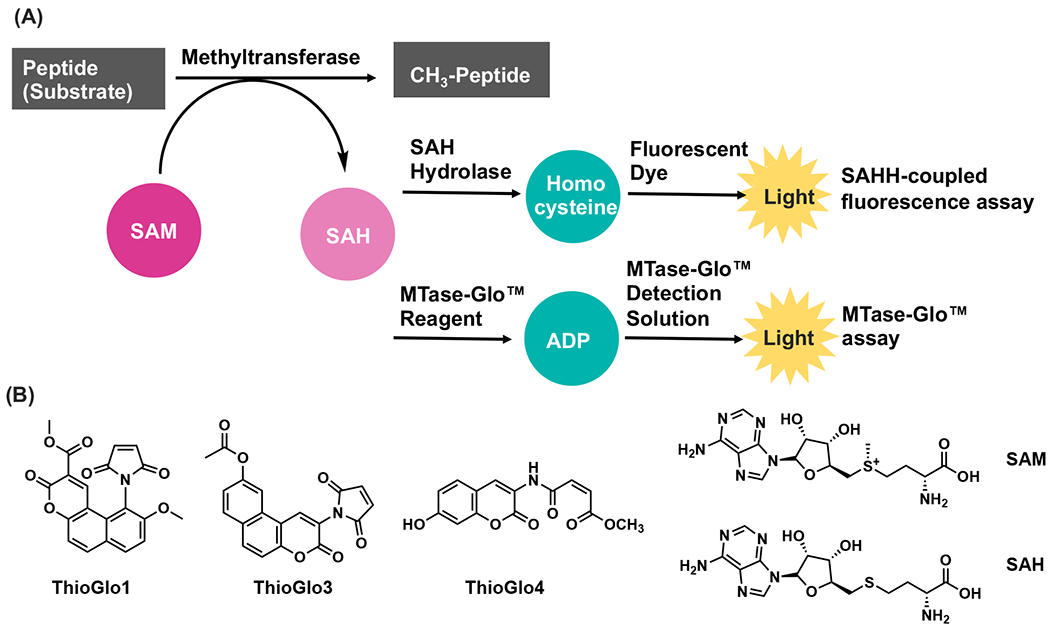
A) SAHH-coupled fluorescence and MTase-Glo assays; B) Selected structures of assay components.
In this study, we miniaturized and optimized both SAHH-coupled fluorescence assay and MTase-Glo™ assay to a 1536-well format with a total volume of 4 μL. We then compared both assays by conducting a pilot HTS. After validation with a SAHH-coupled fluorescence assay and a direct MALDI-MS assay, two small molecule inhibitors were identified. The hit compounds identified from this HTS will facilitate the development of novel small molecule inhibitors for NTMT1 to elucidate the role and function of NTMT1. Notably, both assays described here can be applied to HTS for identification of novel small molecule modulators for other MTases.
Results and Discussions
Optimization for SAHH-ThioGlo3 Assay in 384-well Format
We have previously developed a SAHH-coupled fluorescence assay in a 96-well plate format to characterize the kinetic mechanism of NTMT1 using ThioGlo®1.25 For HTS assay development, we shifted from ThioGlol® to ThioGlo3 (Ex/Em =340 nm/450 nm; Figure 2B) because of the limited availability of ThioGlo1®. Guided by previous conditions, we began the optimization in a 384-well format by performing an enzyme titration ranging from 15.6 nM to 1 μM (1:2 dilution, n = 4) under the condition of 3 μM RCC1-6 peptide substrate SPKRIA, 100 μM SAM, 10 μM SAHH, and 15 μM ThioGlo3). Fluorescence was recorded at 5, 15, 35, 110, and 180 minutes (Figures 3A). Over the time-course, both ∆RFU and Z’ values increased proportionally at enzyme concentrations ranging from 62.5 nM to 1 μM at 5, 15, and 35 min, respectively (Figures 3B). At 110 min, the ∆RFU value barely changed in presence of 1 μM of NTMT1, which may be caused by complete consumption of substrate peptide. At 35 min and in the presence of 125 nM of NTNT1, the ∆RFU and Z’ values reached 85 and 0.84, respectively, indicating the possibility to use a short incubation time and low amount of enzyme while maintaining the robust assay performance. This enzyme concentration was then used to determine Km of SPKRIA peptide substrate in this updated format, yielding a value of 0.40 ± 0.07 μM (Figure S1A).
Figure 3.
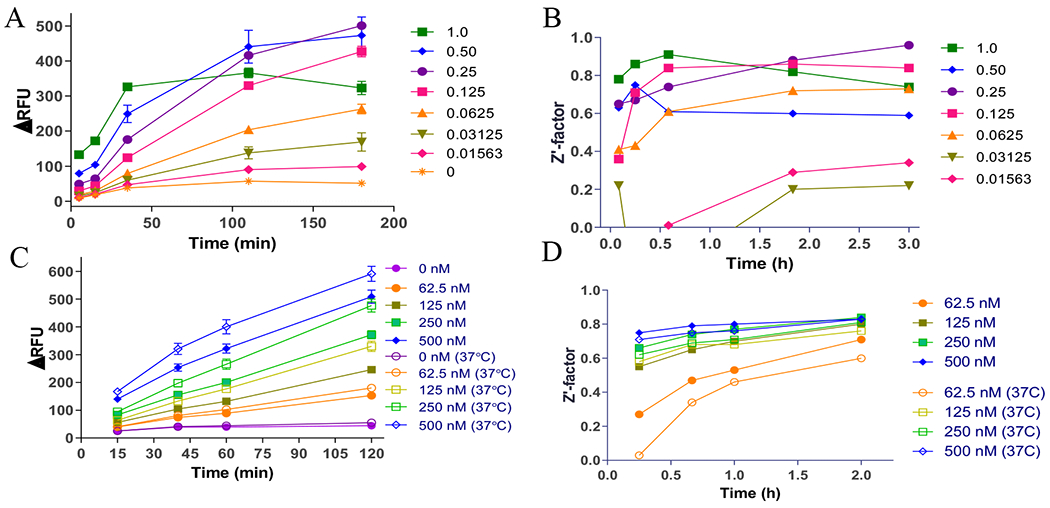
Optimization for SAHH-coupled ThioGlo3 assay. A) NTMT1 titration and time-course in 384-well format. B) Assay performance (Z’-factor) under different concentrations of NTMT1 in 384-well format. C) NTMT1 titration and time-course in 1536-well format. D) Assay performance (Z’-factor) under different concentrations of NTMT1 at room temperature and 37°C in 1536-well format.
Optimization for SAHH-coupled ThioGlo3 Assay in 1536-well Format
Based on the results from the 384-well format, we proceeded to miniaturize the assay to the 1536-well format. We re-tested NTMT1 at concentrations of 62.5, 125, 250, 500 nM, and at time-points of 15, 40, 60, and 120 minutes in order to examine the optimized condition for 1536-well format. In parallel, we evaluated the assay performance at room temperature (RT) and 37°C (Figure 3C). Our results showed a linear relationship between NTMT1 concentration and product formation at both RT and 37°C. Hence, we chose RT as it is an HTS-amenable format with acceptable Z’ values (Figure 3D). Based on statistical analysis from iterative experiments with varied NTMT1 concentrations, 125 nM of enzyme was chosen for our initial HTS conditions, exhibiting a Z’>0.65 for a robust HTS assay.
Next, the effects of DMSO were examined using the inhibitor Ac-RCC1-10 (Ac-SPKRIAKRRS), a peptide inhibitor that showed an IC50 > 30 μM in a previous study as a control.25 Using a single (23 nL of compound, 0.5% DMSO, concentration range of 1.8 μM – 229 μM) or a double (46 nL of compound, 1% DMSO, concentration range of 3.5 μM – 455 μM) pintool transfer of peptide inhibitor, we observed Z’-factors of 0.64 and 0.68, and IC50 values of 10.5 and 13.8 μM, respectively (Figure 4A). The comparable IC50 values and Z’ factors suggest that the enzyme is insensitive to DMSO effects at these common screening concentrations. This is consistent with our previous studies of 1 – 5% DMSO effects in 96-well format.25
Figure 4.
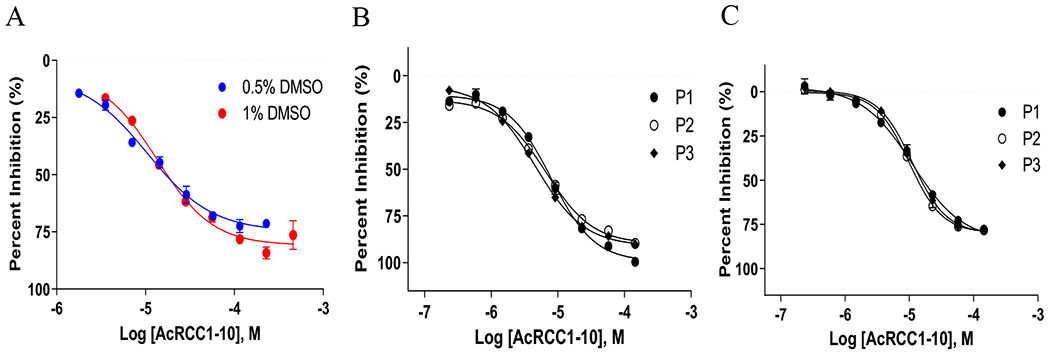
Intraplate control titration of AcRCC1-10 in 1536-well plate format. A) AcRCC1-10 control titration in SAHH-ThioGlo3 assay (125 nM NTMT1, 3 μM RCC1-6, 100 μM SAM, 10 μM SAHH, 15 μM ThioGlo3, 60-minute RT incubation, 0.5% or 1% DMSO). B) Intraplate control titration of AcRCC1-10 for the Epigenetic Library Screen using the ThioGlo3 assay. P1-P3 represent three different 1536-well microplates. C) Intraplate control titration of AcRCC1-10 for the Epigenetic Library Screen using the MTase-Glo assay. P1-P3 represent three different 1536-well microplates.
In order to identify specific inhibitors for NTMT1, this HTS focuses on identification of inhibitors that competitively bind to a unique peptide substrate binding site because the SAM binding site is conserved among MTases. Using these miniaturized conditions, we redetermined Km of SPKRIA at 0.5 ± 0.1 μM (Figure S1B), similar to what was observed in 384-well format. Hence, we proceeded the HTS with 1 μM of SPKRIA peptide and excess SAM at 100 μM to favor the identification of specific inhibitors for NTMT1. The incubation time of 30 minutes was selected to ensure a steady-state condition, where the substrate conversion was less than 15%.26, 27 Under this modified condition, an IC50 value of the control peptide inhibitor Ac-RCC1-10 slightly decreased about 2-fold to 6.8 μM (Figure S2A). Therefore, we moved forward with an online robotic HTS at an SPKRIA concentration of 1 μM and an incubation time of 30 min (Table S1). Reagents were stable over a 2-hour time-period with assay performance (Figure S3A).
Optimization for MTase-Glo™ Assay in 1536-well Format
The MTase-Glo™ is a bioluminescent assay that converts SAH to ADP and produces luminescence (Figure 2).24 MTase-Glo™ eliminates the usage of a fluorescent dye like ThioGlo3, which has the potential to offer high S/B and less interference with inherent fluorescent compounds.28 Following the recommended kit concentrations and above optimized SAHH-ThioGlo 3 assay conditions (Table S2), we observed a S/B of ~2.7 leading to a Z’-factor of ~0.55, and achieved a similar IC50 value of ~9.5 μM for Ac-RCC1-10, indicating the kit can be used as a potential orthogonal 1,536-well assay (Figure S2B). Reagents were tested over a 4-hour time-period for day-to-day variability and were found to have excellent assay statistics, with Z’ values ranging from 0.76 to 0.93 (Figure S3B). Under these conditions, peptide substrate Km was determined to be 0.6 ± 0.3 μM, similar to what was observed in the ThioGlo3 assay format (Figure S1C).
qHTS of Epigenetic Library
We tested the previously assembled epigenetic-focused collection of 218 compounds (“Epigenetic Library”, Table S3) in both miniaturized SAHH-ThioGlo3 and MTase-Glo™ assays. Notably, this library includes the above-mentioned prior art compounds Tazemetostat (NCGC00381562), EPZ-5676 (NCGC00351597), and BIX-01294 (NCGC00261813), along with the methyltransferase inhibitor Sinefungin (NCGC00263619).29 To minimize the number of false positives and negatives, we employed the qHTS screening paradigm with a final concentration range of 1 nM to 57 μM in both assays to generate concentration-response curves for each library compound (Table S3).30, 31 Both SAHH-ThioGlo and MTase-Glo™ assay formats exhibited excellent assay performance, with Z’s of 0.6 and 0.9, S/B of 2.4 and 3.0, respectively. Peptide inhibitor Ac-RCC1-10 was used as an intraplate control,25 displaying an IC50 value of 6.5 μM and 10.8 μM in SAHH-ThioGlo3 and MTase-Glo™, respectively (Figures 4B–C). This result suggested that SAHH-ThioGlo3 exhibited ~1.7-fold more sensitivity versus MTase-Glo™ assay. Initial hits were defined as those compounds that yielded a curve class of −1.1, −1.2, −2.1, −2.2 (Figure S4), an efficacy of < −40%, and an IC50 of < 40 μM, yielding 129 and 29 compounds in the SAHH-ThioGlo3 vs MTase-Glo™ assays, respectively (Figure 5A, Table S3).
Figure 5.
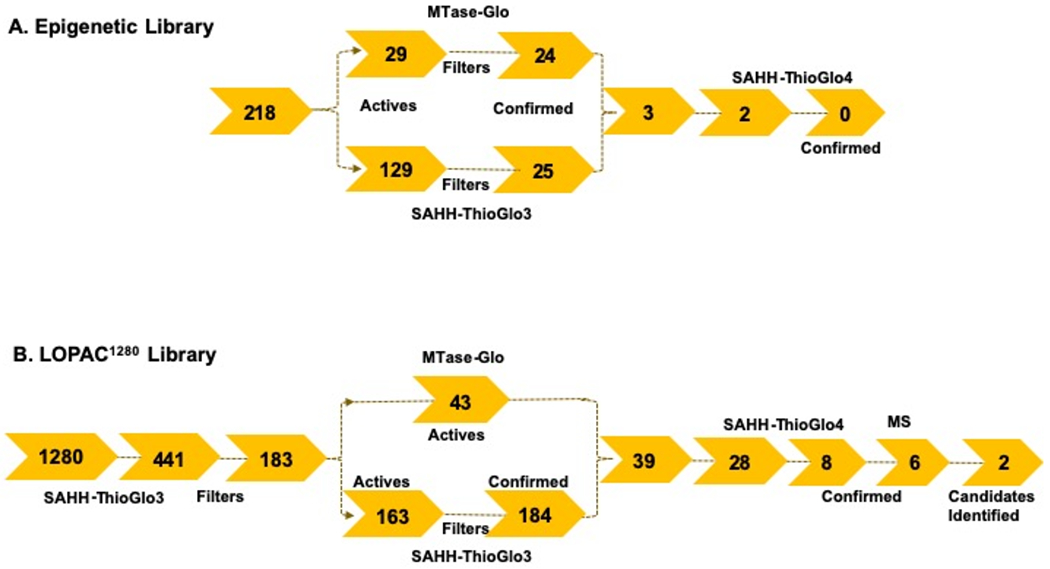
Assay triage summary. A) Epigenetic library. B) LOPAC1280 library.
To understand the difference in the number of hits between the two assay formats, we examined the Epigenetic Library, noting that SAM (NCGC00167546) and SAH (NCGC00163307) were properly identified as activators in both assay formats (Figure S5). As expected, SAM competitive inhibitor Sinefungin (NCGC00263619) did not exhibit inhibition up to 57 μM, due to high concentrations of SAM in both assay formats, while none of the other aforementioned reference compounds met hit criteria in either assay format. The library also consists of 92 adenosine derivatives which can produce false positives in both assay formats by interfering with coupling enzymes like SAHH, luciferase, and other reagents in the assays.
Next, we inspected our results for assay artifacts, first with SAHH-ThioGlo3 which can suffer false positives arising from the fluorescence readout from the ThioGlo3 probe. To eliminate those compounds in the SAHH-ThioGlo3 assay, we examined the raw data of DMSO wells and used their mean RFU value of 278 as a reference. Compounds that exhibited an RFU value higher than 1,000 (>3-fold DMSO) at their highest concentration tested in the assay were flagged as false positives. Among the 129 initial hits in SAHH-ThioGlo3 assay, 104 compounds had an RFU value over 1,000, yielding 25 hits. Notably, of those 104 compounds, 84 were also inactive in MTase-Glo™ assay, indicating the latter was able to remove them without adding an additional filter step. Besides SAHH in both assay formats, the MTase-Glo™ assay is susceptible to additional interferences due to the coupled enzyme reactions (polyphosphate-AMP phosphotransferase, adenosine kinase, luciferase) leading to false-positives.24 To address these interferences, the Epigenetic Library was counter-screened at the same assay conditions but in the absence of enzyme, spiking in SAH to initiate the reaction. A compound was regarded as active in the counter screen if its curve class value was −1.1, −1.2, – 2.1, −2.2 and the IC50 < 5-fold the screening IC50 value. Of the 29 initial hits in MTase-Glo™ assay, 5 compounds, including a known luciferase inhibitor NCGC00183809, were identified as active in the counterscreen.29, 32 Of those 5 compounds, only 2 were identified as inactive in the SAHH-ThioGlo3 assay (Figure 5A, Table S3).
In summary, there were 25 (11% hit rate) and 24 (11% hit rate) compounds from SAHH-ThioGlo3 and MTase-Glo™ assay after hit triage, respectively (Figure 5A). Three compounds were active in both assay formats (Figure S6). One is adenosine derivative 8-Azidoadenosine (NCGC00096083, Figure S6A) and two are G9a inhibitors (NCGC00189139 and NCGC00249822, Figure S6B–C), exhibiting comparable IC50 values ranging from 17.1 – 24.3 μM in both assay formats.33 8-Azidoadenosine and NCGC00249822 were sourced for subsequent MS testing, but showed no inhibition (Figure 5A, data not shown). Considering the limited number and biased structural scaffolds in this Epigenetic Library, we proceeded with the LOPAC®1280 library, because of its diversity in bioactivity, compound annotation, and as a historical screening data set.
qHTS of LOPAC®1280 Library
We carried out a qHTS (final assay concentration of 1.8 nM – 114 μM, 6 plates) using the SAHH-ThioGlo3 assay, and observed excellent assay performance with Z’-factors of 0.78 ± 0.06 and the S/B of 4.1 ± 1.2 (Figure S7A). Intraplate titration of the control peptide Ac-RCCl-10 exhibited an average IC50 of 4.5 ±1.0 μM (Figure 6A), indicating minimal plate-to-plate variation. Based on our curve class criteria, 441 compounds (34%) exhibited inhibition in curve class −1.1, −1.2, −2.1, and −2.2 (Figure 5B and Table S4). Based on our results from the Epigenetic Library SAHH-ThioGlo3 screen, we were not concerned with false-negatives due to inactivity from this format overlapping well with MTase-Glo™. We were able to source 183 compounds for subsequent evaluation in both the SAHH-ThioGlo3 and MTase-Glo™ formats, which were tested at a final concentration range of 0.97 nM to 57.2 μM (11-point, three-fold serial dilutions). The SAHH-ThioGlo3 assay displayed a Z’-factor of 0.65 ± 0.01, and an IC50 of 7.61 ± 1.84 μM (MSR = 2.0) for Ac-RCCl-10 (Figure S7B). The MTase-Glo™ format exhibited a comparable performance with a Z’-factor of 0.70 ± 0.01, and an IC50 of 11.1 ± 0.8 μM (MSR = 1.2) for AcRCC1-10 (Figure S7C).
Figure 6.
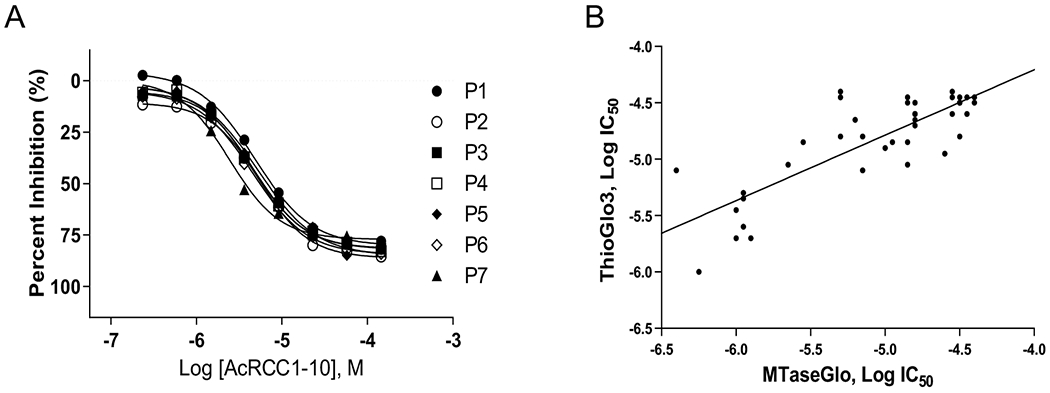
A) Titration of AcRCC1-10 for the LOPAC®1280 screen. B) Log IC50 correlation plot (r2 = 0.67) of compounds that confirmed in both the ThioGlo3 and MTase-Glo™ assays.
As defined before, positive hits were those compounds that yielded curve class values of −1.1, −1.2, −2.1, −2.2, an efficacy of <−40%, and an IC50 of <40 μM. Comparing the two formats, 163 vs. 43 compounds exhibited inhibitory activity in the SAHH-ThioGlo3 and MTase-Glo™ assays, respectively (Table S5 and Figure 5B). For the 39 compounds that were identified as hits in both assay formats, an acceptable correlation (r2) of 0.67 for log (IC50) values with no format more sensitive than the other (Figure 6B). Among those 39 compounds, NCGC00162335 (SCH-202676, IC50 = 1.0 μM) was identified as a potential intraplate control due to its submicromolar potency and in-house supply.34 While we are aware of its promiscuous activity, we found it acceptable as a technical control to assess assay performance. All 4 compounds that were identified as active in only the MTase-Glo™ assay exhibited activity in SAHH-ThioGlo3 but did not meet its active criteria. Likewise, 16 out of the 124 compounds that were identified as active only in the SAHH-ThioGlo assay exhibited inhibitory activity, but did not meet our hit criteria for the MTase-Glo™. The discrepancy between the two assay formats substantiates the importance of conducting an orthogonal assay to confirm screening hits. Based on these results, it becomes clear that MTase-Glo™ offers lower initial hit rate, a primary consideration when choosing a format for HTS of large compound libraries.
Selectivity is critical for an NTMT1 inhibitor to function as a valuable tool compound or chemical probe. We examined HTS results from a previous NCATS screen on identifying inhibitors for NSD2 (histone lysine methyltransferase nuclear receptor-binding SET domain protein 2).29 Of the 39 compounds that met the criteria in both SAHH-ThioGlo and MTase-Glo assays, 26 were selective versus NSD2 (either IC50 > 57 μM or IC50 ratio of NSD2/NTMT1 >5). We were able to source 18 selective and 3 nonselective compounds for further validation in subsequent assays in a 384-well format. In addition, we manually curated 3 compounds active exclusively in SAHH-ThioGlo3 or MTase-Glo™, for a total of 28 compounds (Figure 5B, Table S6).
Validation Assays
Two validation assays were carried out in parallel in a 384-well format. The first was an orthogonal SAHH fluorescence-based assay with an alternative fluorescent dye, Thiol Fluorescent Probe IV (“ThoioGlo4”, Figure 2).35 ThioGlo4 (Ex/Em = 400 nm/465 nm) was selected as a validation assay to remove any false positives induced by specific interference with ThioGlo3 (Ex/Em =340 nm/450 nm). We also chose a different peptide substrate, GPKRIA (Km=0.5 μM) because of its higher reaction rate for NTMT1, resulting in a higher signal to noise ratio.16, 36 Of the 28 tested compounds, 8 were identified as hits (IC50 < 40 μM) with IC50 values ranging from 0.4 μM – 35.1 μM (Table S6). All 8 confirmed hits in SAHH-ThioGlo4 assay displayed selectivity over NSD2. Moreover, 7 out of 8 were active in both SAHH-ThioGlo3 and MTase-Glo™ assays.
In order to confirm the results from fluorescent SAHH-coupled assays, an orthogonal MS-based inhibition study was performed to directly monitor the production of methylated peptides.19, 25 APKRQSPLPP (Km = 2 μM) was used as the peptide substrate for MS study to minimize any interference with the MALDI matrix.19 Of the 8 compounds that exhibited activity in the SAHH-ThioGlo4 assay, 5 exhibited IC50 values ranging from 1.0 – 23 μM in the MS assay (Table S6). Notably, all negative hits in the fluorescence assays remained inactive in MS assay, leading to a false negative rate of zero.
CGP 74514A (NCGC00015229, Figure 7) and 6,7-ADTN (NCGC00015291, Figure 8) are two validated hits after removal three promiscuous compounds, such as the alkylating agent iodoacetamide (NCGC00015548), intraplate control SCH-202676 (NCGC00162335), and an inorganic dye Ruthenium red (NCGC00162333).37, 38 CGP 74514A is a cell-permeable and selective inhibitor of cyclin-dependent kinase 1 (CDK1)/cyclin B (IC50 = 31 nM) although it does inhibit other kinases at μM concentration.37 6,7-ADTN is a highly potent dopamine receptor antagonist for dopamine receptors (IC50 = 1.7 nM).38 Because of high potency of these two hit compounds for other targets, further structural modifications will be needed to increase their specificity and potency for NTMT1.
Figure 7.
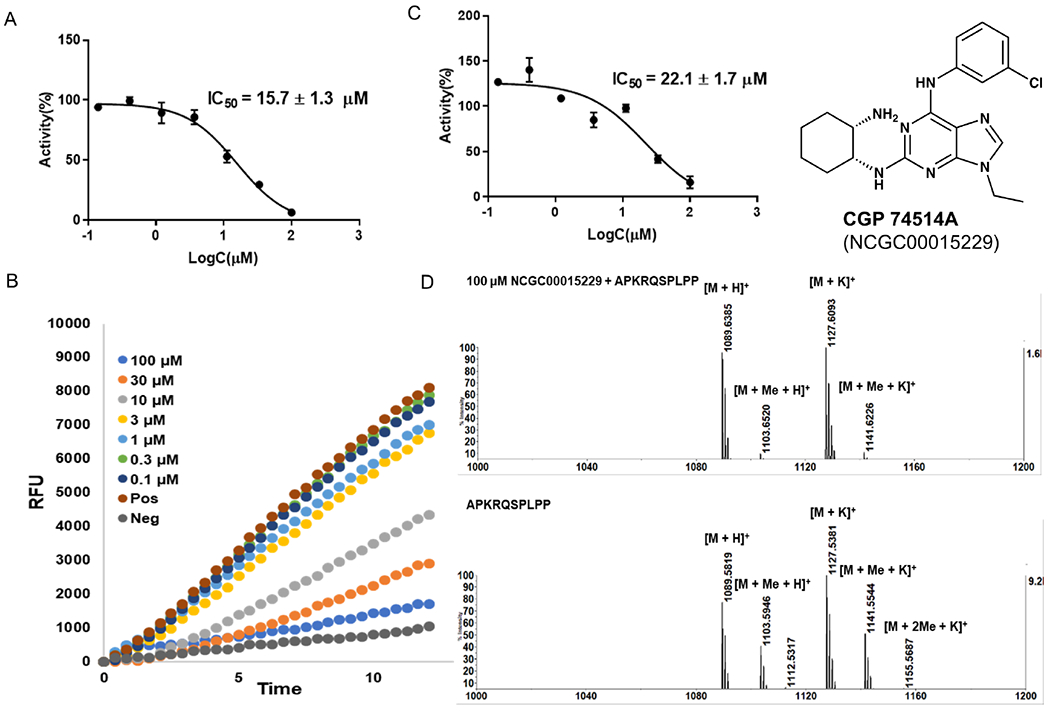
Hit compound CGP 74514A (NCGC00015229). A) IC50 determination in SAHH-ThioGlo4 assay. B) Fluorescence raw data in SAHH-ThioGlo4 assay. C) IC50 determination in MALDI-MS assay. D) MALDI-MS methylation inhibition assay.
Figure 8.
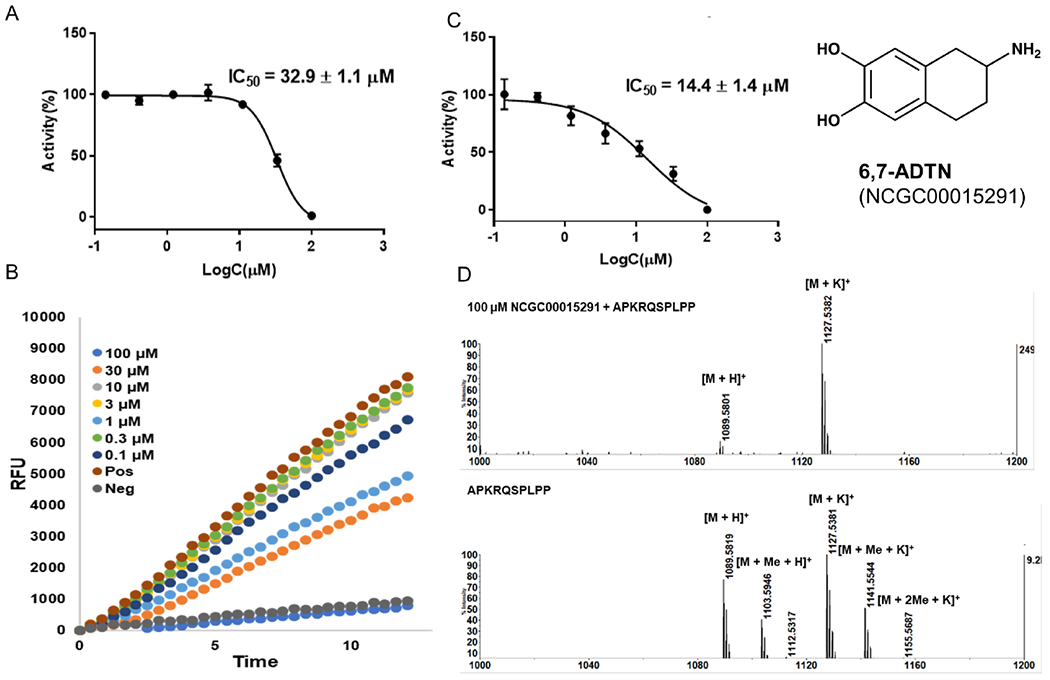
Hit compound 6,7-ADTN (NCGC00015291). A) IC50 determination in SAHH-ThioGlo4 assay. B) Fluorescence raw data in SAHH-ThioGlo4 assay. C) IC50 determination in MALDI-MS assay. D) MALDI-MS methylation inhibition assay.
Conclusions
In summary, we miniaturized both a SAHH-coupled fluorescence assay and MTase-Glo™ assay to 1536-well format. This format enabled us to monitor the catalytic activity of NTMT1 to conduct a screen in qHTS format and identify small molecule inhibitors. Both assays show low reagent requirement, high reproducibility and sensitivity, which have been proven to be robust and adaptable for HTS. In the fluorescence SAHH-coupled assay, a fluorescent dye is added to react with the homocysteine to form a thiol-adduct, which exhibits a strong fluorescence signal. One potential problem for this assay is that the fluorescent dye may interfere with those inherently fluorescent compounds or directly react with the screened compounds. Another potential problem is that the compounds could inhibit SAHH activity to result in false positives. This can be discerned by either varying the SAHH concentration or performing a counter assay with another methyltransferase. On the other hand, MTase-Glo™ assay detects the luminescence from ADP, which can overcome most interference from fluorescent compounds in a screening library. However, compounds interfering with SAHH and additional coupling enzymes for the MTase-Glo™ coupling reactions can also result in false-positives, bolstering the need to counterscreen with another methyltransferase (like NSD2) or addition of SAH to remove compounds that target the coupling system or quench the luminescent signal. The orthogonal MS-based assay directly monitors the production of methylated substrate peptides without the usage of any coupling enzyme, acting as an excellent triage step for validating potential NTMT1 inhibitors. From this pilot screen, MTase-Glo™ appears to produce a slightly lower false positive hit rate than SAHH-ThioGlo3 assay. This is typically viewed as a better option for a primary assay of large scale HTS because the downstream efforts of confirming primary screening hits can be very costly. However, SAHH-ThioGlo4 in a 384-well format demonstrated a lower false positive rate vs. ThioGlo3, indicating the need to investigate its potential as an economical primary assay in future. No false negative hits were noticed among the tested cohort in both assays. Although the two confirmed hits are not desirable for cell-based study due to their high potency for other targets, their structures provide a starting point for further optimization in addition to acting as tool compounds to further research into NTMT1 biology. Importantly, this study has laid the foundation for high-throughput screening to identify small molecule inhibitors of any methyltransferase, as both SAHH-ThioGlo and MTase-Glo™ assays can detect the formation of SAH, which is formed regardless of the MTase used.
Materials and Methods
Materials
All compounds were initially sourced from the National Center for Advancing Translational Studies (NCATS)/National Institutes of Health (NIH). All compounds shipped were subjected to quality control by LC/UV, LC/MS, or HR-MS. All compounds exhibited >90% purity by peak area or m/z. ThioGlo3 obtained from Covalent Associates Inc, Woburn, MA. ThioGlo4 (Glutathione reductase probe or Thiol Fluorescent Probe IV) was obtained from Berry & Associates Inc, Dexter, MI. Nickel-nitrilotriacetic acid resin was used as purchased from Fisher. Human NTMT1 clone (AD-003) was obtained from Addgene. The AdoHcy hydrolase (SAHH) clone was obtained through a Materials Transfer Agreement with Dr. Raymond C. Trievel (University of Michigan) and was expressed and purified as described by Collazo et al.39
Instruments
All peptides were synthesized on a CEM Liberty microwave automatic peptide synthesizer and were purified by a C18 reverse-phase HPLC-Mass system (Agilent) and characterized by an Applied biosystem Voyager MALDI time-of-flight mass spectrometer in positive mode. All IC50 validation studies were performed on a BMG ClarioStar microplate reader.
Expression and purification of NTMT1
His-NTMT1 was purified as previously described by Richardson, et al.25 His-NTMT1 was expressed in Escherichia coli BL21 (DE3) codon plus RIL cells in Terrific Broth medium in the presence of kanamycin, using a pET28a-LIC expression vector that encodes a full-length NTMT1 (amino acids 1–222) with His-6 tag obtained from Addgene. Cells were grown at 37°C induced by isopropyl β-D-l-thiogalactopyranoside and incubated overnight at 15 °C. Cells were harvested by centrifugation and suspended in 25 mM Tris-HCl buffer (pH 8.0) containing 0.3 M NaCl and 10 mM imidazole, lysed and centrifuged for 15 min at 4 °C. The supernatant was purified by a nickel-nitrilotriacetic acid column. The protein was eluted with 25 mM Tris-HCl buffer (pH 8.0) containing 100 mM imidazole and 300 mM NaCl and then dialyzed in the dialysis buffer (25 mM Tris, pH 7.5, 150 mM NaCl, 50 mM KCl) three times to provide His-NTMT1. Protein purity (>95%) was verified by SDS-PAGE and the concentration was determined by the Eppendorf spectrometer.
Synthesis of Peptide Substrates
The peptides were prepared following the standard Fmoc strategy by solid-phase synthesis on the MBHA Rink Amide Resin using a CEM Liberty microwave peptide synthesizer. Fmoc group was removed by 20% (v/v) piperidine in DMF and 0.1M HOBT (2 × 15 min). Ac-RCC1-10 peptide was prepared according to the literature.25
384-well assay
We first dispensed 30 μL of an enzyme mixture containing NTMT1, SAHH, SAM, and ThioGlo3 (final concentrations of 200 nM, 10 μM, 100 μM, and 15 μM, respectively) in assay buffer (25 mM Tris pH 7.5, 10 mM KCl, and 0.01% Triton X-100) into a 384-well assay plate (solid-bottom black plate; Greiner Bio One, Monroe, NC). Next, 10 μL substrate (final concentration 3 μM; Km = 3.2 μM) or buffer were dispensed for a final assay volume of 40 μL, followed by the plate immediately read on a ViewLux High-throughput CCD imager (PerkinElmer, Waltham, MA) equipped with standard UV fluorescence optics (340(30) nm excitation, 450(20) nm emission) then incubated (RT or 37°C, protected from light) and read intermittently over a time period of 10 to 240 minutes. Activities of samples were calculated for the change in fluorescence (∆RFU) by subtracting from the initial read.
384-well Km Determination (SAHH-ThioGlo3)
We dispensed 6 μL of varying substrate (SPRKIA; 15-points, 1:2 dilution; from 3.1 nM to 50 μM) solution into a 384-well plate (Greiner Bio-One, low volume, black solid-bottom, medium binding, non-T/C). To initiate the reaction, a 6 μL enzyme mixture (NTMT1, SAM, SAHH, ThioGlo3 at final concentrations of 125 nM, 50 μM, 5 μM, and 15 μM, respectively) was added to all wells for a final assay volume of 12 μL. The plate was immediately read and detected as outlined above, with the modification of intermittent reading over a time period of 2 to 120 minutes. Activities of samples were calculated for the change in fluorescence (∆RFU) by subtracting from the initial read. The data were fitted to the Michaelis-Menten equation using GraphPad Prism software v8.0 to calculate apparent Km values.
1536-well assay (SAHH-ThioGlo3)
Briefly, 3 μL of enzyme mixture containing NTMT1, SAHH, SAM, and ThioGlo3 (final concentrations of 125 nM, 10 μM, 100 μM, and 15 μM, respectively) in assay buffer (25 mM Tris pH 7.5, 10 mM KCl, and 0.01% Triton X-100) was dispensed into all wells of a 1536-well assay plate (solid-bottom black plate; Greiner Bio One, Monroe, NC). 23 nL of compounds (consisting of 7-plates in qHTS format, final concentration range 18.3 nM to 114 μM) or control Ac-RCC1-10 (final concentration range 234 nM to 143 μM) was transferred via Wako Pin-tool (Wako Automation, Richmond, VA). Next, 1 μL substrate (final concentration 1 μM) or buffer was dispensed for a final assay volume of 4 μL. Samples were read on a ViewLux CCD imager and calculated for the change in fluorescence (∆RFU) by subtracting from the initial read.
1536-well Km Determination (SAHH-ThioGlo3)
We dispensed 3 μL of varying substrate (SPRKIA; 7-points, from 375 nM to 5.0 μM) solution into a 1536-well plate. To initiate the reaction, a 1 μL enzyme mixture (NTMT1, SAM, SAHH, ThioGlo3 at final concentrations of 125 nM, 50 μM, 5 μM, and 15 μM, respectively) was added to all wells for a final assay volume of 4 μL. The plate was immediately read and detected as outlined above, with the modification of intermittent reading over a time period of 1 to 120 minutes. Activities of samples were calculated for the change in fluorescence (∆RFU) by subtracting from the initial read Data were fitted to the Michaelis-Menten equation using GraphPad Prism software v8.0 to calculate apparent Km values.
1536-well assay (MTase-Glo™)
Using the above concentrations and conditions as a starting point, we dispensed 3 μL of enzyme mixture (final concentrations of 125 nM and 100 μM for NTMT1 and SAM, respectively) into all wells of a 1,536-well solid-bottom white plate (Greiner Bio One, Monroe, NC). 23 nL of DMSO or Ac-RCC1-10 (final concentration range 234 nM to 143 μM) was transferred via Wako Pin-tool (Wako Automation, Richmond, VA) and incubated (RT) for ~15 minutes. Next, 1 μL of substrate (final concentration 1 pM) or buffer was dispensed, and the reaction proceeded for 30 minutes (RT, protected from light) followed by a 1 μL addition of [5X] MTase-Glo Reagent®. Samples were incubated (RT, protected from light) for 30 minutes to allow for SAH to be converted to ADP, followed by a 5 μL addition of [1X] MTase-Glo Detection Solution® to allow for ADP to be converted to ATP, which was then detected with a luciferase reaction. Samples were centrifuged for 15 seconds at 1,000 RPM’s, followed by a RT incubation for 30 minutes. Plates were then read using Luminescence optics on a ViewLux detector.
1536-well Km Determination (MTase-Glo™)
We dispensed 3 μL of varying substrate ((SPRKIA; 7-points, from 375 nM to 5.0 μM) solution into a 1536-well solid-bottom white plate. To initiate the reaction, a 1 μL enzyme mixture (NTMT1 and SAM at final concentrations of 125 nM (nominal) and 10 μM, respectively) was added to all wells for a final assay volume of 4 μL. The plate was incubated (RT, protected from light) intermittent over a time period of 1 to 120 minutes followed by a 1 μL addition of [5X] MTase-Glo Reagent®. Samples were incubated (RT, protected from light) for 30 minutes, followed by a 2.5 μL addition of [0.5X] MTase-Glo Detection Solution®. The plate was centrifuged for 15 seconds at 1,000 RPM’s, followed by a RT incubation for 30 minutes and detected as described above. The data were fitted to the Michaelis-Menten equation using GraphPad Prism software v8.0 to calculate apparent Km values.
qHTS data analysis and statistics
Data from each assay were normalized plate-wise to corresponding intra-plate controls (neutral control DMSO and positive control as noted) as described previously.40 The same controls were also used for the calculation of the Z’ factor, a measure of assay quality control, as previously described.41 Percent activity was derived using in-house software (http://tripod.nih.gov/curvefit/). Concentration-response curves were fitted, classified, and IC50 determined as described previously.30 Otherwise, concentration-response curves were fitted and IC50 values were calculated using Prism software (version 8, GraphPad Software, Inc. San Diego, CA), sigmoidal dose-response (variable slope). The chemical structures were standardized using the LyChl (Layered Chemical Identifier) program (version 20141028, https://github.com/ncats/lychi.)42 We used the Palantir (San Francisco, CA) data integration platform, which is configured to ingest all HTS results generated at NCATS, and harmonized this data with other sources such as ChEMBL and OrthoMCL. All qHTS screening results are publicly available at PubChem (https://pubchem.ncbi.nlm.nih.gov/source/NCGC: AID 1347142, 1347143, 1347144, 1347145).
Fluorescent SAHH-coupled Validation Assay
The inhibition activities of the hit compounds were validated using a SAH hydrolase-coupled assay in 384-well format. The inhibitors ranging in concentration (1 μL of 14 μM – 10mM) and following a three-fold dilution were incubated with 0.2 μM NTMT1 with a reaction mixture which was added in the following order: ddH2O (69.5 μL), 10x Tris-HCl Buffer (10 μL of 250 mM Tris pH 7.4, 100 mM NaCl, 500 mM KCl and 0.1% Triton-X), SAH hydrolase (2.5 μL of 100 μM), SAM (1 μL of 300 μM), NTMT1 (5 μL of 4 μM) and ThioGlo4 (1 μL of 1 mM DMSO solution). After 10 mins of incubation at 37°C, the reaction was initiated with 10 μL of 5 μM of GPKRIA. Fluorescence intensity was monitored using a BMG ClarioStar microplate reader (ThioGlo4: Ex = 400 nm, Em = 465 nm) at 37°C for 15 min. The rates were fit to the log[inhibitor] vs response model using least squares nonlinear regression through GraphPad Prism 7 software. All experiments were performed in triplicate.
MALDI-MS Methylation Inhibition Assay
MALDI-MS methylation inhibition assay was performed and analyzed via a Sciex 4800 MALDI TOF/TOF MS. Compounds were tested at 30 μM in a final well volume of 100 μL: 0. 2 μM NTMT1, 20 mM Tris (pH = 7.5), 50 mM KCl, 1 μM AdoMet and incubated at 37°C for 10 mins before the addition of 2 μM APKRQSPLPP peptide to initiate the reaction. After 20 mins, the reactions were quenched in a 1:1 ratio by addition of 100 μL a quenching solution (20 mM NH4H2PO4, 0.4% (v/v) TFA in 1:1 acetonitrile/water). Samples were analyzed by the MALDI-MS with α-Cyano-4-hydroxycinnamic acid (CHCA) matrix solution. Data were processed in Data Explorer. Those compounds that showed over 50% inhibition at 30 μM will be further validated at both 10 and 100 μM.
Supplementary Material
Acknowledgements
We appreciate the support from the Department of Medicinal Chemistry and Molecular Pharmacology (RH) and National Cancer Institute (AD). We would like to thank the NCATS Compound Management, Automation, and Analytical groups for their support. We thank Kyle Brimacombe at NCATS for graphic design assistance, Dr. Quin Hanson for methyltransferase expertise, and Dr. Kelli Wilson for curation of molecules and data integration.
Funding Source
NIH grant U01CA214649 (RH) and P30 CA023168 (Purdue University Center for Cancer Research). Intramural Research Program of the National Center for Advancing Translational Sciences (NCATS), National Institutes of Health (NIH).
Footnotes
Supporting Information. Km Determinations; AcRCC1-10 Control Titration; reagent stability; example curves highlighting qHTS curve classification criteria; assay performance of LOPAC1280 screen; IC50 determinations of NCGC00096083, NCGC00189139, and NCGC00249822.
Reference
- 1.Schapira M Chemical inhibition of protein methyltransferases. Cell Chem. Biol 2016, 23, 1067–1076. [DOI] [PubMed] [Google Scholar]
- 2.Robinson AD; Eich M-L; Varambally S Dysregulation of de novo nucleotide biosynthetic pathway enzymes in cancer and targeting opportunities. Cancer Lett. 2020, 470, 134–140. [DOI] [PubMed] [Google Scholar]
- 3.Stein EM; Garcia-Manero G; Rizzieri DA; Tibes R; Berdeja JG; Jongen-Lavrencic M; Altman JK; Dohner H; Thomson B; Blakemore SJ; Daigle S; Fine G; Waters NJ; Krivstov AV; Koche R; Armstrong SA; Ho PT; Lowenberg B; Tallman MS A phase 1 study of the DOT1L inhibitor, Pinometostat (EPZ-5676), in adults with relapsed or refractory leukemia: safety, clinical activity, exposure and target inhibition. Blood 2015, 126, 2547–2547. [Google Scholar]
- 4.Wang Y; Jadhav A; Southal N; Huang R; Nguyen D-T A grid algorithm for high throughput fitting of dose-response curve data. Curr. Chem. Genomics 2010, 4, 57–66. [DOI] [PMC free article] [PubMed] [Google Scholar]
- 5.Kast D; Espinoza-Fonseca LM; Yi C; Thomas DD Phosphorylation-induced structural changes in smooth muscle myosin regulatory light chain. Proc. Natl. Acad. Sci. U. S. A 2010, 107, 8207–8212. [DOI] [PMC free article] [PubMed] [Google Scholar]
- 6.Taylor KA; Feig M; Brooks CL; Fagnant PM; Lowey S; Trybus KM Role of the essential light chain in the activation of smooth muscle myosin by regulatory light chain phosphorylation. J. Struct. Biol 2014, 185, 375–382. [DOI] [PMC free article] [PubMed] [Google Scholar]
- 7.Kaniskan HO; Martini ML; Jin J Inhibitors of protein methyltransferases and demethylases. Chem. Rev 2018, 118, 989–1068. [DOI] [PMC free article] [PubMed] [Google Scholar]
- 8.Gerry CJ; Schreiber SL Chemical probes and drug leads from advances in synthetic planning and methodology. Nat. Rev. Drug Discovery 2018, 17, 333–352. [DOI] [PMC free article] [PubMed] [Google Scholar]
- 9.Dong C; Mao Y; Tempel W; Qin S; Li L; Loppnau P; Huang R; Min J Structural basis for substrate recognition by the human N-terminal methyltransferase 1. Genes Dev. 2015, 29, 2343–2348. [DOI] [PMC free article] [PubMed] [Google Scholar]
- 10.Schaner Tooley CE; Petkowski JJ; Muratore-Schroeder TL; Balsbaugh JL; Shabanowitz J; Sabat M; Minor W; Hunt DF; Macara IG NRMT is an α-N-methyltransferase that methylates RCC1 and retinoblastoma protein. Nature 2010, 466, 1125–1128. [DOI] [PMC free article] [PubMed] [Google Scholar]
- 11.Huang R Chemical Biology of Protein N-Terminal Methyltransferases. ChemBioChem 2019, 20, 976–984. [DOI] [PMC free article] [PubMed] [Google Scholar]
- 12.Bonsignore LA; Butler JS; Klinge CM; Schaner Tooley CE Loss of the N-terminal methyltransferase NRMT1 increases sensitivity to DNA damage and promotes mammary oncogenesis. Oncotarget 2015, 6, 12248–12263. [DOI] [PMC free article] [PubMed] [Google Scholar]
- 13.Bonsignore LA; Tooley JG; Van Hoose PM; Wang E; Cheng A; Cole MP; Schaner Tooley CE NRMT1 knockout mice exhibit phenotypes associated with impaired DNA repair and premature aging. Mech. Ageing Dev 2015, 146–148, 42–52. [DOI] [PMC free article] [PubMed] [Google Scholar]
- 14.Zhang G; Richardson SL; Mao Y; Huang R Design, synthesis, and kinetic analysis of potent protein N-terminal methyltransferase 1 inhibitors. Org. Biomol. Chem 2015, 13, 4149–4154. [DOI] [PMC free article] [PubMed] [Google Scholar]
- 15.Zhang G; Huang R Facile synthesis of SAM-peptide conjugates through alkyl linkers targeting protein N-terminal methyltransferase 1. RSC Adv. 2016, 6, 6768–6771. [DOI] [PMC free article] [PubMed] [Google Scholar]
- 16.Chen D; Dong G; Noinaj N; Huang R Discovery of bisubstrate inhibitors for protein N-terminal methyltransferase 1. J. Med. Chem 2019, 62, 3773–3779. [DOI] [PMC free article] [PubMed] [Google Scholar]
- 17.Mullard A A snapshot of lead-generation strategies. Nat. Rev. Drug Discovery 2018, 17, 534. [DOI] [PubMed] [Google Scholar]
- 18.Gul S Epigenetic assays for chemical biology and drug discovery. Clin. Epigenet 2017, 9, 41. [DOI] [PMC free article] [PubMed] [Google Scholar]
- 19.Richardson SL; Hanjra P; Zhang G; Mackie BD; Peterson DL; Huang R A direct, ratiometric, and quantitative MALDI-MS assay for protein methyltransferases and acetyltransferases. Anal. Biochem 2015, 478, 59–64. [DOI] [PMC free article] [PubMed] [Google Scholar]
- 20.Quinn AM; Simeonov A Methods for activity analysis of the proteins that regulate histone methylation. Curr. Chem. Genomics 2011, 5, 95–105. [DOI] [PMC free article] [PubMed] [Google Scholar]
- 21.Drake KM; Watson VG; Kisielewski A; Glynn R; Napper AD A sensitive luminescent assay for the histone methyltransferase NSD1 and other SAM-dependent enzymes. Assay Drug Dev. Technol 2014, 12, 258–271. [DOI] [PMC free article] [PubMed] [Google Scholar]
- 22.Burgos ES; Walters RO; Huffman DM; Shechter D A simplified characterization of S-adenosyl-l-methionine-consuming enzymes with 1-Step EZ-MTase: a universal and straightforward coupled-assay for in vitro and in vivo setting. Chem. Sci 2017, 8, 6601–6612. [DOI] [PMC free article] [PubMed] [Google Scholar]
- 23.Banco MT; Mishra V; Greeley SC; Ronning DR Direct detection of products from S-adenosylmethionine-dependent enzymes using a competitive fluorescence polarization assay. Anal. Chem 2018, 90, 1740–1747. [DOI] [PMC free article] [PubMed] [Google Scholar]
- 24.Hsiao K; Zegzouti H; Goueli SA Methyltransferase-Glo: a universal, bioluminescent and homogenous assay for monitoring all classes of methyltransferases. Epigenomics 2016, 8, 321–339. [DOI] [PubMed] [Google Scholar]
- 25.Richardson SL; Mao Y; Zhang G; Hanjra P; Peterson DL; Huang R Kinetic mechanism of protein N-terminal methyltransferase 1. J. Biol. Chem 2015, 290, 11601–11610. [DOI] [PMC free article] [PubMed] [Google Scholar]
- 26.Wu G; Yuan Y; Hodge CN Determining appropriate substrate conversion for enzymatic assays in high-throughput screening. J. Biomol. Screening 2003, 8, 694–700. [DOI] [PubMed] [Google Scholar]
- 27.Copeland RA Evaluation of enzyme inhibitors in drug discovery: a guide for medicinal chemists and pharmacologists, 2nd Ed. John Wiley & Sons: New Jersey: 2013; p 245–285. [PubMed] [Google Scholar]
- 28.Simeonov A; Jadhav A; Thomas CJ; Wang Y; Huang R; Southall NT; Shinn P; Smith J; Austin CP; Auld DS; Inglese J Fluorescence spectroscopic profiling of compound libraries. J. Med. Chem 2008, 51, 2363–2371. [DOI] [PubMed] [Google Scholar]
- 29.Coussens NP; Kales SC; Henderson MJ; Lee OW; Horiuchi KY; Wang Y; Chen Q; Kuznetsova E; Wu J; Chakka S; Cheff DM; Cheng KC-C; Shinn P; Brimacombe KR; Shen M; Simeonov A; Lal-Nag M; Ma H; Jadhav A; Hall MD High-throughput screening with nucleosome substrate identifies small-molecule inhibitors of the human histone lysine methyltransferase NSD2. J. Biol. Chem 2018, 293, 13750–13765. [DOI] [PMC free article] [PubMed] [Google Scholar]
- 30.Inglese J; Auld DS; Jadhav A; Johnson RL; Simeonov A; Yasgar A; Zheng W; Austin CP Quantitative high-throughput screening: A titration-based approach that efficiently identifies biological activities in large chemical libraries. Proc. Natl. Acad. Sci. U. S. A 2006, 103, 11473–11478. [DOI] [PMC free article] [PubMed] [Google Scholar]
- 31.Yasgar A; Shinn P; Jadhav A; Auld D; Michael S; Zheng W; Austin CP; Inglese J; Simeonov A Compound management for quantitative high-throughput screening. JALA Charlottesv Va 2008, 13, 79–89. [DOI] [PMC free article] [PubMed] [Google Scholar]
- 32.Auld DS; Inglese J Interferences with luciferase reporter enzymes In Assay Guidance Manual, 2018, https://www.ncbi.nlm.nih.gov/books/NBK374281/.
- 33.Liu F; Chen X; Allali-Hassani A; Quinn AM; Wigle TJ; Wasney GA; Dong A; Senisterra G; Chau I; Siarheyeva A; Norris JL; Kireev DB; Jadhav A; Herold JM; Janzen WP; Arrowsmith CH; Frye SV; Brown PJ; Simeonov A; Vedadi M; Jin J Protein lysine methyltransferase G9a inhibitors: design, synthesis, and structure activity relationships of 2,4-diamino-7-aminoalkoxy-quinazolines. J. Med. Chem 2010, 53, 5844–5857. [DOI] [PMC free article] [PubMed] [Google Scholar]
- 34.Yasgar A; Foley TL; Jadhav A; Inglese J; Burkart MD; Simeonov A A strategy to discover inhibitors of Bacillus subtilis surfactin-type phosphopantetheinyl transferase. Mol. BioSyst 2010, 6, 365–375. [DOI] [PMC free article] [PubMed] [Google Scholar]
- 35.Yi L; Li H; Sun L; Liu L; Zhang C; Xi Z A highly sensitive fluorescence probe for fast thiol-quantification assay of glutathione reductase. Angew. Chem. Int. Ed 2009, 48, 4034–4037. [DOI] [PubMed] [Google Scholar]
- 36.Dong C; Dong G; Li L; Zhu L; Tempel W; Liu Y; Huang R; Min J An asparagine/glycine switch governs product specificity of human N-terminal methyltransferase NTMT2. Commun. Biol 2018, 1, 183. [DOI] [PMC free article] [PubMed] [Google Scholar]
- 37.Imbach P; Capraro H-G; Furet P; Mett H; Meyer T; Zimmermann J 2,6,9-trisubstituted purines: Optimization towards highly potent and selective CDK1 inhibitors. Bioorg. Med. Chem. Lett 1999, 9, 91–96. [DOI] [PubMed] [Google Scholar]
- 38.Burn P; Crooks PA; Heatley F; Costall B; Naylor RJ; Nohria V Synthesis and dopaminergic properties of some exo- and endo-2-aminobenzonorbornenes designed as rigid analogs of dopamine. J. Med. Chem 1982, 25, 363–368. [DOI] [PubMed] [Google Scholar]
- 39.Collazo E; Couture J-F; Bulfer S; Trievel RC A coupled fluorescent assay for histone methyltransferases. Anal. Biochem 2005, 342, 86–92. [DOI] [PubMed] [Google Scholar]
- 40.Seethala R; Zhang L Handbook of Drug Screening. Informa Healthcare: New York: 2009; p 489. [Google Scholar]
- 41.Zhang J-H; Chung TDY; Oldenburg KR A simple statistical parameter for use in evaluation and validation of high throughput screening assays. J. Biomol. Screening 1999, 4, 67–73. [DOI] [PubMed] [Google Scholar]
- 42.Stefaniak F Prediction of compounds activity in nuclear receptor signaling and stress pathway assays using machine learning algorithms and low-dimensional molecular descriptors. Front. Environ. Sci 2015, 3, 77. [Google Scholar]
Associated Data
This section collects any data citations, data availability statements, or supplementary materials included in this article.


