

Abstract
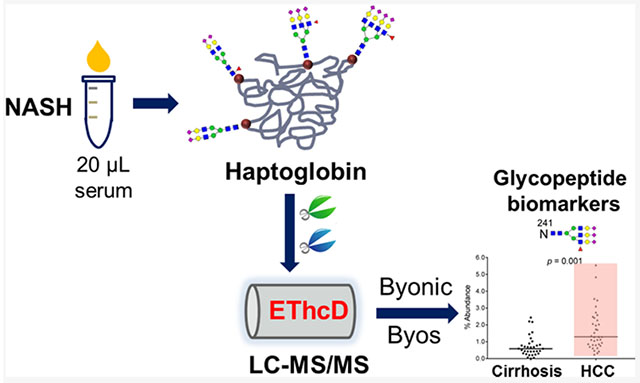
Nonalcoholic steatohepatitis (NASH) is rising in prevalence in the United States and is a growing cause of hepatocellular carcinomas (HCCs). Site-specific glycan heterogeneity on glycoproteins has been shown as a potential diagnostic biomarker for HCC. Herein, we have performed a comprehensive screening of site-specific N-glycopeptides in serum haptoglobin (Hp), a reporter molecule for aberrant glycosylation in HCC, to characterize glycopeptide markers for NASH-related HCCs. In total, 70 NASH patients (22 early HCC, 15 advanced HCC, and 33 cirrhosis cases) were analyzed, with Hp purified from 20 μL of serum in each patient, and 140 sets of mass spectrometry (MS) data were collected using liquid chromatography coupled with electron-transfer high-energy collisional dissociation tandem MS (LC-EThcD-MS/MS) for quantitative analysis on a novel software platform, Byos. Differential quantitation analysis revealed that five N-glycopeptides at sites N184 and N241 were significantly elevated during the progression from NASH cirrhosis to HCC (p < 0.05). Receiver operating characteristic (ROC) curve analysis demonstrated that the N-glycopeptides at sites N184 and N241 bearing a monofucosylated triantennary glycan A3G3F1S3 had the best diagnostic performance in detection of early NASH HCC, area under the curve (AUC) = 0.733 and 0.775, respectively, whereas α-fetoprotein (AFP) had an AUC of 0.692. When combined with AFP, the two panels improved the sensitivity for early NASH HCC from 59% (AFP alone) to 73% while maintaining a specificity of 70%, based on the optimal cutoff. Two-dimensional (2-D) scatter plots of the AFP value and N-glycopeptides showed that these N-glycopeptide markers detected 58% of AFP-negative HCC patients as distinct from cirrhosis. These site-specific N-glycopeptides could serve as potential markers for early detection of HCC in patients with NASH-related cirrhosis.
Keywords: NASH, HCC, site-specific glycopeptides, EThcD-MS/MS, haptoglobin, Byologic, Byos
Graphical Abstract
■ INTRODUCTION
Nonalcoholic steatohepatitis (NASH) has become a leading cause of chronic liver disease in the United States.1,2 The prevalence of NASH continues to increase due to the rising rates of obesity, diabetes, and metabolic syndrome.3 NASH can lead to development of cirrhosis and its complications including hepatocellular carcinoma (HCC).4 The annual risk of developing hepatocellular carcinomas (HCCs) in patients with NASH is 1—3%.5 Since 80–90% of HCCs occur within underlying cirrhosis,6 the American Association for the Study of Liver Disease (AASLD) guidelines recommend HCC surveillance in adults with cirrhosis using abdominal ultrasound with or without α-fetoprotein (AFP) at 6-month intervals.7,8 However, patients with NASH often have comorbid central obesity, reducing the sensitivity of US surveillance.9 Therefore, a biomarker-based approach for HCC early detection in patients with NASH is urgently needed.
Serum provides an important biomarker source since the majority of blood proteins are synthesized and secreted by the liver, potentially carrying molecular indicators of the progression of liver disease.10,11 Serum AFP is the most widely used biomarker for HCC in clinic practice; however, the sensitivity of ultrasound and AFP in combination is only approximately 60%, missing over one-third of HCC at an early stage.12 Several efforts are underway devoted to discovering new biomarkers for HCC. One such approach involves characterizing the aberrant glycosylation due to its direct correlation with tumori-genesis,13,14 in particular altered fucosylation15–17 and sialylation.18 Serum haptoglobin (Hp), containing four N-glycosylation sites, has been demonstrated as a reporter molecule for aberrant glycosylation in the development of HCC19 and other cancers.20–23 The fucosylated/sialylated glycan structures of serum Hp were significantly elevated in HCC compared to cirrhosis.19,24–27 These subtle but significant glycosylation structural changes can be detected due to recent advances in mass spectrometry (MS)28–31 and data interpretation software,32,33 which can provide highly specific fingerprints of malignancy. Though Hp glycan/glycopeptide structural changes have been extensively explored for HCC diagnosis in the etiologies of hepatitis B virus (HBV),24,25,34 hepatitis C virus (HCV),25,26,35–37 and alcohol disease (ADD),25 Hp N-glycosylation profiling and diagnostic performance in NASH-related HCC have not been well studied.
In recent work, we have developed an electron-transfer higher-energy collision dissociation (EThcD) MS/MS-based workflow for differential quantitation of changes in site-specific glycoform microheterogeneity of serum Hp between liver disease states.38 With a combination of EThcD-MS/MS fragmentation39 and data interpretation/quantitation softwares, Byonic40 and Byologic (Protein Metrics), the glycoforms of Hp at individual glycosites were identified and quantitated in early HCV-related HCC compared to cirrhosis.38
In this study, we have now performed a comprehensive biomarker analysis of site-specific N-glycopeptides in serum Hp for early detection of HCC in patients with NASH-related cirrhosis. We have extended the quantitative EThcD-MS/MS workflow to NASH patients (n = 70) and also added Byos (Protein Metrics), a novel data quantitation platform, to enable differential quantitation analysis of site-specific N-glycopeptides in this large data set, i.e., 140 MS/MS data sets. We have characterized the site-specific N-glycan heterogeneity of serum Hp in NASH-related HCC and cirrhosis patients and evaluated the utility of the Hp N-glycopeptide markers for early diagnosis of HCC in patients with NASH cirrhosis and monitoring NASH disease progression.
■ MATERIALS AND METHODS
Serum Samples
Serum samples from patients with NASH-related HCC (n = 37) or NASH-related cirrhosis (n = 33) were provided by the UT Southwestern Medical Center, Dallas, Texas, according to IRB approval. Informed consent was obtained from all subjects. All HCC and cirrhosis patients in this study were NASH-related.
The clinical features of the patients are summarized in Table 1. Summary statistics are used to describe the patient characteristics. In addition to AFP, other clinical variables such as total bilirubin (TBili), the international normalized ratio (INR)’ creatinine, the model for end-stage liver disease (MELD) score, the Child–Turcotte–Pugh (CTP) score, and tumor size were available. Continuous variables are summarized using the median with the interquartile range (IQR). The CTP score is a scoring system to assess the severity of cirrhosis, where patients can be classified into three Child–Pugh classes (A: 5–6 points, B: 7–9 points, and C: 10–15 points). The HCC samples were comprised of different clinical stages (TNM classification): stage I, n = 19; stage II, n = 3; stage III, n = 9; and stage IV, n = 6. All of the HCC patients in the study had cirrhosis, which is the intended population for HCC screening. We did not include healthy subjects in this study since (1) the aim is to screen for potential biomarkers for detection of HCC among patients suffering from cirrhosis; (2) emerging evidence has confirmed that the glycosylation patterns of Hp are significantly different between liver disease and healthy subjects, in particular in the case of multifucosylation and multisialylation. Samples were aliquoted and stored at −80 °C until further use to avoid freeze–thaw cycles.
Table 1.
Clinical Characteristics of Partients With NASHa
| cirrhosis | HCC | P | |
|---|---|---|---|
| N | 33 | 37 | |
| gender % (M/F) | 18/82 | 51/49 | 0.010 |
| age (years) | 62 (56–66) | 65.8 (61–76) | 0.003 |
| laboratory | |||
| AFP (ng/mL) | 3.0 (2.3–5.2) | 6.7 (4.0–189.2) | 0.0001 |
| TBili (mg/dL) | 0.6 (0.4–1.2) | 0.7 (0.45–1.95) | 0.223 |
| ALT | 29 (21.2–41.5) | 36 (23.5–52) | 0.139 |
| AST | 39 (30.2–49.5) | 53 (33.5–79.5) | 0.021 |
| INR | 1.1 (1.0–1.2) | 1.1 (1.0–1.2) | 0.995 |
| creatinine (mg/dL) | 0.81 (0.67–1.05) | 0.84 (0.69–1.05) | 0.897 |
| score | |||
| MELD | 8 (6–10) | 8 (6–11) | 0.639 |
| CTP | 5 (5–6) | 6 (5–7) | 0.025 |
| TNM stage % (I/II/III/IV) | NA | 52/8/24/16 | |
| ascites (%) | 18 | 32 | |
| encephalopathy (%) | 12 | 11 | |
| child’s class A | 28 (85%) | 24 (65%) | |
| child’s class B | 5 (15%) | 10 (27%) | |
| early HCC | NA | 22 (60%) | |
| AFP < 20 ng/mL | 33 (100%) | 26 (70%) | |
| tumor size (cm) | NA | 4.25 (2.5–8.2) | |
AFP, TBili’ ALT, AST, INR, and creatinine values and MELD and CTP scores were provided by the Hospital. Values are presented as the median with the interquartile range (IQR). AFP: α-fetoprotein; TBili: total bilirubin; ALT: alanine aminotransferase; AST: aspartate aminotransferase; INR: international normalized ratio; MELD: model for end-stage liver disease; CTP: Child–Turcotte–Pugh.
Study Design
The expression of site-specific N-glycopeptides of Hp was assessed on serum of patients with NASH-related HCC and cirrhosis, using an EThcD-MS/MS-based workflow.38 The workflow enables label-free quantitation of the microheterogeneity of site-specific N-glycopeptides in serum Hp between disease groups, which includes: (1) Hp purification from 20 μL of patient serum using a high-performance liquid chromatography (HPLC)-based anti-Hp column, (2) double digestion of Hp using trypsin/GluC and glycopeptide enrichment with HILIC TopTips, (3) LC-EThcD-MS/MS analysis of glycopeptides with two replicates for each sample on an Orbitrap Fusion Lumos Tribrid Mass Spectrometer, and (4) data interpretation and quantitation using Byonic and Byologic software packages (Protein Metrics). In this study, we further applied a novel data quantitation platform, Byos (Protein Metrics), to integrate the quantitative results from this large data set, i.e., 140 MS/MS data sets. Site-specific N-glycopeptides were quantified to determine glycopeptide biomarkers for distinguishing NASH-related HCC from NASH-related cirrhosis patients.
Haptoglobin Purification
Hp was purified from 20 μL of patient serum using an in-house antibody-immobilized HPLC column41 on a Beckman Coulter HPLC system (Fullerton, CA) as described previously.38 The eluted Hp fraction was desalted using a 4 mL centrifugal filter device (3 kDa MWCO, Millipore) and then dried down in a SpeedVac concentrator (Thermo). The purity of the Hp eluent was evaluated by SDS-PAGE gel followed with silver staining using a ProteoSilver Plus silver stain kit (Sigma). The Hp eluent (1/10) was loaded onto the gel, with 0.3 μg of an Hp standard protein (Abcam) as a reference. To eliminate the variation in protein abundance among samples, the same amount of Hp from individual patients, an estimated ~3 μg, was used for the subsequent enzymatic digestion.
Double Enzymatic Digestion, Glycopeptide Enrichment, and LC-EThcD-MS/MS
Double enzymatic digestion and glycopeptide enrichment were performed as described previously. Briefly, the purified serum Hp (~3 μg) was dissolved in 50 mM NH4HCO3, reduced with 20 mM dithiothreitol (DTT), and alkylated with 50 mM iodoacetamide (IAA). To the sample, 0.2 μg of trypsin (Promega, Madison, WI) was added and incubated at 37 °C overnight. After quenching the reaction at 95 °C for 10 min, 0.2 μg of GluC (Promega, Madison, WI) was added and incubated at 37 °C for 12 h. The sample was dried down and then reconstituted in 15 μL of 85% acetonitrile containing 15 mM ammonium acetate, pH 3.5, where glycopeptides were enriched using HILIC TopTips (Glygen, Columbia, MD) according to the procedure described previously.38
The enriched glycopeptides were dissolved in 0.1% formic acid (FA) and analyzed with two injections on the Orbitrap Fusion Lumos Tribrid Mass Spectrometer (Thermo) coupled with a Dionex UPLC system. A binary solvent system was composed of 0.1% FA in H2O (A) and 80% CH3CN/0.1% FA (B). Samples were separated on a 75 μm × 50 cm column (C18, 2 μm, 100 Å; Thermo) under a 90 min linear gradient from 2 to 40% B at a flow rate of 300 nL/min. The MS instrument was operated in data-dependent mode. The MS1 scans (m/z 350–1800) were acquired in the Orbitrap (120 K resolution, 4e5 AGC, 100 ms injection time) followed by EThcD-MS/MS acquisition of the precursors with the highest charge states in the order of intensity and detection in the Orbitrap (60 K resolution, 3e5 AGC, 250 ms injection time). The calibrated charge-dependent electron transfer dissociation (ETD) parameters were applied, and EThcD was supplemented by 33% higher-energy collisional dissociation (HCD) activation. Dynamic exclusion was enabled with an exclusion duration of 30 s and both mass tolerances of low and high as 10 ppm.
The mass spectrometry data have been deposited to the ProteomeXchange Consortium via the PRIDE42 partner repository with the data set identifier PXD018502.
Data Interpretation and Relative Quantitation
All spectra were searched with Byonic (Protein Metrics), a software for peptide and protein identification based on MS tandem spectra, which is one of the few software packages that can analyze EThcD-MS/MS data.40 A UniProt human Hp database (P00738) was used for data searching. Based on the N-glycans reported in the literature for serum Hp in liver disease,26,37,38,41,43,44 an N-glycan database containing 53 human N-glycans was employed (Table S1). The search was performed using the parameters: (1) fixed modification, carbamidomethyl (C); (2) variable modifications, oxidation (M) and deamidation (N; Q), and N-glycan modifications (N); (3) up to two missed cleavages; and (4) mass tolerance, 10 ppm for MS1 and 20 ppm for MS2. The results were filtered at a confidence threshold of the Byonic score > 100, delta modification score > 10, PEP2D < 0.05, and FDR2D < 0.01. The manual check criteria include the retention time, the presence of oxonium ions, e.g., m/z 204.09 for HexNAc, 292.10 for NeuAc, 274.09 for NeuAc-H2O, 366.14 for HexHexNAc, 512.20 for HexHexNAcFuc, and 657.23 for HexNAcHexNeuAc. The monoisotopic peak and diagnostic oxonium ion were further checked in the case of 2Fuc-1.02 = 1NeuAc to eliminate the false assignment of the glycopeptide-containing NeuAc residue to that with 2Fuc residues.
Automatic quantitative analysis was performed using Byologic (Protein Metrics) as described previously,38 which inputs both MS1 raw data and Byonic search results. With Byologic, the peak area of the XIC of a given glycopeptide was automatically integrated and normalized against the sum of peak areas of all glycopeptides in Hp identified in each MS run, providing a relative quantitation of each N-glycopeptide of Hp in the sample. The abundance of a site-specific glycoform was represented by the sum of the glycopeptides bearing the same glycan at the glycosite. The relative quantitation of a site-specific glycoform at the glycosite level was also automatically achieved by normalization against all glycopeptides identified at the given glycosite in each MS run.
The Byologic quantitative results were further uploaded into Byos (Protein Metrics), a novel software platform that can process a large number of MS data sets in one project for data comparison, in this case 140 MS data sets. The relative quantitation result was exported as an Excel file. Since each sample was analyzed with two injections, the average normalized abundance of a site-specific N-glycopeptide from the two replicates was used to measure its relative levels between disease groups.
In the main text, glycans were described as AxGxFxSx according to the Oxford glycan nomenclature, i.e., Ax, number (x) of antenna; Gx, number (x) of linked galactose on antenna; Fx, number (x) of fucose; Sx, number (x) of sialic acids. For example, A3G3F2S2 represents the triantennary trigalactosylated bifucosylated bisialylated glycan.
Statistical Analysis
Patient characteristics and biomarkers are reported as the median with the interquartile range (IQR), means ± standard deviation (SD), or frequency, as appropriate. Chi-square test was used to compare the frequency of discrete variables between groups. Wilcoxon rank-sum test or Kruskal—Wallis test was used to compare the value of continuous variables across groups. A value of p < 0.05 was considered statistically significant. The reproducibility analysis of five replicates of an Hp standard sample was performed with the Perseus software,45 and the heat map was generated with HemI 1.0.46 Hierarchical clustering analysis was performed using Perseus. The scatter plots of the differentially expressed site-specific N-glycopeptides between HCC and cirrhosis patients were generated with GraphPad Prism 8 (La Jolla, CA). The correlation of differentially expressed N-glycopeptides at sites N184 and N241 was summarized using the Spearman correlation coefficient. A logistic regression model is used to combine the site-specific glycopeptide biomarker candidates with AFP in the marker panel development. Receiver operation characteristic (ROC) curves were constructed. The area under the curve (AUC) was calculated, and its 95% confidence interval (CI) was estimated using SPSS 16.0. p-Values comparing AUCs between markers and marker panels were calculated using R statistical software.
■ RESULTS AND DISCUSSION
Patients’ Characteristics
There were 70 patients involved in this study, including 33 NASH-related cirrhosis and 37 NASH-related HCC cases. The characteristics of the patients are summarized in Table 1. The majority (95.7%) of patients had Child Pugh A or B cirrhosis, as these are the subgroups of cirrhosis patients who benefit from surveillance and are the recommended population per AASLD guidelines. All HCC patients in the study had cirrhosis, which is the intended population for HCC screening.
There was no statistically significant difference in bilirubin, ALT, INR, and creatinine levels between cirrhosis and HCC patients, with median MELD scores of 8 for both groups; however, there was a significant difference in the CTP score (p = 0.025) and AST (p = 0.021) between cirrhosis and HCC groups. HCC patients included different TNM stages, with 22 HCC patients diagnosed at early stages (stages I and II) and 15 at advanced stages (stages III and IV). As expected, AFP levels were higher among HCC patients, with median AFP of 3.0 ng/mL for cirrhosis and 6.7 ng/mL for HCC patients (p = 0.0001). However, AFP was below the traditional surveillance cutoff of 20 ng/mL in 26 (70%) of HCC patients.
There were more female patients in the cirrhosis group than those in the HCC group in this study (p = 0.010), which was not seen in other studies. The median age was 62.0 years for the cirrhosis group and 65.8 years for the HCC group, indicating that NASH-related HCC patients tended to be older than those with NASH-related cirrhosis at the time of diagnosis (p = 0.003).
Hp Purification and EThcD-MS/MS Analysis
Hp was immunopurified from 20 μL of serum in each patient using an HPLC-based anti-Hp column. The purification was achieved in 30 min for each sample, which was distinctly more efficient than conventional immunoprecipitation.41 A blank run was performed after running each serum sample, showing that there was no carryover between runs. The abundance of the purified Hp in each patient was evaluated by the HPLC peak area and sodium dodecyl sulfate-polyacrylamide gel electrophoresis (SDS-PAGE) gel. A representative HPLC chromatogram and a gel image are shown in Figure 1A,B. Based on the gel result, an estimate of 3 μg of Hp from individual patients was used for MS analysis to eliminate variations in protein abundances between samples.
Figure 1.
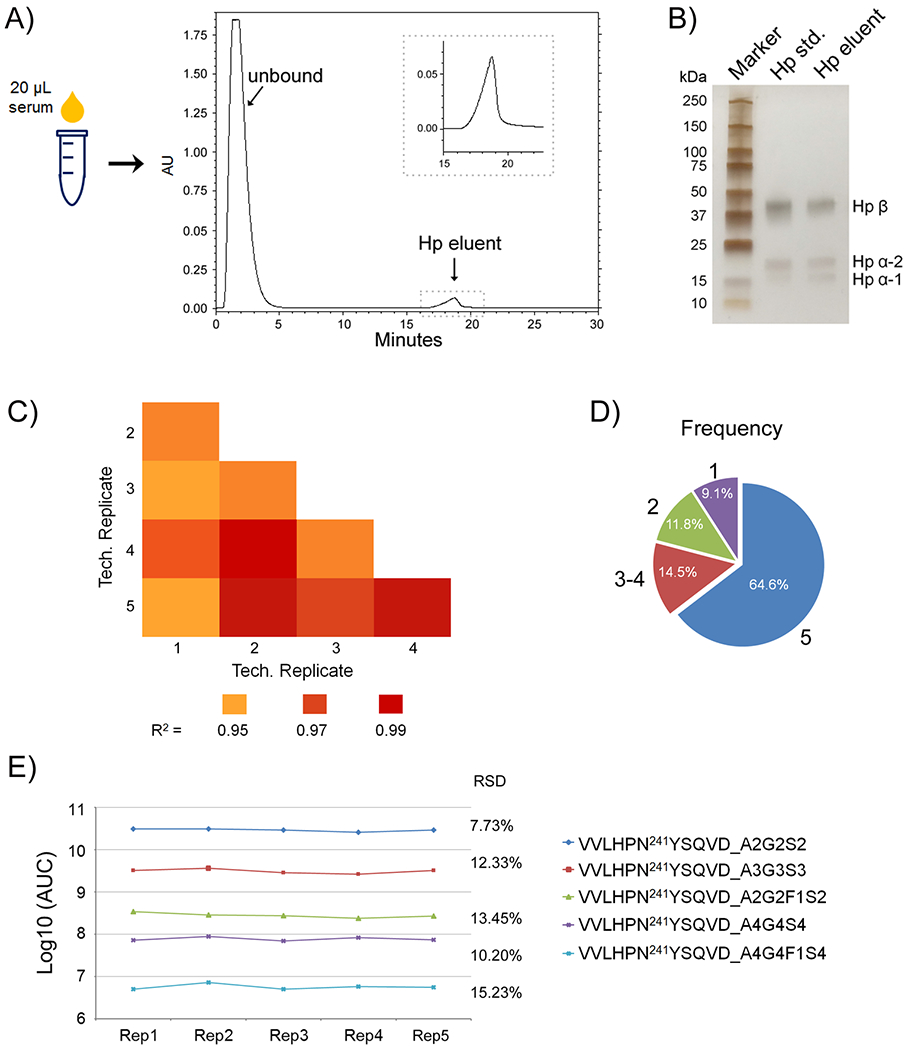
(A) HPLC purification of Hp from 20 μL of patient serum. The insert is an enlarged image showing the elution peak of Hp. (B) Evaluation of purified serum Hp by one-dimensional (1-D) gel, with an Hp standard protein as a reference. (C–E) Method reproducibility analysis of five technical replicates processed at five different times. (C) Pearson correlation coefficient R2 values for the binary comparison of the five technical replicates. (D) Frequency of glycopeptide identification present in all five technical replicates, in 3–4, in 2, or only in 1. (E) Reproducibility of the AUC of glycopeptides at the site N241 differing in abundance by 5 orders of magnitude among the five technical replicates.
Serum Hp has four potential glycosylation sites (N184, N207, N211, and N241) on its β chain. In this study, GluC, which cleaves at either aspartic (D) or glutamic acid (E) residues, was coupled with trypsin to further separate the two glycosites of N207 and N211 as reported previously.26,38,43,44 In ammonium bicarbonate buffer, GluC specificity is high at the glutamic acid residues but weak at the aspartic. Thus, at the site N241, both g l y c o p e p t i d e s V V L H P N 2 4 1 Y S Q V D and VVLHPN241YSQVDIGLIK were generated due to the incomplete cleavage by GluC.
After enrichment using HILIC tips, N-glycopeptides of serum Hp from individual patients were analyzed with two injections by nano LC-EThcD-MS/MS. A representative extracted ion chromatogram (XICs) of MS/MS spectra of the HexNAc oxonium ion (HexNAc+) at m/z 204.087 is shown in Supporting Information Figure S1, displaying the major peaks derived from the glycopeptides of MVSHHN184LTTGATLINE, NLFLN207HSE, VVLHPN241 YSQVD, and VVLHPN241YSQVDIGLIK. The short peptide N211ATAK was difficult to detect by RP C18 chromatography due to its high hydrophilicity.26,43
We further selected the glycosites N184 and N241 for differential quantitation of site-specific glycoforms in serum Hp between HCC and cirrhosis since these two sites contain the most informative glycopeptides bearing a large number of multifucosylated/sialylated glycans, which are highly related to liver diseases.26,38
Method Reproducibility
We evaluated the reproducibility of the method by five independent replicates of an Hp standard that have been processed at five different times. As shown in Figure 1C, the Pearson correlation coefficient R2 values for the binary comparison of the five technical replicates were from 0.955 to 0.995, demonstrating good reproducibility of the method. A pie chart indicates the frequency of glycopeptide quantification, which was present in all five replicates, in 3–4, in 2, or only in 1 (Figure 1D). The result showed that over 90% of glycopeptides were identified in more than two replicates. The reproducibility of the AUC of glycopeptides at the site N241 differing in abundance by 5 orders of magnitude has also been investigated (Figure 1E). The relative standard deviation (RSD) of the five replicates for the most abundant glycopeptide at the site 241 (VVLHPN241YSQVD_A2G2S2) was 7.73%, followed by 12.33% for VVLHPN241YSQVD_A3G3S3, and 13.45% for VVLHPN241YSQVD_A2G2F1S2. The low-abundant glycopeptides of VVLHPN241YSQVD_A4G4S4 and VVLHPN241YSQVD_A4G4F1S4 had a RSD of 10.20 and 15.23%, respectively.
We also assessed the reproducibility of the method using serum samples where two aliquots of 20 μL serum samples from an HCC patient were processed at different times, followed by two injections each for LC-MS/MS analysis. Taking the low-abundance N-glycopeptide of VVLHPN241YSQVD_A4G4F1S4 as an example, the RSD of the peak area in the four technical replicates of the serum sample was 12.6%, showing good reproducibility of the method.
N-Glycopeptide Identification
N-glycopeptides were characterized by EThcD-MS/MS, of which ETD is well known to preserve labile PTMs on peptide backbones while a supplemental HCD is applied to ions formed by ETD to incorporate both glycan and peptide fragment ions in a single MS/MS spectrum.39 All glycopeptide spectrum matches were searched by Byonic software (Protein Metrics) with strict mass tolerances (10 ppm precursor/20 ppm product ion tolerance). Representative MS/MS spectra of N-glycopeptides of VVLHPN241YSQVDIGLIK bearing the glycan A2G2S2 and A3G3F1S3, respectively, are shown in Figure 2.
Figure 2.
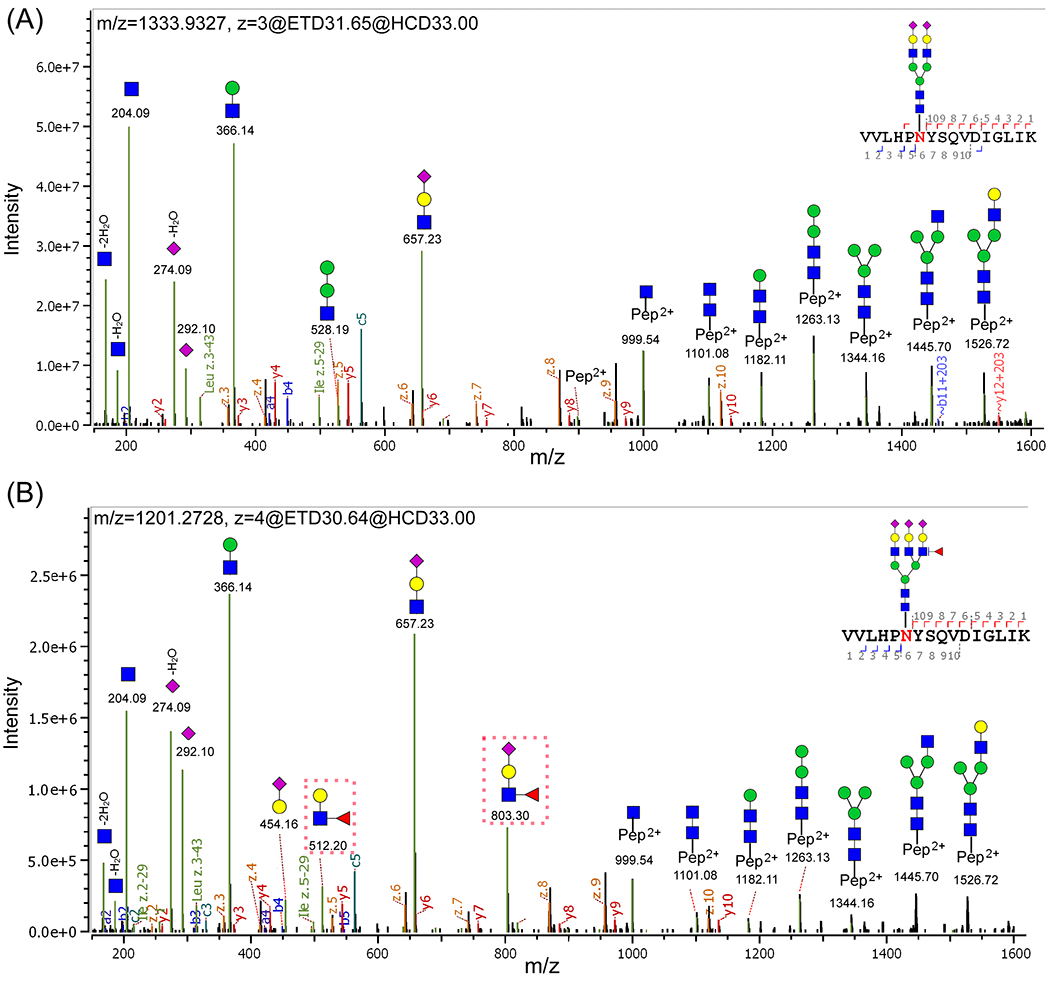
Representative MS/MS spectra of N-glycopeptides of VVLHPN241YSQyDIGLIK with the glycan (A) A2G2S2 and (B) A3G3F1S3. The oxonium ions, glycosidic fragments, and b/y, c/z fragments from the peptide backbone were well characterized. (B) Specific diagnostic fragment ions at m/z 512.20 and 803.30 (marked by red dashed rectangles) confirmed the outer-arm fucosylation. (The symbols used in the structural formulas: blue square = GlcNAc; green circle = Man; yellow circle = Gal; red triangle = Fuc; purple diamond = NeuAc.).
As shown in Figure 2A, there are three sets of product ions in a typical glycopeptide EThcD-MS/MS spectrum: glycan fragments (oxonium ions), b/y and c/z ions from peptide backbones, and glycosidic fragments with the sequential loss of monosaccharides from the parent glycopeptide. The most intense peaks are oxonium ions, such as HexNAc (m/z 204.09), HexHexNAc (m/z 366.14), NeuAc (m/z 292.10), NeuAc-H2O (m/z 274.09), and HexNAcHexNeuAc (m/z 657.23). The second most intense peaks are glycosidic fragments, including Y1 (peptide + HexNAc), Y2 (peptide + 2HexNAc), Y3 (peptide + 2HexNAcHex), Y4 (peptide + 2HexNAc2Hex), Y5 (peptide + 2HexNAc3Hex), Y6 (peptide + 3HexNAc3Hex), and Y7 (peptide + 3HexNAc4Hex). These fragments were sufficient to identify the glycopeptide with detailed information for both glycans and peptide. The less intense peaks are b/y and c/z ions from peptide backbones. All matched fragment ions are labeled in the spectrum. The distribution of these fragment ions was consistent with reports in the literature.39 By combining the presence of intense oxonium ions and Y ions, as well as filtering all glycopeptide matches with MS1 accuracy of 10 ppm and MS2 accuracy of 20 ppm, these fragments were sufficient to identify the glycopeptides.
For N-glycopeptides with the fucose moiety, specific diagnostic fragment ions in EThcD spectra can further provide detailed structural information such as core- and outer-arm fucose. For example, as shown in Figure 2B, the diagnostic fragment ions of HexHexNAcFuc at m/z 512.20 and FucHexNAcHexNeuAc at m/z 803.30 (marked by the red dashed rectangle) confirmed the presence of the outer-arm fucose residue.
In the case of N-glycopeptides bearing the multiples of two fucoses, manual verification of the isotopic evidence of the precursor ion and the presence of diagnostic glycan fragments was employed to confirm the assignment. Supporting Information Figure S2 shows the MS/MS spectra of two low-abundance glycopeptides VVLHPN241YSQVDIGLIK bearing A4G4S4 (Figure S2A) vs A4G4F2S3 (Figure S2B), both of which were quadruply charged (z = 4), with the difference in the glycan moiety of one sialic acid vs two fucoses. Considering 2Fuc-1.02 = 1NeuAc, the glycopeptide assignment was confirmed with the monoisotopic peak of the precursor ions at m/z 1328.81 and 1329.08, respectively (see the inset figures). Thus, the specific diagnostic glycan fragments were evaluated. As shown in Figure S2A, a high-intensity peak of HexNAcHexNeuAc at m/z 657.23 confirmed the presence of hypersialylation in the glycopeptide, but no fucose residue was detected in the spectrum. However, in Figure S2B, the specific diagnostic fragment ions of HexHexNAcFuc at m/z 512.20 and FucHexNAcHexNeuAc at m/z 803.30 confirmed the presence of the outer-arm fucose residue. In the case of core-fucosylation, the diagnostic ion of peptide + 2HexNAcFuc, with the core-fucose residue attached to the peptide, can further confirm the core-fucosylation.38
We also evaluated the MS signal to noise ratio (S/N). As an example, we examined a low-abundance glycopeptide VVLHPN241YSQVDIGLIK_A4G4F2S3 (m/z = 1329.08) where the inset in Figure S2B shows the MS1 precursor ion with the isotope distribution. The intensity of the precursor ion was 2.72E6, which was over 60-fold higher than that of the noise. With the S/N ratio considerably greater than 3, these glycopeptides can be well quantified.
Site-Specific Glycosylation Heterogeneity in NASH-Related HCC vs Cirrhosis
All N-glycopeptides were automatically identified by Byonic (Protein Metrics) with high confidence. There were a total of 409 glycopeptide spectral matches identified, containing bi-, tri-, and tetra-antennary sialylated and/or fucosylated N-glycans. Multiple charge states were observed for most of the N-glycopeptides, where +3 and +4 ions are the most dominant. Compared to cirrhosis patients, an increased number of N-glycopeptide spectra were identified in HCCs, which were mainly multiply fucosylated and sialylated glycopeptides. The hyperfucosylated and hypersialylated N-glycopeptides, up to five fucoses and four sialic acids, were more frequently detected in HCCs than in cirrhosis patients. The result was consistent with our previous glycopeptide study on serum Hp in HCV-related HCC patients.38
The list of total glycoforms identified at sites N184 and N241 in HCC and cirrhosis patients, respectively, is provided in Supporting Information Table S2, and the list of glycoforms identified at the site N207 is provided in Supporting Information Table S3 (HexNAc = N-acetylhexosamine; Hex = Hexose; Fuc = Fucose; and NeuAc = sialic acid).
Since glycosites N184 and N241 are the most informative sites in Hp, we further investigated the glycosylation heterogeneity on these two sites. Figure 3A shows the number of total glycoforms identified at sites N184 and N241 in cirrhosis and HCC groups. At the site N184, there were 37 and 41 glycoforms identified in cirrhosis and HCC, respectively. The site N241 was more diverse in N-glycosylation of Hp, with 41 and 44 glycoforms identified in cirrhosis and HCC, respectively. There were four glycans at the site N184 (A1G1F1S1, A4G4F1S3, A4G4F2S3, and A4G4F4S1) and three glycans at the site N241 (A3G1S1, A4G3F1S2, A4G4F5S1) exclusively identified in HCC but absent in cirrhosis, most of which are tetra-antennary glycans with increased fucosylation or sialylation. Among these seven glycoforms, N184_A1G1F1S1 (p = 0.003) and N241_A4G4F5S1 (p = 0.014) were significantly elevated in HCCs compared to cirrhosis. However, most of these site-specific glycopeptides were not consistently present in all HCCs, with a p > 0.05.
Figure 3.
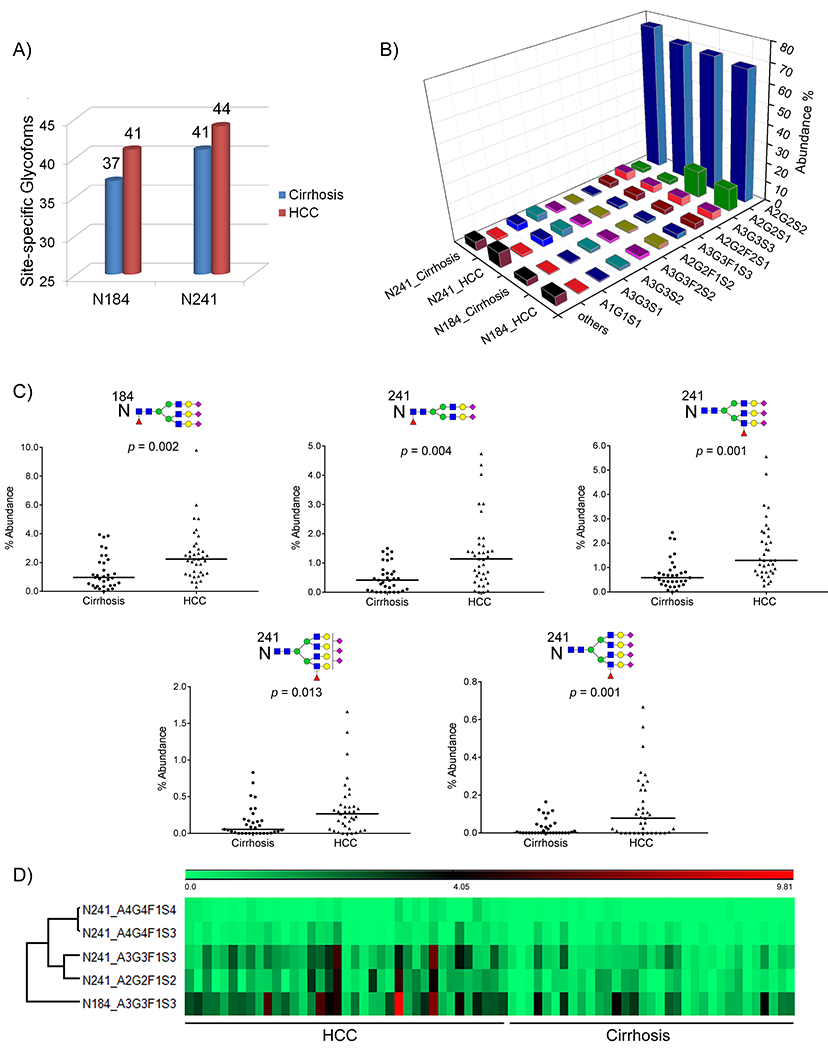
(A) Number of N-glycoforms identified at sites N184 and N241 in cirrhosis (blue) and HCC (red), respectively. (B) two-dimensional (2-D) bar chart showing the relative abundance of the 10 most frequently identified N-glycoforms at sites N184 and N241 in cirrhosis and HCC, respectively. For each site-specific glycoform, the mean value across patients in each group is used. (C) Scatter plots of the five differentially expressed site-specific N-glycopeptides between HCC and cirrhosis. Each spot represents an individual patient and the solid line indicates the median level in each disease group. (D) Heat map of the relative abundance of five differentially expressed N-glycopeptides in HCC vs cirrhosis.
Interestingly, NASH-related liver diseases expressed a slightly greater diversity in N-glycosylation at the sites N184 and N241 of serum Hp compared to those of HCV-related liver diseases, which were reported in our previous study.38 The extra glycoforms frequently identified in NASH-related liver patients but not detected in HCV-related patients included A1G1F1S1, A3G1S1, and A4G3F1S2 at sites N184 and A2G2, A5G5S1 at the site N241. The slight difference in N-glycosylation heterogeneity of serum Hp in NASH-related patients vs HCV-related patients may occur where NASH is caused by the buildup of fat in the liver while HCV is caused by hepatitis C virus infection.
Relative Quantitation of Site-Specific N-Glycopeptides in HCC and Cirrhosis
The automated quantitation software Byologic (Protein Metrics) was employed to quantitate the relative abundance of site-specific N-glycopeptides of serum Hp in each patient. In this study, we quantified the relative abundance of site-specific N-glycopeptides at sites N184 and N241. Since each sample was analyzed twice by EThcD-MS/MS, the average of the abundances of a site-specific N-glycopeptide among the two replicates was used to measure its level in individual patients.
The relative abundance of all N-glycopeptides identified at sites N184 and N241 in serum Hp of each patient is listed in Supporting Information Table S2, with the mean value, SD, the ratio between HCC and cirrhosis, and p-value also provided. Figure 3B shows the distribution of the 10 most abundant glycoforms at sites N184 and N241 in cirrhosis and HCC patients, respectively.
At the site N184, the most abundant glycoform is the biantennary disialylated glycan A2G2S2, followed by the biantennary monosialylated glycan A2G2S1, which account for 68.03 ± 6.97% and 11.77 ± 6.62% in HCC, 69.79 ± 5.01 and 14.06 ± 6.91% in cirrhosis, respectively. The remaining eight abundant glycoforms at the site N184 in HCC were those with bi- or triantennary structures, including A3G3S3 (3.92%), A2G2F2S1 (3.08%), A3G3F1S3 (2.55%), A2G2F1S2 (2.08%), A3G3F2S2 (1.55%), A3G3S2 (1.54%), A3G3S1 (0.52%), and A1G1S1 (0.41%). The tetra-antennary N-glycoforms with multiple sialic acids and/or multiple fucoses were observed on the site N184 in HCC patients, with a total abundance of 0.42%. However, the level of tetra-antennary glycoforms was significantly increased in HCC compared to that in cirrhosis (0.17%) (p = 0.010).
At the site N241, a slightly different distribution of the glycoforms was observed compared to those at the site N184. The site N241 has the most diverse N-glycosylation, due to the complexity of tetra-antennary and hyperfucosylation and sialylation. As shown in Figure 3B, though the biantennary disialylated N-glycan A2G2S2 was also the most abundant glycan, which contributed 71.03 ± 9.78% in HCC and 75.96 ± 7.43% in cirrhosis, respectively, the second most abundant groups were the triantennary nonfucosylated structures, including A3G3S1 (3.57%), A3G3S2 (3.45%), and A3G3S3 (3.55%). Notably, the overall level of tetra-antennary glycoforms at the site N241 was significantly higher in HCC (4.04 ± 3.49%) than that in cirrhosis (2.56 ± 1.64%) (p = 0.030).
In general, the biantennary N-glycoforms were the most abundant at both sites, followed by the triantennary with a 10-23% contribution and the tetra-antennary at low abundance accounting for 0.04–8%. However, the tetra-antennary N-glycoforms were significantly elevated in HCC compared to cirrhosis patients, showing the most complexity of hyperfucosylation and sialylation in HCC as reported previously.26,38
Differentially Overexpressed Hp N-Glycopeptides in HCC Compared to Cirrhosis
We further determined the differentially expressed N-glycopeptides in serum Hp between HCC and cirrhosis. The fold change was calculated as the ratio of the average abundance for the target N-glycopeptide at the glycosite level between HCC and cirrhosis samples. The cutoff for differential expression was set at a 2-fold change between HCC and cirrhosis with a p < 0.05. An additional criterion to choose the N-glycopeptides as potential marker candidates was that the glycopeptide should be detectable in the majority of patients, with a good signal/noise ratio for the mass spec-based quantitation study.
Ten site-specific N-glycopeptides were found to be significantly elevated in HCC compared to cirrhosis, including four glycopeptides at the site N184 (A2G2F1S2, A3G3F1S3, A3G3F2S3, and A4G4F1S2) and six glycopeptides at the site N241 (A2G2F1S2, A3G3F1S3, A3G3F2S3, A4G4F1S3, A4G4F1S4, and A4G4F2S4). The ratio and p-value of the 10 significantly overexpressed N-glycopeptides between HCC and cirrhosis are provided in Table 2A, which are mainly multisialylated tri- or tetra-antennary N-glycans with one or two fucose moieties. The ratio and p-value of these N-glycopeptides between early HCC and cirrhosis are also included in Table 2A.
Table 2.
Diagnostic Comparison of Individual Glycopeptide Markers With or Without AFP for All HCCs and early HCCs, Respectively
| A. Diagnostic performance of individual markers for all HCCs and early HCCs, respectively | ||||||||
|---|---|---|---|---|---|---|---|---|
| all HCC (N = 37) vs cirrhosis (N = 33) |
early HCC (N = 22) vs cirrhosis (N = 33) |
|||||||
| marker | mean diff. | p-value | AUC | 95% CI | mean diff. | p-value | AUC | 95% CI |
| AFP | 1255.3 | 0.0001 | 0.787 | (0.681, 0.893) | 4.96 | 0.019 | 0.692 | (0.548, 0.837) |
| Site N184 | ||||||||
| N184_A2G2F1S2 | 1.95 | 0.005 | 0.723 | (0.602, 0.843) | 1.63 | 0.011 | 0.714 | (0.573, 0.854) |
| N184_A3G3F1S3 | 1.92 | 0.002 | 0.760 | (0.642, 0.879) | 1.71 | 0.008 | 0.733 | (0.595, 0.871) |
| N184_A3G3F2S3 | 6.50 | 0.005 | 0.672 | (0.544, 0.800) | 3.79 | 0.006 | 0.650 | (0.493, 0.807) |
| N184_A4G4F1S2 | 9.64 | 0.001 | 0.683 | (0.556, 0.809) | 5.93 | 0.027 | 0.621 | (0.462, 0.780) |
| Site N241 | ||||||||
| N241_A2G2F1S2 | 2.67 | 0.0004 | 0.753 | (0.638, 0.868) | 2.37 | 0.004 | 0.682 | (0.529, 0.834) |
| N241_A3G3F1S3 | 2.32 | 0.0001 | 0.800 | (0.691, 0.907) | 2.12 | 0.001 | 0.775 | (0.646, 0.904) |
| N241_A3G3F2S3 | 9.27 | 0.017 | 0.712 | (0.588, 0.835) | 7.96 | 0.029 | 0.668 | (0.514, 0.822) |
| N241_A4G4F1S3 | 2.25 | 0.013 | 0.703 | (0.575, 0.830) | 2.15 | 0.028 | 0.688 | (0.542, 0.833) |
| N241_A4G4F1S4 | 4.48 | 0.001 | 0.698 | (0.574, 0.823) | 2.91 | 0.009 | 0.648 | (0.492, 0.805) |
| N241_A4G4F2S4 | 4.05 | 0.044 | 0.649 | (0.517, 0.781) | 2.36 | 0.078 | 0.618 | (0.460, 0.777) |
| B. Diagnostic performance of glycopeptide markers in combination with AFP for all HCCs and early HCCs, respectively | ||||||||
| all HCC (N = 37) vs cirrhosis (N = 33) |
early HCC (N = 22) vs cirrhosis (N =33) |
|||||||
| combination | AUC | 95% CI | AUC | 95% CI | ||||
| Site N184 | ||||||||
| N184_A2G2F1S2 + AFP | 0.859 | (0.771, 0.947) | 0.780 | (0.673, 0.924) | ||||
| N184_A3G3F1S3 + AFP | 0.842 | (0.749, 0.936) | 0.767 | (0.635, 0.898) | ||||
| N184_A3G3F2S3 + AFP | 0.852 | (0.763, 0.942) | 0.770 | (0.639, 0.900) | ||||
| N184_A4G4F1S2 + AFP | 0.841 | (0.746, 0.935) | 0.732 | (0.591, 0.872) | ||||
| Site N241 | ||||||||
| N241_A2G2F1S2 + AFP | 0.821 | (0.721, 0.921) | 0.734 | (0.590, 0.878) | ||||
| N241_A3G3F1S3 + AFP | 0.841 | (0.748, 0.933) | 0.783 | (0.656, 0.910) | ||||
| N241_A3G3F2S3 + AFP | 0.814 | (0.713, 0.914) | 0.736 | (0.597, 0.876) | ||||
| N241_A4G4F1S3 + AFP | 0.804 | (0.700, 0.908) | 0.711 | (0.566, 0.856) | ||||
| N241_A4G4F1S4 + AFP | 0.849 | (0.757, 0.941) | 0.746 | (0.607, 0.885) | ||||
| N241_A4G4F2S4 + AFP | 0.806 | (0.704, 0.908) | 0.711 | (0.570, 0.853) | ||||
| C. Diagnostic accuracy of glycopeptide markers and marker panels in all HCCs and early HCCs, respectively | ||||||||
| all HCC (N = 37) vs cirrhosis (N = 33) |
early HCC (N = 22) vs cirrhosis (N = 33) |
|||||||
| model | AUC | cutoffa | sensa | speca | AUC | cutoffa | sensa | sensa |
| AFP | 0.787 | 4.35 | 0.73 | 0.70 | 0.692 | 4.35 | 0.59 | 0.70 |
| N184_A3G3F1S3 | 0.760 | 1.15 | 0.81 | 0.67 | 0.733 | 1.28 | 0.77 | 0.70 |
| N241_A3G3F1S3 | 0.800 | 0.78 | 0.81 | 0.73 | 0.775 | 0.78 | 0.82 | 0.73 |
| panel (N184_A3G3F1S3 + AFP) | 0.842 | 2.25 | 0.70 | 0.83 | 0.767 | 1.66 | 0.73 | 0.70 |
| panel (N241_A3G3F1S3 + AFP) | 0.841 | 2.75 | 0.70 | 0.87 | 0.783 | 2.33 | 0.73 | 0.70 |
The cutoff and its corresponding sensitivity (sens) and specificity (spec) are determined by the point with the shortest distance to the point when sensitivity =1 and specificity = 1.
At the site N184, the glycopeptides of N184_A2G2F1S2 and N184_A3G3F1S3, with a 1.95- and 1.92-fold increase, respectively, in HCC vs cirrhosis patients (p = 0.005 and 0.002, respectively), were also considered as candidate N-glycopeptides of interest. The glycopeptide of N184_A3G3F2S3 with a bifucosylated triantennary glycan was significantly increased in HCC compared to cirrhosis, showing a fold change of 6.5 (p = 0.005). The elevation of N184_A3G3F2S3 expression was also detected in HCV-related HCC compared to the corresponding cirrhosis in our previous study.38 In the current study, the glycopeptide of N184_A4G4F1S2 was found with an average 9.64-fold increase in NASH HCC vs cirrhosis (p = 0.001), mainly because this glycopeptide was absent in 28 (85%) of 33 cirrhosis samples.
At the site N241, the glycopeptides of N241_A2G2F1S2, N241_A3G3F1S3, and N241_A3G3F2S3 were significantly increased, with a 2.67-, 2.32-, and 9.27-fold change, respectively, in HCC vs cirrhosis patients (p = 0.0004, 0.0001, and 0.017, respectively). The glycopeptide N241_A3G3F2S3 with the bifucosylated triantennary glycan was significantly increased in HCC but absent in 70% of cirrhosis patients. The significant overexpression of N241_A3G3F2S3 was also reported in HCV-related HCCs vs HCV-related cirrhosis patients, with a 4.16-fold increase.38 The glycopeptides with tetra-antennary glycans, such as A4G4F1S3, A4G4F1S4, and A4G4F2S4, were found to have a 2.25-, 4.48-, and 4.05-fold increase in HCC vs cirrhosis with a p < 05. The glycopeptide of N241_A4G4F2S4 with a bifucosylated tetra-antennary glycan was statistically significantly increased in HCCs but absent in 25 (76%) of 33 cirrhosis patients (p = 0.044). The scatter plot of the abundance of N241_A4G4F2S4 in HCC and cirrhosis patients is shown in Supporting Information Figure S3A. The elevated bifucosylated glycoforms of Hp in HCCs were consistent with our glycomics studies.25,47 The increased tetra-antennary glycoforms with hyperfucosylation (up to five fucoses) on the site N241 were observed in a portion of HCC patients of this sample set but did not significantly distinguish HCC from cirrhosis.
We further performed correlation analysis for the differentially expressed N-glycopeptides at sites N184 and N241 to generate clusters exhibiting related expression patterns. The correlation plot is shown in Supporting Information Figure S4. N-glycopeptide N241_A4G4F1S3 was highly correlated with N-glycopeptides N241_A3G3F1S3 and N184_A3G3F1S3, with the correlation coefficient (R) of 0.71 and 0.70, respectively. N-glycopeptide N241_A3G3F1S3 was correlated with N-glycopeptides N184_A3G3F1S3 (R = 0.67) and N241_A3G3F2S3 (R = 0.66). The result indicated that the expression patterns of N-glycopeptides N184_A3G3F1S3, N241_A3G3F1S3, and N241_A4G4F1S3, all attached with three sialic acids and one fucose, are highly correlated.
Five N-Glycopeptide Marker Candidates for NASH HCC
The scatter plots offive differentially expressed N-glycopeptides, i. e., N184_A3G3F1S3, N241_A2G2F1S2, N241_A3G3F1S3, N241_A4G4F1S3, and N241_A4G4F1S4, were applied to display the distribution of their abundance in HCC and cirrhosis (Figure 3C). A heat map of the abundance of these five N-glycopeptides in HCC vs cirrhosis is shown in Figure 3D. As shown in Figure 3C, each spot represents an individual patient and the solid line indicates the median level in each disease group. The result indicated that the site-specific fucosylation with full-sialylation is critical for determination of HCC from cirrhosis, where the N-glycopeptides at sites N184 and N241 with fucosylated tri- or tetra-antennary glycans were significantly associated with HCC (p ≤ 0.013). Further statistical analysis among the three disease groups, i.e., cirrhosis, early HCCs, and late HCCs, showed that the five N-glycopeptides were significantly elevated during the progression from NASH cirrhosis to late HCCs (p < 0.004).
Diagnostic Performance of Site-Specific N-Glycopeptides in HCC and Early HCC
We further performed the receiver operating characteristic (ROC) curve analysis for Hp site-specific N-glycopeptides in differentiating HCCs and early HCCs from cirrhosis patients, respectively. The ROC AUC values of Hp site-specific N-glycopeptides and AFP are summarized in Table 2A.
Among all HCCs, the N-glycopeptide at the site N184 bearing a monofucosylated biantennary glycan A2G2F1S2 had an AUC of 0.723 (95% CI: 0.602, 0.843), and the one bearing a monofucosylated triantennary glycan A3G3F1S3 had an AUC of 0.760 (95% CI: 0.642, 0.879) in distinguishing NASH HCCs from cirrhosis. The ROC curves of these two N-glycopeptides in distinguishing HCCs from cirrhosis are shown in Figure 4A. As shown in Table 2A, these two N-glycopeptides had a better diagnostic performance than the other two at the site N184 (AUC = 0.672 and 0.683, respectively). The N-glycopeptide at the site N241 bearing the monofucosylated biantennary glycan A2G2F1S2 yielded an AUC of 0.753 (95% CI: 0.638, 0.868), and the one bearing the monofucosylated triantennary glycan A3G3F1S3 achieved an AUC of 0.800 (95% CI: 0.691, 0.907) in distinguishing NASH HCCs from cirrhosis. The other N-glycopeptides at the site N241 containing the glycan A3G3F2S3, A4G4F1S3, A4G4F1S4, or A4G4F2S4 had an AUC of 0.712, 0.703, 0.698, and 0.649, respectively. The ROC curves of the N-glycopeptides of N241_A3G3F1S3 and N241_A4G4F1S4 in distinguishing NASH HCCs from cirrhosis are shown in Figure 4A The ROC curve of the N-glycopeptide N241_A4G4F2S4 in distinguishing HCCs from cirrhosis is shown in Supporting Information Figure S3B. N241_A4G4F2S4 yielded an AUC of 0.649 to distinguish HCCs from cirrhosis, which was lower compared to other marker candidates. Interestingly, the glycopeptides with the monofucosylated triantennary glycan (A3G3F1S3) had the best performance at each glycosite in the detection of HCCs.
Figure 4.
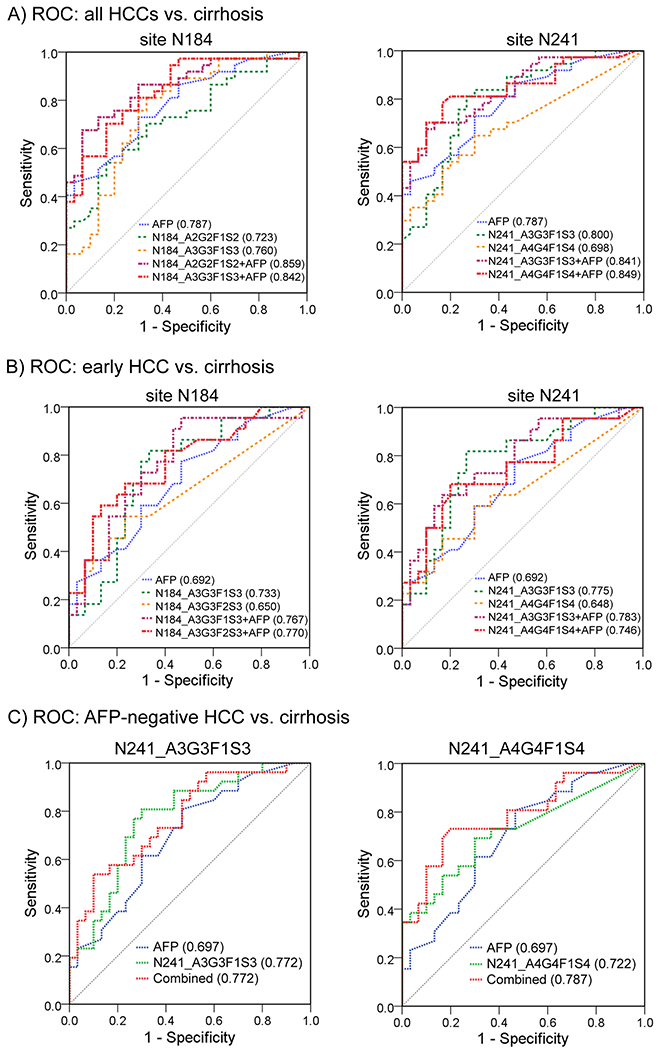
Receiver operating characteristic (ROC) curves of Hp N-glycopeptide markers at sites N184 and N241 in combination with AFP to differentiate all HCCs (A), early HCCs (B), and AFP-negative HCCs (C) from cirrhosis patients (blue line, AFP; green and orange lines, Hp N-glycopeptides; red and purple lines, the combination of Hp N-glycopeptide and AFP).
In the case of early HCCs, the ROC curve of AFP resulted in an AUC of 0.692 (95% CI: 0.548, 0.837) in distinguishing early HCCs from cirrhosis patients. The site-specific N-glycopeptides that outperformed AFP for early HCCs were N184_A2G2F1S2, N184_A3G3F1S3, and N241_A3G3F1S3, with the AUC values of 0.714, 0.733, and 0.775, respectively (Table 2A). Notably, the N-glycopeptide of N241_A3G3F1S3 showed the best performance in early detection of HCCs, with an increase of 12% in the AUC value compared to AFP (AUC 0.775 vs 0.692). Differences in N-glycopeptides of N241_A2G2F1S2 and N241_A4G4F1S3 had comparable performance compared to AFP in distinguishing early HCCs from cirrhosis, with an AUC value of 0.682 and 0.688, respectively (Table 2A). The ROC curves of the selected N-glycopeptides are displayed for sites N184 and N241 (Figure 4B) in distinguishing early HCC from cirrhosis.
These data suggest that the N-glycopeptides with the monofucosylated triantennary glycan (A3G3F1S3) at sites N184 and N241 may serve as promising biomarkers for early HCC detection in patients with NASH cirrhosis.
Combinatorial Analysis of Hp N-Glycopeptide Markers with AFP
The ROC AUC values of Hp site-specific N-glycopeptides in combination with AFP are listed in Table 2B. Comparisons in AUCs between AFP and the combination of N-glycopeptides with AFP were performed. At the site N184, when combining N-glycopeptides with AFP, the AUC among all HCCs was improved to 0.859 for N184_A2G2F1S2 + AFP (p = 0.076), 0.842 for N184_A3G3F1S3 + AFP (p = 0.150), 0.852 for N184_A3G3F2S3 + AFP (p = 0.053), and 0.841 for N184_A4G4F1S2 + AFP (p = 0.066), compared to AFP alone (AUC = 0.787, 95% CI: 0.681, 0.893). The combination of glycopeptides with AFP yielded a better performance in AUC, but the improvement was not significant. We found that the panel of N184_A3G3F1S3 + AFP yielded a significant improvement in AUC compared to the marker N184_A3G3F1S3 itself in distinguishing all HCCs from cirrhosis (p = 0.034). For distinguishing early-stage HCCs from cirrhosis, the combination of N-glycopeptides with AFP resulted in an AUC of 0.780, 0.767, 0.770, and 0.732, respectively, while AFP alone had an AUC of 0.692.
At the site N241, when combining N-glycopeptides with AFP, the combinatorial ROC analysis yielded an AUC of 0.821 for N241_A2G2F1S2 + AFP (p = 0.357), 0.841 for N241_A3G3F1S3 + AFP (p = 0.182), 0.814 for N241_A3G3F2S3 + AFP (p = 0.171), and 0.849 for N241_A4G4F1S4 + AFP (p = 0.088) in differentiating HCCs from cirrhosis, where they all performed better than AFP alone (AUC = 0.787). Among early HCCs, the panel of N241_A3G3F1S3 with AFP improved the AUC with an increase of 13% in early detection of NASH-related HCCs compared to AFP alone (AUC 0.783 vs 0.692, p = 0.126). The panels of N241_A3G3F2S3 with AFP and N241_A4G4F1S4 with AFP resulted in an AUC of 0.736 and 0.746, respectively.
The ROC curves of the selected N-glycopeptides and AFP marker panels are shown in Figure 4A At the site N184, the two panels of N184_A2G2F1S2 + AFP and N184_A3G3F1S3 + AFP indicated a better performance in distinguishing all HCCs from cirrhosis than AFP alone (Figure 4A), while the panels of N184_A3G3F1S3 + AFP and N184_A3G3F2S3 + AFP demonstrated a better performance in distinguishing early HCCs from cirrhosis (Figure 4B). At the site N241, the two panels of N241_A3G3F1S3 + AFP and N241_A4G4F1S4 + AFP were selected to show the increased AUC values in distinguishing all HCCs (Figure 4A) and early HCCs (Figure 4B) from cirrhosis, respectively.
We have considered age and gender in the panel development. However, adding age, gender, or both did not yield a statistically significantly improved AUC compared to the panels N184_A3G3F1S3 + AFP (p = 0.417, 0.140, and 0.118, respectively) or N241_A3G3F1S3 + AFP (p = 0.231, 0.222, and 0.222, respectively).
Diagnostic Accuracy of Hp N-Glycopeptide Markers in HCCs and Early HCCs
We further evaluated the diagnostic accuracy of the N-glycopeptide marker candidates for detecting HCCs and early-stage HCCs. According to ROC curve analysis, the optimal cutoff value, sensitivity, and specificity of AFP, N-glycopeptide marker, and marker panels are summarized in Table 2C. We chose the cutoff value whose corresponding sensitivity and specificity were determined by the point with the shortest distance to the point when sensitivity = 1 and specificity = 1.
Among all HCCs, AFP had an AUC of 0.787 to distinguish HCCs from cirrhosis, with a sensitivity of 73% and a specificity of 70% for this sample set. The glycopeptides N184_A3G3F1S3 and N241_A3G3F1S3 had an AUC of 0.760 and 0.800, respectively, both of which had a greater sensitivity of 81% compared to AFP. Notably, the glycopeptide N241_A3G3F1S3 (AUC = 0.800) outperformed AFP to distinguish all HCCs, resulting in 81% sensitivity and 73% specificity at the optimal cutoff. When combined with AFP, these two glycopeptide markers yielded an improved AUC of 0.842 and 0.841, respectively, compared to AFP alone (AUC = 0.787). Based on the optimal cutoff, the two marker panels resulted in a sensitivity of 70% but a high specificity for diagnosing HCC, 83 and 87%, respectively.
Among early HCCs, AFP had an AUC of 0.692, with a specificity of 70% but a low sensitivity of 59%. The glycopeptide N184_A3G3F1S3 had an AUC of 0.733, with the optimal cutoff resulting in 77% sensitivity and 70% specificity. Notably, the glycopeptide N241_A3G3F1S3 (AUC = 0.775) outperformed AFP, resulting in 82% sensitivity and 73% specificity at the optimal cutoff. Both glycopeptide markers achieved a distinctly higher sensitivity than AFP for early HCCs. The panel of AFP with N184_A3G3F1S3 resulted in an AUC of 0.767 (95% CI: 0.635, 0.898) and the panel of AFP with N241_A3G3F1S3 yielded an AUC of 0.783 (95% CI: 0.656, 0.910). Based on the optimal cutoff, the two panels improved the sensitivity to 73% compared to AFP alone (59% sensitivity) while maintaining a specificity of 70%.
The result showed that the two N-glycopeptide markers and the marker panels had a greater benefit in early detection of NASH-related HCCs than AFP. This is a preliminary finding over a limited sample size, and a larger cohort of NASH patients will be needed to confirm our findings.
Performance of Hp N-Glycopeptide Markers in AFP-Negative Patients
We also evaluated the diagnostic performance of selected N-glycopeptides in patients with AFP < 20 ng/mL, which are recorded as AFP negative in the clinic. In this sample set, 70% (26 of 37) HCC patients and 100% (33 of 33) cirrhosis patients were AFP negative.
The ROC curves of AFP and the N-glycopeptides N241_A3G3F1S3 and N241_A4G4F1S4 in distinguishing HCC from cirrhosis in patients with AFP < 20 ng/mL are shown in Figure 4C. Among AFP-negative patients, AFP had an AUC of 0.697, while the N-glycopeptides N241_A3G3F1S3 and N241_A4G4F1S4 yielded an AUC of 0.772 and 0.722, respectively. At a 5.85 ng/mL cutoff, AFP showed a sensitivity of 38% and a specificity of 80%. When combined with AFP, the glycopeptide N241_A3G3F1S3 yielded an AUC of 0.772, with 58% sensitivity and a corresponding 80% specificity. Notably, the combination of the glycopeptide N241_A4G4F1S4 and AFP achieved an AUC of 0.787, with sensitivity and specificity of 73 and 80%, respectively. The result demonstrated that the panel of the glycopeptide N241_A4G4F1S4 and AFP can significantly improve the sensitivity for AFP-negative HCC patients from 38% (AFP alone) to 73% while maintaining a specificity of 80%.
We further performed 2-D plots of the N-glycopeptide marker candidates and AFP value among AFP-negative patients and found that five N-glycopeptides, including N241_A2G2F1S2, N241_A3G3F1S3, N241_A4G4F1S4, N184_A3G3F1S3, and N184_A4G4F1S2, can detect 15 (58%) of 26 AFP-negative patients (Figure 5B). Figure 5A shows the 2-D scatter plot of AFP values with the three N-glycopeptides at the site N241 bearing glycans A2G2F1S2, A3G3F1S3, and A4G4F1S4 for cirrhosis (blue circle) and HCC (red triangle) patients with AFP negative. The scatter plots of the two glycopeptides at the site 184 are shown in Supporting Information Figure S5. HCC patients with negative AFP but an elevated level of Hp N-glycopeptide are marked with arrows. As shown in Figure 5A, the cirrhosis samples were clustered in the lower left panel of the plot, indicating low levels of both the glycopeptide and AFP value. Taking N241_A4G4F1S4 as an example, on the upper panel of the plot, 8 AFP-negative HCC patients were found with distinctly increased N241_A4G4F1S4 level (marked with arrows). The result indicated that these glycopeptides could serve as promising markers for monitoring AFP-negative HCC patients.
Figure 5.
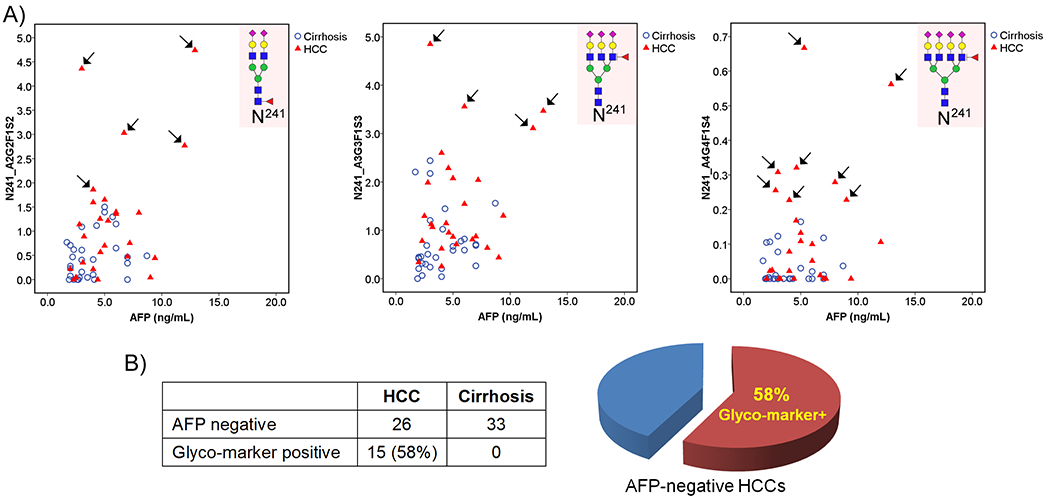
(A) 2-D scatter plots of the AFP value against Hp N-glycopeptides N241_A2G2F1S2, N241_A3G3F1S3, and N241_A4G4F1S4 in cirrhosis (blue) and HCC (red) patients with AFP < 20 ng/mL. HCC patients with negative AFP but an elevated level of Hp N-glycopeptide are marked with arrows. (B) Venn diagram showing that N-glycopeptide markers detected 15 (58%) of 26 AFP-negative HCC patients as distinct from cirrhosis.
■ CONCLUSIONS
In this study, we demonstrated a novel noninvasive NASH biomarker analysis based on site-specific N-glycopeptides in serum Hp with unique glycosylation structural changes between NASH-related HCC and cirrhosis for early detection of HCC in patients with NASH. This assay incorporated the EThcD-MS/MS fragmentation strategy and a novel data quantitation platform, Byos, into characterization of the alterations in site-specific glycoforms of serum Hp in a large cohort of patients. This current work follows Pompach et al.43 on site-specific glycopeptide studies of serum Hp where we are now focusing on NASH patients and have used the recently introduced EThcD fragmentation strategy, instead of collision-induced dissociation (CID), and automated data quantitation software, which show advantages in providing structural information for intact N-glycopeptides as well as for quantitation of alterations in site-specific intact N-glycopeptides. Moreover, we performed 2-D scatter plots of the N-glycopeptide candidates and AFP value among AFP-negative patients (AFP < 20 ng/mL), which resulted in detection of 15 (58%) of 26 AFP-negative patients as distinct from cirrhosis.
The EThcD-MS/MS-based assay showed a great advantage in detecting minor but significant glycan structure changes at individual glycosylation sites for the discovery of novel biomarkers for NASH-related HCC. The overall fucosylation level of serum Hp (Fuc-Hpt) in NASH patients had been evaluated by a lectin-antibody enzyme-linked immunosorbent assay (ELISA) kit, showing the potential in distinguishing NASH from non-NASH patients.48,49 However, the detailed structural analysis in glycans of serum Hp cannot be achieved using the lectin-antibody ELISA assay. The most significant advantage of our EThcD-MS/MS-based assay is the ability to obtain detailed structural analysis of glycans simultaneously for individual glycosites in serum Hp together with differential quantitative analysis between disease states, which could have a direct impact on biomarker research.
The relative quantitative analysis of 140 MS/MS data sets derived from NASH patients revealed that five N-glycopeptides significantly elevated during the progression from NASH cirrhosis to late HCCs (p < 0.05). The quantitation results further confirmed that the bifucosylated tri- and tetra-antennary glycoforms in serum Hp were significantly increased in NASH-related HCC compared to cirrhosis (p < 0.02). Evaluation of the diagnostic performance showed that the N-glycopeptides at sites of N184 and N241 bearing a monofucosylated triantennary glycan A3G3F1S3 had the best diagnostic performance in distinguishing early NASH-related HCC from cirrhosis. When combined with AFP, the two panels improved the sensitivity of 59% in AFP alone to 73%, at the optimal cutoff, for early detection of NASH-related HCC. Moreover, the N-glycopeptide at the site N241 containing a monofucosylated tetra-antennary glycan A4G4F1S4 can significantly improve the sensitivity for AFP-negative HCC patients from 38 to 73% with a specificity of 80%, suggesting that it could serve as a promising marker for monitoring AFP-negative HCC patients.
We achieved similar results in the diagnostic performance of haptoglobin glycosylation changes in distinguishing HCC from cirrhosis in both a current glycopeptide study38 and previous glycomics studies.25,37 However, for the glycomics study of a target serum glycoprotein, one must purify the target protein from serum with a high-purity requirement. In the case of the glycopeptides, due to the unique peptide backbone of the target protein, one can track site-specific glycoforms without protein purification or with partial purification from serum. This glycopeptide study provides a means in principle to develop an assay to directly analyze the changes in glycoforms at individual glycosites of glycoproteins in serum. This noninvasive biomarker assay contributes a potentially useful tool for discovering new glycomarkers for early detection of NASH-related HCC.
The limitation of this assay is label-free quantitation, while complimentary approaches utilizing isobaric mass tags50 or metabolic 15N/13C labeling strategy51 can improve the precision of relative quantitation of N-glycopeptides. Absolute quantitation using multiple reaction monitoring (MRM)52,53 is a future direction, although it is challenging due to the complexity of glycopeptides composed by glycan and peptide motifs. Future studies on a larger cohort of NASH patients will be needed to validate our findings, where an MRM-based assay can be employed for absolute quantitation of the N-glycopeptide marker candidates in NASH patients. To achieve a sensitivity of 80% or greater for early detection of NASH-related HCC, an optimal multimarker panel combining Hp N-glycopeptide markers and AFP needs to be identified for potential clinical utility.
Supplementary Material
Representative extracted ion chromatograms (XICs) of MS/MS spectra of the HexNAc+ ion within the m/z range 204.085–204.089 (Figure S1); representative MS/MS spectra of N-glycopeptides of VVLHPN241YSQVDIGLIK with the glycan A4G4S4 (A) and A4G4F2S3 (B) to elucidate the difference in the MS2 spectrum caused by the change in the glycan moiety between one sialic acid and two fucoses (Figure S2); (A) scatter plot of the relative abundance of the N-glycopeptide N241_A4G4F2S4 in HCC and cirrhosis; (B) ROC curves of the N-glycopeptide N241_A4G4F2S4 in combination with AFP to differentiate HCCs from cirrhosis patients (Figure S3); correlation plot of the differentially expressed N-glycopeptides at sites N184 and N241 (Figure S4); 2-D scatter plots of the AFP value against Hp N-glycopeptides N184_A3G3F1S3 and N184_A4G4F1S2, respectively, in cirrhosis (blue) and HCC (red) patients with AFP < 20 ng/mL (Figure S5); N-glycan database containing 53 human N-glycans used in this study (Table S1); list of the relative abundance of site-specific N-glycopeptides identified at sites N184 and N241 of serum Hp in individual HCC and cirrhosis patients, respectively; mean value in each group, SD, and p-value are also provided (Table S2); list of the relative abundance of N-glycopeptides identified at the site N207 of serum Hp in individual HCC and cirrhosis patients (Table S3) (PDF)
Glycopeptides at sites N184 and N241 (XLSX)
Glycopeptides at site N207 (XLSX)
ACKNOWLEDGMENTS
We acknowledge the support of this work from the National Cancer Institute under grants 1R01 CA160254 (D.M.L.), U01 CA225753 (D.M.L.), and R50 CA221808 (J.Z.) and from the National Institutes of Health through grant R01 GM49500 (D.M.L.). The Orbitrap instrument was purchased under an NIH shared instrumentation grant S10OD021619. L.L. acknowledges funding support from the National Institutes of Health through grants RF1AG052324 (L.L.), U01 CA231081 (L.L.), and R01 DK071801 (L.L.). A.G.S. acknowledges the support from the National Cancer Institute under grant U01 CA230694. D.M.L. acknowledges support under the Maud T. Lane Professorship.
Footnotes
Supporting Information
The Supporting Information is available free of charge at https://pubs.acs.org/doi/10.1021/acs.jproteome.0c00270.
Complete contact information is available at: https://pubs.acs.org/10.1021/acs.jproteome.0c00270
The authors declare the following competing financial interest(s): Dr. Singal serves as a consultant to Glycotest and has served on advisory boards for Exact Sciences and Wako Diagnostics.
Contributor Information
Jianhui Zhu, Department of Surgery, University of Michigan Medical Center, Ann Arbor, Michigan 48109, United States.
Junfeng Huang, Department of Chemistry, University of Wisconsin–Madison, Madison, Wisconsin 53706, United States.
Jie Zhang, Department of Surgery, University of Michigan Medical Center, Ann Arbor, Michigan 48109, United States.
Zhengwei Chen, Department of Chemistry, University of Wisconsin–Madison, Madison, Wisconsin 53706, United States.
Yu Lin, Department of Surgery, University of Michigan Medical Center, Ann Arbor, Michigan 48109, United States.
Gabriela Grigorean, Department of Chemistry, University of Michigan, Ann Arbor, Michigan 48109, United States.
Lingjun Li, Department of Chemistry and School of Pharmacy, University of Wisconsin–Madison, Madison, Wisconsin 53706, United States.
Suyu Liu, Department of Biostatistics, University of Texas MD Anderson Cancer Center, Houston, Texas 77030, United States.
Amit G. Singal, Department of Internal Medicine, University of Texas Southwestern Medical Center, Dallas, Texas 75390, United States
Neehar D. Parikh, Department of Internal Medicine, University of Michigan, Ann Arbor, Michigan 48109, United States
David M. Lubman, Department of Surgery, University of Michigan Medical Center, Ann Arbor, Michigan 48109, United States.
REFERENCES
- (1).Basaranoglu M; Neuschwander-Tetri BA Nonalcoholic Fatty Liver Disease: Clinical Features and Pathogenesis. Gastroenterol. Hepatol 2006, 2, 282–291. [PMC free article] [PubMed] [Google Scholar]
- (2).Kulik L; El-Serag HB Epidemiology and Management of Hepatocellular Carcinoma. Gastroenterology 2019, 156, 477–491.e1. [DOI] [PMC free article] [PubMed] [Google Scholar]
- (3).Zhang DY; Friedman SL Fibrosis-dependent mechanisms of hepatocarcinogenesis. Hepatology 2012, 56, 769–775. [DOI] [PMC free article] [PubMed] [Google Scholar]
- (4).Sanduzzi-Zamparelli M; Diaz-Gonzalez A; Reig M New Systemic Treatments in Advanced Hepatocellular Carcinoma. Liver Transpl. 2019, 25, 311–322. [DOI] [PubMed] [Google Scholar]
- (5).Ascha MS; Hanouneh IA; Lopez R; Tamimi TA; Feldstein AF; Zein NN The incidence and risk factors of hepatocellular carcinoma in patients with nonalcoholic steatohepatitis. Hepatology 2010, 51, 1972–1978. [DOI] [PubMed] [Google Scholar]
- (6).El-Serag HB Hepatocellular carcinoma. N. Engl. J. Med 2011, 365, 1118–1127. [DOI] [PubMed] [Google Scholar]
- (7).Heimbach JK; Kulik LM; Finn RS; Sirlin CB; Abecassis MM; Roberts LR; Zhu AX; Murad MH; Marrero JA AASLD guidelines for the treatment of hepatocellular carcinoma. Hepatology 2018, 67, 358–380. [DOI] [PubMed] [Google Scholar]
- (8).Marrero JA; Kulik LM; Sirlin CB; Zhu AX; Finn RS; Abecassis MM; Roberts LR; Heimbach JK Diagnosis, Staging, and Management of Hepatocellular Carcinoma: 2018 Practice Guidance by the American Association for the Study of Liver Diseases. Hepatology 2018, 68, 723–750. [DOI] [PubMed] [Google Scholar]
- (9).Simmons O; Fetzer DT; Yokoo T; Marrero JA; Yopp A; Kono Y; Parikh ND; Browning T; Singal AG Predictors of adequate ultrasound quality for hepatocellular carcinoma surveillance in patients with cirrhosis. Aliment. Pharmacol. Ther 2017, 45, 169–177. [DOI] [PMC free article] [PubMed] [Google Scholar]
- (10).Marrero JA; Henley KS The role of serum biomarkers in hepatocellular carcinoma surveillance. Gastroenterol. Hepatol 2011, 7, 821–823. [PMC free article] [PubMed] [Google Scholar]
- (11).Singal AG; Conjeevaram HS; Volk ML; Fu S; Fontana RJ; Askari F; Su GL; Lok AS; Marrero JA Effectiveness of hepatocellular carcinoma surveillance in patients with cirrhosis. Cancer Epidemiol., Biomarkers Prev 2012, 21, 793–799. [DOI] [PMC free article] [PubMed] [Google Scholar]
- (12).Tzartzeva K; Obi J; Rich NE; Parikh ND; Marrero JA; Yopp A; Waljee AK; Singal AG Surveillance Imaging and Alpha Fetoprotein for Early Detection of Hepatocellular Carcinoma in Patients With Cirrhosis: A Meta-analysis. Gastroenterology 2018, 154, 1706–1718.e1. [DOI] [PMC free article] [PubMed] [Google Scholar]
- (13).Tian Y; Zhang H Glycoproteomics and clinical applications. Proteomics: Clin. Appl 2010, 4, 124–132. [DOI] [PubMed] [Google Scholar]
- (14).Mehta A; Herrera H; Block T Glycosylation and liver cancer. Adv. Cancer Res 2015, 126, 257–279. [DOI] [PMC free article] [PubMed] [Google Scholar]
- (15).Wang M; Long RE; Comunale MA; Junaidi O; Marrero J; Di Bisceglie AM; Block TM; Mehta AS Novel fucosylated biomarkers for the early detection of hepatocellular carcinoma. Cancer Epidemiol., Biomarkers Prev 2009, 18, 1914–1921. [DOI] [PMC free article] [PubMed] [Google Scholar]
- (16).Comunale MA; Wang M; Hafner J; Krakover J; Rodemich L ; Kopenhaver B; Long RE; Junaidi O; Bisceglie AM; Block TM ; Mehta AS Identification and development of fucosylated glycoproteins as biomarkers of primary hepatocellular carcinoma. J. Proteome Res 2009, 8, 595–602. [DOI] [PMC free article] [PubMed] [Google Scholar]
- (17).Kim KH; Lee SY; Hwang H; Lee JY; Ji ES; An HJ; Kim JY; Yoo JS Direct Monitoring of Fucosylated Glycopeptides of Alpha-Fetoprotein in Human Serum for Early Hepatocellular Carcinoma by Liquid Chromatography-Tandem Mass Spectrometry with Immunoprecipitation. Proteomics: Clin. Appl 2018, 12, No. e1800062. [DOI] [PubMed] [Google Scholar]
- (18).Qin H; Dong X; Mao J; Chen Y; Dong M; Wang L; Guo Z; Liang X; Ye M Highly Efficient Analysis of Glycoprotein Sialylation in Human Serum by Simultaneous Quantification of Glycosites and Site-Specific Glycoforms. J. Proteome Res 2019, 18, 3439–3446. [DOI] [PubMed] [Google Scholar]
- (19).Ang IL; Poon TC; Lai PB; Chan AT; Ngai SM; Hui AY; Johnson PJ; Sung JJ Study of serum haptoglobin and its glycoforms in the diagnosis of hepatocellular carcinoma: a glycoproteomic approach. J. Proteome Res 2006, 5, 2691–2700. [DOI] [PubMed] [Google Scholar]
- (20).Lin Z; Simeone DM; Anderson MA; Brand RE; Xie X; Shedden KA; Ruffin MT; Lubman DM Mass spectrometric assay for analysis of haptoglobin fucosylation in pancreatic cancer. J. Proteome Res 2011, 10,2602–2611. [DOI] [PMC free article] [PubMed] [Google Scholar]
- (21).Lee J; Hua S; Lee SH; Oh MJ; Yun J; Kim JY; Kim JH; Kim JH; An HJ Designation of fingerprint glycopeptides for targeted glycoproteomic analysis of serum haptoglobin: insights into gastric cancer biomarker discovery. Anal. Bioanal Chem 2018, 410, 1617–1629. [DOI] [PubMed] [Google Scholar]
- (22).Park SY; Yoon SJ; Jeong YT; Kim JM; Kim JY; Bernert B ; Ullman T; Itzkowitz SH; Kim JH; Hakomori SI N-glycosylation status of beta-haptoglobin in sera of patients with colon cancer, chronic inflammatory diseases and normal subjects. Int. J. Cancer 2010, 126, 142–155. [DOI] [PubMed] [Google Scholar]
- (23).Lee SH;Jeong S; Lee J; Yeo IS; Oh MJ; Kim U; Kim S; Kim SH; Park SY; Kim JH; Park SH; Kim JH; An HJ Glycomic profiling of targeted serum haptoglobin for gastric cancer using nano LC/MS and LC/MS/MS. Mol. BioSyst 2016, 12, 3611–3621. [DOI] [PubMed] [Google Scholar]
- (24).Zhang S; Shu H; Luo K; Kang X; Zhang Y; Lu H; Liu Y N-linked glycan changes of serum haptoglobin beta chain in liver disease patients. Mol. BioSyst 2011, 7, 1621–1628. [DOI] [PubMed] [Google Scholar]
- (25).Zhu J; Lin Z; Wu J; Yin H; Dai J; Feng Z; Marrero J; Lubman DM Analysis of serum haptoglobin fucosylation in hepatocellular carcinoma and liver cirrhosis of different etiologies. J. Proteome Res 2014, 13, 2986–2997. [DOI] [PMC free article] [PubMed] [Google Scholar]
- (26).Sanda M; Pompach P; Brnakova Z; Wu J; Makambi K; Goldman R Quantitative liquid chromatography-mass spectrometry-multiple reaction monitoring (LC-MS-MRM) analysis of site-specific glycoforms of haptoglobin in liver disease. Mol. Cell. Proteomics 2013, 12, 1294–1305. [DOI] [PMC free article] [PubMed] [Google Scholar]
- (27).Asazawa H; Kamada Y; Takeda Y; Takamatsu S; Shinzaki S; Kim Y; Nezu R; Kuzushita N; Mita E; Kato M; Miyoshi E Serum fucosylated haptoglobin in chronic liver diseases as a potential biomarker of hepatocellular carcinoma development. Clin. Chem. Lab. Med 2015, 53, 95–102. [DOI] [PubMed] [Google Scholar]
- (28).Zhu J; Warner E; Parikh ND; Lubman DM Glycoproteomic markers of hepatocellular carcinoma-mass spectrometry based approaches. Mass Spectrom. Rev 2019, 38, 265–290. [DOI] [PMC free article] [PubMed] [Google Scholar]
- (29).Chen Z; Glover MS; Li L Recent advances in ion mobility-mass spectrometry for improved structural characterization of glycans and glycoconjugates. Curr. Opin. Chem. Biol 2018, 42, 1–8. [DOI] [PMC free article] [PubMed] [Google Scholar]
- (30).Narimatsu H; Kaji H; Vakhrushev SY; Clausen H; Zhang H; Noro E; Togayachi A; Nagai-Okatani C; Kuno A; Zou X; Cheng L; Tao SC; Sun Y Current Technologies for Complex Glycoproteomics and Their Applications to Biology/Disease-Driven Glycoproteomics. J. Proteome Res 2018, 17, 4097–4112. [DOI] [PubMed] [Google Scholar]
- (31).Suttapitugsakul S; Sun F; Wu R Recent Advances in Glycoproteomic Analysis by Mass Spectrometry. Anal. Chem 2020, 92, 267–291. [DOI] [PMC free article] [PubMed] [Google Scholar]
- (32).Walsh I; Zhao S; Campbell M; Taron CH; Rudd PM Quantitative profiling of glycans and glycopeptides: an informatics’ perspective. Curr. Opin. Struct. Biol 2016, 40, 70–80. [DOI] [PubMed] [Google Scholar]
- (33).Sun S; Hu Y; Ao M; Shah P; Chen J; Yang W; Jia X; Tian Y; Thomas S; Zhang H N-GlycositeAtlas: a database resource for mass spectrometry-based human N-linked glycoprotein and glycosylation site mapping. Clin. Proteomics 2019, 16, No. 35. [DOI] [PMC free article] [PubMed] [Google Scholar]
- (34).Dalal K; Dalal B; Bhatia S; Shukla A; Shankarkumar A Analysis of serum Haptoglobin using glycoproteomics and lectin immunoassay in liver diseases in Hepatitis B virus infection. Clin. Chim. Acta 2019, 495, 309–317. [DOI] [PubMed] [Google Scholar]
- (35).Tawara S; Tatsumi T; Iio S; Kobayashi I; Shigekawa M; Hikita H; Sakamori R; Hiramatsu N; Miyoshi E; Takehara T Evaluation of Fucosylated Haptoglobin and Mac-2 Binding Protein as Serum Biomarkers to Estimate Liver Fibrosis in Patients with Chronic Hepatitis C. PLoS One 2016, 11, No. e0151828. [DOI] [PMC free article] [PubMed] [Google Scholar]
- (36).Mondal G; Saroha A; Bose PP; Chatterjee BP Altered glycosylation, expression of serum haptoglobin and alpha-1-antitrypsin in chronic hepatitis C, hepatitis C induced liver cirrhosis and hepatocellular carcinoma patients. Glycoconj. J 2016, 33, 209–218. [DOI] [PubMed] [Google Scholar]
- (37).Huang Y; Zhou S; Zhu J; Lubman DM; Mechref Y LC- MS/MS isomeric profiling of permethylated N-glycans derived from serum haptoglobin of hepatocellular carcinoma (HCC) and cirrhotic patients. Electrophoresis 2017, 38, 2160–2167. [DOI] [PMC free article] [PubMed] [Google Scholar]
- (38).Zhu J; Chen Z; Zhang J; An M; Wu J; Yu Q; Skilton SJ; Bern M; Ilker Sen K; Li L; Lubman DM Differential Quantitative Determination of Site-Specific Intact N-Glycopeptides in Serum Haptoglobin between Hepatocellular Carcinoma and Cirrhosis Using LC-EThcD-MS/MS. J. Proteome Res 2019, 18, 359–371. [DOI] [PMC free article] [PubMed] [Google Scholar]
- (39).Yu Q; Wang B; Chen Z; Urabe G; Glover MS; Shi X; Guo LW; Kent KC; Li L Electron-Transfer/Higher-Energy Collision Dissociation (EThcD)-Enabled Intact Glycopeptide/Glyco-proteome Characterization. J. Am. Soc. Mass Spectrom 2017, 28, 1751–1764. [DOI] [PMC free article] [PubMed] [Google Scholar]
- (40).Bern M; Kil YJ; Becker C Byonic: advanced peptide and protein identification software. Curr. Protoc. Bioinf 2012, No. 23255153. [DOI] [PMC free article] [PubMed] [Google Scholar]
- (41).Zhu J; Wu J; Yin H; Marrero J; Lubman DM Mass Spectrometric N-Glycan Analysis of Haptoglobin from Patient Serum Samples Using a 96-Well Plate Format. J. Proteome Res 2015, 14, 4932–4939. [DOI] [PMC free article] [PubMed] [Google Scholar]
- (42).Perez-Riverol Y; Csordas A; Bai J; Bernal-Llinares M; Hewapathirana S; Kundu DJ; Inuganti A; Griss J; Mayer G; Eisenacher M; Perez E; Uszkoreit J; Pfeuffer J; Sachsenberg T; Yilmaz S; Tiwary S; Cox J; Audain E; Walzer M; Jarnuczak AF; Ternent T; Brazma A; Vizcaino JA The PRIDE database and related tools and resources in 2019: improving support for quantification data. Nucleic Acids Res. 2019, 47, D442–D450. [DOI] [PMC free article] [PubMed] [Google Scholar]
- (43).Pompach P; Brnakova Z; Sanda M; Wu J; Edwards N; Goldman R Site-specific glycoforms of haptoglobin in liver cirrhosis and hepatocellular carcinoma. Mol. Cell. Proteomics 2013, 12, 1281–1293. [DOI] [PMC free article] [PubMed] [Google Scholar]
- (44).Chandler KB; Pompach P; Goldman R; Edwards N Exploring site-specific N-glycosylation microheterogeneity of hapto-globin using glycopeptide CID tandem mass spectra and glycan database search. J. Proteome Res 2013, 12, 3652–3666. [DOI] [PMC free article] [PubMed] [Google Scholar]
- (45).Tyanova S; Temu T; Sinitcyn P; Carlson A; Hein MY; Geiger T; Mann M; Cox J The Perseus computational platform for comprehensive analysis of (prote)omics data. Nat. Methods 2016, 13, 731–740. [DOI] [PubMed] [Google Scholar]
- (46).Deng W; Wang Y; Liu Z; Cheng H; Xue Y HemI: a toolkit for illustrating heatmaps. PLoS One 2014, 9, No. e111988. [DOI] [PMC free article] [PubMed] [Google Scholar]
- (47).Zhang Y; Zhu J; Yin H; Marrero J; Zhang XX; Lubman DM ESI-LC-MS Method for Haptoglobin Fucosylation Analysis in Hepatocellular Carcinoma and Liver Cirrhosis. J. Proteome Res 2015, 14,5388–5395. [DOI] [PMC free article] [PubMed] [Google Scholar]
- (48).Kamada Y; Akita M; Takeda Y; Yamada S; Fujii H; Sawai Y; Doi Y; Asazawa H; Nakayama K; Mizutani K; Fujii H; Yakushijin T; Miyazaki M; Ezaki H; Hiramatsu N; Yoshida Y; Kiso S; Imai Y; Kawada N; Takehara T; Miyoshi E Serum Fucosylated Haptoglobin as a Novel Diagnostic Biomarker for Predicting Hepatocyte Ballooning and Nonalcoholic Steatohepatitis. PLoS One 2013, 8, No. e66328. [DOI] [PMC free article] [PubMed] [Google Scholar]
- (49).Kamada Y; Ono M; Hyogo H; Fujii H; Sumida Y; Mori K; Tanaka S; Yamada M; Akita M; Mizutani K; Fujii H; Yamamoto A; Takamatsu S; Yoshida Y; Itoh Y; Kawada N; Chayama K; Saibara T; Takehara T; Miyoshi E A novel noninvasive diagnostic method for nonalcoholic steatohepatitis using two glycobiomarkers. Hepatology 2015, 62, 1433–1443. [DOI] [PubMed] [Google Scholar]
- (50).Chen Z; Yu Q; Hao L; Liu F; Johnson J; Tian Z; Kao WJ; Xu W; Li L Site-specific characterization and quantitation of N-glycopeptides in PKM2 knockout breast cancer cells using DiLeu isobaric tags enabled by electron-transfer/higher-energy collision dissociation (EThcD). Analyst 2018, 143, 2508–2519. [DOI] [PMC free article] [PubMed] [Google Scholar]
- (51).Liu MQ; Zeng WF; Fang P; Cao WQ; Liu C; Yan GQ; Zhang Y; Peng C; Wu JQ; Zhang XJ; Tu HJ; Chi H; Sun RX; Cao Y; Dong MQ; Jiang BY; Huang JM; Shen HL; Wong CCL; He SM; Yang PY pGlyco 2.0 enables precision N-glycoproteomics with comprehensive quality control and one-step mass spectrometry for intact glycopeptide identification. Nat. Commun 2017, 8, No. 438. [DOI] [PMC free article] [PubMed] [Google Scholar]
- (52).Yuan W; Wei R; Goldman R; Sanda M Optimized Fragmentation for Quantitative Analysis of Fucosylated N-Glycoproteins by LC-MS-MRM. Anal. Chem 2019, 91, 9206–9212. [DOI] [PMC free article] [PubMed] [Google Scholar]
- (53).Ma J; Sanda M; Wei R; Zhang L; Goldman R Quantitative analysis of core fucosylation of serum proteins in liver diseases by LC-MS-MRM. J. Proteomics 2018, 189, 67—74. [DOI] [PMC free article] [PubMed] [Google Scholar]
Associated Data
This section collects any data citations, data availability statements, or supplementary materials included in this article.
Supplementary Materials
Representative extracted ion chromatograms (XICs) of MS/MS spectra of the HexNAc+ ion within the m/z range 204.085–204.089 (Figure S1); representative MS/MS spectra of N-glycopeptides of VVLHPN241YSQVDIGLIK with the glycan A4G4S4 (A) and A4G4F2S3 (B) to elucidate the difference in the MS2 spectrum caused by the change in the glycan moiety between one sialic acid and two fucoses (Figure S2); (A) scatter plot of the relative abundance of the N-glycopeptide N241_A4G4F2S4 in HCC and cirrhosis; (B) ROC curves of the N-glycopeptide N241_A4G4F2S4 in combination with AFP to differentiate HCCs from cirrhosis patients (Figure S3); correlation plot of the differentially expressed N-glycopeptides at sites N184 and N241 (Figure S4); 2-D scatter plots of the AFP value against Hp N-glycopeptides N184_A3G3F1S3 and N184_A4G4F1S2, respectively, in cirrhosis (blue) and HCC (red) patients with AFP < 20 ng/mL (Figure S5); N-glycan database containing 53 human N-glycans used in this study (Table S1); list of the relative abundance of site-specific N-glycopeptides identified at sites N184 and N241 of serum Hp in individual HCC and cirrhosis patients, respectively; mean value in each group, SD, and p-value are also provided (Table S2); list of the relative abundance of N-glycopeptides identified at the site N207 of serum Hp in individual HCC and cirrhosis patients (Table S3) (PDF)
Glycopeptides at sites N184 and N241 (XLSX)
Glycopeptides at site N207 (XLSX)