Abstract
At the end of 2019, a new coronavirus (COVID-19) epidemic has triggered global public health concern. Here, a model integrating the daily intercity migration network, which constructed from real-world migration records and the Susceptible–Exposed–Infected–Removed model, is utilized to predict the epidemic spreading of the COVID-19 in more than 300 cities in China. However, the model has more than 1800 unknown parameters, which is a challenging task to estimate all unknown parameters from historical data within a reasonable computation time. In this article, we proposed a pseudocoevolutionary simulated annealing (SA) algorithm for identifying these unknown parameters. The large volume of unknown parameters of this model is optimized through three procedures co-adapted SA-based optimization processes, respectively. Our results confirm that the proposed method is both efficient and robust. Then, we use the identified model to predict the trends of the epidemic spreading of the COVID-19 in these cities. We find that the number of infections in most cities in China has reached their peak from February 29, 2020, to March 15, 2020. For most cities outside Hubei province, the total number of infected individuals would be less than 100, while for most cities in Hubei province (exclude Wuhan), the total number of infected individuals would be less than 3000.
Keywords: COVID-19, Epidemic spreading, Evolutionary computation, Complex network, Prediction
Introduction
Infectious diseases have been raging in the world many times in history. For example, the Black Death (also known as the Pestilence) in the fourteenth century lasted for 30 years in Europe, with more than 25 million deaths, accounting for about 1/3 of the European population at that time [2]. In 1918, Spanish influenza, which initially outbreaks within the U.S. military, eventually swept the world, infected nearly 600 million people, and caused about 40–50 million death [3]. In 2003, SARS, with a fatality rate of 11%, spread from Guangdong Province to the whole country, bringing huge losses to China’s national economy [4]. In 2009, the H1N1 flu outbreak spread to 214 countries and regions, causing 1, 220 deaths in a few months [5]. In 2014, the outbreak of the Ebola epidemic resulted in 28,637 infections and 11,315 deaths. At the end of 2019, a highly contagious disease, which is caused by infection of the SARS-CoV-2 virus and named the 2019 Coronavirus Disease (COVID-19), broke out and caused millions of infections [6, 7]. The spreading trends of the COVID-19, including when the peaks would occur, how many people would eventually be infected, the final infection rate of the population of each city, and which cities would run the risk of being out of control, are the core questions that need to be answered.
Scholars from various disciplines have participated in the research on epidemic transmission and control. The epidemic spreading model can be traced back to the analysis of smallpox by Daniel Bernoulli in 1760 [8], while the most classic epidemic spreading model is the Susceptible–Infected–Removed (SIR) model proposed by Kermack and McKendrich in 1927 [9]. Based on the SIR model, scholars found that there exists an epidemic threshold depended on the infection and recovery rate. If the infection rate is greater than a threshold, epidemics will spread on a large scale in the population. In 1932, Kermack and McKendrich established the Susceptible–Infected–Susceptible (SIS) model [10], which is similar to the SIR model, except that infected individuals would return to a susceptible state instead of an immune state after recovery. In 1992, for infectious diseases with a limited immune period, J. Mena-Lorca and et al. improved and proposed a more complex Susceptible–Infected–Removed–Susceptible (SIRS) model [11]. Inspired by these pioneering studies, a lot of efforts have been devoted to investigating epidemic spreading under various circumstances [12, 13]. One of the basic problems in theoretical epidemiology is to study the epidemic threshold of classic epidemic spreading models, e.g., SIR, SIS, and SEIR, in various networks, such as scale-free network and its extension [12, 13], complex heterogeneous networks [14], the real-world Oregon graph [15, 16], adaptive networks [17], and the complete worldwide air travel network [18]. Previous literature has unveiled that the epidemic threshold is highly related to the spectral radius of the adjacent matrix of the network [19, 20]. Other researches focused on developing epidemic spreading models in different scenarios and the temporal evolution [21, 22]. However, to our best knowledge, few of them focus on developing models to describe and predict the dynamic of real epidemic spreading cases.
The migration of individuals, especially intercity migration, plays a core role in the spread of SARS-CoV-2 [7, 18]. Wuhan is a metropolis with a population of more than 11 million and is also one of the transportation hubs in China. During the Spring Festival in 2019, 5 million people set off from Wuhan to other cities in China. Large-scale migration greatly enhanced the spread of COVID-19 from outbreak areas to other cities in China. Therefore, the intercity migration data is also an important indicator for describing and predicting the spread of the virus. Here, daily intercity migration data for 367 cities in China are collected and utilized to construct intercity migration networks. Further, a model established by combining complex network theory and the classic SEIR model can be used to describe how COVID-19 spreads from Wuhan to other cities in China. This dynamic model has more than 1800 unknown parameters to be determined from the historical data. The inference of model parameter values from rare historical time-course data can be reformulated as an optimization problem and is still one of the most challenging tasks [23, 24]. Evolutionary algorithms have outstanding performance in solving nonlinear optimization problem [25, 26]. Hence, it is worth developing evolutionary algorithms, which should be robust against noise, efficient in computation, and flexible enough to meet different constraints for estimating these 1800 unknown parameters. In this article, a novel pseudocoevolutionary simulated annealing algorithm is proposed to solve this problem [27]. Results show that the proposed algorithm successfully identified optimal parameter sets of this epidemic spreading model. Also, the model can fit the number of infected, recovered individuals, and the death toll of each city with a minor error.
Based on the model, we find that migration control was extremely effective in controlling the spread of the epidemic. If the government continues strict migration control, the infections numbers of most cities in China would peak between mid-February to early March 2020. The peak number of infections in most cities is smaller than 100, while the proportion of infected individuals in each cities population is smaller than 0.01%. However, if the epidemic spreading is out of control, it would infect about 1% of the population in Hubei province, while infecting about 0.3% population outside Hubei province. The peak number of infections in most cities would come at the end of April 2020. Evidence shows that China has controlled the spreading of COVID-19.
The main contributions of this study are as follows:
First, we integrate daily intercity migration data and traditional SEIR model to develop an extended SEIR model;
A novel pseudocoevolutionary simulated annealing algorithm is proposed. Additionally, we compared the estimation result with simulated annealing, particle swarm optimization, and pattern search algorithms. Results show that the proposed algorithm provides the best results;
The pandemic situation of China has been investigated. Results show that this technique can accurately reflect the spread of COVID-19. Study shows that migration control is extremely effective in controlling the spread of the epidemic.
The rest of this paper is organized as follows. Section 2 reviews related works. The description of data is introduced in Sect. refsec:dataspsdescription, including official released confirmed cases, recovered cases, death toll, and intercity migration data. In Sect. 4, the SEIR-migration model and pseudocoevolutionary simulated annealing algorithm are introduced. Then, the experimental design and results are shown in Sect. 5. Finally, conclusion and future work are presented in Sect. 6.
Literature review
Complex network theory is a powerful tool for researchers to study epidemic spreading. With the development of complex network theory, a large amount of work has investigated the effect of the structure of complex networks (such as degree of relevance, clustering coefficients, community structure, hierarchical structure, and edge weights) on the propagation properties of infectious diseases (such as spreading rate, scale of propagation, and epidemic threshold) [13, 28]. In 2001, Pastor-Satorras et al. studied the propagation model on scale-free networks and proved that scale-free networks are weak against infectious diseases and can maintain spreading at any small infection rate [12, 13]. In the same year, May and Lloyd investigate the effect of network scale on spreading behavior of scale-free networks and pointed out that there are positive propagation thresholds for limited scale-free networks [29]. In 2002, Newman investigated the SIR propagation model in a scale-free network and proved that there is an epidemic threshold when the cutoff value of the degree of nodes in the network is relatively small [30]. In 2007, Toroczkai et al. proposed the concept of dynamic proximity networks based on the premise of dynamic contact networks [31]. Ball et al. constructed a model that includes local adjacent and global accidental connections, and results showed that the degree distribution and accidental connections have a significant effect on the spreading of epidemic [32]. In 2018, Wang et al. proposed a dynamic epidemiological model based on complex routing in the form of multiple routes [33].
Epidemic threshold plays an important role in epidemic spreading. For a large-scale system, when the infection rate , the proportion of infected individuals will reach a limited proportion. Otherwise, if , the proportion of infected people will reduce to almost zero. Therefore, to control the outbreak of epidemics, reducing the infection rate is one of the effective ways. Research shows that frequent absorption, wearing a mask, and disconnecting from the infectious individuals will reduce the probability of infection and then effectively control or slow the outbreak of an epidemic [34]. Additionally, studies have shown that quarantining, closing schools, and restricting individuals from attending public events can make people’s contact networks sparse and reduce infection rate [35]. In 2011, Jin et al. developed an epidemiological model of influenza A, demonstrating that an immunization strategy targeting specific populations with given connectivity can greatly reduce epidemic spreading [36]. Two years later, Guo et al. introduced a continuous-time adaptive susceptible–infectious–susceptible (ASIS) model, proving that the adaption of the topology can inhibit infection [37]. In the same year, Peng et al. investigate several epidemiological models, including susceptibility, infection, and incomplete vaccination segment models, on the Watts–Strogatz small world, Barabasi–Albert scale-free, and random scale-free networks, for analyzing the epidemic threshold and infection rate [38]. More information can be found in the review papers [39]. However, to our understanding, most of the literature about epidemiological models analyzing the propagation in a network is based on analytical methods and large-scale simulations, without the support of real-world data.
A common approach for explaining and analyzing real-world phenomena is to establish epidemiological models based on real-world observation data. These epidemiological models are always nonlinear dynamical models with high parameter dimension, which is often presented as a set of ordinary differential equations (ODEs) or discrete-time equations containing a large volume of unknown parameters [40]. The identification of a large volume of unknown parameters from historical observation data is critical for judging the performance of an epidemiological model. The method for identifying unknown parameters can be classified as “reverse engineering techniques,” which usually formulate the problem of parameter identification into a nonlinear optimization problem that minimizes an objective function representing the fitness of the model with respect to the observation data [23, 24]. The identification results are highly dependent on the optimization algorithm. Due to the simplicity and ease of use, evolutionary algorithms are widely utilized to identify unknown parameters of nonlinear dynamic models [41–44]. However, for nonlinear dynamical systems with high parameter dimension, the objective function is always complicated and has tremendous local minima. Parameter estimation algorithms face a high possibility of converging at local optima but not global minima [45]. Additionally, one parameter identification trial always required tens of hours computation time [46, 47]. Therefore, the parameter estimation problem is still a challenging task and even a bottleneck for nonlinear dynamical models with high parameter dimension. Evolutionary algorithms have been extensively used in nonlinear optimization problems and shown that can provide satisfying results [25–27, 48]. In this article, a new pseudocoevolutionary algorithm is proposed to solve this hard engineering problem, and the more detail information about hard engineering can be found in [49–52].
DATA
Official data of COVID-19 cases
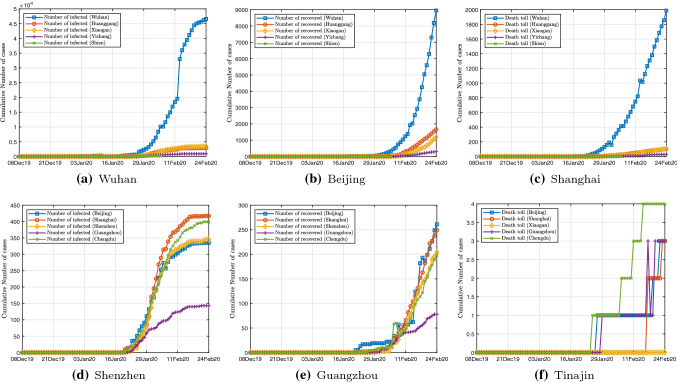
Testing is the only way to know whether a susceptible individual is infected or not. At present, there exist two kinds of tests (techniques) for testing COVID-19. One kind of tests (techniques) checks the presence of the COVID-19 virus, aiming to establish whether an individual is currently infected. The other kind of tests examines the presence of antibodies, which can figure out whether an individual has been infected in the past, even this individual has recovered and not carried COVID-19 virus now. A summary of the current state of testing technologies associated with their implementations can be found in [53]. Now, the most common way to perform a COVID-19 test is adopted by detecting the viral RNA through polymerase chain reaction (PCR). In this work, the official number of infected cases only contains individual who has a positive COVID-19 testing result. In China, Wuhan is received the first confirmed case of COVID-19 infection on December 8, 2019 [6]. Most other cities in China released data of COVID-19 infections around January 20, 2020. The data of COVID-19 infections, recovery, and death toll used in the study were derived from official data released by the National Health Commission of China. Hubei Province was the epicenter of the epidemic in China. Most of the infections occurred in Hubei Province (as shown in Fig.1), while the number of other provinces is relatively small. In this study, one of our aims is to develop an epidemiological model that accurately describes how the number of infections, recovery, and death toll change over time in various cities.
Fig. 1.
Daily data of COVID-19 infections, recovery, and death toll in 5 cities in Hubei province and 5 metropolis in China from December 8, 2019, to February 13, 2020. a Cumulative number of infections of 5 cities in Hubei; b cumulative number of recovery of 5 cities in Hubei; c cumulative number of death toll of 5 cities in Hubei; d cumulative number of infections of 5 metropolis; e cumulative number of recovery of 5 metropolis; f cumulative number of death toll of metropolis (color online)
Intercity travel data
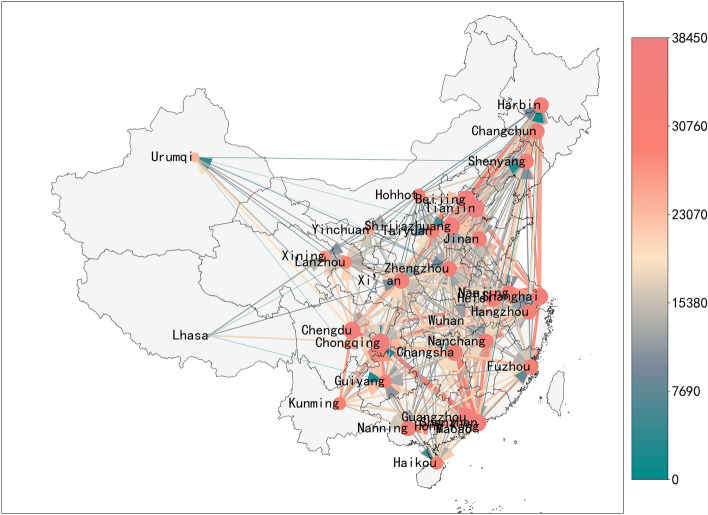
COVID-19 mainly spread through human-to-human transmission. In this case, the intercity migration of infected and exposed individuals has become the main driving force for COVID-19 to spread from one city to another. Chinese New Year (mid-January to early February 2020) is the most important holiday for Chinese people. In 2020, the period around during the Spring Festival holiday in 2019 is approximately from mid-January to early February 2020. Wuhan, as one of the most important transportation hubs in China and the world, is one of the cities with the largest flow of entry and exit around the Spring Festival. China’s Ministry of Transport estimates that Wuhan has about 5 million trips, while China as a whole has about 3 billion trips during the Spring Festival holiday. We have collected daily intercity travel data for 367 cities in China. The data provide the intensity of population migration and also indicate the strength of the population in and out of various cities. Based on these data, we can develop the migration networks (shown in Fig. 2). After the outbreak of COVID-19, the Chinese government has rapidly restricted the intercity migration since January 23, so the strength of intercity migration has dramatically reduced since January 23. Figure 3 shows the total inflow/outflow of travelers of 6 metropolis in Chinese. Note that after migration control, the strength of the intercity migration of Wuhan has almost reduced to zero. The control measure effectively reduced the speed of virus transmission and ultimately successfully controlled the further spread of the virus.
Fig. 2.
Intercity travel network of main cities in China on February 10, 2020. Node size represents the inflow volume, while arrows show direction. Color of lines indicates migration strength (color online)
Fig. 3.
Total inflow/outflow of travelers of 6 metropolis in Chinese. a Travelers to these 6 metropolis; b travelers from these 6 metropolis (color online)
Base on this data, we can construct the migration matrix, which is given as
| 1 |
where is the number of the cities, and is the migrant volume from city i to city j at time t. Migration matrix M thus effectively describes the network of cities with human movement constituting the links of the network. Figure 3 plots the daily total inflow and outflow migration strengths of Wuhan, showing the abrupt decrease in migrant strength after the city shut down all inflow and outflow traffic from February 01, 2020.
The SEIR-migration model and pseudocoevolutionary simulated annealing algorithm
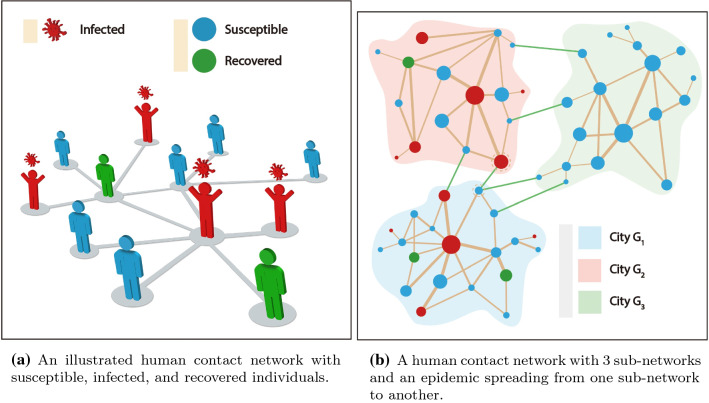
First, we will give a brief description of human contact networks with multiple sub-networks representing a city or administrative regions for epidemic spreading propagation. A real human contact network consists of multiple sub-networks, just as a country consisting of many cities, towns, and villages. Here, we consider a human contact network contains K sub-networks . V stands for the set of nodes, and E is the set of edges. Here, each node represents an individual. If two individuals/nodes and have contacts, there will be a link between them, otherwise, no connection (shown in Fig. 4a). Note that nodes in the same sub-network have plenty and strong connections with network neighbors, which results in a highly clustered sub-network. However, nodes belonging to different sub-networks have less and weak connections. In this work, a sub-network can be treated as a city, while nodes in a sub-network stand for citizens. The K sub-network (city) forms a huge contact network of a country (shown in Fig. 4b).
Fig. 4.
An illustrative example of epidemic spreading a human contact network including three sub-networks (cities) , and . a Virus spread from person to person through a human contact network. A susceptible individual may become an infection if he/she contacts with an infection. A red man with virus icon on the head represents an infection who can spread virus to susceptible neighbors (light blue man), and the solid line between two individuals means they have closely contacted and virus can transmit from one person to the other. An infected individual can be cured and then become a recovered individual (light green mean); b a human contact network with three highly clustered communities (cities) of infected, susceptible, and recovered individuals. (Color online)
In the classic SIR model, each individual can be in three different states: infected (I), susceptible (S), and recovered (R). In an epidemic spreading case, infected individuals (I) can infect susceptible individuals (S) through human contact network, while an infected individual can be cured and turn into recovery state (R). Once an infectious disease starts to spread in a certain sub-network, due to the denseness of the sub-network nodes and the short distance between neighboring nodes, the epidemic will outbreak within the sub-network in a short time ( in Fig. 4b). With the epidemic spread, plenty of susceptible nodes in the network transit into infected nodes. Some infected nodes have connections with nodes in other sub-network. Then, the virus can spread from one sub-network to another sub-network through the nodes connecting two sub-networks and eventually spread to the entire network ( in Fig. 4b).
SEIR-Migration model
Studies reveal that the median incubation period of COVID-19 to be 5.6 days (95% CI 4.8-6.3) [54]. Exposed individuals can also infect other individuals during the incubation period. Each node in human contact networks may assume one of four possible states in the epidemic spreading process, namely susceptible (S), exposed (E), infected (I), and recovered/removed (R). For sub-network (city) j, the number of nodes in the four states , , , and , at time t.
Here, represents the volume of individuals moving from city i to city j at time t. Here, we assume the population of city j is . Then, the number of infected individuals moving from city i to city j is
| 2 |
Also, the volume of individual migrating from city j is . Then, the number of infected individuals moving out of city j is
| 3 |
Thus, the dynamic change of the number of infected cases in city j at time t is given by
| 4 |
where . Moreover, if city i has a population of and the eventual percentage of infection is , then . Thus, we have
| 5 |
where is the eventual number of infections. Similarly, the dynamic changes of infected, susceptible, recovered individuals, and the population of a city can be obtained. Then, we have the modified SEIR model with consideration of human migration dynamics as follows:
| 6 |
where , , , , and . The physical meaning of each parameter of model (6) is presented in Table 1, while a detailed description of the model is given in [1]. Note that we assume the recovered individuals are assumed to stay in the city j.
Table 1.
Parameter set of model (6)
| : | The rate at which the infected individuals infect the susceptible individuals in city j |
| : | The rate at which the exposed individuals infect the susceptible individuals in city j |
| : | The rate at which exposed individuals become infected in city j |
| : | The recovery rate in city j |
| : | The possibility of an infected individual moving from one city to another |
| : | The eventual percentage of infections in city j |
| : | The initial number of infected individuals in city j |
| : | The initial number of individuals in city j |
Parameter identification problem
Model (6) has a large volume of unknown parameter. The parameter estimation problem can be transformed into a nonlinear optimization problem (NLP). The purpose of optimization is to find a set of suitable parameters to make the estimated growth trajectory that matches historical data. Here, we define and , which are the initial number of infected and exposed individuals in city j, respectively. Note hat Wuhan is the epicenter of the COVID-19 pandemic in China, with Hubei province being the region immediately surrounding it. Therefore, it is reasonable to assume that Wuhan has initially infected individuals. Then, , and for all other cities, where and represent the initial number of infected and exposed individuals in Wuhan, respectively. For city j, there exist a set of unknown parameters, i.e.,
| 7 |
Then, the unknown parameter set is . Totally, there exist unknown parameters, where K is the number of cities. Thus, an enormous effort of computation is required to estimate the suitable parameters.
Let be the extended state vector, i.e., , then, we define:
| 8 |
Model (6) can be reformulated as
| 9 |
where f(x) is the right side of (6), and is the set of unknown parameters. Note that , then, Eq. (9) can be reformulated as:
| 10 |
Finally, the parameter estimation problem can be formulated as the following constrained nonlinear optimization problem:
| 11 |
where represents the estimated number of infected individuals at time with parameter set and initial condition . stands for the weighted coefficient. The unknown parameter set is bounded between and . In this work, an inverse approach is taken to find the unknown parameters and states by solving (11).
Proposed pseudocoevolutionary simulated annealing algorithm
Note that the cumulative number of infections varies widely by cities. For example, Wuhan, the city with the largest number of infected people in China, is infected by more than 50,000 people. However, in some small cities, only a dozen people are infected, or even no one has been infected yet. Therefore, the weighted coefficient of the objective function 11 should be carefully adopted. In this work, is defined as follows:
| 12 |
If the city is Wuhan, we have ; otherwise, . In our model, each city has a set of unknown variables , which controls the size of infected population, spreading rate, and the death rate.
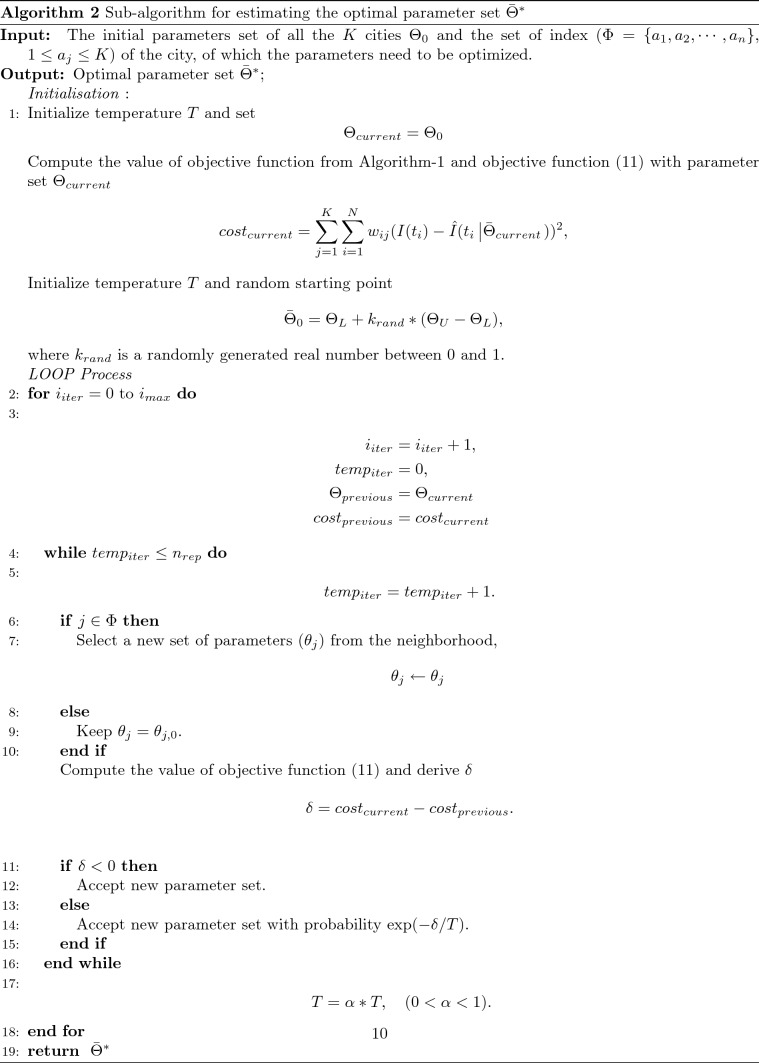
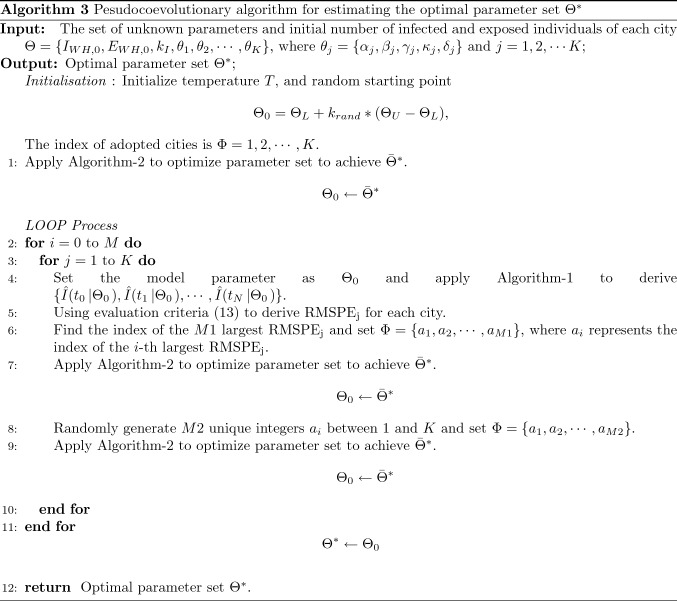
Note that this model has parameters, namely the proposed model has a high-dimension unknown parameter set, which should be optimized. The search space for these optimization problems may be highly nonlinear and contain many local minima. Evolutionary algorithms have been extensively used in nonlinear optimization [25, 26, 48]. In this article, we proposed a new pseudocoevolutionary algorithm to solve this inverse engineering problem. This main procedure tunes all the parameters, while the other two processes tune part of the parameters. The parameter estimation problem is separated into three co-adapted SA-based optimization processes. This main procedure tunes all the parameters, while the other two processes tune part of the parameters.
- In the main procedure, we tune the all the parameters. Then, we adopt root mean square percentage error (RMSPE) as follows:
Here, is utilized as the criterion to measure the difference between the real daily infection data and the estimated infected individuals generated by this extended SEIR-migration model with an optimal parameter set ;13 In this process, we find the index of the largest and only tune the parameter sets of the corresponding cities.
In order to avoid that the parameters of some cities have not been adopted and adjusted individually during the whole identification process, we randomly select cities and adjust their parameters.
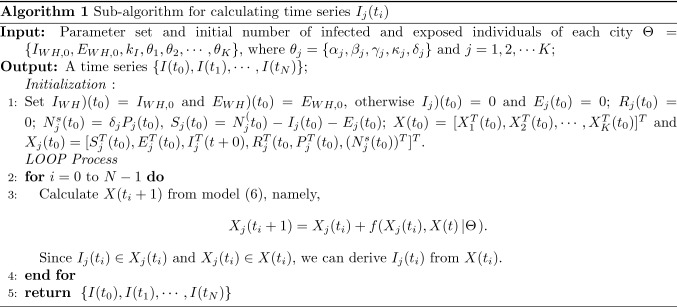
The whole optimization procedure is summarized in Algorithm-3, while Algorithm-2 is utilized for searching optimal parameters in subspace in each step.
Experimental results
The National Health Committee of China has published data on the spread of the COVID-19 epidemic from January 20, 2020. We use these historical data for parameter estimation of the SEIR-migration model (6). The pseudocoevolutionary simulated annealing algorithm, as described in Sect. 4.3, is adopted to find the optimal parameter set of this model. Since the parameters of the model are all estimated from historical data through reverse engineering techniques, the accuracy and integrity of the data are essential. In the early stage of COVID-19, people do not know much about this virus, and the diagnostic techniques are limited. Therefore, during the early stage of the outbreak of COVID-19, the historical data of Wuhan City are possible to deviate from the true value in a wide range. Hence, we reduce the weighting coefficients corresponding to Wuhan data in the objective function. In addition, after the outbreak of the epidemic, Chinese government has adopted effective quarantine measures and promoted epidemic prevention knowledge. These measures can effectively reduce the infection rate in each city. Therefore, the parameters in the model should be time-varying. Nevertheless, to simplify the calculation, we assume that these parameters are constant over the whole process. We also applied traditional simulated annealing, particle swarm optimization, genetic algorithm, and pattern search method to estimate the parameters of the model. However, these methods cannot provide a satisfied result or cannot even converge in an acceptable computation time (such as one day), while the proposed method can converge to the global optima in two hours.
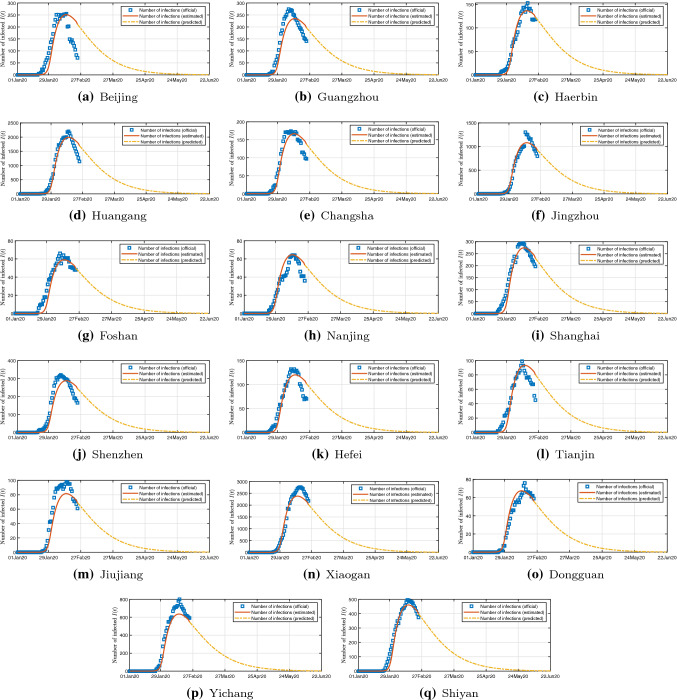
This model can estimate the daily number of infected, exposed, and recovered individuals in all 367 cities. Due to space limitations, we only show the results of 17 cities in Fig. 5. Assuming that the migration control measures, infection rate, and recovery rate will remain unchanged for a period of time in the future, this model can provide a prediction of the amount of actively infected individuals in each city, as shown in 5. Results clearly show that the number of actively infected individuals has reached or peaked in most cities in China from February 20 to March 15, 2020. The prediction results show that there will be few new confirmed cases from early March, and the number of actively infected individuals will gradually decrease. The pseudocoevolutionary simulated annealing algorithm successfully finds the optimal parameter set: , , , . Figure 6a shows the estimated peak number of infected individual in each province, while Fig. 6b reveals the estimated total number of infected individuals in each province. Results show that the number of infections in most provinces is smaller than 1000. It is reasonable to assume that our knowledge of the COVID-19 will gradually increase. Then, the medical treatment will improve and the recovery rate will increase each day. We assume the recovery rate will increase 0.0005 each day, namely every 20 days, the number of daily recovered individuals increases by 1% of the total number of infected individuals. Then, most cities in China will have almost zero infections before July 2020. Therefore, we can claim that China has already controlled the spreading of COVID-19 in China.
Fig. 5.
Estimated historical data and prediction of the number of infected individuals in 17 selected cities in China for the next 150 days
Fig. 6.
a Peak number of infections in each province; b estimated total number of infected individuals eventually infected in a province
Conclusion
The novel Coronavirus Disease 2019 (COVID-19) epidemic has caused 75,204 confirmed cases and 2,006 death utile February 19, 2020, which triggers global public health concern. Peak prediction informing social and non-pharmaceutical prevention interventions is illuminating but remains difficult to achieve accuracy. Intercity migration is one of the essential factors in the spread of the disease. We construct migration networks of 367 cities in China. An SEIR-migration model with more than 1800 unknown parameters is utilized to model the spreading of COVID-19 in the 367 cities in China. We proposed a pseudocoevolutionary simulated annealing algorithm to identify these unknown parameters from historical data of the number of infected, recovered, and death toll. From this model, we can achieve all the essential information about the epidemic spreading, including infection rates, recovery rates, and eventual percentage of the infected population for 367 cities in China. The main conclusion of our study is that the COVID-19 epidemic spreading would peak between mid-February to early March 2020, with about , less than , and less than of the population eventually infected in Wuhan, Hubei Province, and the rest of China, respectively. Results indicate that the COVID-19 epidemic has been controlled. This work provides a method for estimating the proportion of infected people. However, only seroprevalence studies may actually estimate the proportion of infected individuals.
Acknowledgements
This work was supported by National Science Foundation of China Project 61703355 and Science and Technology Program of Guangzhou, China (201904010224 and 201804010292), and Natural Science Foundation of Guangdong Province, China (c20140500000225). The able assistance of Mr Zhuohui Dong in programming is gratefully acknowledged.
Compliance with ethical standards
Conflict of interest
All authors declare that they have no conflict of interest.
Ethical approval
All authors have known that the manuscript is submitted to your journal. And all of us confirm that the content of the manuscript has not been published elsewhere.
Footnotes
This paper is an updated version of a preprint uploaded on Feb 20, 2020, to medRxiv.org (doi: 2020.02.18.20024570) [1].
Publisher's Note
Springer Nature remains neutral with regard to jurisdictional claims in published maps and institutional affiliations.
Contributor Information
Choujun Zhan, Email: 20185076@m.scnu.edu.cn.
Bing Li, Email: 11539@whut.edu.cn.
References
- 1.Zhan C, Chi KT, Fu Y, Lai Z, Zhang H Modeling and prediction of the 2019 coronavirus disease spreading in china incorporating human migration data, medRxiv [DOI] [PMC free article] [PubMed]
- 2.List of epidemics (2020). https://en.wikipedia.org/wiki/List_of_epidemics
- 3.Mackowiak PA. Post mortem: solving history’s great medical mysteries. Maryland: ACP Press; 2007. [Google Scholar]
- 4.The world health report 2003 (2003). https://www.who.int/whr/2003/en/
- 5.Ding H, Santibanez TA, Jamieson DJ, Weinbaum CM, Euler GL, Grohskopf LA, Lu P-J, Singleton JA. Influenza vaccination coverage among pregnant women-national 2009 h1n1 flu survey (nhfs) Am J Obstetr Gynecol. 2011;204(6):S96–S106. doi: 10.1016/j.ajog.2011.03.003. [DOI] [PubMed] [Google Scholar]
- 6.Li Q, Guan X, Wu P, Wang X, Zhou L, Tong Y, Ren R, Leung KS, Lau EH, Wong JY, et al. Early transmission dynamics in wuhan, china, of novel coronavirus-infected pneumonia. N Engl J Med. 2020;382:1199–1207. doi: 10.1056/NEJMoa2001316. [DOI] [PMC free article] [PubMed] [Google Scholar]
- 7.Wu JT, Leung K, Leung GM. Nowcasting and forecasting the potential domestic and international spread of the 2019-nCoV outbreak originating in Wuhan, China: a modelling study. The Lancet. 2020;395(10225):689–697. doi: 10.1016/S0140-6736(20)30260-9. [DOI] [PMC free article] [PubMed] [Google Scholar]
- 8.Dietz K, Heesterbeek JAP. Daniel Bernoulli’s epidemiological model revisited. Math Biosci. 2002;180(1–2):1–21. doi: 10.1016/s0025-5564(02)00122-0. [DOI] [PubMed] [Google Scholar]
- 9.Kermack WO, McKendrick AG. Contributions to the mathematical theory of epidemics—I. Bullet Math Biol. 1991;53(1–2):33–55. doi: 10.1007/BF02464423. [DOI] [PubMed] [Google Scholar]
- 10.Kermack WO, McKendrick AG (1932) Contributions to the mathematical theory of epidemics. ii.-the problem of endemicity. In: Proceedings of the Royal Society of London. Series A, containing papers of a mathematical and physical character 138(834) pp 55–83
- 11.Mena-Lorcat J, Hethcote HW. Dynamic models of infectious diseases as regulators of population sizes. J Math Biol. 1992;30(7):693–716. doi: 10.1007/BF00173264. [DOI] [PubMed] [Google Scholar]
- 12.Pastor-Satorras R, Vespignani A. Epidemic spreading in scale-free networks. Phys Rev Lett. 2001;86(14):3200. doi: 10.1103/PhysRevLett.86.3200. [DOI] [PubMed] [Google Scholar]
- 13.Pastor-Satorras R, Vespignani A. Epidemic dynamics and endemic states in complex networks. Phys Rev E. 2001;63(6):066117. doi: 10.1103/PhysRevE.63.066117. [DOI] [PubMed] [Google Scholar]
- 14.Moreno Y, Nekovee M, Pacheco AF. Dynamics of rumor spreading in complex networks. Phys Rev E. 2004;69(6):066130. doi: 10.1103/PhysRevE.69.066130. [DOI] [PubMed] [Google Scholar]
- 15.Wang Y, Chakrabarti D, Wang C, Faloutsos C (2003) Epidemic spreading in real networks: an eigenvalue viewpoint. In: Proceedings of International Symposium on Reliable Distributed Systems, IEEE, pp 25–34
- 16.Chakrabarti D, Wang Y, Wang C, Leskovec J, Faloutsos C. Epidemic thresholds in real networks. ACM Trans Inf Syst Secur (TISSEC) 2008;10(4):1. [Google Scholar]
- 17.Gross T, D’Lima CJD, Blasius B. Epidemic dynamics on an adaptive network. Phys Rev Lett. 2006;96(20):208701. doi: 10.1103/PhysRevLett.96.208701. [DOI] [PubMed] [Google Scholar]
- 18.Colizza V, Barrat A, Barthélemy M, Vespignani A. The role of the airline transportation network in the prediction and predictability of global epidemics. Proc Natl Acad Sci USA. 2006;103(7):2015–2020. doi: 10.1073/pnas.0510525103. [DOI] [PMC free article] [PubMed] [Google Scholar]
- 19.Valdano E, Ferreri L, Poletto C, Colizza V. Analytical computation of the epidemic threshold on temporal networks. Phys Rev X. 2015;5(2):021005. [Google Scholar]
- 20.Prakash BA, Chakrabarti D, Valler NC, Faloutsos M, Faloutsos C. Threshold conditions for arbitrary cascade models on arbitrary networks. Knowl Inf Syst. 2012;33(3):549–575. [Google Scholar]
- 21.Newman ME. Spread of epidemic disease on networks. Phys Rev E. 2002;66(1):016128. doi: 10.1103/PhysRevE.66.016128. [DOI] [PubMed] [Google Scholar]
- 22.Sanz J, Xia C-Y, Meloni S, Moreno Y. Dynamics of interacting diseases. Phys Rev X. 2014;4(4):041005. [Google Scholar]
- 23.Zhan C, Yeung LF. Parameter estimation in systems biology models using spline approximation. BMC Syst Biol. 2011;5(1):14. doi: 10.1186/1752-0509-5-14. [DOI] [PMC free article] [PubMed] [Google Scholar]
- 24.Zhan C, Situ W, Yeung LF, Tsang PW-M, Yang G. A parameter estimation method for biological systems modelled by ode/dde models using spline approximation and differential evolution algorithm. IEEE/ACM Trans Comput Biol Bioinf. 2014;11(6):1066–1076. doi: 10.1109/TCBB.2014.2322360. [DOI] [PubMed] [Google Scholar]
- 25.Liu X-F, Zhan Z-H, Gao Y, Zhang J, Kwong S, Zhang J. Coevolutionary particle swarm optimization with bottleneck objective learning strategy for many-objective optimization. IEEE Trans Evolut Comput. 2018;23(4):587–602. [Google Scholar]
- 26.Yang Q, Chen W-N, Da Deng J, Li Y, Gu T, Zhang J. A level-based learning swarm optimizer for large-scale optimization. IEEE Trans Evolut Comput. 2017;22(4):578–594. doi: 10.1109/TCYB.2016.2616170. [DOI] [PubMed] [Google Scholar]
- 27.Zhang J, Chung HS-H, Lo W-L. Pseudocoevolutionary genetic algorithms for power electronic circuits optimization. IEEE Trans Syst Man Cybern Part C Appl Rev. 2006;36(4):590–598. [Google Scholar]
- 28.Lü L, Chen D-B, Zhou T. The small world yields the most effective information spreading. New J Phys. 2011;13(12):123005. [Google Scholar]
- 29.May RM, Lloyd AL. Infection dynamics on scale-free networks. Phys Rev E. 2001;64(6):066112. doi: 10.1103/PhysRevE.64.066112. [DOI] [PubMed] [Google Scholar]
- 30.Moore C, Newman ME. Epidemics and percolation in small-world networks. Phys Rev E. 2000;61(5):5678. doi: 10.1103/physreve.61.5678. [DOI] [PubMed] [Google Scholar]
- 31.Toroczkai Z, Guclu H. Proximity networks and epidemics. Phys A Statist Mech Appl. 2007;378(1):68–75. [Google Scholar]
- 32.Ball F, Neal P. Network epidemic models with two levels of mixing. Math Biosci. 2008;212(1):69–87. doi: 10.1016/j.mbs.2008.01.001. [DOI] [PubMed] [Google Scholar]
- 33.Wang Y, Cao J, Li X, Alsaedi A. Edge-based epidemic dynamics with multiple routes of transmission on random networks. Nonlinear Dyn. 2018;91(1):403–420. [Google Scholar]
- 34.Fenichel EP, Castillo-Chavez C, Ceddia MG, Chowell G, Parra PAG, Hickling GJ, Holloway G, Horan R, Morin B, Perrings C, et al. Adaptive human behavior in epidemiological models. Proc Natl Acad Sci. 2011;108(15):6306–6311. doi: 10.1073/pnas.1011250108. [DOI] [PMC free article] [PubMed] [Google Scholar]
- 35.Barabási A-L, et al. Network science. Cambridge: Cambridge University Press; 2016. [Google Scholar]
- 36.Jin Z, Zhang J, Song L-P, Sun G-Q, Kan J, Zhu H. Modelling and analysis of influenza a (h1n1) on networks. BMC Public Health. 2011;11(S1):S9. doi: 10.1186/1471-2458-11-S1-S9. [DOI] [PMC free article] [PubMed] [Google Scholar]
- 37.Guo D, Trajanovski S, van de Bovenkamp R, Wang H, Van Mieghem P. Epidemic threshold and topological structure of susceptible-infectious-susceptible epidemics in adaptive networks. Phys Rev E. 2013;88(4):042802. doi: 10.1103/PhysRevE.88.042802. [DOI] [PubMed] [Google Scholar]
- 38.Peng X-L, Xu X-J, Fu X, Zhou T. Vaccination intervention on epidemic dynamics in networks. Phys Rev E. 2013;87(2):022813. doi: 10.1103/PhysRevE.87.022813. [DOI] [PubMed] [Google Scholar]
- 39.Pastor-Satorras R, Castellano C, Van Mieghem P, Vespignani A. Epidemic processes in complex networks. Rev Mod Phys. 2015;87(3):925. [Google Scholar]
- 40.Frauenthal JC. Mathematical modeling in epidemiology. Berlin: Springer; 2012. [Google Scholar]
- 41.Huang Y, Gao L, Yi Z, Tai K, Kalita P, Prapainainar P, Garg A. An application of evolutionary system identification algorithm in modelling of energy production system. Measurement. 2018;114:122–131. [Google Scholar]
- 42.Cuevas E, Gálvez J, Avalos O. Parameter estimation for chaotic fractional systems by using the locust search algorithm. Computación y Sistemas. 2017;21(2):369–380. [Google Scholar]
- 43.Samsuri SFM, Ahmad R, Zakaria MZ, Zain MZM (2019) Parameter tuning for comparing multi-objective evolutionary algorithms applied to system identification problems. In: 2019 IEEE International conference on smart instrumentation, measurement and application (ICSIMA), IEEE, pp 1–6
- 44.Fan Q, Zhang Y. Self-adaptive differential evolution algorithm with crossover strategies adaptation and its application in parameter estimation. Chem Intell Lab Syst. 2016;151:164–171. [Google Scholar]
- 45.Tsai K-Y, Wang F-S. Evolutionary optimization with data collocation for reverse engineering of biological networks. Bioinformatics. 2005;21(7):1180–1188. doi: 10.1093/bioinformatics/bti099. [DOI] [PubMed] [Google Scholar]
- 46.Kimura S, Ide K, Kashihara A, Kano M, Hatakeyama M, Masui R, Nakagawa N, Yokoyama S, Kuramitsu S, Konagaya A. Inference of s-system models of genetic networks using a cooperative coevolutionary algorithm. Bioinformatics. 2005;21(7):1154–1163. doi: 10.1093/bioinformatics/bti071. [DOI] [PubMed] [Google Scholar]
- 47.Koh G, Teong HFC, Clément M-V, Hsu D, Thiagarajan P. A decompositional approach to parameter estimation in pathway modeling: a case study of the akt and mapk pathways and their crosstalk. Bioinformatics. 2006;22(14):e271–e280. doi: 10.1093/bioinformatics/btl264. [DOI] [PubMed] [Google Scholar]
- 48.Shi W, Chen W-N, Lin Y, Gu T, Kwong S, Zhang J. An adaptive estimation of distribution algorithm for multipolicy insurance investment planning. IEEE Trans Evolut Comput. 2017;23(1):1–14. [Google Scholar]
- 49.Li Q, Wu Z, Zhang H. Spatio-temporal modeling with enhanced flexibility and robustness of solar irradiance prediction: a chain-structure echo state network approach. J Clean Product. 2020;261:121151. doi: 10.1016/j.jclepro.2020.121151. [DOI] [Google Scholar]
- 50.Arora S, Singh S. Node localization in wireless sensor networks using butterfly optimization algorithm. Arab J Sci Eng. 2017;42(8):3325–3335. [Google Scholar]
- 51.Wu Z, Li Q, Wu W, Zhao M. Crowdsourcing model for energy efficiency retrofit and mixed-integer equilibrium analysis. IEEE Trans Ind Inf. 2019;16(7):4512–4524. [Google Scholar]
- 52.Dai P, Liu K, Feng L, Zhang H, Lee VCS, Son SH, Wu X. Temporal information services in large-scale vehicular networks through evolutionary multi-objective optimization. IEEE Trans Intell Transp Syst. 2018;20(1):218–231. [Google Scholar]
- 53.Zhan C, Chi KT, Fu Y, Lai Z, Zhang H. Humanity tested. Nat Biomed Eng. 2020;4:355–356. doi: 10.1038/s41551-020-0553-6. [DOI] [PMC free article] [PubMed] [Google Scholar]
- 54.Backer JA, Klinkenberg D, Wallinga J. Incubation period of 2019 novel coronavirus (2019-ncov) infections among travellers from wuhan, china, 20–28 January 2020. Eurosurveillance. 2020;25(5):2000062. doi: 10.2807/1560-7917.ES.2020.25.5.2000062. [DOI] [PMC free article] [PubMed] [Google Scholar]


