Abstract
The chimeric antigen receptor (CAR) directs T cells to target and kill specific cancer cells. Despite the success of CAR T therapy in clinics, the intracellular signaling pathways that lead to CAR T cell activation remain unclear. Using CD19 CAR as a model, we report that, similar to the endogenous T cell receptor (TCR), antigen engagement triggers the formation of CAR microclusters that transduce downstream signaling. However, CAR microclusters do not coalesce into a stable central supramolecular activation cluster (cSMAC). Moreover, LAT, an essential scaffold protein for TCR signaling, is not required for microcluster formation, immunological synapse formation, nor actin remodeling following CAR activation. However, CAR T cells still require LAT for an optimal production of the cytokine IL‐2. Together, these data show that CAR T cells can bypass LAT for a subset of downstream signaling outputs, thus revealing a rewired signaling pathway as compared to native T cells.
Keywords: actin, CAR, immunological synapse, LAT, T cell signaling
Subject Categories: Immunology, Signal Transduction
Comparison of signaling pathways employed by endogenous T‐cell receptors (TCR) and by chimeric antigen receptors (CAR) used in anti‐cancer therapy surprisingly finds the essential intracellular TCR scaffold protein LAT to be dispensable for the latter.

Introduction
The development of T cells engineered with chimeric antigen receptors (CARs) has launched a new era of cell‐based therapy for cancer. CAR is a synthetic single‐pass transmembrane receptor that is intended to mimic the signal transducing function of the T cell receptor (TCR). CAR recognizes a tumor antigen and activates pathways leading to T cell activation. CAR T cell therapy, as approved by the FDA, has been successfully applied to treat patients with B cell cancers, including acute lymphoblastic leukemia and non‐Hodgkin lymphoma (Porter et al, 2011; Lee et al, 2015; Ghobadi, 2018). However, many patients do not respond to CAR T therapy, and some suffer from severe neurotoxicity and cytokine release syndrome (Lim & June, 2017; June & Sadelain, 2018). Furthermore, there are unexplained aspects of the CAR T cell response to antigen stimulation. CARs, for example, trigger faster tyrosine phosphorylation of downstream effectors and faster cytotoxic granule release than TCRs do (Davenport et al, 2018). Perhaps even more surprisingly, CAR‐CD4+ T cells can kill target cells as efficiently as CAR‐CD8+ T cells, although the basis of this phenomenon is not known (Xhangolli et al, 2019). A better understanding of the molecular mechanism of CAR signaling is needed for explaining the unique aspects of CAR T cells and could suggest new strategies for designing better CAR T therapies targeting blood cancers and beyond.
Here, we sought to define the signaling pathway downstream of CAR activation in both immortalized human T cell lines (Jurkat T cells) and primary human T cells. We found that, similar to TCRs, CARs form near micron‐sized clusters that serve as signaling platforms to transduce the activation signal from antigen engagement. However, LAT, an adaptor protein essential for TCR microcluster formation, is dispensable for the formation of CAR microclusters. CAR can also bypass LAT to activate LAT's downstream signaling pathways leading to actin reorganization and synapse formation. Together, these data suggest a rewired signaling pathway that mediates CAR signal transduction which is different from the TCR pathway.
Results
CARs form microclusters upon ligand engagement
We used the 3rd‐generation CD19‐CAR as a model, which is activated by the CD19 molecule on the B‐cell surface. A stalk and transmembrane domain derived from CD8α connects the extracellular single‐chain variable fragment (scFv) recognizing CD19 to the intracellular domain composed of the cytoplasmic part of TCR subunit CD3ζ, co‐receptor CD28, and 4‐1BB (Fig 1A). A GFP tag was introduced at the C‐terminus to visualize CAR dynamics. A Jurkat T cell line stably expressing GFP‐tagged CAR was constructed through lentiviral transduction followed by fluorescence‐activated cell sorting (FACS). To stimulate these CAR T cells, we used a supported lipid bilayer‐based activation system (Grakoui et al, 1999; Valvo et al, 2017; Libby & Su, 2020), which is compatible with high signal‐to‐noise imaging of the T cell plasma membrane by total internal reflection fluorescence (TIRF) microscopy. In this system, the extracellular domain of CD19, the ligand for CAR, was attached to the supported lipid bilayers (SLBs), as a surrogate for antigen‐presenting cells. To facilitate cell adhesion, the SLBs were also coated with ICAM‐1, an integrin ligand (Fig 1B).
Figure 1. CAR forms microclusters that are signaling‐active.
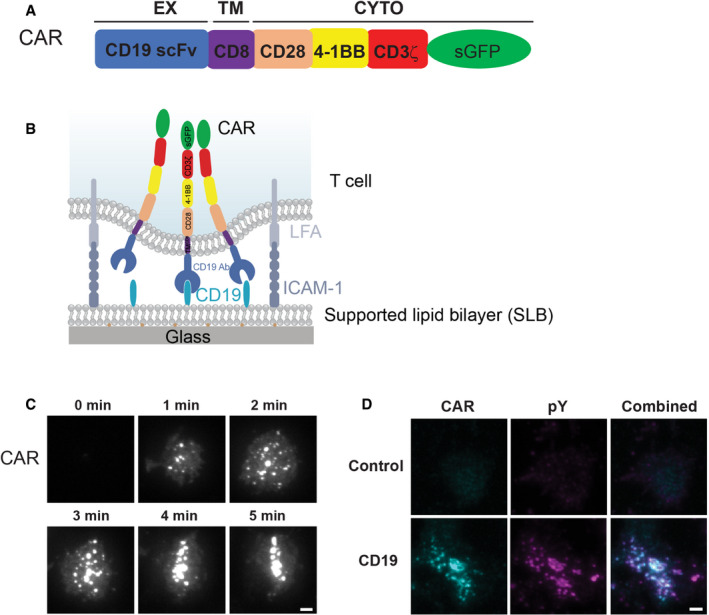
- Domain structure of CAR.
- Schematic of the system for stimulating CAR T cells and imaging CAR dynamics. Supported lipid bilayers (SLBs) were coated with the extracellular domain of CD19 and an integrin ligand ICAM‐1.
- TIRF microscopy revealed the time courses of the CAR‐GFP microcluster formation as CAR T cells spread on the CD19‐ and ICAM‐1‐coated SLBs.
- Enrichment of phosphotyrosine (pY) at CAR microclusters. CAR T cells were fixed 20 min after being plated on the SLB, followed by staining with an anti‐pan phosphotyrosine antibody. No CD19 was included in the control experiment (only ICAM‐1). Scale bar: 2 μm.
When CAR T cells were plated onto the CD19 and ICAM‐1‐coated SLBs, CAR microclusters rapidly formed as cells spread on the SLB (Fig 1C). These CAR microclusters were enriched in phosphotyrosines (Fig 1D), indicating that they are spots of active signaling. In contrast, in the absence of CD19, neither microclusters nor phosphotyrosine signals were present on the T cell membranes (Fig 1D). These data show that the CD19 binding to CAR triggers the formation of signaling‐competent microclusters, which is very similar to what has been reported for pMHC‐triggered TCR microclusters (Bunnell et al, 2002; Varma et al, 2006).
We then monitored the behavior of CAR microclusters over time. In about one‐quarter of the CAR T cells, CAR microclusters translocated to the cell center and formed a stable disk‐like structure (Fig 2A, upper panel, Movie EV1 and Fig 2B), which resembles the central supramolecular activation cluster (cSMAC) (Grakoui et al, 1999). However, in another quarter of cells, the CAR cSMAC initially formed but then quickly disassembled (Movie EV2 and Fig 2B). The average duration of these unstable cSMAC was 6.8 ± 2.7 min (N = 31 cells). We also observed moving synapses (kinapse) in about 11% of cells (Movie EV3 and Fig 2B). Most strikingly, in ~40% of cells, individual microclusters remained separated and did not form a cSMAC (Fig 2A lower panel, Movie EV4, and Fig 2B). The duration from cell landing to the start of retrograde flow was 2.4 min in cells without a cSMAC, which is slightly longer than in those with a stable cSMAC (1.4 min, Fig 2C). Together, these data suggest most of the CAR T cells do not form a stable cSMAC.
Figure 2. CAR induces non‐typical immunological synapses.
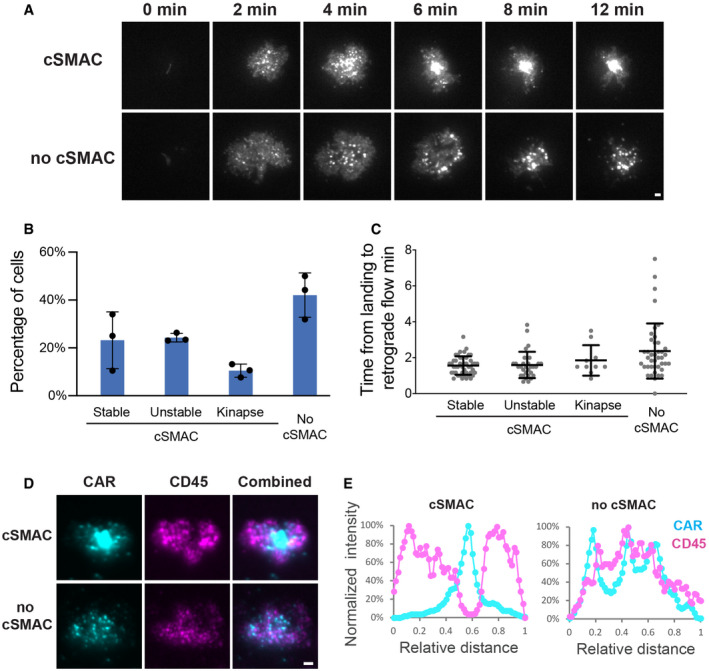
- CAR microclusters underwent centripetal movement to form cSMAC (upper panel) or remained separated (lower panel).
- Quantification of the categories regarding the formation of CAR cSMAC. Unstable cSMACs are defined by a cSMAC duration below 12 min. Data are shown as mean ± SD. n = 3 independent experiments. 37, 38, and 47 cells were quantified in individual experiments.
- Quantification of time from cell landing to the start of retrograde flow. Data are shown as mean ± SD. n = 33 (stable), 31 (unstable), 10 (kinapse), and 41 (no cSMAC) cells. Results are pooled from three independent experiments.
- Localization of CAR and CD45 in the immunological synapse. CAR T cells were fixed 20 min after being plated on the SLB, followed by staining with an anti‐CD45 antibody.
- Line scan of CAR and CD45 across the long axis of the immunological synapse. Shown is the normalized fluorescence intensity.
CD45 is the most abundant protein tyrosine phosphatase on the T cell membrane and plays a critical role in regulating TCR signaling (Courtney et al, 2018). Previous reports suggested that CD45 is enriched at the distal end of the TCR‐induced synapse, or dSMAC (distal supramolecular activation cluster) (Freiberg et al, 2002). To determine the CD45 localization in the CAR synapse, we fixed CAR T cells 20 min after activation by the SLBs and performed immunofluorescence analysis. TIRF microscopy reconfirmed that a minor portion of CAR T cells (39%) maintained cSMAC by 20 min. In the category where cSMACs were formed, 69% of cells display a dSMAC‐like pattern, in which CD45 surrounds the cSMAC; in contrast, in the category where cSMACs were not formed or disassembled by 20 min, 66% of cells displayed a CD45 localization that was more uniform and not excluded from the center of the cells (Fig 2D and E). Therefore, the majority of the CAR T cells do not induce a typical dSMAC pattern. Together, these data suggest that CARs induce a non‐typical pattern of the immunological synapse.
CARs form microclusters independent of LAT
Next, we determined the molecular requirements for transducing CAR signaling. LAT, or linker for activation of T cells, is an essential adaptor for TCR signaling (Zhang et al, 1998). Deletion or mutation of LAT impairs microcluster formation of LAT binding partners (Barda‐Saad et al, 2005; Su et al, 2016) as well as signal transduction to downstream pathways including calcium influx, MAPK activation, IL‐2 production, and actin remodeling (Finco et al, 1998; Bunnell et al, 2001). To determine whether LAT is required for CAR signaling, we introduced CAR into LAT‐deficient Jcam2.5, a classical cell line for studying TCR signaling (Finco et al, 1998; Zhang et al, 2000). First, we verified that TCR microclusters did not form in Jcam2.5 cells when T cells were activated by SLB‐presented OKT3, a TCR‐activating antibody (Fig 3A, left panel). However, surprisingly, CARs still formed microclusters in this LAT‐deficient line (Fig 3A and B). Titration analysis suggested that the LAT‐independent CAR microcluster formation occurs at both high and low antigen densities (Fig EV1). To further confirm our findings, we examined TCR and CAR microcluster formation in a LAT‐knockout line, J.LAT, which was generated by CRISPR/Cas9‐mediated genome editing (Lo et al, 2018). Similar to what was found in the Jcam2.5 cells, LAT is required for the microcluster formation of the TCR, but not CAR (Fig EV2A and B, Movie EV5).
Figure 3. LAT is not required for CAR microcluster formation.
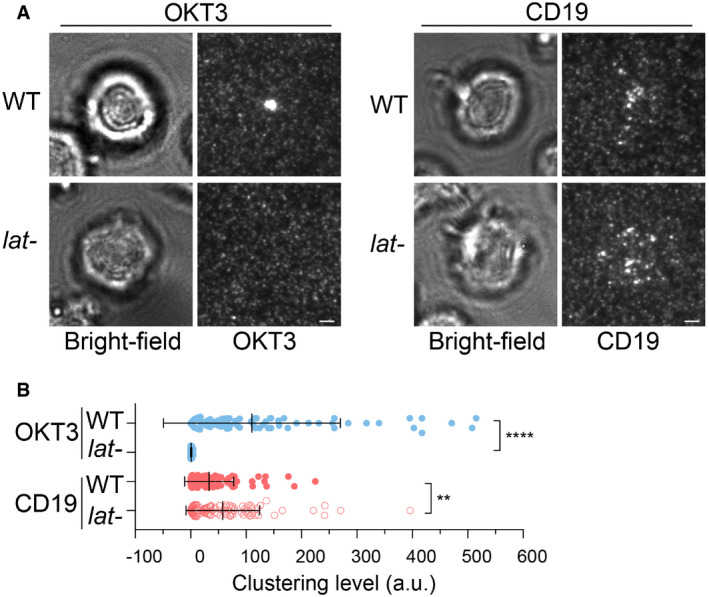
- WT or LAT‐deficient Jurkat cells (Jcam2.5) expressing CAR‐GFP were stimulated on SLB‐coated with OKT3 (anti‐TCR antibody) or CD19 (CAR antigen); in both conditions, the lipid bilayers were also coated with ICAM‐1 to facilitate cell attachment. TIRF microscopy revealed clustering of Ax647‐labeled streptavidin–biotin‐OKT3 or CD19, which serves as a probe for TCR or CAR, respectively. Scale bar, 2 μm.
- Quantification of clustering as normalized variance. n = 100 cells. Shown are the means ± SD. Statistical test: unpaired two‐tailed t‐test. ****P < 0.0001. **0.005 < P < 0.05.
Figure EV1. Titration analysis of the LAT‐independent CAR microcluster formation.
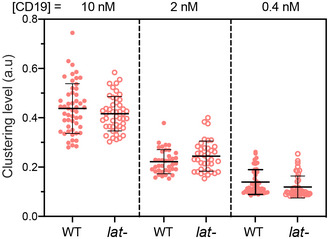
WT or LAT‐deficient (J.LAT) Jurkat T cells expressing CAR‐GFP were stimulated on SLB coated with CD19 of indicated concentrations. The clustering of Alexa Fluor 647‐labeled streptavidin in conjugation with biotin‐CD19 was imaged by TIRF microscopy and quantified as normalized variance in the same way as in Fig 3B. Shown are the means ± SD. n = 52, 38, and 44 cells for WT at 10, 2 and 0.4 nM, respectively, and 47, 38, and 44 cells for lat‐ cells at 10, 2 and 0.4 nM, respectively.
Figure EV2. LAT‐independent CAR microcluster formation in J.LAT cells.
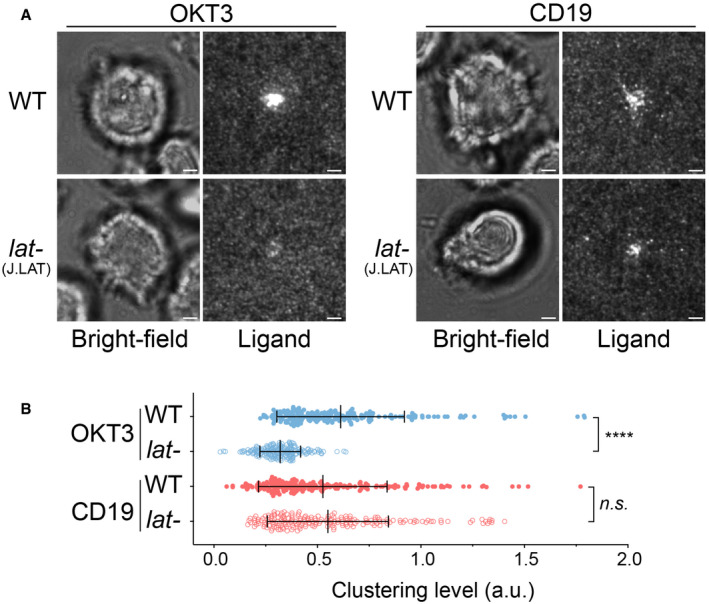
- WT or LAT‐deficient (J.LAT) Jurkat cells expressing CAR were stimulated on supported lipid bilayers coated with OKT3 (anti‐TCR antibody) or CD19 (CAR antigen) supplemented with ICAM‐1, respectively. TIRF microscopy revealed clustering of Ax647‐labeled streptavidin–biotin‐OKT3 or CD19, which serves as a probe for TCR or CAR, respectively. Scale bar, 2 μm.
- Quantification of clustering as normalized variance. n = 200 cells for each condition. Shown are the mean ± SD. Statistical test: unpaired two‐tailed t‐test. ****P < 0.0001, n.s., P = 0.4208.
LAT‐independent CAR microcluster formation could result from: 1) the co‐signaling domains (CD28 and 4‐1BB) built into the 3rd‐generation CAR; and 2) the intrinsic single‐chain architecture of CAR in which the extracellular domain is covalently linked to the intracellular signaling domain. To differentiate these two possibilities, we compared CAR microcluster formation in the wild‐type or LAT‐deficient line (Jcam2.5) expressing 1st generation CAR, which contains only TCR/CD3ζ as the cytoplasmic domain (Fig 4A). We found that, similar to the 3rd‐generation CAR, the 1st‐generation CAR robustly formed microclusters in both the wild‐type and LAT‐deficient lines (Fig 4B and C). This result suggests that neither 4‐1BB nor CD28 is required for CAR microcluster formation and that LAT‐independent cluster formation is an intrinsic property of the CAR.
Figure 4. The 1st‐generation CAR forms microclusters and immunological synapses in LAT‐deficient Jurkat T cells.
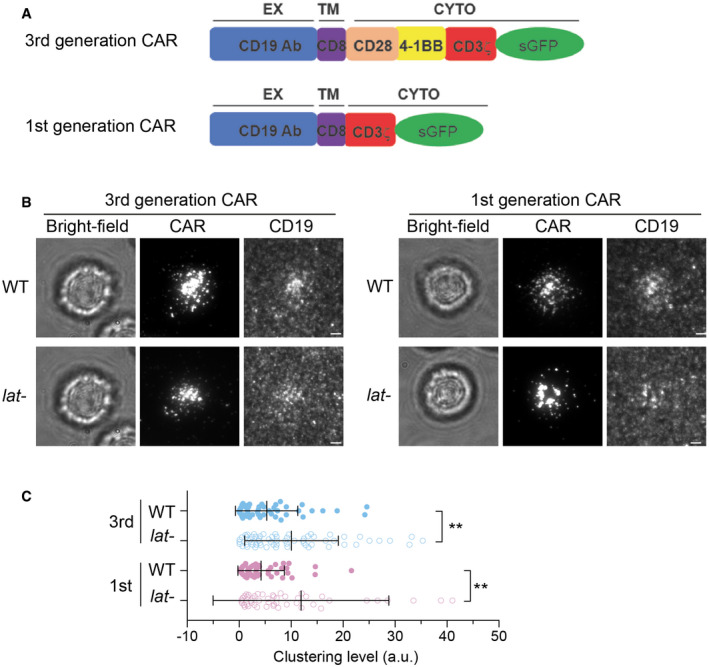
- Schematics of 3rd and 1st generation of CAR
- WT or LAT‐deficient (Jcam2.5) cells expressing the 3rd‐ or 1st‐generation CAR were stimulated on supported lipid bilayers coated with CD19 and ICAM‐1. TIRF microscopy revealed clustering of CAR and Ax647‐labeled streptavidin–biotin‐CD19. Scale bar, 2 μm.
- Quantification of clustering level of Ax647‐labeled streptavidin–biotin‐CD19. Shown are means ± SD. Clustering is quantified as normalized variance. N = 50 cells for CAR 3rd WT and 1st WT, 63 cells for CAR 3rd lat‐, and 51 cells for CAR 1st lat‐. **: 0.0005 < P < 0.005. Statistical test: unpaired two‐tailed t‐test.
CAR can bypass LAT to recruit downstream signaling proteins
Next, we investigated whether CAR microclusters can recruit downstream signaling components. The kinase ZAP70 is recruited to the plasma membrane by the immunoreceptor tyrosine‐based activation motif (ITAM) on the CD3ζ domain (Chan et al, 1992). CD3ζ‐bound ZAP70 further phosphorylates LAT (Zhang et al, 1998). We found that ZAP70 was recruited to CAR microclusters in both the wild‐type and LAT‐deficient cells (Fig EV3), which suggested that LAT is not required for ZAP70 recruitment and microcluster formation. Next, we investigated whether CAR microclusters recruit signaling components downstream of LAT. Gads is a cytosolic adaptor that is recruited to the plasma membrane by LAT after TCR activation. Gads bridges LAT to SLP76, which further connects the LAT microclusters to the actin polymerization machinery (Bunnell et al, 2002). We found that Gads was recruited to CAR microclusters in both the presence and absence of LAT (Fig 5A). The amount of Gads relative to CAR recruited to membranes in LAT‐deficient cells was comparable to that in the wild‐type cells (Fig 5A, blue columns). This result indicates that Gads can still be recruited to CAR microclusters in the absence of LAT.
Figure EV3. ZAP70 is recruited to CAR microclusters in LAT‐deficient cells.
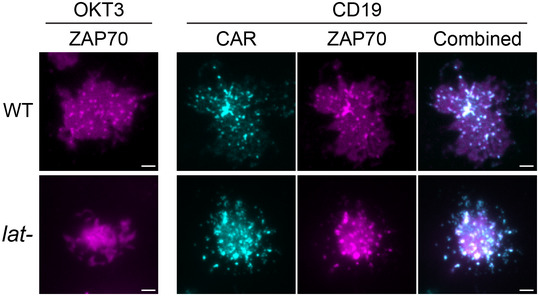
Supported lipid bilayers were coated with OKT3 (left) or CD19 (right) supplemented with ICAM‐1. Wild‐type or LAT‐deficient (Jcam2.5) T cells expressing ZAP70‐mCherry and CAR‐GFP were plated on the SLB and imaged by TIRF microscopy. Scale bar: 2 μm.
Figure 5. CAR microclusters activate Gads‐SLP76‐actin pathway in the absence of LAT .
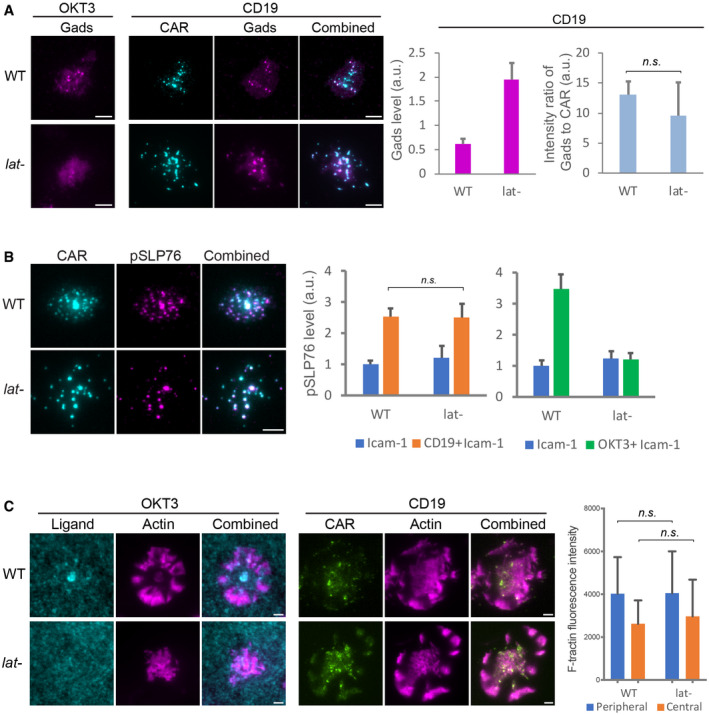
- Gads was recruited to CAR microclusters in both the wild‐type and LAT‐deficient (Jcam2.5) cells. n = 33 or 34 cells. Shown are the means ± SE. n.s., P = 0.58 by unpaired two‐tailed t‐test. As a control, Gads is not recruited to LAT‐deficient cells activated by OKT3.
- Phosphorylated SLP76, recognized by an anti‐SLP76 pY145 antibody, was enriched in CAR microclusters in both the wild‐type and LAT‐deficient cells. In contrast, phosphorylated SLP76 was not enriched in TCR microclusters in LAT‐deficient cells. n = 50 cells. Shown are the means ± SE. n.s., P = 0.95 by unpaired two‐tailed t‐test.
- Actin remodeling was induced in LAT‐deficient cells by CD19‐coated but not OKT3‐coated SLB. No ICAM‐1 was supplemented to SLB in this experiment to rule out the costimulation of actin via the LFA‐1/ICAM‐1 pathway. Actin network was revealed by F‐tractin‐mScarlet. n = 6 cells. Shown are the means ± SD. n.s., P = 0.68, and 0.98 by unpaired two‐tailed t‐test.
We then investigated whether LAT is required for the activation of SLP76. SLP76 is a constitutive binding partner for Gads (Liu et al, 1999). Activated SLP76 recruits Nck, an important regulator of actin assembly (Bubeck Wardenburg et al, 1998; Wunderlich et al, 1999), to LAT clusters on the membrane. To assess the activation level of membrane‐associated SLP76, we performed immunofluorescence using an anti‐phospho‐SLP76 antibody and visualized with TIRF microscopy. We found that pSLP76 levels at the membrane were similar between the wild‐type and LAT‐deficient cells following CD19‐dependent CAR activation (Fig 5B, left plot). In contrast, the level of pSLP76 was not increased by OKT3, the activating antibody for TCR, in LAT‐deficient cells (Fig 5B, right plot). These results suggest that LAT is required for TCR‐triggered, but not CAR‐triggered activation of SLP76. Consistent with that, CAR, but not TCR, induced the assembly of a cortical actin network in LAT‐deficient cells (Fig 5C). Furthermore, CAR microclusters underwent centripetal movements (Movie EV6) presumably driven by the retrograde flow of actin. Together, these results indicate that LAT is dispensable for inducing the Gads‐SLP76‐actin pathway in CAR T cells.
LAT is not required for B cell‐induced CAR T activation
To complement our supported lipid bilayer (SLB)‐based activation system, we determined CAR signaling using Raji B cells as an activation source. Raji B cells expressing a surface marker, mCherry‐CAAX, were incubated with CAR T cells. We found that CAR formed a cSMAC in 37 ± 2% of the synapses, and CAR formed a scattered pattern in the remaining 63% of the synapses (Fig EV4). This is similar to what has been shown above with the SLB activation system. Next, we compared the cell–cell conjugation efficiency between the wild‐type and LAT‐null (J.LAT) cells. The efficiency is slightly lower, though not significantly, in LAT‐null cells as compared to the wild‐type cells (Fig 6A). Consistently, Raji B can still induce robust IL‐2 production and CD69 expression in LAT‐null CAR cells, though to a lesser extent compared to the wild‐type CAR cells (Fig 6B and C). We confirmed that the expression level of CAR is comparable in WT versus LAT‐null cells (Appendix Fig S1). These results suggest that LAT promotes, but is not essential for, CAR T activation by B cells.
Figure EV4. Synapses between CAR T cells and Raji B cells.
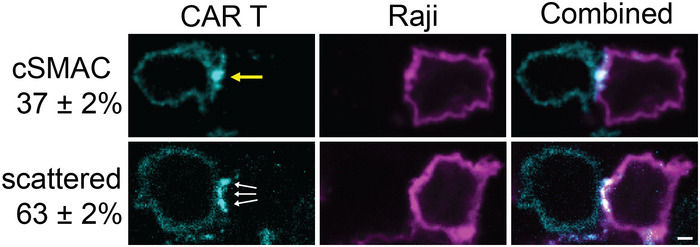
CAR‐GFP forms a cSMAC‐like (yellow arrow) or scattered pattern (white arrows) in the immunological synapse between CAR T cells and Raji B cells. mCherry‐CAAX serves as a marker for the plasma membrane of Raji B cells. T cells and B cells were mixed for 20 min before being fixed and imaged by confocal microscopy. Quantification showed the percentage of cells that display a cSMAC or scattered pattern. N = 3 independent experiments. Shown are means ± SD. Scale bar: 2 μm.
Figure 6. LAT promotes but is not required for Raji B cell‐induced CAR T activation.
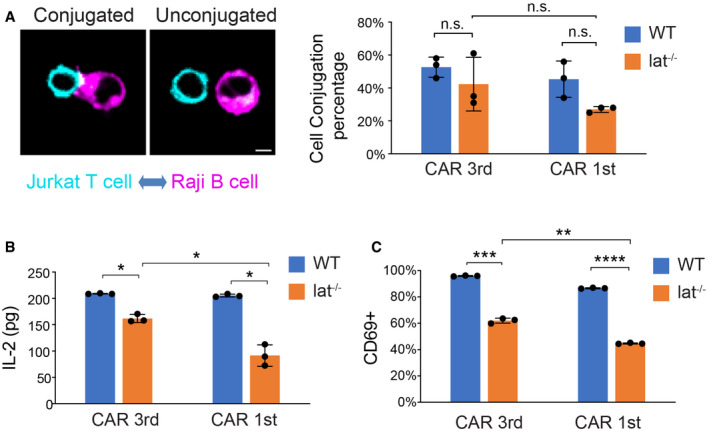
- Cell–cell conjugation assay. Wild‐type or Lat‐null (J.LAT) Jurkat T cells expressing CAR‐GFP were mixed with Raji B cells expressing mCherry‐CAAX at a 1:1 ratio for 1 h before being fixed. Three independent experiments were performed, and over 90 cells were scored in each experiment. Scale bar: 5 μm.
- CAR T cells were incubated with Raji B cells at a 1:1 ratio for 24 h, and IL‐2 from the supernatant was measured by ELISA.
- CAR T cells were incubated with Raji B cells at a 1:1 ratio and fixed at 24 h, stained with an anti‐CD69 antibody, and analyzed by FACS. CD69‐positive cells were scored within the CAR‐GFP+ population.
To determine whether the co‐signaling domains of CD28 and 4‐1BB contribute to LAT‐independent CAR signaling, we determined the cell–cell conjugation, IL‐2 production, and CD69 expression triggered by 1st‐generation CAR, which lacks the CD28 and 4‐1BB domains. We found that the cell–cell conjugation, IL‐2 production, and CD69 expression are reduced in LAT‐null cells compared to the wild‐type cells, which is similar to the results for 3rd‐generation CAR (Fig 6). When comparing the 1st and 3rd generation CAR in LAT‐null cells, we found that 1st‐generation CAR induced less activation of LAT‐null cells as compared to 3rd generation CAR, though the difference was modest. Together, these data suggest that the co‐signaling domains contribute to LAT‐independent CAR signaling. However, 1st‐generation CAR is still able to partially activate LAT‐null cells.
LAT is not required for CAR signaling in human primary T cells
Next, we sought to determine whether a LAT‐independent CAR signaling pathway exists in primary T cells. To do so, we knocked out the LAT gene in human primary T cells by CRISPR‐based genome targeting (Roth et al, 2018). LAT protein levels were reduced in the overall cell population to 12% as revealed by immunoblot analysis (Fig 7A). CAR‐GFP was then introduced into the wild‐type or LAT‐null T cells by lentiviral transduction. TIRF microscopy revealed that the TCR microclusters were formed in the wild‐type, but not LAT‐null cells, following OKT3 engagement on SLB. In contrast, CAR microclusters were formed in both the wild‐type and LAT‐null cells following CD19 engagement (Fig 7B and C). LAT‐independent CAR microcluster formation was not contingent upon the co‐signaling domain of 3rd‐generation CAR, because 1st‐generation CAR also formed microclusters in LAT‐null cells (Figs EV5A and 5B). Moreover, SLP76 was minimally phosphorylated following TCR stimulation in LAT‐null T cells as compared with the wild‐type cells, but was equally and robustly activated by CAR in the wild‐type and LAT‐null CAR T cells (Fig 7D and E). Interestingly, we also found that LAT‐null CAR T cells produced IL‐2 when stimulated by Raji B cells, though at a lower level than the wild‐type CAR T cells (Fig 7F). Together, these data suggest that LAT is not required for CAR microcluster formation and at least some downstream signaling responses in human primary T cells.
Figure 7. LAT is not required for CAR microcluster formation or SLP76 activation following CD19 stimulation in human primary T cells.
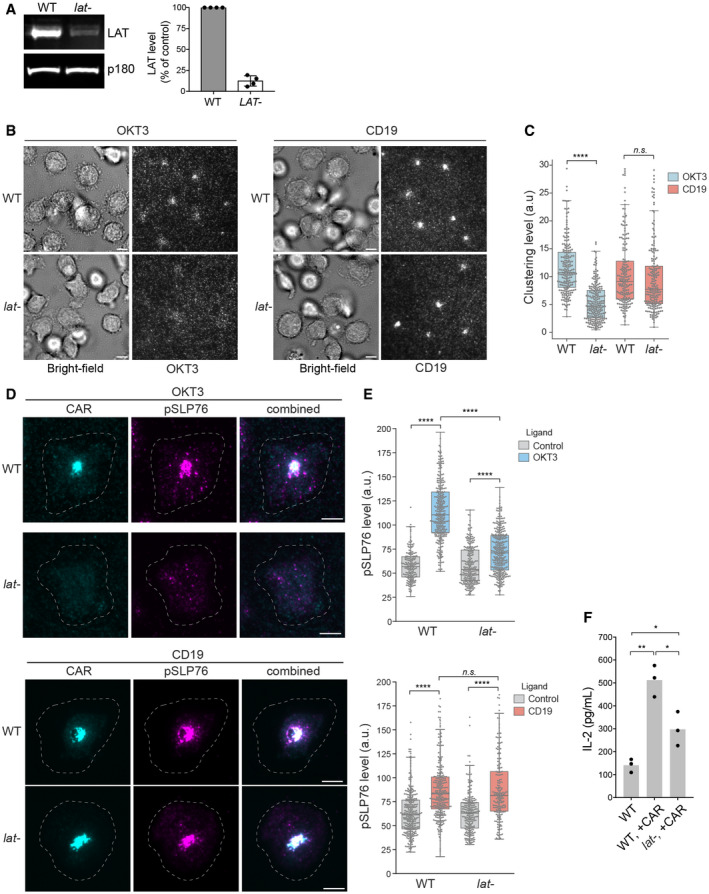
- Western blot showed that LAT is efficiently depleted in human primary T cells using CRISPR. Shown are the means ± SD. n = 4 independent experiments.
- CAR T cells were stimulated on SLBs coated with biotin‐OKT3 (left) or biotin‐CD19 (right) supplemented with ICAM‐1. TIRF microscopy revealed clustering of Alexa Fluor 647‐labeled streptavidin–biotin‐OKT3 or CD19. Scale bar, 5 μm.
- Quantification of clustering of OKT3 or CD19 as normalized variance. n > 200 cells from two independent donors were scored for each condition. Central band: mean; box: quartiles; whisker: rest of the distribution. ****P < 0.0001; n.s. P = 0.48.
- Immunofluorescence analysis revealed membrane‐localized phosphorylated SLP76. Cells were plated on supported lipid bilayer coated with ICAM‐1 only (control) or ICAM‐1 supplemented with CD19 or OKT3 as indicated. The white dashed circle indicated cell boundary. Scale bar, 5 μm.
- Quantification of pSLP76 level on the membrane. n > 200 cells were scored, and the cells were isolated from two independent donors. Central band: mean; box: quartiles; whisker: rest of the distribution. ****P < 0.0001; n.s. P = 0.11.
- T cells were incubated with Raji B cells at a 4:1 ratio, and IL‐2 production was measured by ELISA at 24 h. Data were pooled from three donors. *0.005 < P < 0.05; **0.0005 < P < 0.005. Unpaired two‐tailed t‐test was applied.
Figure EV5. 1st‐generation CAR forms microclusters and immunological synapses in LAT‐knockout primary T cells.
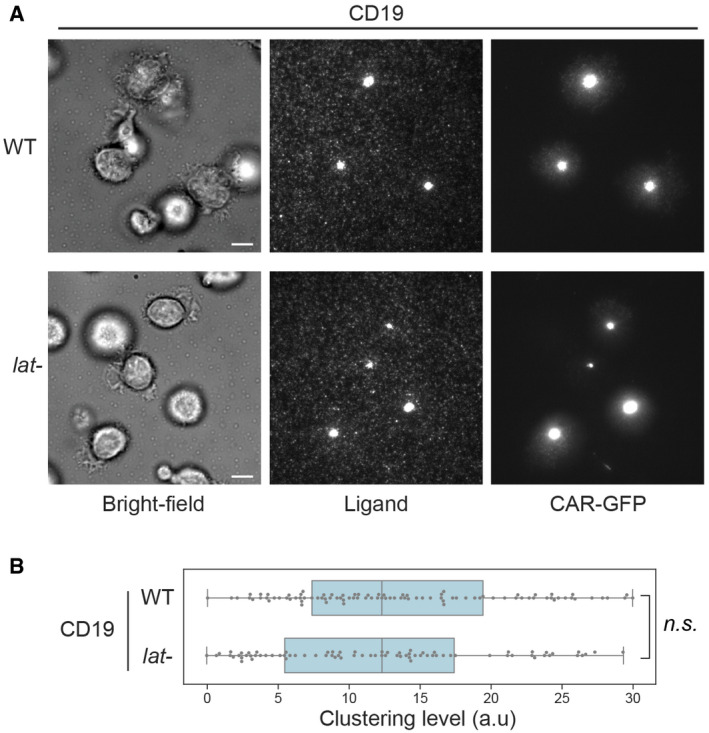
- WT or LAT‐knockout (lat‐) primary T cells expressing the 1st‐generation CAR were stimulated on SLBs coated with biotin‐CD19 and his‐ICAM‐1. TIRF microscopy revealed clustering of Ax647‐labeled streptavidin–biotin‐CD19 and CAR. Scale bar, 5 μm.
- Quantification of clustering level of Ax647‐labeled streptavidin–biotin‐CD19. Central band: mean; box: quartiles; whisker: rest of the distribution. n = 123 cells for WT, 106 cells for lat‐. Clustering is quantified as normalized variance. n.s. P = 0.67. Statistical test: unpaired two‐tailed t‐test.
Discussion
Our data reveal that CARs differ from the TCR with respect to signaling, most notably in their requirement for LAT. TCR signaling has a strong dependency on LAT. Phosphorylated LAT recruits several binding partners, including Grb2, PLCγ1, and Gads, which promote microcluster formation. Microclusters further transduce signals to downstream pathways that promote synapse formation and cytokine production (Fig 8A). In contrast, the engagement of CAR can induce microcluster formation even in the absence of LAT. Furthermore, CAR can directly recruit the LAT binding partner Gads and SLP76 to trigger signaling that leads to actin remodeling and immunological synapse formation. However, LAT is still partially required for CAR‐induced cytokine production (Fig 8B).
Figure 8. A model comparing TCR versus CAR‐induced signaling.
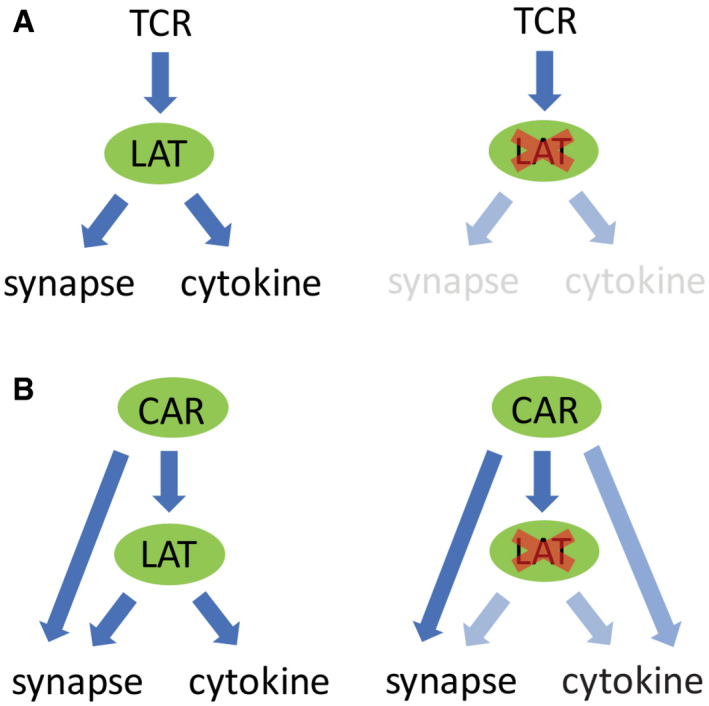
- Activated TCR triggers LAT phosphorylation, which promotes microcluster formation. Microclusters further transduce signal to downstream pathways that induce synapse formation and cytokine production. No microclusters or synapses are formed in the absence of LAT.
- In contrast, when CAR is activated, it induces microcluster formation even in the absence of LAT. CAR could directly recruit LAT binding partners to trigger downstream signaling that leads to synapse formation and partial cytokine production.
The discovery of a LAT‐independent signaling pathway may provide an explanation for the previous report showing that CAR triggers faster granule recruitment to the synapse and faster killing of target cells than the TCR (Davenport et al, 2018). CAR could potentially bypass LAT and directly recruit LAT binding partners Grb2, Gads, and PLCγ1 to transduce signaling to Ras activation, actin remodeling, and calcium influx. Although the existence of this shortcut pathway is supported by our genetic approach by deleting LAT, additional biochemical experiments are required to determine whether Grb2, Gads, and PLCγ1 associate with CAR directly or through another protein.
Although LAT is the key mediator of TCR signaling that leads to cytokine production and cytotoxicity, LAT‐independent TCR signaling has been reported to promote T cell proliferation. Notch 1 is recruited to TCR through Vav1, which induces myc expression and T cell proliferation (Guy et al, 2013). It remains an interesting question whether this Notch‐Vav pathway promotes CAR T cell proliferation as well.
The requirement for TCR microcluster formation might vary depending on stimulation conditions. Previous work reported that LAT is not required for TCR microcluster formation when T cells are activated by glass‐presented OKT3 (Barda‐Saad et al, 2005). In contrast, we found that TCR microclusters are significantly reduced in LAT‐null cells activated by SLB‐presented OKT3 (Fig 3A). This discrepancy could be due to the differences in the stimulation methods. Glass‐presented OKT3 is immobile, and the glass surface can non‐specifically stimulate T cell activation to some extent even in the absence OKT3 (Santos et al, 2018). In contrast, SLB‐presented OKT3 antibodies are mobile in the plane of the membrane, and TCR can still reorganize and translocate to form the cSMAC. It remains an interesting question how the interacting surface, mobility of TCR, and maybe associated tensile force may affect the requirements for TCR microcluster formation.
We also show that both 1st‐ and 3rd‐generation CARs can induce microcluster formation in LAT‐null cells. This result suggests the CD3ζ domain on CAR is sufficient to induce microcluster formation. Because multivalent protein–protein interactions are critical for microcluster formation (Houtman et al, 2006; Su et al, 2016), we propose that the three ITAMs on CD3ζ can recruit Gads, Grb2, and other SH2 and SH3 domain‐containing proteins and proline‐rich motif‐containing proteins to form CAR microclusters. However, if so, why does the native TCR not form clusters in a LAT‐independent manner, as it contains the same CD3ζ domain as 1st‐generation CAR? The positively charged C‐terminal tail of CD3ζ in the TCR has been proposed to interact with the negatively charged inner leaflet of the plasma membrane, potentially limiting its interactions with adaptor proteins (Shi et al, 2013). In contrast, CARs, for reasons that are not completely understood, have high tonic signaling in the absence of antigen (Ajina & Maher, 2018). The tonic signaling might increase the intracellular calcium concentration, which will partially neutralize the negative charge on the membrane and expose more ITAMs on CD3ζ for phosphorylation and interaction with adaptors. An alternative, but not mutually exclusive, mechanism could involve force‐induced conformational changes induced by extracellular ligand binding that have been proposed to regulate the intracellular receptor signaling domains (Sasmal et al, 2020). This conformation change mechanism might differ in the single‐chain CAR versus the multi‐subunit TCR. Further insight into mechanistic differences of CAR and TCR will require biophysical and biochemical investigation.
Our results revealing a rewired signaling pathway in CAR T cells suggest possibilities for designing new CARs for cancer immunotherapy. Current CAR T therapy is associated with cytokine release syndrome and forms of neurotoxicity (Lim & June, 2017; June & Sadelain, 2018). The underlying cause might involve, at least in part, abnormal and excessive signaling through CAR. Future work on CAR Ts could be aimed at protein designs that elicit a pathway that attenuates excessive signaling. We suggest this could potentially be achieved by manipulating the LAT dependence of CAR T activation.
Materials and Methods
Key resources table
| Reagent type | Designation | Source or reference | Additional information |
|---|---|---|---|
| Cell line | Jurkat T cell E6.1 | UCSF Cell Culture Facility | |
| Cell line | Jurkat T cell Jcam2.5 LAT deficient | UCSF Cell Culture Facility | |
| Cell line | Jurkat T cell J.LAT LAT null | UCSF Cell Culture Facility | |
| Cell line | Raji B cells | UCSF Cell Culture Facility | |
| Plasmid | CAR (1st)‐sfGFP | This study | Signal peptide: CD8a (GenBank AAH25715 aa 1–21), extracellular antibody: anti‐CD19 CAR (GenBank AMZ04819, aa 23–130‐linker (3xGGGGS)‐ aa 148–267), Stalk and Transmembrane: CD8a (GenBank AAH25715 aa 138–206), Cytosolic: CD3z (GenBank AAH25703 aa 52–164), linker (2xGGS), sfGFP (GenBank AVR55105) |
| Plasmid | CAR (3rd)‐sfGFP | This study | Signal peptide: CD8a (GenBank AAH25715 aa 1–21), extracellular antibody: anti‐CD19 CAR (GenBank AMZ04819, aa 23–130‐linker (3xGGGGS)‐ aa 148–267), Stalk and Transmembrane: CD8a (GenBank AAH25715 aa 138–206), Cytosolic: CD28 (GenBank AAA51944 aa 180–220) ‐4‐1BB (GenBank AAA53133 aa 214–255)‐CD3z (GenBank AAH25703 aa 52–164), linker (2xGGS), sfGFP (GenBank AVR55105) |
| Plasmid | FKBP‐Gads‐mCherry | This study | FKBP (GenBank AAP36774 aa 1‐109), linker (3xGS‐G4S2), Gads (AAH26002 aa 1‐330), linker (2xGGS), mCherry (AMO27233 aa 1–236) |
| Plasmid | ZAP70‐mCherry | This study | Human ZAP70 (GenBank AAH39039.1 aa 1–619), linker (DPPVAT), mCherry (AMO27233 aa 1‐236) |
| Plasmid | F‐Tractin‐mScarlet | This study | Rat inositol 1,4,5‐triphosphate 3‐kinase A (ITPKA) (aa 10–52), linker (SDPPVAT), mScarlet (KY021423.1 aa 1–232) |
| Protein | CD19 (Ex), biotinylated | Sino biological | A DNA sequence encoding CD19 (UniProt P15391) aa 1–291 was expressed with a C‐terminal polyhistidine tag in HEK293 cells. The purified protein was biotinylated in vitro |
| Protein | ICAM‐1(Ex)‐His | Sino biological | A DNA sequence encoding ICAM1 (NP_000192.2) aa 1–480 was fused with the a polyhistidine tag at the C‐terminus. The gene product was expressed and purified from HEK293 cells |
| Antibody | Anti‐LAT | Cell Signaling | Cat #9166s |
| Antibody | APC Anti‐CD45 | BioLegend | Cat #304012 |
| Antibody | APC Anti‐CD69 | eBioscience | Cat #17‐0699‐41 |
| Antibody | Anti‐p150 (glued) | BD Biosciences | Cat #612709 |
| Antibody | IRDye 800 CW goat anti‐rabbit | LI‐COR Biosciences | Cat #926‐32211 |
| Antibody | IRDye 800CWGoat anti‐mouse | LI‐COR Biosciences | Cat #924‐32210 |
| Antibody | Anti‐pSLP76 | Abcam | Rabbit monoclonal [EP2853Y] to SLP76 (phospho Y145). Cat #ab75829 |
| Antibody | Anti‐pY | CST | Cat #9411 |
| Antibody | Goat anti‐Rabbit A647 | Molecular Probes | Goat anti‐Rabbit IgG (H+L) Cross‐Adsorbed Secondary Antibody, Alexa Fluor 647. Cat # A‐21244 |
| Antibody | Biotin‐OKT3 | BioLegend | Biotin anti‐human CD3 Antibody, Cat # 317319 |
Cell culture
Jurkat T cell lines were grown in RPMI (Invitrogen) supplemented with 10% FBS (Invitrogen), 1% PenStrep‐Glutamine, and 10 mM HEPES pH 7.4. HEK293T cells (purchased from the ATCC collection) were grown in DMEM (Invitrogen) supplemented with 10% FBS and 1% PenStrep‐Glutamine.
Generation of stable Jurkat T cell lines
HEK293T cells were co‐transfected with the pHR transfer plasmids with second‐generation packaging plasmids pMD2.G and psPAX2 (Addgene plasmid #12259 and #12260) using Lipofectamine LTX Reagent (Thermo Fisher). 48 h after plasmid transfection, cell culture media containing virus particles were harvested, centrifuged and filtered through 0.45 μm pore size filter, and mixed with Jurkat cells for infection in RPMI media for 72 h. Jurkat cells expressing fluorescent proteins were FACS sorted to generate a stable and homogenous expression population.
Primary T cell gene editing
T cell editing was performed according to published protocols (Schumann et al, 2015; Shifrut et al, 2018). Briefly, peripheral blood mononuclear cells (PBMCs) were isolated from healthy donors (Trima Apheresis, Blood Centers of the Pacific) by Ficoll centrifugation with SepMate tubes (STEMCELL Technologies). Bulk T cells were isolated from PBMCs using Easysep Human T Cell Isolation Kit (STEMCELL Technologies) and activated with Dynabeads Human T‐Activator CD3/CD28 (Thermo Fisher Scientific) at a 1:1 (bead:cell) ratio. Cells were cultured in X‐VIVO 15 medium (Lonza Bioscience) supplemented with 10% fetal bovine serum (FBS), 50 μM 2‐mercaptoethanol (Thermo Fisher Scientific), 10 mM N‐acetyl L‐cystine (Sigma), 500 U/ml Interleukin‐2 (IL‐2, Aldesleukin Proleukin, Novartis), 5 ng/ml IL‐7, and 5 ng/ml IL‐15 (R&D Systems).
24 h after activation, 10 μl of concentrated lentivirus was added per ml of T cells. Lentivirus was produced as previously described (Roth et al, 2018). Briefly, HEK293T cells were transfected with transfer plasmid, pMD2.G and psPAX2 (Addgene) using FugeneHD transfection reagent (Promega Corporation). 24 h later, Viral Boost reagent #VB100 (Alstem) was added according to the manufacturer's protocol. Viral supernatant was collected 48 h after transfection and concentrated 100× using lentivirus precipitation solution #VC100 (Alstem).
48 h after transduction, culture was washed, Dynabeads were removed, and T cells were counted. Ribonucleoproteins (RNPs) were produced as previously described (Roth et al, 2018). Briefly, crRNA and tracrRNA (Dharmacon) were resuspended at a concentration of 160 μM in nuclease‐free duplex buffer (IDT), mixed 1:1 by volume, and incubated for 30 min at 37°C to form the gRNA. Poly‐L‐glutamic acid (PGA) sodium salt (Sigma, stock 100 mg/ml) and recombinant Cas9 (Macrolab UC, stock 40 μM) were added as previously described (0.72:1 by volume for PGA versus gRNA and 2:1 by volume for Cas9 versus gRNA) (Nguyen et al, 2019) and incubated at 37°C for 15 min to form RNP complex.
Prior to electroporation, T cells were centrifuged for 10 min at 90× g and resuspended in electroporation buffer P3 (Lonza) at a concentration of 750,000 cells/20 μl. 750,000 cells per well were mixed with 6 μl of RNP per well and electroporated in a 96‐well electroporation plate (Lonza) using electroporation code EH115 on a 4D Nucleofector system with 96‐well shuttle (Lonza). Immediately after electroporation, 80 μl of pre‐warmed media without cytokines were added per well and cells were incubated in the electroporation plate at 37°C. After 15 min, cells were moved to final culture vessels. Following electroporation, T cells were cultured in media without IL‐7 and IL‐15 (only IL‐2) and split every 2 days.
LAT gRNA sequence: TTTACCAGTTTGTATCCAAG (from Brunello sgRNA library, Doench et al, Nature Biotechnology 2016).
psPAX2 was a gift from Didier Trono (Addgene plasmid # 12260; http://n2t.net/addgene:12260; RRID:Addgene_12260). pMD2.G was a gift from Didier Trono (Addgene plasmid # 12259; http://n2t.net/addgene:12259; RRID:Addgene_12259).
Preparation of supported lipid Bilayer
All the following lipids were purchased from Avanti Polar Lipids: 16:0‐18:1 POPC 1‐palmitoyl‐2‐oleoyl‐sn‐glycero‐3‐phosphocholine (POPC; Cat #850457), 18:0 PEG5000 PE 1,2‐distearoyl‐sn‐glycero‐3‐phosphoethanolamine‐N‐[methoxy(polyethylene glycol)‐5000] (ammonium salt) (PE‐PEG5000; Cat #880220), 18:1 DGS‐NTA (Ni+2) 1,2‐dioleoyl‐sn‐glycero‐3‐[(N‐(5‐amino‐1‐carboxypentyl)iminodiacetic acid)succinyl] (nickel salt) (Ni2+‐NTA‐DOGS; Cat#790404), and 1,2‐dipalmitoyl‐sn‐glycero‐3‐phosphoethanolamine‐N‐(cap biotinyl) (sodium salt) (Biotin‐Cap‐PE; Cat #870277).
Lipid mixture was prepared with 97.5% POPC, 2.0% Ni2+‐NTA‐DOGS, 0.5% PE‐PEG5000, and < 0.1% Biotin‐Cap‐PE. Lipids were dissolved in chloroform in glass tubes and dried under a stream of nitrogen gas followed by further drying in the vacuum for 2 h. The dried lipid films were then hydrated with PBS pH 7.4 (Invitrogen). The small unilamellar vesicles (SUVs) were produced by twenty freeze–thaw cycles (between −196°C and 37°C) and collected as the supernatant after centrifuged at 53,000× g for 45 min at 4°C. SUVs were stored at 4°C and used within 2 weeks.
Glass coverslip (Ibidi Cat#10812) was RCA‐cleaned followed by extensive washing with pure water and dried with nitrogen gas. PDMS (Dow Corning) wells were made by preparing PDMS substrate mixtures according to the manufacturer's instructions and casting the PDMS mixtures into a laser‐cut acrylic mold. To build supported lipid bilayer, PDMS wells and glass coverslips were cleaned with plasma in a Harrick Plasma cleaner before assembling them into glass‐bottomed PDMS chambers. SUV suspensions were then deposited in each chamber and allow to form planar lipid bilayer for 1 h. After 1 h, wells were washed extensively with PBS and functionalized by incubation for 1 h with proteins as designated.
Assay for IL‐2 production and CD69 expression
Raji B cells were co‐cultured at a 1:1 ratio with Jurkat CAR T cells in RPMI medium supplemented with 20 mM HEPES‐Na+, pH7.4 for 24 h at 37°C. Supernatant was collected for IL‐2 measurement using an ELISA kit (BioLegend #431801). Cells were collected and stained with an anti‐CD69 antibody (eBioscience #17‐0699‐41) for FACS analysis.
Cell conjugation assay
Raji B or K562 cells expressing a membrane marker mCherry‐CAAX were co‐cultured at a 1:1 ratio with Jurkat CAR T cells in RPMI medium supplemented with 20 mM HEPES‐Na+, pH 7.4 for 1 h at 37°C. Cells were fixed in 1.6% paraformaldehyde for 15 min at RT, washed, and resuspended in RPMI medium supplemented with 20 mM HEPES and imaged by confocal microscopy.
Imaging setup
TIRF microscopy was performed on a Nikon TI‐E microscope equipped with a Nikon 100× Plan Apo 1.49 NA oil immersion objective, four laser lines (405, 488, 561, and 640 nm), a Hamamatsu Flash 4.0, and μManager software. A polarizing filter was placed in the excitation laser path to polarize the light perpendicular to the plane of incidence. The angle of illumination was controlled with either a standard Nikon TIRF motorized positioner or a mirror moved by a motorized actuator (CMA‐25CCCL; Newport). Confocal microscopy was performed on a Nikon Ti2‐E inverted motorized microscope stand, motorized stage with stagetop Piezo, CSU‐×1 spinning disk confocal, Agilent laser combiner with 4 lines 405, 488, 561 and 640 nm, sCMOS camera Photometrics Prime 95B, and NIS‐elements software. Data collection was performed at 37°C for the experiments involving live cells, and at room temperature for fixed sample or non‐cell experiments. Before imaging, cells were pelleted, washed, and resuspended in the imaging buffer containing 20 mM HEPES pH 7.4, 1 mM CaCl2, 135 mM NaCl, 0.5 mM MgCl2, 4 mM KCl, and 10 mM glucose.
Image analysis
Images were analyzed using Fiji. The same brightness and contrast were applied to images within the same panels. To quantify the clustering levels, a uniform cell‐sized circular region of interest (ROI) that is of 10 μm in diameter was manually placed over the region of cell fluorescence. The average and the standard deviation of fluorescence intensity inside the ROI were measured, respectively, and the normalized variance, i.e., the standard deviation fluorescence intensity divided by the average fluorescence intensity, was used to indicate the dispersive distribution of fluorescence intensity for each cell. To quantify pSLP76 levels by immunofluorescence or Gads recruitment, a uniform cell‐sized circular ROI that is of 10 μm in diameter was manually placed over the region of cell fluorescence, and the fluorescence intensity of the channel of interest inside that ROI was measured. To analyze cSMAC, the line scan function was used to measure the pixel intensities along the long axis of the cells crossing through the cell center. Cells with a centralized single peak in the CAR channel at least three times of the intensity of the cell background were classified as cSMAC. Cells with diffuse CAR staining were classified as spread. To minimize the interference from cell–cell heterogeneity in sizes and protein expression, the pixel intensities and distance coordinates were normalized within individual cells.
Immunoblotting
Cells were washed twice in cold PBS and lysed on ice for 15 min in lysis buffer containing 50 mM Tris, 150 mM NaCl, 0.1% (w/v) SDS, 0.5% (w/v) sodium deoxycholate, 1% (v/v) TritonX‐100, pH 7.5 supplemented with protease inhibitor cocktail (Roche) and benzonase (Novagen). Cell lysates were then centrifuged at 21,000× g for 20 min at 4°C. The supernatants were processed for SDS–PAGE and immunoblotting with standard procedure. Immunoblots were visualized using Odyssey Fc Imager (LI‐COR Biosciences) at 800 nm channel and quantified using the gel analysis function in Fiji.
Immunofluorescence
Cells were activated on supported lipid bilayers in the imaging buffer (see section “Imaging Setup” for formula) for 30 min at 37°C and fixed by adding PFA to a final concentration of 3.2% (v/v) and incubating at room temperature for 15 min. Cells were then washed twice with PBS, permeabilized with methanol at 4°C for 10 min. Then, cells were blocked with PBS containing 0.1% (v/v) Tween‐20, 1% (w/v) BSA, and 22.5 mg/ml glycine for 1 h, and incubated with the primary antibody in the same buffer overnight. The next day, cells were washed three times with PBS and incubated with buffer containing Alexa Fluor 647‐conjugated secondary antibody for 1 h. Excess antibodies were washed away before proceeding to image acquisition.
Author contributions
RD, RDV, and XS conceived the projects and wrote the manuscripts with the contribution from KAL, FB, WF, and AM, and RD, KAL, FB, and WF performed the experiments and analyzed the data.
Conflict of interest
The authors declare competing financial interests: A.M. is a cofounder of Spotlight Therapeutics and Arsenal Biosciences and serves on their boards of directors and scientific advisory boards. A.M. has served as an advisor to Juno Therapeutics, is a member of the scientific advisory board at PACT Pharma, and is an advisor to Trizell. A.M. owns stock in Arsenal Biosciences, Spotlight Therapeutics and PACT Pharma. The Marson Laboratory has received research support from Juno Therapeutics, Epinomics, Sanofi, Anthem Blue Cross Blue Shield, GlaxoSmithKline, and Gilead.
Supporting information
Appendix
Expanded View Figures PDF
Movie EV1
Movie EV2
Movie EV3
Movie EV4
Movie EV5
Movie EV6
Review Process File
Acknowledgements
We thank Dr. Arthur Weiss for providing the LAT‐deficient cell line Jcam2.5 and LAT‐knockout cell line J.LAT. R.D. was supported by a Jane Coffin Childs Postdoctoral Fellowship. K. L. was supported by a Yale College First‐Year Summer Research Fellowship in the Sciences and Engineering. F. B. was supported by the Care‐for‐Rare Foundation and the German Research Foundation (DFG). A.M. holds a Career Award for Medical Scientists from the Burroughs Wellcome Fund and the Cancer Research Institute (CRI) Lloyd J. Old STAR grant, is an investigator at the Chan Zuckerberg Biohub, and has received funding from the Innovative Genomics Institute (IGI) and the Parker Institute for Cancer Immunotherapy (PICI). R.D. is an investigator of the Howard Hughes Medical Institute. X.S. has received support from the American Cancer Society Institutional Research Grant, the Charles H. Hood Foundation Child Health Research Awards, the Andrew McDonough B+ Foundation Research Grant, the Gilead Sciences Research Scholars Program in Hematology/Oncology, and the Rally Foundation a Collaborative Pediatric Cancer Research Awards Program.
The EMBO Journal (2020) 39: e104730
Contributor Information
Ronald D Vale, Email: ron.vale@ucsf.edu.
Xiaolei Su, Email: xiaolei.su@yale.edu.
Data availability
This study includes no data deposited in external repositories.
References
- Ajina A, Maher J (2018) Strategies to address chimeric antigen receptor tonic signaling. Mol Cancer Ther 17: 1795–1815 [DOI] [PMC free article] [PubMed] [Google Scholar]
- Barda‐Saad M, Braiman A, Titerence R, Bunnell SC, Barr VA, Samelson LE (2005) Dynamic molecular interactions linking the T cell antigen receptor to the actin cytoskeleton. Nat Immunol 6: 80–89 [DOI] [PubMed] [Google Scholar]
- Bubeck Wardenburg J, Pappu R, Bu JY, Mayer B, Chernoff J, Straus D, Chan AC (1998) Regulation of PAK activation and the T cell cytoskeleton by the linker protein SLP‐76. Immunity 9: 607–616 [DOI] [PubMed] [Google Scholar]
- Bunnell SC, Kapoor V, Trible RP, Zhang W, Samelson LE (2001) Dynamic actin polymerization drives T cell receptor‐induced spreading: a role for the signal transduction adaptor LAT. Immunity 14: 315–329 [DOI] [PubMed] [Google Scholar]
- Bunnell SC, Hong DI, Kardon JR, Yamazaki T, McGlade CJ, Barr VA, Samelson LE (2002) T cell receptor ligation induces the formation of dynamically regulated signaling assemblies. J Cell Biol 158: 1263–1275 [DOI] [PMC free article] [PubMed] [Google Scholar]
- Chan AC, Iwashima M, Turck CW, Weiss A (1992) ZAP‐70: a 70 kd protein‐tyrosine kinase that associates with the TCR zeta chain. Cell 71: 649–662 [DOI] [PubMed] [Google Scholar]
- Courtney AH, Lo WL, Weiss A (2018) TCR signaling: mechanisms of initiation and propagation. Trends Biochem Sci 43: 108–123 [DOI] [PMC free article] [PubMed] [Google Scholar]
- Davenport AJ, Cross RS, Watson KA, Liao Y, Shi W, Prince HM, Beavis PA, Trapani JA, Kershaw MH, Ritchie DS et al (2018) Chimeric antigen receptor T cells form nonclassical and potent immune synapses driving rapid cytotoxicity. Proc Natl Acad Sci USA 115: E2068–E2076 [DOI] [PMC free article] [PubMed] [Google Scholar]
- Finco TS, Kadlecek T, Zhang W, Samelson LE, Weiss A (1998) LAT is required for TCR‐mediated activation of PLCgamma1 and the Ras pathway. Immunity 9: 617–626 [DOI] [PubMed] [Google Scholar]
- Freiberg BA, Kupfer H, Maslanik W, Delli J, Kappler J, Zaller DM, Kupfer A (2002) Staging and resetting T cell activation in SMACs. Nat Immunol 3: 911–917 [DOI] [PubMed] [Google Scholar]
- Ghobadi A (2018) Chimeric antigen receptor T cell therapy for non‐Hodgkin lymphoma. Curr Res Transl Med 66: 43–49 [DOI] [PMC free article] [PubMed] [Google Scholar]
- Grakoui A, Bromley SK, Sumen C, Davis MM, Shaw AS, Allen PM, Dustin ML (1999) The immunological synapse: a molecular machine controlling T cell activation. Science 285: 221–227 [DOI] [PubMed] [Google Scholar]
- Guy CS, Vignali KM, Temirov J, Bettini ML, Overacre AE, Smeltzer M, Zhang H, Huppa JB, Tsai YH, Lobry C et al (2013) Distinct TCR signaling pathways drive proliferation and cytokine production in T cells. Nat Immunol 14: 262–270 [DOI] [PMC free article] [PubMed] [Google Scholar]
- Houtman JC, Yamaguchi H, Barda‐Saad M, Braiman A, Bowden B, Appella E, Schuck P, Samelson LE (2006) Oligomerization of signaling complexes by the multipoint binding of GRB2 to both LAT and SOS1. Nat Struct Mol Biol 13: 798–805 [DOI] [PubMed] [Google Scholar]
- June CH, Sadelain M (2018) Chimeric antigen receptor therapy. N Engl J Med 379: 64–73 [DOI] [PMC free article] [PubMed] [Google Scholar]
- Lee DW, Kochenderfer JN, Stetler‐Stevenson M, Cui YK, Delbrook C, Feldman SA, Fry TJ, Orentas R, Sabatino M, Shah NN et al (2015) T cells expressing CD19 chimeric antigen receptors for acute lymphoblastic leukaemia in children and young adults: a phase 1 dose‐escalation trial. Lancet 385: 517–528 [DOI] [PMC free article] [PubMed] [Google Scholar]
- Libby KA, Su X (2020) Imaging chimeric antigen receptor (CAR) activation. Methods Mol Biol 2111: 153–160 [DOI] [PubMed] [Google Scholar]
- Lim WA, June CH (2017) The principles of engineering immune cells to treat cancer. Cell 168: 724–740 [DOI] [PMC free article] [PubMed] [Google Scholar]
- Liu SK, Fang N, Koretzky GA, McGlade CJ (1999) The hematopoietic‐specific adaptor protein gads functions in T‐cell signaling via interactions with the SLP‐76 and LAT adaptors. Curr Biol 9: 67–75 [DOI] [PubMed] [Google Scholar]
- Lo WL, Shah NH, Ahsan N, Horkova V, Stepanek O, Salomon AR, Kuriyan J, Weiss A (2018) Lck promotes Zap70‐dependent LAT phosphorylation by bridging Zap70 to LAT. Nat Immunol 19: 733–741 [DOI] [PMC free article] [PubMed] [Google Scholar]
- Nguyen DN, Roth TL, Li PJ, Chen PA, Apathy R, Mamedov MR, Vo LT, Tobin VR, Goodman D, Shifrut E et al (2019) Polymer‐stabilized Cas9 nanoparticles and modified repair templates increase genome editing efficiency. Nat Biotechnol 38: 44–49 [DOI] [PMC free article] [PubMed] [Google Scholar]
- Porter DL, Levine BL, Kalos M, Bagg A, June CH (2011) Chimeric antigen receptor‐modified T cells in chronic lymphoid leukemia. N Engl J Med 365: 725–733 [DOI] [PMC free article] [PubMed] [Google Scholar]
- Roth TL, Puig‐Saus C, Yu R, Shifrut E, Carnevale J, Li PJ, Hiatt J, Saco J, Krystofinski P, Li H et al (2018) Reprogramming human T cell function and specificity with non‐viral genome targeting. Nature 559: 405–409 [DOI] [PMC free article] [PubMed] [Google Scholar]
- Santos AM, Ponjavic A, Fritzsche M, Fernandes RA, de la Serna JB, Wilcock MJ, Schneider F, Urbancic I, McColl J, Anzilotti C et al (2018) Capturing resting T cells: the perils of PLL. Nat Immunol 19: 203–205 [DOI] [PMC free article] [PubMed] [Google Scholar]
- Sasmal DK, Feng W, Roy S, Leung P, He Y, Cai C, Cao G, Lian H, Qin J, Hui E et al (2020) TCR‐pMHC bond conformation controls TCR ligand discrimination. Cell Mol Immunol 17: 203–217 [DOI] [PMC free article] [PubMed] [Google Scholar]
- Schumann K, Lin S, Boyer E, Simeonov DR, Subramaniam M, Gate RE, Haliburton GE, Ye CJ, Bluestone JA, Doudna JA et al (2015) Generation of knock‐in primary human T cells using Cas9 ribonucleoproteins. Proc Natl Acad Sci USA 112: 10437–10442 [DOI] [PMC free article] [PubMed] [Google Scholar]
- Shi X, Bi Y, Yang W, Guo X, Jiang Y, Wan C, Li L, Bai Y, Guo J, Wang Y et al (2013) Ca2+ regulates T‐cell receptor activation by modulating the charge property of lipids. Nature 493: 111–115 [DOI] [PubMed] [Google Scholar]
- Shifrut E, Carnevale J, Tobin V, Roth TL, Woo JM, Bui CT, Li PJ, Diolaiti ME, Ashworth A, Marson A (2018) Genome‐wide CRISPR screens in primary human T cells reveal key regulators of immune function. Cell 175: 1958–1971 e1915 [DOI] [PMC free article] [PubMed] [Google Scholar]
- Su X, Ditlev JA, Hui E, Xing W, Banjade S, Okrut J, King DS, Taunton J, Rosen MK, Vale RD (2016) Phase separation of signaling molecules promotes T cell receptor signal transduction. Science 352: 595–599 [DOI] [PMC free article] [PubMed] [Google Scholar]
- Valvo S, Mayya V, Seraia E, Afrose J, Novak‐Kotzer H, Ebner D, Dustin ML (2017) Comprehensive analysis of immunological synapse phenotypes using supported lipid bilayers. Methods Mol Biol 1584: 423–441 [DOI] [PubMed] [Google Scholar]
- Varma R, Campi G, Yokosuka T, Saito T, Dustin ML (2006) T cell receptor‐proximal signals are sustained in peripheral microclusters and terminated in the central supramolecular activation cluster. Immunity 25: 117–127 [DOI] [PMC free article] [PubMed] [Google Scholar]
- Wunderlich L, Farago A, Downward J, Buday L (1999) Association of Nck with tyrosine‐phosphorylated SLP‐76 in activated T lymphocytes. Eur J Immunol 29: 1068–1075 [DOI] [PubMed] [Google Scholar]
- Xhangolli I, Dura B, Lee G, Kim D, Xiao Y, Fan R (2019) Single‐cell analysis of CAR‐T cell activation reveals a mixed TH1/TH2 response independent of differentiation. Genomics Proteomics Bioinformatics 17: 129–139 [DOI] [PMC free article] [PubMed] [Google Scholar]
- Zhang W, Trible RP, Samelson LE (1998) LAT palmitoylation: its essential role in membrane microdomain targeting and tyrosine phosphorylation during T cell activation. Immunity 9: 239–246 [DOI] [PubMed] [Google Scholar]
- Zhang W, Trible RP, Zhu M, Liu SK, McGlade CJ, Samelson LE (2000) Association of Grb2, Gads, and phospholipase C‐gamma 1 with phosphorylated LAT tyrosine residues. Effect of LAT tyrosine mutations on T cell antigen receptor‐mediated signaling. J Biol Chem 275: 23355–23361 [DOI] [PubMed] [Google Scholar]
Associated Data
This section collects any data citations, data availability statements, or supplementary materials included in this article.
Supplementary Materials
Appendix
Expanded View Figures PDF
Movie EV1
Movie EV2
Movie EV3
Movie EV4
Movie EV5
Movie EV6
Review Process File
Data Availability Statement
This study includes no data deposited in external repositories.


