Abstract
Glaucoma is a neurodegenerative disease with elevated intraocular pressure as one of the major risk factors. Glaucoma leads to irreversible loss of vision and its progression involves optic nerve head cupping, axonal degeneration, retinal ganglion cell (RGC) loss, and visual field defects. Despite its high global prevalence, glaucoma still remains a major neurodegenerative disease. Introduction of mouse models of experimental glaucoma has become integral to glaucoma research due to well-studied genetics as well as ease of manipulations. Many established inherent and inducible mouse models of glaucoma are used to study the molecular and physiological progression of the disease. One such model of spontaneous mutation is the nee model, which is caused by mutation of the Sh3pxd2b gene. In both humans and mice, mutations disrupting function of the SH3PXD2B adaptor protein cause a developmental syndrome including secondary congenital glaucoma. The purpose of this study was to characterize the early onset nee glaucoma phenotype on the C57BL/6J background and to evaluate the pattern of RGC loss and axonal degeneration in specific RGC subtypes. We found that the B6.Sh3pxd2bnee mutant animals exhibit glaucoma phenotypes of elevated intraocular pressure, RGC loss and axonal degeneration. Moreover, the non-image forming RGCs survived longer than the On-Off direction selective RGCs (DSGC), and the axonal death in these RGCs was independent of their respective RGC subtype. In conclusion, through this study we characterized an experimental model of early onset glaucoma on a C57BL/6J background exhibiting key glaucoma phenotypes. In addition, we describe that RGC death has subtype-specific sensitivities and follows a specific pattern of cell death under glaucomatous conditions.
Keywords: Glaucoma, intraocular pressure, RGC subtype, optic nerve
1. Introduction
Glaucoma is a group of optic neuropathies with multifactorial etiologies(Mantravadi and Vadhar, 2015; Weinreb et al., 2014). It is the leading cause of irreversible vision loss and blindness worldwide with an estimate of about 80 million people with some form of glaucoma by the year 2020(Flaxman et al., 2017). Glaucoma progression includes RGC loss, cupping at the optic nerve head, optic nerve degeneration, and visual field defects that may eventually lead to blindness(Davis et al., 2016; Weinreb et al., 2014). Some of the risk factors associated with glaucoma include, but are not limited to, age, elevated intraocular pressure (IOP), ethnicity, decreased corneal thickness, hyperopia/myopia, prolonged corticosteroid use, conditions related to blood flow, genetic predisposition, and some ocular injuries(Boland, 2007; Mwanza et al., 2018). Due to the complex nature of the disease, its progression and underlying molecular pathways are not completely understood. Hence, there is no known cure for glaucoma to date. In order to find a cure and for better management of the disease, it is important to dissect out the pathophysiological mechanisms and identify potential treatment targets. Elevated IOP, being one of the more prevalent and only modifiable risk factors, is targeted using IOP lowering drugs with some success in slowing the progression of the disease(Clark and Pang, 2002; Cohen and Pasquale, 2014). Many animal models with features of glaucoma have been described(Shah et al., 2019), especially models with elevated IOP. Among animal models, mouse models are used extensively due to their ease of availability, breeding, and genetic manipulations as well as the high degree of conservation between mouse and human genomes(Fernandes et al., 2015). These mouse models can be spontaneous or induced, with mutant MYOC models(McDowell et al., 2012; Patel et al., 2017; Senatorov et al., 2006; Zhou et al., 2008; Zode et al., 2011), mutant nee(Mao et al., 2011), TBK1 over-expressing(Fingert et al., 2017), ANGPT1/TIE2 model(Thomson et al., 2014), and glucocorticoid induced models(Jones 3rd and Rhee, 2006; Patel et al., 2017; Zode et al., 2014), of particular note for the direct similarity of the exciting insults in both mice and humans. Of particular relevance to the current study, the glaucoma-causing nee mutation was discovered as a spontaneous mutation in B10.A-H2h4/(4R)SgDvEgJ mice, caused by a 1-bp deletion in the last exon of the Sh3pxd2b gene (hereby referred to as nee mutation) (Mao et al., 2011, 2009). SH3PXD2B is an adaptor protein and is believed to be important for the function of podosomes—finger-like cellular extensions that have the ability to bind and degrade the extracellular matrix(Paterson and Courtneidge, 2018). Podosomes have previously been observed in cells of the adult trabecular meshwork(Aga et al., 2008) and are also believed to be required for proper migration of many cell types, including neural crest lineages(Murphy et al., 2011). Therefore, podosomes may play an important role in regulating multiple aspects of the anatomy and physiology of aqueous humor outflow. Phenotypes of nee mice closely mimic features of Frank-ter Haar syndrome, an autosomal recessive human condition caused by SH3PXD2B mutations and involving secondary congenital glaucoma(Iqbal et al., 2010). It has been previously reported that by 1 month of age, B10-Sh3pxd2bnee mice have glaucoma phenotypes secondary to anterior segment dysgenesis including elevated IOP and early degeneration of the optic nerve (Mao et al., 2011).
Using this model, the objective of our study was twofold; firstly, we wanted to determine whether the glaucomatous phenotype evident in the B10.A-H2h4/(4R)SgDvEgJ mouse background due to Sh3pxd2bnee gene mutation is also present after backcrossing the animals to a C57BL/6J background. After this we wanted to evaluate the effect of early onset glaucoma due to this mutation on retinal ganglion cell subtypes. There are a least 40 different mouse RGC subtypes based on expression profiles(Langer et al., 2018; Rheaume et al., 2018). We previously used the acute optic nerve crush model to show that RGC subtypes are differentially susceptible to glaucomatous injury and axons degenerate irrespective of their retinal soma(Daniel et al., 2018). We utilized transgenic mouse strains, each labeling unique subtypes of RGCs, and all on a matched B6 genetic background. Of the 4 subtypes of RCGs that we studied, we found that the transient-Off α RGCs are the most susceptible to injury followed by On-Off direction selective RGCs (DSGC), whereas the non-image forming RGCs are more resilient.
In our current study, we evaluated differences in intraocular pressure and retinal histology between mutant (MUT) mice (homozygous for mutant allele) and their age matched wild type (WT) littermates (homozygous for wild type allele) at post-natal days 15, 30, 60, 75, and 90. We also determined the pattern of RGC loss and axonal degeneration in the On-Off-direction selective RGC subtype, which responds to posteriorly moving stimuli with central projection to the superior colliculus, dorsal and ventral lateral geniculate nucleus as well as to the zona incerta(Rivlin-Etzion et al., 2011), and Cadherin 3 expressing RGC subtype with central projections to non-image forming centers(Osterhout et al., 2011). We also used melanopsin antibody to label intrinsically photosensitive RGC or ipRGCs (non-image forming central projections)(Hattar et al., 2002).
Our aim was to further evaluate this model as a potential glaucomatous model of ocular hypertension and to compare the response of RGC subtype under induced and inherent glaucomatous conditions, thus providing another in vivo tool to study and better understand the disease which will help in the development of more effective treatment and management strategies.
2. Materials and Methods
2.1. Animals
Breeding pairs of the following mouse strains were obtained from Mutant Mouse Regional Resource Centers: B6;FVB-Tg(Trhr-EGFP)HU193Gsat/Mmucd (RRID:MMRRC_030036-UCD) hereafter referred to as TRHR-GFP, and Tg(Cdh3-EGFP)BK102Gsat/Mmnc (RRID:MMRRC_000236-UNC) hereafter referred to as CDH3-GFP. B10.A-H2h4/(4R)SgDvEgJ animals having Sh3pxd2bnee mutation (B10-Sh3pxd2bnee) were originally obtained from The Jackson Laboratory and subsequently backcrossed for 10 generations to the C57BL/6J (B6) background at the University of Iowa (hereafter referred to as B6.Sh3pxd2bnee). Mice were transferred to the University of North Texas Health Science Center via a rederivation of cryopreserved sperm and the strain was thereafter maintained by heterozygote X heterozygote intercrosses yielding animals homozygous for mutant allele (MUT) and those homozygous for wild type alleles (WT). Heterozygote X heterozygote breeding strategy required many breeding pairs to generate sufficient numbers of homozygotes. It is our experience homozygotes rarely survived to weaning in the first litters, while other genotypes of the same litters did. This is not a problem in subsequent litters. We also delayed weaning of nee homozygotes if they were deemed too small to be able to reach the water supply. Because the homozygotes are infertile, particularly small nee homozygotes were kept with mothers for an extended period (approximately 6 weeks). Past this age, we supplemented particularly small nee mice with Napa Nectar (SE Lab Group Inc., Napa, CA). Generation of the congenic strain and characterization of non-ocular features for B10-Sh3pxd2bnee and B6.Sh3pxd2bnee mice were performed at the University of Iowa; all ocular characterizations described herein were performed using B6.Sh3pxd2bnee mice at the University of North Texas Health Science Center. TRHR-GFP and CDH3-GFP mice were backcrossed to the C57BL/6J background for more than 10 generations at UNTHSC. C57BL/6J animals were also used to study ipRGCs. Further, B6.Sh3pxd2bnee animals were crossed with each of the transgenic GFP animal strains to obtain B6.Sh3pxd2bnee mutant animals expressing GFP in each of the above mentioned RGC subtype. Because the mutant B6.Sh3pxd2bnee animals are infertile, animals heterozygous for Sh3pxd2bnee were used for breeding purposes. All mice were maintained in 12:12 light/dark cycle and supplied with food and water ad libitum. All mice used in these experiments were between 15–90 days of age and “n” = the number of eyes used for each study. Both male and female mice were used for these studies. All experiments were conducted in accordance with the ARVO Statement of the Use of Animals in Ophthalmic and Vision Research and approved by the Institutional Animal Care and Use Committee of the University of Iowa or the University of North Texas Health Science Center.
2.2. Non-ocular histology screening
Mice were provided to the Comparative Pathology Laboratory of the University of Iowa for standard histologic analyses provided on a fee for service basis. Tissues were collected at the time of euthanasia and immediately placed in 10% neutral buffered formalin for a minimum of 48 hours. Tissues were then paraffin-embedded, sectioned (4 μm), and stained with H&E following standard procedures. Histopathological analysis was performed by a veterinary pathologist, Dr. A.K. Olivier, DVM, PhD, DACVP.
2.3. Slit-lamp examination
Anterior segment phenotypes were assessed with a slit-lamp (SL-D7; Topcon, Tokyo, Japan) and photo documented with a digital camera (D100; Nikon, Tokyo, Japan). Images were taken with identical camera settings and prepared with identical image software processing.
2.4. Intraocular pressure measurement
Briefly, Mice were gently restrained by first being placed in a soft, clear plastic cone (Decapicone; Braintree Scientific, Inc., Braintree, MA), then secured in a custom-made restrainer. The restrained animal was then placed on a platform of adjustable height. After the mice were acclimated, IOP measurements were performed using the rebound tonometer (Colonial Medical Supply, Franconia, NH). All IOP measurements were performed during the light-on phase. IOP was measured for mutants as well as their age matched wildtype littermates at approximately the same time of day.
2.5. Tissue Harvest (Optic Nerve and Retina)
Mutant and wildtype mice were sacrificed at 15, 30, 60, 75, 90 days post-natal by deeply anesthetizing them with a mixture of Ketamine/Xylazine/Acepromazine (100/10/3 mg/kg) (ip). The animals were then transcardially perfused with phosphate buffer saline (PBS) (pH 7.4) followed by 4% paraformaldehyde (PFA) in PBS. Eyes along with the optic nerves were dissected and post fixed for 2 h in 4% PFA at room temperature, then rinsed in PBS. Following fixation, retinas and optic nerves from fixed eyes were carefully dissected and processed for further analyses.
2.6. Histology
Eyes were washed three times with PBS, dehydrated with ethanol, and embedded in paraffin. Samples were sectioned (5 μm thick) and stained with hematoxylin and eosin for general evaluation of the anterior segment, including structural organization of trabecular meshwork, as well as retinal morphology.
2.7. Retinal Flat mount
Dissected retinas were pre-treated in 0.3% TritonX-100 in PBS for 30 minutes (x4) and then blocked in 0.3 % Triton X-100 in PBS containing 10% goat serum for 2 hours. Subtype specific RGCs were labeled using anti-GFP (1:1000; #A6455, Molecular Probes, Eugene, OR, USA) or anti-Melanopsin (1:1000; #ABN38, ATSbios, San Diego, CA, USA) antibodies, and total RGCs were labeled using anti-NeuN (1:1000; Chemicon) antibody overnight at 4°C. Following washes in PBS, the retinas were incubated with AlexaFluor488 goat-anti-rabbit (1:1000, diluted in PBST) and AlexaFluor594 goat-anti-mouse (1:1000, diluted in PBST) overnight at 4 °C and mounted with Vectashield Mounting Medium containing DAPI (Vector Laboratories). Eight (40x zoom 0.7, 0.09 mm2) images were taken from peripheral (1400 μm from the optic nerve head) and central (700 μm from the optic nerve head) regions of the four quadrants of each retina using LSM 510 Zeiss confocal microscope. Cells were counted using imageJ (FIJI) Cell Counter Plugin as previously described (Daniel, Clark et al. 2018). For each individual retina, the RGC count was obtained by averaging the eight quadrant counts for each retina.
2.8.1. Optical clearing of optic nerve
Optic nerves were cleared using the passive clarity technique(Tomer et al., 2014). The nerves were rinsed 3x with PBS for 10 mins. PBS was replaced by 4% hydrogel solution (0.0025 g/ml of VA-044 activator in 4% acrylamide solution). The sample vial was over filled and capped to avoid any air bubbles. The nerves were then incubated at 4 °C for 6–8 hours followed by 1-hour incubation at room temperature. The hydrogel solution was removed, and the nerves were rinsed in 10X PBS followed by three 5-minute washes in 1X PBS. Sodium dodecyl sulphate (SDS) solution 8%, with 0.5% 2-mercaptoethanol was added and the nerves were incubated at 37°C with gentle agitation. The nerves clear within 1–2 days. They were then washed four times in 0.1% sodium azide in 0.1% Tween 20/1X PBS over a span of 24 hours.
2.8.2. C-PRESTO (Centrifugation-pressure related efficient and stable transfer of macromolecules into organs) to immunolabel nerves(Lee and Sun, 2016)
The nerves were transferred into 1.5-mL centrifuge tubes containing 500 μL each of the primary antibodies in antibody dilution solution (3% goat serum/0/1% Triton X-100/1XPBS): anti-GFP (1:1000; #A6455, Molecular Probes, Eugene, OR, USA) or anti-Melanopsin (1:250; #ABN38, ATSbios, San Diego, CA, USA), and anti-Neurofilament (1:200; #M0762, DAKO, Santa Clara, CA, USA). The tubes were then centrifuged at 600 × g for 2 hours followed by a wash with 0.1x PBS by centrifugation at 600 × g for 30 minutes. AlexaFluor488 goat-anti-rabbit (1:1000, diluted in antibody dilution solution) and AlexaFluor594 goat-anti-mouse (1:1000, diluted in antibody dilution solution) were added and the tubes were centrifuged at 600 × g for 2 h. The labeled samples were washed with 0.1x PBS by centrifugation at 600 × g for 30 min. PBS was replaced with RIMS (RIMS is 40g of histodenz in 30ml of PB at a pH of 7.5) solution just enough to cover the tissue for overnight. The nerves were then mounted on a slide in RIMS solution with a coverslip. The nerves were imaged using Z-stacks and Tile function with maximum intensity (LSM 510 Zeiss confocal microscope). Optic nerve 3D projections were created using the ZEN software. ImageJ software was used to analyze consistent ROI (regions of interest) for each sample. Mean fluorescent intensity was recorded using the analysis and measure tool.
3. Results
3.1. B6.Sh3pxd2bnee mutation leads to early onset glaucoma phenotype in C57BL/6J animals
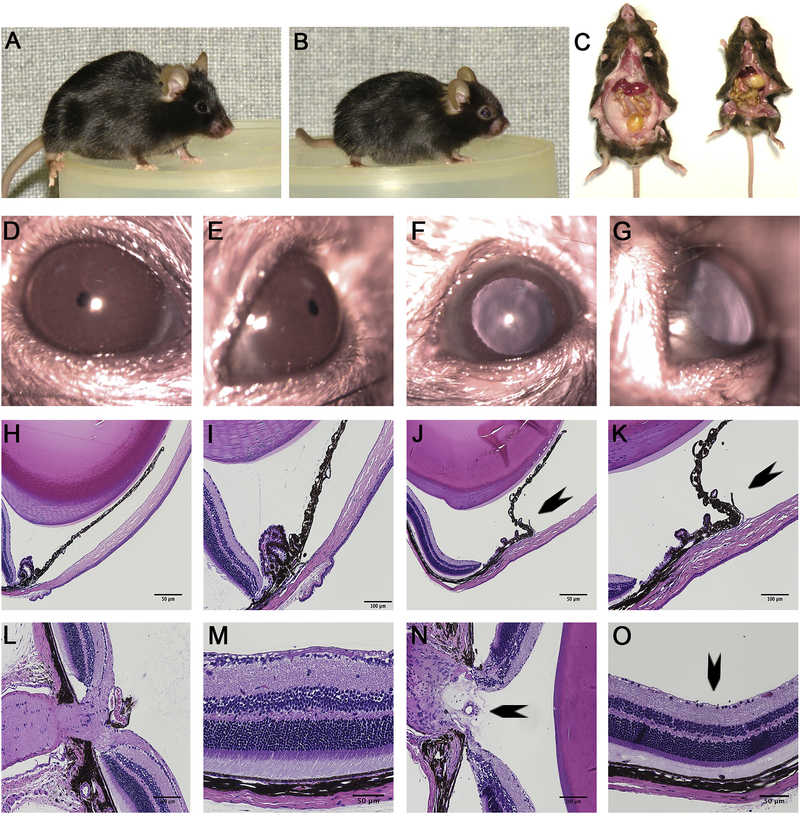
Because the nee mutation originally arose on a seldom used B10 genetic background, a N10 congenic strain on the more widely used C57BL/6J background was generated. This change in genetic background had no detectable influence on previously described overt phenotypes of nee homozygotes(Mao et al., 2011, 2009), which continued to recapitulate overt features of the Frank-ter Haar syndrome, such as small body size, craniofacial abnormalities, buphthalmic eyes, and severe depletion of white adipose tissue (Fig. 1 A–G).
Figure 1.
Phenotypic analysis of B6.Sh3pxd2bnee mice. (A) Gross appearance of WT mice. (B) Gross appearance of MUT mice. (C) Dissection showing absence of white adipose tissue in MUT (right) compared to WT (left). (D-E) slit lamp images of WT animal showing normal anterior chamber. (F-G) Slit lamp images of MUT animals showing synechia. (H-I, L-M) H&E images of cross-section of WT mice showing normal iridocorneal angle, healthy optic nerve head, and RGCs. (J-K, N-O) H&E images of cross-section of MUT eyes showing iridocorneal adhesion (J-K) (arrow), optic nerve cupping (arrow) (N) and RGC loss (arrow) (O). Scale bar = 50 μm or 100 μm as indicated (H-O).
A histologic screen of multiple tissues was performed by the Comparative Pathology Laboratory at the University of Iowa, comparing non-ocular phenotypes of 6–8-week-old littermates (homozygous Sh3pxd2bnee/nee, heterozygous Sh3pxd2bnee/+, homozygous Sh3pxd2b+/+) from both the B10 and B6 backgrounds (n=2 mice per genotype, one of each sex). The main additional finding of this histologic screen was that Sh3pxd2bnee homozygotes of both backgrounds were also shown to uniformly exhibit inflammation of the middle ear (Supplemental Figure 1), which is a previously known feature of nee mutant mice(Mao et al., 2009; Yang et al., 2011). There were sporadic observations of potential anomalies in other tissues, but they were uncommon and not consistent to any genotype or background. In sum, most organ systems appeared by gross histology to be unaffected by the Sh3pxd2bnee mutation, and again, the Sh3pxd2bnee mutation had very similar effects on both the B10 and B6 genetic backgrounds (Supplemental Figures 2–4).
IOP measurements and histological analysis was also performed on the B6.Sh3pxd2bnee animals. A TonoLab rebound tonometer was used to measure IOP, slit lamp was used to assess anterior segment changes, and Hematoxylin and Eosin (H&E) staining was used to assess anterior chamber and retinal morphologies in MUT animals compared to their WT littermates. RGC loss was assessed in immunostained flat-mounts. After measuring IOP (except at day 15 as the mice were too young for this assessment) on these animals, the same animals were harvested at 30, 60, 75, and 90 days post-natal (n = number of eyes throughout the study) for immunostaining.
Slit lamp images of MUT animals show the eyes to be buphthalmic with evidence of iridocorneal adhesion (synechia) (Fig. 1 F–G). H&E staining of the MUT eyes at 3 months of age reveal iridocorneal adhesion, optic nerve head excavation, and RGC loss (Fig. 1 J–K, N–O). Slit lamp and H&E evaluation of WT eyes at 3 months of age revealed no such deformities (Fig. 1 D–E, H–I, L–M). H&E staining of MUT eyes at post-natal day 15 show the overall retina is largely normal, including inner and out layer thickness and RGC density compared to WT eyes (Supplemental Figure 1).
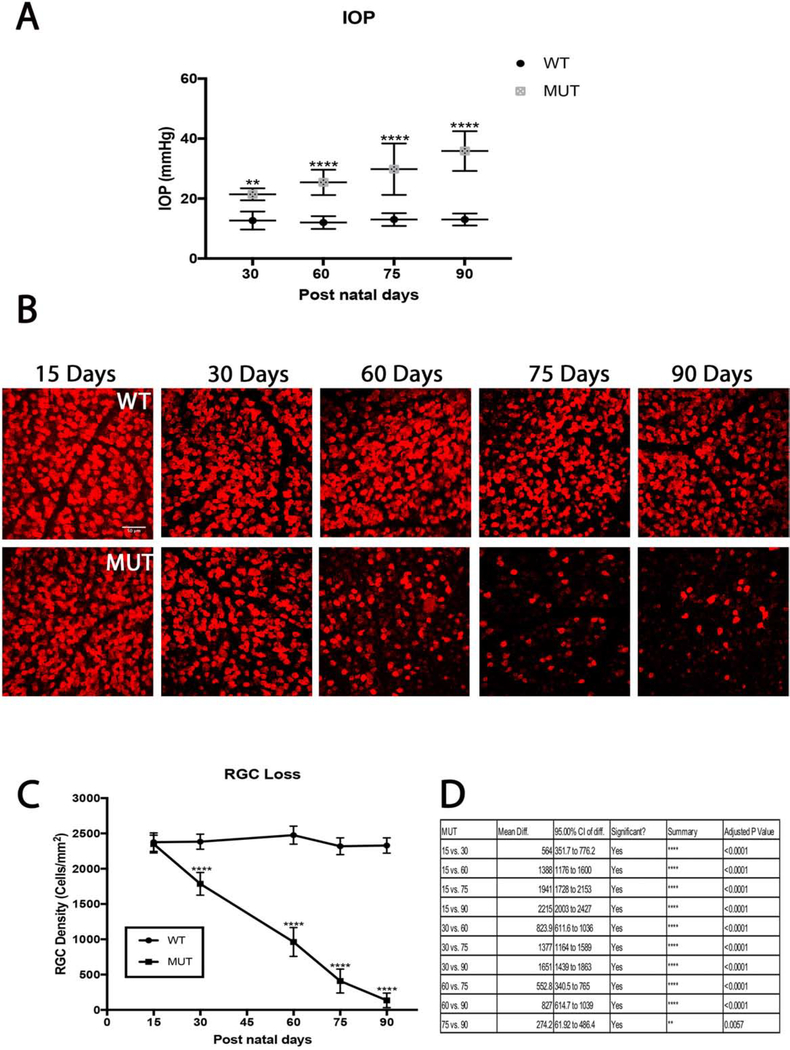
IOP measurements in MUT mice averaged 21±2 mmHg at day 30, 25± 4 mmHg at day 60, 30±9 mmHg at day 75 and 36±7 mmHg at day 90. IOP measurements in WT animals averaged 13±3 mmHg at day 30, 12± 2 mmHg at day 60, 13 ±2 mmHg at day 75, and 13±2 mmHg at day 90. Significant IOP elevation was observed in MUT mice throughout the time course (day 30, p=0.001, n=8; day 60, p< 0.0001, n=8; day 75, p< 0.0001, n=8; day 90, p< 0.0001, n=8) when compared to their WT littermates (Fig. 2A).
Figure 2.
Intraocular pressure and its effect on RGC densities in B6.Sh3pxd2bnee mice. (A) Significant IOP elevation is seen in MUT animals compared to their WT littermates at post-natal days 15, 30, 60, 75, and 90. The values are presented as mean ± SD (n=8). **: p=0.001, ****: p<0.0001 by Two Way-ANOVA then Sidak’s post hoc test. (B) Representative images showing NeuN (red) immunolabeled retinal flat-mounts from MUT mice and their WT littermates. Scale bar = 50 μm. (C) There was a steady decline in cell density throughout the time course in MUT animals compared to their WT littermates. The values are presented as mean ± SD (n=8). ****: p<0.0001 by Two Way-ANOVA then Sidak’s post hoc test. (D) Comparison chart of differences in RGC density between MUT animals between time points. The values are presented as mean ± SD (n=8). Two Way-ANOVA then Tukey’s post hoc test.
Retinal flatmount staining of RGCs with NeuN show progressive RGC loss in MUT animals throughout the 90-day time course (Fig. 2B). Immunostaining at day 15 shows a cell density of 2349±126 cell/mm2, which reduced to 1785±161cells/mm2 by day 30, 961±204 cells/mm2 by day 60, 408±169 cells/mm2 by day 75, and 134±103 cells/mm2 by day 90 (Fig. 2C–D). However, the total RGC cell count did not vary significantly among the WT animals at any time point. Significant RGC death occurred in MUT animals compared to their WT littermates at every post-natal time point except at day 15 308(day 30, p<0.0001, n=6; day 60, p< 0.0001, n=6; day 75, p< 0.0001, n=6; day 90, p<0.0001, n=6) (Fig 2C).
3.2. RGC subtypes follow different time courses of cell death in B6.Sh3pxd2bnee model of glaucoma
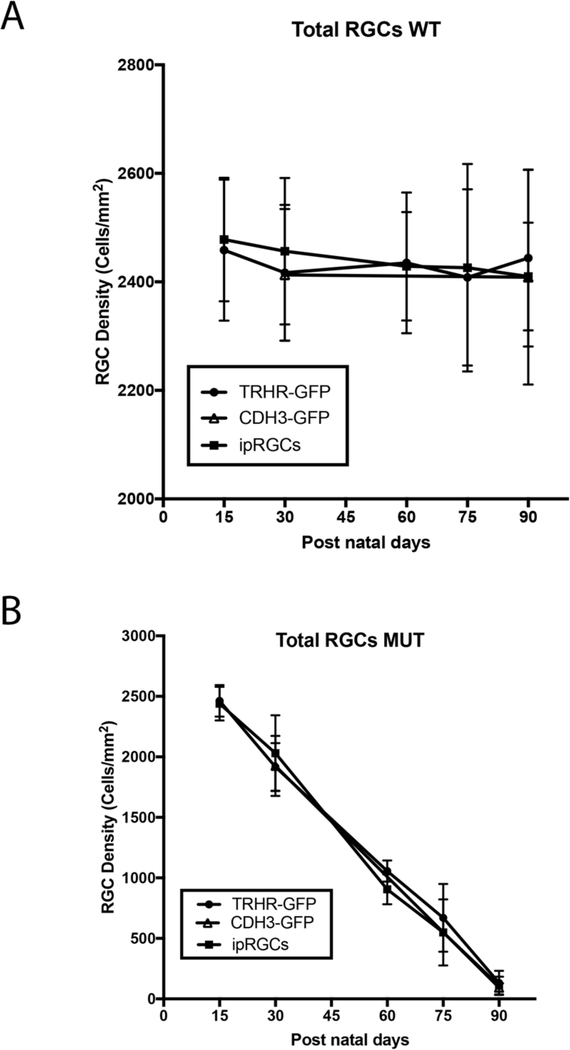
We utilized the B6.Sh3pxd2bnee model to assess degeneration in two transgenic mouse strains, also on the B6 genetic background, expressing GFP in two different subtypes of RGCs. We also used immunostaining to assess ipRGC loss after this insult. We immunostained retinal flat-mounts of MUT animals at post-natal days 15, 30, 60, 75 and 90 to assess total as well as strain specific RGC death and compared them to their WT littermates. There is no difference in the total or RGC subtype densities in WT animals at any time point (Fig. 3A). Although we see progressive cell loss through the 90-day time course in MUT animals, there are no significant differences in cell density for total RGCs between the RGC subtype labeled strains at any given time point (Fig. 3B).
Figure 3.
Comparison of total RGC loss in MUT and WT mice between strains. (A) RGC density between each strain within each time point show no significant differences in WT animals. The values are represented as mean ± SD (n=4–6). Two Way-ANOVA then Sidak’s post hoc test for time points 15, 60 and 75. Two Way-ANOVA then Tukey’s post hoc test for time points 30 and 90. (B) Total RGC density between each strain within each time point show no significant differences among MUT animals. The values are represented as mean ±SD (n=4–6). Two Way-ANOVA then Sidak’s post hoc test for time points 15, 60 and 75. Two Way-ANOVA then Tukey’s post hoc test for time points 30 and 90.
However, we do see significant differences in the pattern of cell death in each of the specific subtypes of RGCs in the B6.Sh3pxd2bnee model of glaucoma (Figs. 4–8).
Figure 4.
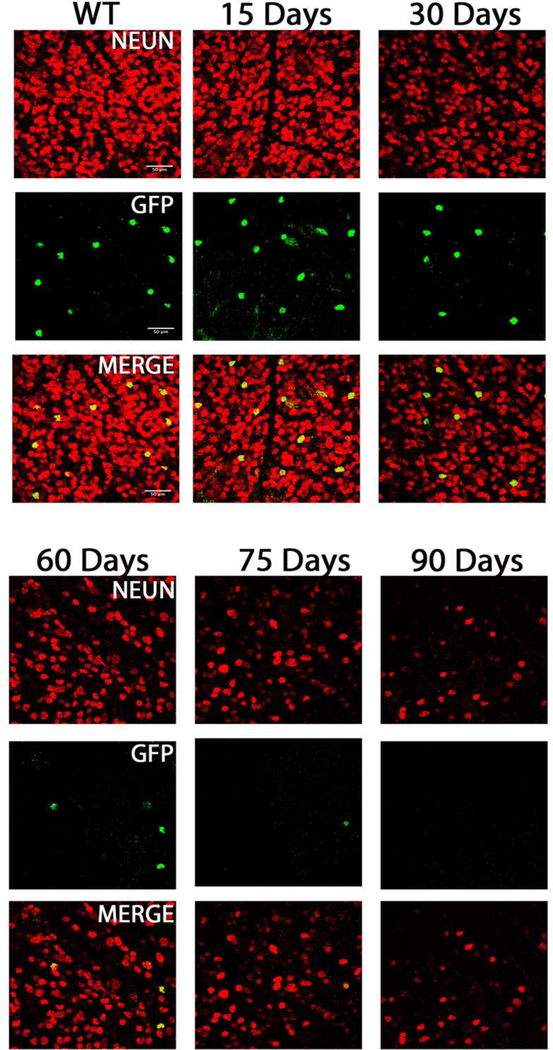
TRHR-GFP subtype cell death inB6.Sh3pxd2bnee mice: Representative images showing NeuN (red) and GFP (green) immunolabeled retinal flat-mounts. Images of 15-day WT and 15, 30, 60,75 and 90-day MUT are shown. Scale bar = 50μm.
Figure 8.
CDH3-GFP subtype cell death in MUT and WT B6.Sh3pxd2bnee mice: (A) Representative images showing NeuN (red) and GFP (green) immunolabeled retinal flat-mounts. Images of 30-day WT and 30 and 90-day MUT are shown. Scale bar = 50μm. (B) There was significant decline in cell density in MUT animals at post-natal days 30 and 90. The values are represented as mean ±SD (n=4–6). **: p=0.001, ****:p<0.0001 by Two Way-ANOVA then Sidak’s post hoc test. (C) RGC density between the two time points show differences in MUT animals. The values are represented as mean ±SD (n=4). Two Way-ANOVA then Sidak’s post hoc test.
3.2.1. Direction selective ganglion cells show progressive decline in cell density
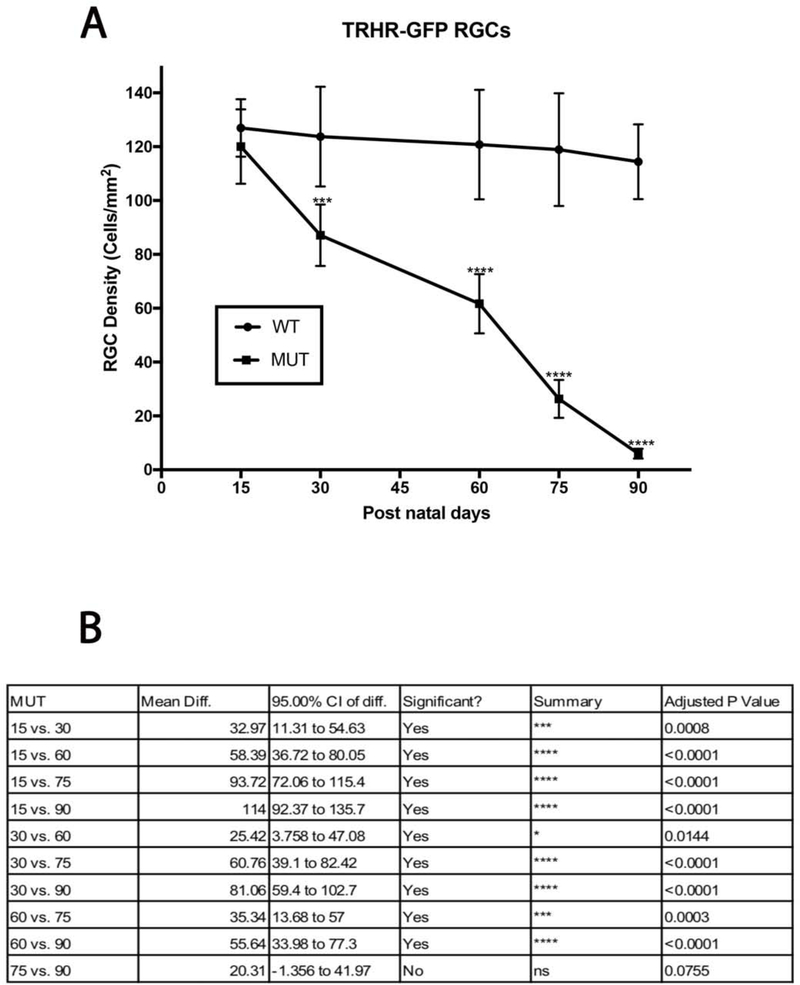
TRHR-RGCs are On-Off type RGCs excited by posterior motion that project to the dorsal and ventral lateral geniculate nucleus, the superior colliculus, and the zona incerta. Figure 4 shows representative images of total RGCs labeled with NeuN and TRHR-RGCs labeled with GFP at each experimental time point. Immunolabeling shows progressive loss of cells in mutant animals throughout the time course (Fig. 5A). Cell densities of TRHR-RGCs in MUT animals do not vary significantly from their WT counterparts at post-natal day 15. We see progressive loss of TRHR-RGCs in MUT animals with cell densities of 87±11 cells/mm2 at day 30 (p=0.0002, n=6), 61±11 cells/mm2 at day 60 (p< 0.0001, n=6), 26±7 cells/mm2 at day 75 (p< 0.0001, n=6), and 6±1 cells/mm2 at day 90 (p< 0.0001, n=6) compared to WT (Fig. 5B).
Figure 5:
TRHR-RGC loss in MUT and WT mice: (A) There was significant decline in TRHR-RGC density in MUT animals at post-natal days 30, 60, 75 and 90. The values are represented as mean ±SD (n=6). ***: p=0.0002, ****: p<0.0001 by Two Way-ANOVA then Sidak’s post hoc test. (B) TRHR-RGC density between each time point show varying degrees of differences in MUT animals. The values are represented as mean ±SD (n=6). Two Way-ANOVA then Tukey’s post hoc test.
3.2.2. Melanopsin positive RGCs survive post 90 days of elevated IOP insult in B6.Sh3pxd2bnee mutant animals
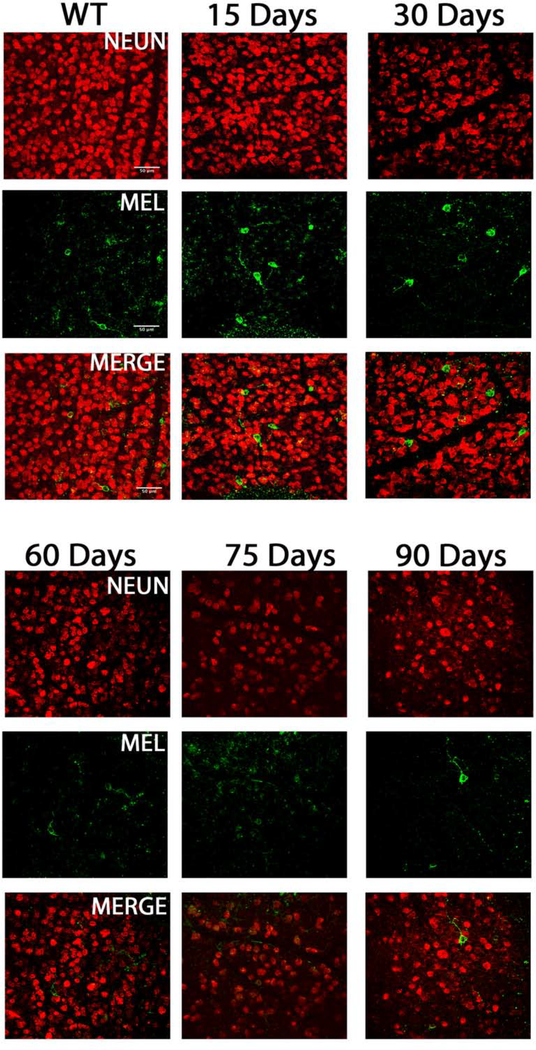
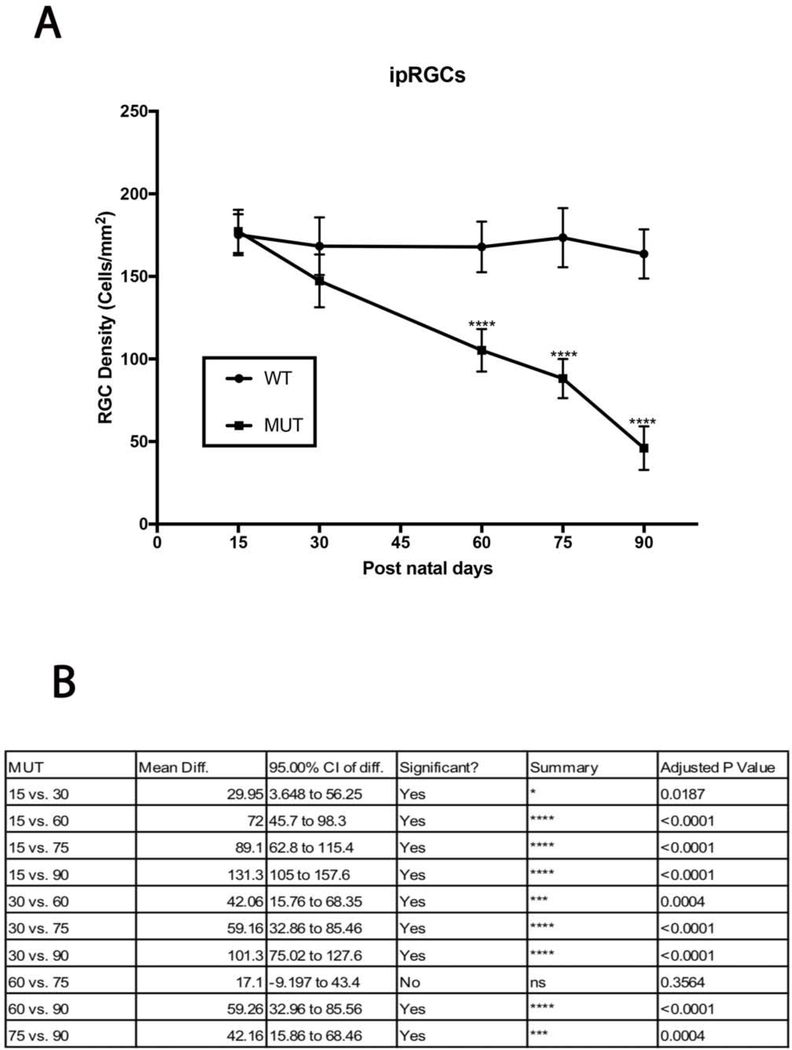
Melanopsin positive RGCs are intrinsically photosensitive RGCs and are responsible for pupillary reflexes and other non-vision related functions. Figure 6 shows representative images of total RGCs labeled with NeuN and ipRGCs labeled with melanopsin at each experimental time point. A gradual decline in ipRGC density was observed in MUT animals (Fig. 7A), and no significant differences in cell densities were observed at day 15 and 30 when compared to their WT littermates. However, by day 60 the cell density of ipRGCs reduced to 105±12 cells/mm2 (p<0.0001, n=6), to 88±11cells/mm2 (p<0.0001, n=6) by day 75, and to 46±13 cells/mm2 by day 90 (p<0.0001, n=6) compared to their WT counterparts (Fig. 7B).
Figure 6.
ipRGC subtype cell death in B6.Sh3pxd2bnee mice: Representative images showing NeuN (red) and melanopsin (green) immunolabeled retinal flat-mounts. Images of 15-day WT and 15, 30, 60,75 and 90-day MUT are shown. Scale bar = 50 μm.
Figure 7:
ipRGC loss in MUT and WT mice: (A) There was significant decline in ipRGC density in MUT animals at post-natal days 60, 75 and 90. The values are represented as mean ±SD (n=6 ****: p<0.0001 by Two Way-ANOVA then Sidak’s post hoc test. (B) ipRGC density between each time point show varying degrees of differences in MUT animals. The values are represented as mean ±SD (n=6). Two Way-ANOVA then Tukey’s post hoc test.
3.2.3. Another non-image forming RGC shows resistance to glaucomatous injury
CDH3-RGCs have non-image forming functions and do not project to the primary visual centers of the brain. Figure 8A shows representative images of total RGCs labeled with NeuN and CDH3-RGCs labeled with GFP at two experimental time points. Due to breeding limitations, only 30 and 90 days post-natal animals were evaluated, and there was a difference in cell densities in MUT animals between these time points (Fig. 8B). At both time points cell densities of MUT animals were also significantly less than their WT littermates (at day 30, 99±10 cells/mm2, p=0.011, n=4; and at day 90±7 cells/mm2, p=0.0001, n=4) (Fig. 8C).
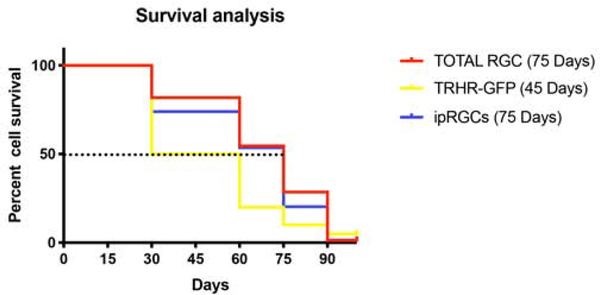
In order to evaluate temporal pattern of RGC loss in the B6.Sh3pxd2bnee glaucoma mice, we calculated percent cell survival of the total and RGC subtypes. We considered number of RGCs at postnatal day 15 for each of these strains as 100 percent as we saw no difference in cell density between these strains at this time point. These RGCs represent a small portion of the total RGC population and have distinct characteristics including susceptibility to glaucomatous injury as demonstrated above. We calculated median survival for each subtype by Kaplan-Meier survival analysis, which is the time at which 50 percent survival of that particular subtype (Fig. 9). As CDH3-RGC evaluation was limited to two time points, this strain was excluded from this analysis. Under early-onset glaucoma conditions, TRHR-RGCs have a median survival of 45 days, whereas ipRGCs and total RGCs both have a median survival of 75 days. These data suggest that RGC subtypes die at different rates during elevated IOP insult.
Figure 9.
Percent cell survival in B6.Sh3pxd2bnee mice: Survival curves of total as well 600 as subtype specific RGCs show differences in median survival (Post-natal day where 50% of cells survive in MUT mice) marked by dotted line at Y=50 in this Kaplan-Meier plot.
3.3. RGC axons and soma follow different modes of degeneration
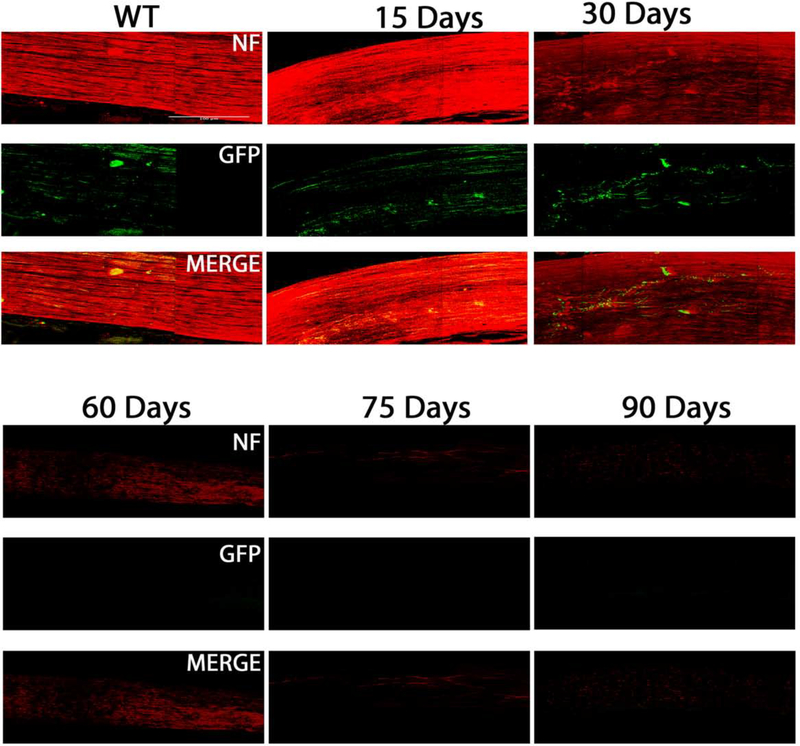
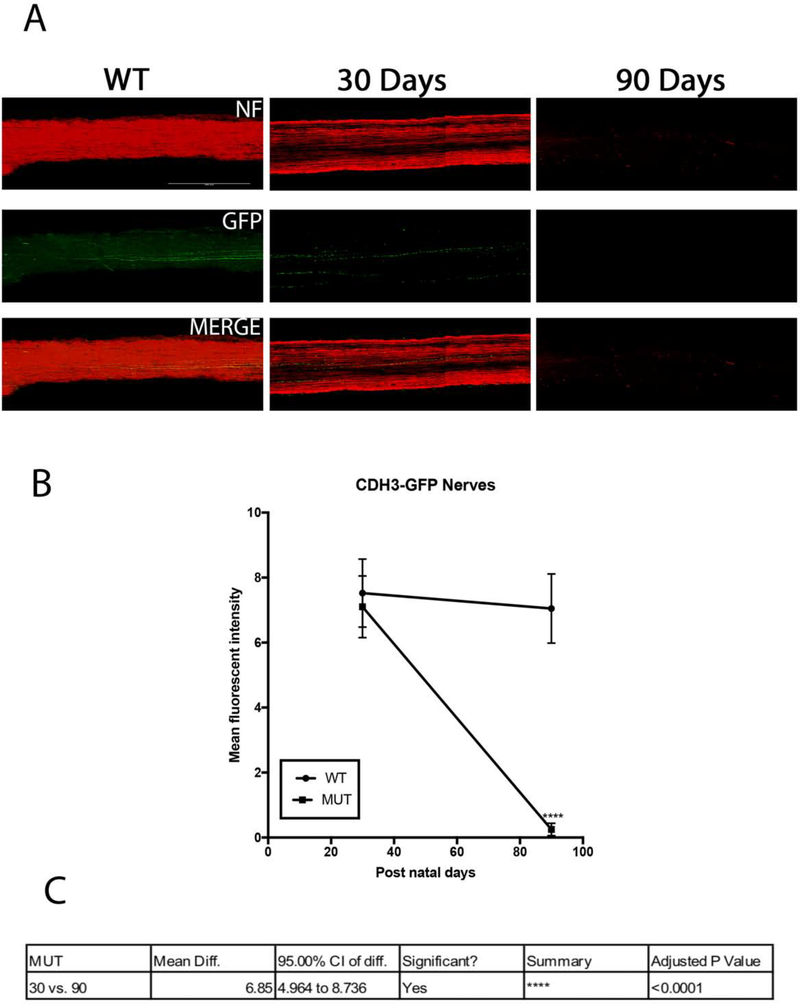
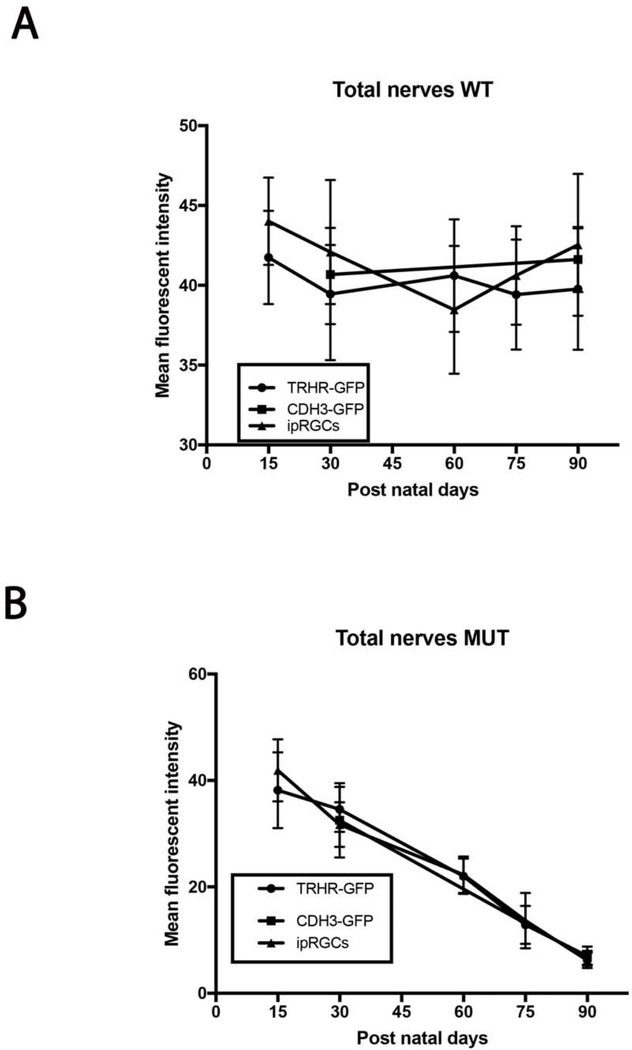
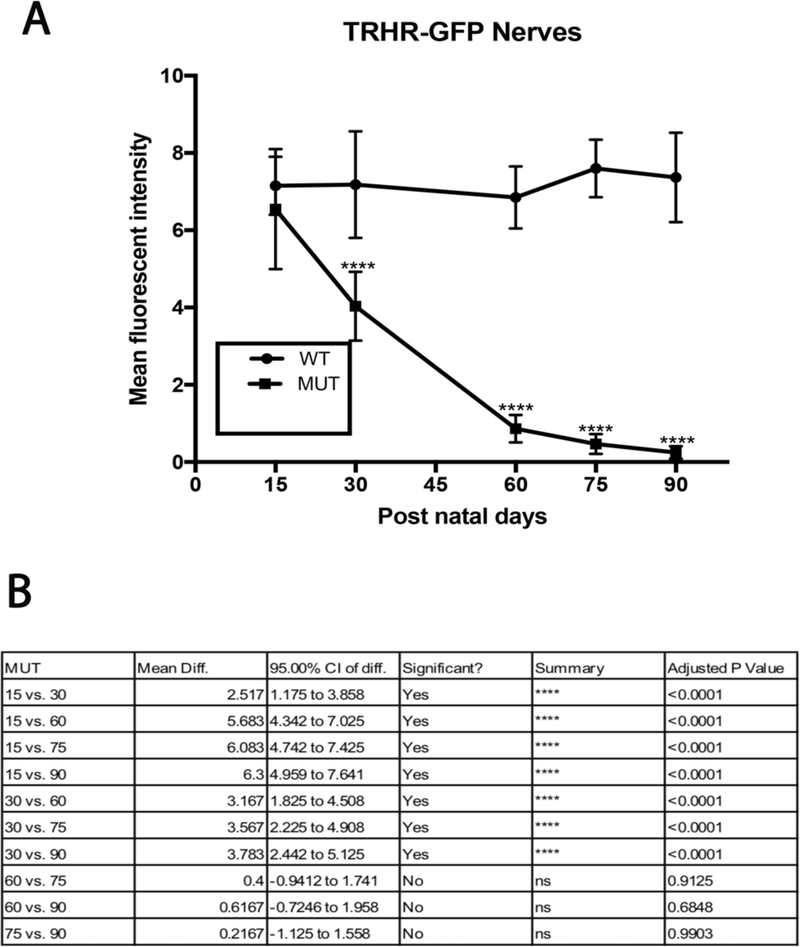
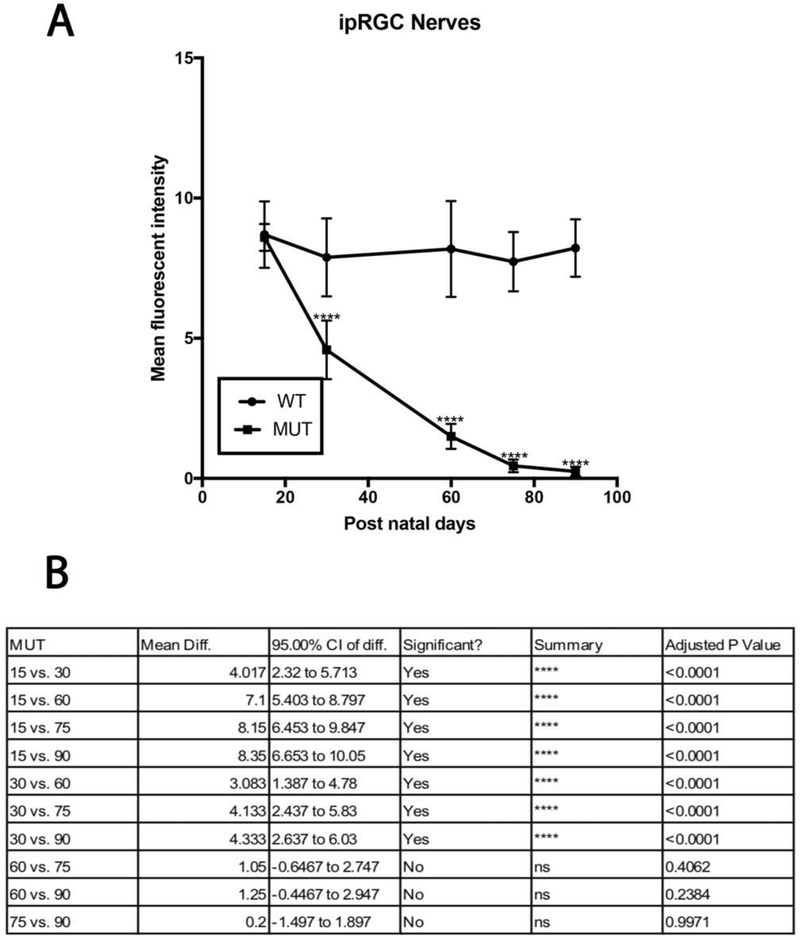
We evaluated the axonal degeneration in each RGC subtype by immunostaining the optic nerves with neurofilament, along with GFP or melanopsin and measuring their intensities after 3D reconstruction in MUT and WT animals at post-natal days 15, 30, 60, 75 and 90 (Figs. 11–15). We see loss of fluorescent intensity in total nerves in MUT animals compared to WT, but there is no significant difference in fluorescent intensity for total nerves between each strain for all time points (Fig. 10). Within each strain, there are differences in intensities for subtype specific axons in MUT animals when compared to their respective WT controls. In TRHR-GFP animals, fluorescent intensity of the labeled axons decreased throughout the time course except at day 15 when compared to their WT littermates (day 30, 4± 0.8 [p<0.0001; n=6]; day 60, 0.8±0.3 [p<0.0001; n=6]; day 75, 0.4± 0.2 [p<0.0001; n=6]; day 90, 0.2 ± 0.1 [p<0.0001; n=6] (Fig. 12A). In the axons of ipRGCs of MUT mice, the fluorescent intensity also decreased throughout the time course except at day 15 when compared to their WT littermates (day 30, 4.5± 1 [p<0.0001; n=6]; day 60, 1.5±0.4 [p<0.0001; n=6]; day 75, 0.45± 0.2 [p<0.0001; n=6]; day 90, 0.2 ± 0.1 [p<0.0001; n=6] (Fig. 14A). There were differences in fluorescent intensities for the two time points of MUT CDH3-GFP animals when compared to their WT controls (day 30, 7.1± 0.9 [P<0.0001. N=6]; day 90, 0.2 ± 0.1 [P<0.0001. N=6]) (Fig. 15B). There were also differences in intensities between time points for MUT animals in all strains. (Figs. 12B, 14B, 15C).
Figure 11:
Axonal degeneration of TRHR-RGCs inB6-Sh3pxd2bnee mice: Representative 3D images of tissue cleared optic nerve showing NF (neurofilament) (red) and GFP (green) immunolabeled whole optic nerves. Images of 15-day WT and 15, 30, 60,75 and 90-day MUT are shown. Scale bar = 50 μm.
Figure 15:
Axonal degeneration of CDH3-RGCs in B6.Sh3pxd2bnee mice: (A) Representative 3D images of tissue cleared optic nerve showing NF (neurofilament) (red) and GFP (green) immunolabeled whole optic nerves. Images of 30-day WT as well as 30 and 90-day MUT are shown. Scale bar = 50 μm. (B) There was significant decline in mean fluorescent intensity in MUT animals at post-natal day 90. The values are represented as mean ± SD (n=4–6). ****:p<0.0001 by Two Way-ANOVA then Sidak’s post hoc test. (C) Mean fluorescent intensity between the two time points show differences in MUT animals. The values are represented as mean ± SD (n=4). Two Way-ANOVA then Sidak’s post hoc test.
Figure 10.
Comparison of total axonal degeneration in MUT and WT mice between strains. (A) Mean fluorescent intensity between each strain within each time point show no significant differences in WT animals. The values are represented as mean ± SD (n=4–6). Two Way-ANOVA then Sidak’s post hoc test for time points 15, 60 and 75. Two Way-ANOVA then Tukey’s post hoc test for time points 30 and 90. (B) Mean fluorescent intensity between each strain within each time point show no significant differences in MUT animals. The values are represented as mean ±SD (n=4–6). Two Way-ANOVA then Sidak’s post hoc test for time points 15, 60 and 75. Two Way-ANOVA then Tukey’s post hoc test for time points 30 and 90.
Figure 12:
TRHR-GFP axonal loss in MUT and WT mice: (A) There was significant decline in mean fluorescent intensity in MUT animals at post-natal days 30, 60, 75 and 90. The values are represented as mean ± SD (n=6), ****: p<0.0001 by Two Way-ANOVA then Sidak’s post hoc test. (B) Mean fluorescent intensity between each time point show varying degrees of differences in MUT animals. The values are represented as mean ± SD (n=6). Two Way-ANOVA then Tukey’s post hoc test.
Figure 14.
ipRGC axonal loss in MUT and WT mice: (A) There was significant decline in mean fluorescent intensity in MUT animals at post-natal days 30, 60, 75 and 90. The values are represented as mean ± SD (n=6), ****: p<0.0001 by Two Way-ANOVA then Sidak’s post hoc test. (B) Mean fluorescent intensity between each time point show varying degrees of differences in MUT animals. The values are represented as mean ±SD (n=6). Two Way-ANOVA then Tukey’s post hoc test.
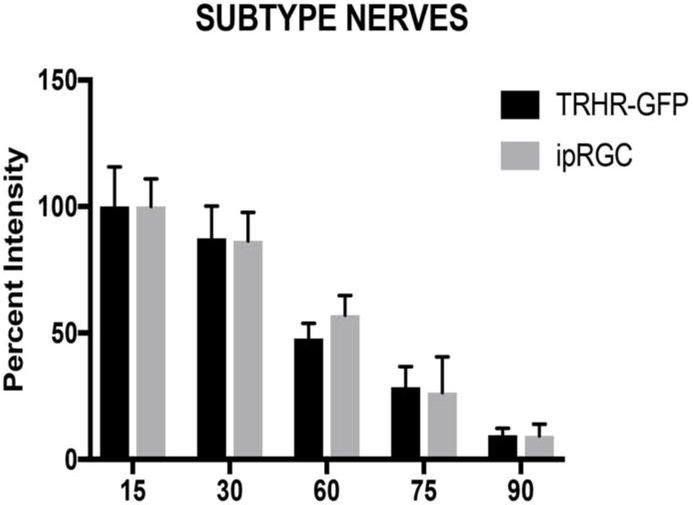
As we find no significant differences in fluorescent intensities between each strain for total nerves (Fig. 10), we considered intensities at day 15 to be 100 percent and compared each strain for differences in subtype specific axonal degeneration (Fig. 16). The CDH3-GFP strain was excluded from this analysis due to the limited time course in this strain. On percent analysis, we did not find any significant differences between the RGC substrains at any given time point. We also found the ‘bead-on-a-string’ type of degeneration in these axons, which is characteristic of Wallerian degeneration (Vargas and Barres 2007, Coleman and Freeman 2010, Conforti, Gilley et al. 2014). These data suggest that the pattern of damage in the soma of RGC subtypes is different from that of their respective axons during early-onset glaucoma.
Figure 16:
Comparison of axonal degeneration in RGC subtypes in B6.Sh3pxd2bnee mice: There was no difference in percent intensity of axons between RGC subtypes in MUT animals within each time point by Two Way-ANOVA then Sidak’s multiple comparison. The values are represented as mean ± SD (n=6).
4. Discussion
Glaucoma is a multifactorial disease with the involvement of many different cells and molecules in cause and effect relationships(Weinreb et al., 2014). Loss of vision in glaucoma occurs due to the progressive loss of RGC neurons in which the communication between the eye and the brain is lost. As glaucoma is a complex disease with many aspects still poorly understood, a cure for the disease is still not available. A major risk factor for glaucoma is ocular hypertension. Elevated IOP causes mechanical injury to the optic nerve at the lamina cribrosa, which leads to glaucomatous neuropathy(Cohen and Pasquale, 2014; Davis et al., 2016). Researchers have developed and used many models to mimic ocular hypertensive insults to the optic nerve to study progression of neuropathy at cellular and molecular levels(Chen and Zhang, 2015; Johnson and Tomarev, 2010). Some of these models are induced and cause acute injury, while others are chronic and more sustained but require extensive aging of animals.
As mice are easily accessible, an ideal model would be a mouse model of ocular hypertension with progressive RGC degeneration that closely mimics glaucoma progression in humans and does not require extensive aging. In our study, we used the nee model of early-onset glaucoma. We evaluated this model on the C57BL6/J background for glaucomatous changes and established that mice with homozygous B6.Sh3pxd2bnee mutation exhibit glaucoma characteristics of elevated IOP, optic nerve excavation, RGC loss, and axonal degeneration (Mao et al., 2011). We then tested the pattern of degeneration in RGC subtypes in B6.Sh3pxd2bnee mutant animals. This study corroborates our previous findings that ipRGCs are the most resistant to injury, and the axonal degeneration pathway is independent of their respective RGC soma (Daniel et al., 2018).
4.1. Importance of RGC subtype evaluation and axonal degeneration
There are only about 50,000 RGCs per mouse retina that are responsible for relaying myriads of visual information from the eye to the brain(Jeon et al., 1998). It is therefore not surprising that about 40 different subtypes of RGCs have been identified through single cell RNA sequencing that receive and relay information between neurons of the eye and the brain(Langer et al., 2018; Rheaume et al., 2018). These RGCs differ morphologically, have different molecular and cellular pathways, synaptic connections, and physiological characteristics(Diao et al., 2004; Rasheed et al., 2014; Sanes and Masland, 2015; Shah et al., 2019). Many researchers have attempted to study the responses of a few RGC subtypes under glaucomatous conditions using various experimental glaucoma models. Studies have looked into dendritic remodeling and functional responses of RGC subtypes to ocular hypertension suggesting decline in physiological responses and extensive remodeling precedes RGC loss(Della Santina et al., 2013; El-Danaf and Huberman, 2015; Ou et al., 2016). Another study suggests an initial axogenic response of the RGCs to counteract IOP(Risner et al., 2018). Our current study supports our previous findings in the optic nerve crush model showing ipRGCs are the most resilient to injury and that RGC soma death is independent of their respective axonal degeneration(Daniel et al., 2018).
It is important to understand the mechanism of progression of the disease in order to develop possible neuroprotective and regenerative strategies. Knowing the temporal pattern of degeneration in these neurons is key to identify the ‘point of no return’ and to start rescue interventions before this phase is reached. Different RGC subtypes also communicate to different visual centers of the brain(El-Danaf and Huberman, 2015; Huberman et al., 2008; Osterhout et al., 2011; Rivlin-Etzion et al., 2011; Seabrook et al., 2017; Tang et al., 2015; Triplett et al., 2014). It is therefore not enough to re-grow neurites as a treatment intervention, but to make sure that these axons project to their respective regions of communication in the brain(Lim et al., 2016; Osterhout et al., 2015). Selective sensitivities of RGC subtypes to glaucomatous insults may also lead to more sensitive and accurate clinical testing of glaucomatous neurodegeneration.
4.2. Selective and compartmentalized cell death in RGC somas and axons
Although we did not examine the molecular mechanism(s) of RGC death in this early onset mouse model of glaucoma, previous reports have shown that the RGCs die via apoptosis in other glaucoma models as well as human glaucoma(Almasieh et al., 2012). We found that there is differential susceptibility to somal death of RGC subtypes with TRHR-RGCs being lost prior to other RGC subtypes of total RGCs. A greater sensitivity of OFF RGCs has also been shown in models of acute optic nerve injury (i.e. optic nerve crush)(Daniel et al., 2018; Puyang et al., 2017).
However, despite this differential RGC soma sensitivity, all of the RGC axons in the optic nerve appears to die with the same kinetics (i.e. there is no differential sensitivity to optic nerve axon loss) in this model, which was also evident in the optic nerve crush model(Daniel et al., 2018). These compartmentalized differences in pathogenic damage to RGCs have been seen in Bax deficient mice in both the DBA/2J mouse glaucoma model and in the optic nerve crush model (Libby et al., 2005) suggesting that this is a common feature of RG neurodegeneration in a variety of models of RGC injury.
4.3. B6.Sh3pxd2bnee mutant animals as a model of early-onset glaucoma
Although many mouse models of glaucoma are highly sensitive to genetic background(Meyer and Anderson, 2017), we found that the Sh3pxd2bnee mutation results in very similar phenotypes on both the B6 and B10 genetic backgrounds. The phenotypes we have observed are also highly similar to the phenotypes described in a gene trap allele (Sh3pxd2bGt(GST_1527_E5)Lex) that was previously studied in a mixed C57BL6/a129SvJ background(Iqbal et al., 2010). In each of these contexts, mice with homozygous Sh3pxd2b mutations exhibit characteristics of glaucomatous neuropathy(Iqbal et al., 2010; Mao et al., 2011, 2009). There are several features that make this an attractive model for experimental glaucoma neurodegeneration studies: 1) Sh3pxd2b mutants develop glaucomatous changes quite early on in life and do not require extensive aging. 2) Sh3pxd2b mutant mice are a model in which mutations in the ortholog are also a known cause of glaucoma in humans(Iqbal et al., 2010). And 3), with the N10 B6.Sh3pxd2b strain described herein, it is possible to conduct experiments with tight control of genetic background. However, this study comes with a few caveats, and care must be taken to consider these before using this glaucoma model. Homozygous mutant mice are infertile and hence animals heterozygous for Sh3pxd2b mutations are required for breeding. This lowers the numbers of homozygous mutants from each mating cycle. These odds are reduced even further when introducing another transgenic crossing as was done in our study. This was a big hurdle when breeding CDH3-GFP animals and resulted in reduced mutant mice and an incomplete time course for our study. This problem might have been addressed by utilizing super ovulation and in vitro fertilization techniques, which we considered but deemed impractical. Another potential caveat with this model concerns its nascent status, which leaves some important questions yet to be addressed. Among these, one important question is the degree to which the retinal/optic nerve changes observed are IOP-dependent. SH3PXD2B is believed to be widely expressed in the eye(Mao et al., 2012). Thus, at the current state of knowledge, it is plausible that SH3PXD2B might contribute to ocular disease in multiple ways. In humans, Frank-ter Haar syndrome typically presents with congenital glaucoma, but some patients do not exhibit elevated IOP or glaucoma(Maas et al., 2004). While some people exhibit additional ocular defects such as colobomas(Chang et al., 2017), there are no reports of patients exhibiting progressive retinal disease in the absence of elevated IOP. Thus, although the sum of existing data suggests RGC loss associated with SH3PXD2B-mediated pathology is IOP-related and glaucomatous, it none-the-less remains to be tested experimentally in Sh3pxd2b-mutant mice.
Supplementary Material
Supplemental Figure 1. Representative H&E stained histologic sections of the inner ear and retina. Inner ear images demonstrate otitis media caused by the Sh3pxd2bnee mutation on both the B10 and B6 genetic backgrounds. Note the presence of inflammatory cells and cellular debris within the middle ear (arrow), Scale bar = 100 μm. Retina images demonstrate at P15 the overall retina is largely normal, including inner and out layer thickness and RGC density in the mutant retina, Scale bar = 50 μm.
Supplemental Figure 2. Representative H&E stained histologic sections of multiple tissues showing no significant abnormalities caused by the Sh3pxd2bnee mutation on either the B10 or B6 genetic backgrounds. Scale bar = 50 μm.
Supplemental Figure 3. Representative H&E stained histologic sections of multiple tissues showing no significant abnormalities caused by the Sh3pxd2bnee mutation on either the B10 or B6 genetic backgrounds. Scale bar = 50 μm.
Supplemental Figure 4. Representative H&E stained histologic sections of multiple tissues showing no significant abnormalities caused by the Sh3pxd2bnee mutation on either the B10 or B6 genetic backgrounds. Scale bar = 50 μm.
Figure 13:
Axonal degeneration of ipRGCs inB6.Sh3pxd2bnee mice: Representative 3D images of tissue cleared optic nerve showing NF (neurofilament) (red) and melanopsin (green) immunolabeled whole optic nerves. Images of 15-day WT and 15, 30, 60,75 and 90-day MUT are shown. Scale bar = 50 μm.
Highlights.
B6.Sh3pxd2bnee mutant animals exhibit glaucoma phenotypes of elevated intraocular pressure, RGC loss, and axonal degeneration.
Retinal ganglion cell subtypes have different cell death responses and pattern of cell death in response to elevated intraocular pressure.
Somas and axons follow different pathways of degeneration in our early onset glaucoma model.
Acknowledgments
Grant support: Knights Templar Eye Research Foundation (CMM), Glaucoma Research Foundation (CMM). This work was supported in part by an unrestricted grant from Research to Prevent Blindness, Inc. to the UW Madison Department of Ophthalmology and Visual Sciences. KJM and MGA acknowledge US Dept. of Veterans Affairs RR&D I01RX001481 and NIH P30 EY025580. The contents do not represent the views of the U.S. Department of Veterans Affairs or the U.S. Government.
Footnotes
Publisher's Disclaimer: This is a PDF file of an unedited manuscript that has been accepted for publication. As a service to our customers we are providing this early version of the manuscript. The manuscript will undergo copyediting, typesetting, and review of the resulting proof before it is published in its final form. Please note that during the production process errors may be discovered which could affect the content, and all legal disclaimers that apply to the journal pertain.
5. References
- Aga M, Bradley JM, Keller KE, Kelley MJ, Acott TS, 2008. Specialized podosome- or invadopodia-like structures (PILS) for focal trabecular meshwork extracellular matrix turnover. Invest. Ophthalmol. Vis. Sci 49, 5353–5365. 10.1167/iovs.07-1666 [DOI] [PMC free article] [PubMed] [Google Scholar]
- Almasieh M, Wilson AM, Morquette B, Cueva Vargas JL, Di Polo A, 2012. The molecular basis of retinal ganglion cell death in glaucoma. Prog Retin Eye Res 31, 152–181. 10.1016/j.preteyeres.2011.11.002 [DOI] [PubMed] [Google Scholar]
- Boland MV, 2007. Risk factors and open-angle glaucoma: classification and application. J. Glaucoma 16, 406–418. [DOI] [PubMed] [Google Scholar]
- Chang TC, Bauer M, Puerta HS, Greenberg MB, Cavuoto KM, 2017. Ophthalmic findings in Frank-ter Haar syndrome: report of a sibling pair. J. AAPOS Off. Publ. Am. Assoc. Pediatr. Ophthalmol. Strabismus 21, 514–516. 10.1016/j.jaapos.2017.07.216 [DOI] [PubMed] [Google Scholar]
- Chen S, Zhang X, 2015. The Rodent Model of Glaucoma and Its Implications. Asia Pac J Ophthalmol 4, 236–241. 10.1097/apo.0000000000000122 [DOI] [PubMed] [Google Scholar]
- Clark AF, Pang IH, 2002. Advances in glaucoma therapeutics. Expert Opin Emerg Drugs 7, 141–163. 10.1517/14728214.7.1.141 [DOI] [PubMed] [Google Scholar]
- Cohen LP, Pasquale LR, 2014. Clinical characteristics and current treatment of glaucoma. Cold Spring Harb Perspect Med 4 10.1101/cshperspect.a017236 [DOI] [PMC free article] [PubMed] [Google Scholar]
- Daniel S, Clark AF, McDowell CM, 2018. Subtype-specific response of retinal ganglion cells to optic nerve crush. Cell Death Discov 5, 7 10.1038/s41420-018-0069-y [DOI] [PMC free article] [PubMed] [Google Scholar]
- Davis BM, Crawley L, Pahlitzsch M, Javaid F, Cordeiro MF, 2016. Glaucoma: the retina and beyond. Acta Neuropathol 132, 807–826. 10.1007/s00401-016-1609-2 [DOI] [PMC free article] [PubMed] [Google Scholar]
- Della Santina L, Inman DM, Lupien CB, Horner PJ, Wong RO, 2013. Differential progression of structural and functional alterations in distinct retinal ganglion cell types in a mouse model of glaucoma. J Neurosci 33, 17444–17457. 10.1523/jneurosci.5461-12.2013 [DOI] [PMC free article] [PubMed] [Google Scholar]
- Diao L, Sun W, Deng Q, He S, 2004. Development of the mouse retina: emerging morphological diversity of the ganglion cells. J Neurobiol 61, 236–249. 10.1002/neu.20041 [DOI] [PubMed] [Google Scholar]
- El-Danaf RN, Huberman AD, 2015. Characteristic patterns of dendritic remodeling in early-stage glaucoma: evidence from genetically identified retinal ganglion cell types. J Neurosci 35, 2329–2343. 10.1523/jneurosci.1419-14.2015 [DOI] [PMC free article] [PubMed] [Google Scholar]
- Fernandes KA, Harder JM, Williams PA, Rausch RL, Kiernan AE, Nair KS, Anderson MG, John SW, Howell GR, Libby RT, 2015. Using genetic mouse models to gain insight into glaucoma: Past results and future possibilities. Exp Eye Res 141, 42–56. 10.1016/j.exer.2015.06.019 [DOI] [PMC free article] [PubMed] [Google Scholar]
- Fingert JH, Miller K, Hedberg-Buenz A, Roos BR, Lewis CJ, Mullins RF, Anderson MG, 2017. Transgenic TBK1 mice have features of normal tension glaucoma. Hum. Mol. Genet 26, 124–132. 10.1093/hmg/ddw372 [DOI] [PMC free article] [PubMed] [Google Scholar]
- Flaxman SR, Bourne RRA, Resnikoff S, Ackland P, Braithwaite T, Cicinelli MV, Das A, Jonas JB, Keeffe J, Kempen JH, Leasher J, Limburg H, Naidoo K, Pesudovs K, Silvester A, Stevens GA, Tahhan N, Wong TY, Taylor HR, 2017. Global causes of blindness and distance vision impairment 1990–2020: a systematic review and meta-analysis. Lancet Glob Heal. 5, e1221–e1234. 10.1016/s2214-109x(17)30393-5 [DOI] [PubMed] [Google Scholar]
- Hattar S, Liao HW, Takao M, Berson DM, Yau KW, 2002. Melanopsin-containing retinal ganglion cells: architecture, projections, and intrinsic photosensitivity. Science (80-. ). 295, 1065–1070. 10.1126/science.1069609 [DOI] [PMC free article] [PubMed] [Google Scholar]
- Huberman AD, Manu M, Koch SM, Susman MW, Lutz AB, Ullian EM, Baccus SA, Barres BA, 2008. Architecture and activity-mediated refinement of axonal projections from a mosaic of genetically identified retinal ganglion cells. Neuron 59, 425–438. 10.1016/j.neuron.2008.07.018 [DOI] [PMC free article] [PubMed] [Google Scholar]
- Iqbal Z, Cejudo-Martin P, de Brouwer A, van der Zwaag B, Ruiz-Lozano P, Scimia MC, Lindsey JD, Weinreb R, Albrecht B, Megarbane A, Alanay Y, Ben-Neriah Z, Amenduni M, Artuso R, Veltman JA, van Beusekom E, Oudakker A, Millan JL, Hennekam R, Hamel B, Courtneidge SA, van Bokhoven H, 2010. Disruption of the podosome adaptor protein TKS4 (SH3PXD2B) causes the skeletal dysplasia, eye, and cardiac abnormalities of Frank-Ter Haar Syndrome. Am. J. Hum. Genet 86, 254–261. 10.1016/j.ajhg.2010.01.009 [DOI] [PMC free article] [PubMed] [Google Scholar]
- Jeon CJ, Strettoi E, Masland RH, 1998. The major cell populations of the mouse retina. J Neurosci 18, 8936–8946. [DOI] [PMC free article] [PubMed] [Google Scholar]
- Johnson TV, Tomarev SI, 2010. Rodent models of glaucoma. Brain Res Bull 81, 349–358. 10.1016/j.brainresbull.2009.04.004 [DOI] [PMC free article] [PubMed] [Google Scholar]
- Jones R 3rd, Rhee DJ, 2006. Corticosteroid-induced ocular hypertension and glaucoma: a brief review and update of the literature. Curr Opin Ophthalmol 17, 163–167. 10.1097/01.icu.0000193079.55240.18 [DOI] [PubMed] [Google Scholar]
- Langer KB, Ohlemacher SK, Phillips MJ, Fligor CM, Jiang P, Gamm DM, Meyer JS, 2018. Retinal Ganglion Cell Diversity and Subtype Specification from Human Pluripotent Stem Cells. Stem cell reports 10, 1282–1293. 10.1016/j.stemcr.2018.02.010 [DOI] [PMC free article] [PubMed] [Google Scholar]
- Lee E, Sun W, 2016. ACT-PRESTO: Biological Tissue Clearing and Immunolabeling Methods for Volume Imaging. J Vis Exp 10.3791/54904 [DOI] [PMC free article] [PubMed] [Google Scholar]
- Libby RT, Li Y, Savinova OV, Barter J, Smith RS, Nickells RW, John SW, 2005. Susceptibility to neurodegeneration in a glaucoma is modified by Bax gene dosage. PLoS Genet 1, 17–26. 10.1371/journal.pgen.0010004 [DOI] [PMC free article] [PubMed] [Google Scholar]
- Lim JH, Stafford BK, Nguyen PL, Lien BV, Wang C, Zukor K, He Z, Huberman AD, 2016. Neural activity promotes long-distance, target-specific regeneration of adult retinal axons. Nat. Neurosci 19, 1073–1084. 10.1038/nn.4340 [doi] [DOI] [PMC free article] [PubMed] [Google Scholar]
- Maas SM, Kayserili H, Lam J, Apak MY, Hennekam RCM, 2004. Further delineation of Frank-ter Haar syndrome. Am. J. Med. Genet. A 131, 127–133. 10.1002/ajmg.a.30244 [DOI] [PubMed] [Google Scholar]
- Mantravadi AV, Vadhar N, 2015. Glaucoma. Prim Care 42, 437–449. 10.1016/j.pop.2015.05.008 [DOI] [PubMed] [Google Scholar]
- Mao M, Hedberg-Buenz A, Koehn D, John SW, Anderson MG, 2011. Anterior segment dysgenesis and early-onset glaucoma in nee mice with mutation of Sh3pxd2b. Invest Ophthalmol Vis Sci 52, 2679–2688. 10.1167/iovs.10-5993 [DOI] [PMC free article] [PubMed] [Google Scholar]
- Mao M, Solivan-Timpe F, Roos BR, Mullins RF, Oetting TA, Kwon YH, Brzeskiewicz PM, Stone EM, Alward WLM, Anderson MG, Fingert JH, 2012. Localization of SH3PXD2B in human eyes and detection of rare variants in patients with anterior segment diseases and glaucoma. Mol. Vis 18, 705–713. [PMC free article] [PubMed] [Google Scholar]
- Mao M, Thedens DR, Chang B, Harris BS, Zheng QY, Johnson KR, Donahue LR, Anderson MG, 2009. The podosomal-adaptor protein SH3PXD2B is essential for normal postnatal development. Mamm Genome 20, 462–475. 10.1007/s00335-009-9210-9 [DOI] [PMC free article] [PubMed] [Google Scholar]
- McDowell CM, Luan T, Zhang Z, Putliwala T, Wordinger RJ, Millar JC, John SW, Pang IH, Clark AF, 2012. Mutant human myocilin induces strain specific differences in ocular hypertension and optic nerve damage in mice. Exp Eye Res 100, 65–72. 10.1016/j.exer.2012.04.016 [DOI] [PMC free article] [PubMed] [Google Scholar]
- Meyer KJ, Anderson MG, 2017. Genetic modifiers as relevant biological variables of eye disorders. Hum. Mol. Genet 26, R58–R67. 10.1093/hmg/ddx180 [DOI] [PMC free article] [PubMed] [Google Scholar]
- Murphy DA, Diaz B, Bromann PA, Tsai JH, Kawakami Y, Maurer J, Stewart RA, Izpisua-Belmonte JC, Courtneidge SA, 2011. A Src-Tks5 pathway is required for neural crest cell migration during embryonic development. PLoS One 6, e22499 10.1371/journal.pone.0022499 [DOI] [PMC free article] [PubMed] [Google Scholar]
- Mwanza JC, Tulenko SE, Barton K, Herndon LW, Mathenge E, Hall A, Kim HY, HaySmith G, Budenz DL, 2018. Eight-Year Incidence of Open-Angle Glaucoma in the Tema Eye Survey. Ophthalmology. 10.1016/j.ophtha.2018.10.016 [DOI] [PubMed] [Google Scholar]
- Osterhout JA, Josten N, Yamada J, Pan F, Wu SW, Nguyen PL, Panagiotakos G, Inoue YU, Egusa SF, Volgyi B, Inoue T, Bloomfield SA, Barres BA, Berson DM, Feldheim DA, Huberman AD, 2011. Cadherin-6 mediates axon-target matching in a non-image-forming visual circuit. Neuron 71, 632–639. 10.1016/j.neuron.2011.07.006 [DOI] [PMC free article] [PubMed] [Google Scholar]
- Osterhout JA, Stafford BK, Nguyen PL, Yoshihara Y, Huberman AD, 2015. Contactin-4 mediates axon-target specificity and functional development of the accessory optic system. Neuron 86, 985–999. [DOI] [PMC free article] [PubMed] [Google Scholar]
- Ou Y, Jo RE, Ullian EM, Wong RO, Della Santina L, 2016. Selective Vulnerability of Specific Retinal Ganglion Cell Types and Synapses after Transient Ocular Hypertension. J Neurosci 36, 9240–9252. 10.1523/jneurosci.0940-16.2016 [DOI] [PMC free article] [PubMed] [Google Scholar]
- Patel GC, Phan TN, Maddineni P, Kasetti RB, Millar JC, Clark AF, Zode GS, 2017. Dexamethasone-Induced Ocular Hypertension in Mice: Effects of Myocilin and Route of Administration. Am J Pathol 187, 713–723. 10.1016/j.ajpath.2016.12.003 [DOI] [PMC free article] [PubMed] [Google Scholar]
- Paterson EK, Courtneidge SA, 2018. Invadosomes are coming: new insights into function and disease relevance. FEBS J. 285, 8–27. 10.1111/febs.14123 [DOI] [PMC free article] [PubMed] [Google Scholar]
- Puyang Z, Gong HQ, He SG, Troy JB, Liu X, Liang PJ, 2017. Different functional susceptibilities of mouse retinal ganglion cell subtypes to optic nerve crush injury. Exp Eye Res 162, 97–103. 10.1016/j.exer.2017.06.014 [DOI] [PubMed] [Google Scholar]
- Rasheed VA, Sreekanth S, Dhanesh SB, Divya MS, Divya TS, Akhila PK, Subashini C, Chandrika Sivakumar K, Das AV, James J, 2014. Developmental wave of Brn3b expression leading to RGC fate specification is synergistically maintained by miR-23a and miR-374. Dev Neurobiol 74, 1155–1171. 10.1002/dneu.22191 [DOI] [PubMed] [Google Scholar]
- Rheaume BA, Jereen A, Bolisetty M, Sajid MS, Yang Y, Renna K, Sun L, Robson P, Trakhtenberg EF, 2018. Single cell transcriptome profiling of retinal ganglion cells identifies cellular subtypes. Nat Commun 9, 2759 10.1038/s41467-018-05134-3 [DOI] [PMC free article] [PubMed] [Google Scholar]
- Risner ML, Pasini S, Cooper ML, Lambert WS, Calkins DJ, 2018. Axogenic mechanism enhances retinal ganglion cell excitability during early progression in glaucoma. Proc Natl Acad Sci U S A 115, E2393–e2402. 10.1073/pnas.1714888115 [DOI] [PMC free article] [PubMed] [Google Scholar]
- Rivlin-Etzion M, Zhou K, Wei W, Elstrott J, Nguyen PL, Barres BA, Huberman AD, Feller MB, 2011. Transgenic mice reveal unexpected diversity of on-off direction-selective retinal ganglion cell subtypes and brain structures involved in motion processing. J Neurosci 31, 8760–8769. 10.1523/jneurosci.0564-11.2011 [DOI] [PMC free article] [PubMed] [Google Scholar]
- Sanes JR, Masland RH, 2015. The types of retinal ganglion cells: current status and implications for neuronal classification. Annu Rev Neurosci 38, 221–246. 10.1146/annurev-neuro-071714-034120 [DOI] [PubMed] [Google Scholar]
- Seabrook TA, Burbridge TJ, Crair MC, Huberman AD, 2017. Architecture, Function, and Assembly of the Mouse Visual System. Annu Rev Neurosci 40, 499–538. 10.1146/annurev-neuro-071714-033842 [DOI] [PubMed] [Google Scholar]
- Senatorov V, Malyukova I, Fariss R, Wawrousek EF, Swaminathan S, Sharan SK, Tomarev S, 2006. Expression of mutated mouse myocilin induces open-angle glaucoma in transgenic mice. J Neurosci 26, 11903–11914. 10.1523/jneurosci.3020-06.2006 [DOI] [PMC free article] [PubMed] [Google Scholar]
- Shah M, Cabrera-Ghayouri S, Christie L-A, Held KS, Viswanath V, 2019. Translational Preclinical Pharmacologic Disease Models for Ophthalmic Drug Development. Pharm. Res 36, 58 10.1007/s11095-019-2588-5 [DOI] [PMC free article] [PubMed] [Google Scholar]
- Tang JC, Rudolph S, Dhande OS, Abraira VE, Choi S, Lapan SW, Drew IR, Drokhlyansky E, Huberman AD, Regehr WG, Cepko CL, 2015. Cell type-specific manipulation with GFP-dependent Cre recombinase. Nat Neurosci 18, 1334–1341. 10.1038/nn.4081 [DOI] [PMC free article] [PubMed] [Google Scholar]
- Thomson BR, Heinen S, Jeansson M, Ghosh AK, Fatima A, Sung H-K, Onay T, Chen H, Yamaguchi S, Economides AN, Flenniken A, Gale NW, Hong Y-K, Fawzi A, Liu X, Kume T, Quaggin SE, 2014. A lymphatic defect causes ocular hypertension and glaucoma in mice. J. Clin. Invest 124, 4320–4324. 10.1172/JCI77162 [DOI] [PMC free article] [PubMed] [Google Scholar]
- Tomer R, Ye L, Hsueh B, Deisseroth K, 2014. Advanced CLARITY for rapid and high-resolution imaging of intact tissues. Nat Protoc 9, 1682–1697. 10.1038/nprot.2014.123 [DOI] [PMC free article] [PubMed] [Google Scholar]
- Triplett JW, Wei W, Gonzalez C, Sweeney NT, Huberman AD, Feller MB, Feldheim DA, 2014. Dendritic and axonal targeting patterns of a genetically-specified class of retinal ganglion cells that participate in image-forming circuits. Neural Dev 9, 2 10.1186/1749-8104-9-2 [DOI] [PMC free article] [PubMed] [Google Scholar]
- Wang WH, Millar JC, Pang IH, Wax MB, Clark AF, 2005. Noninvasive measurement of rodent intraocular pressure with a rebound tonometer. Invest Ophthalmol Vis Sci 46, 4617–4621. 10.1167/iovs.05-0781 [DOI] [PubMed] [Google Scholar]
- Weinreb RN, Aung T, Medeiros FA, 2014. The pathophysiology and treatment of glaucoma: a review. Jama 311, 1901–1911. 10.1001/jama.2014.3192 [DOI] [PMC free article] [PubMed] [Google Scholar]
- Yang B, Tian C, Zhang Z, Han F, Azem R, Yu H, Zheng Y, Jin G, Arnold JE, Zheng QY, 2011. Sh3pxd2b mice are a model for craniofacial dysmorphology and otitis media. PLoS One 6, e22622 10.1371/journal.pone.0022622 [DOI] [PMC free article] [PubMed] [Google Scholar]
- Zhou Y, Grinchuk O, Tomarev SI, 2008. Transgenic mice expressing the Tyr437His mutant of human myocilin protein develop glaucoma. Invest Ophthalmol Vis Sci 49, 1932–1939. 10.1167/iovs.07-1339 [DOI] [PMC free article] [PubMed] [Google Scholar]
- Zode GS, Kuehn MH, Nishimura DY, Searby CC, Mohan K, Grozdanic SD, Bugge K, Anderson MG, Clark AF, Stone EM, Sheffield VC, 2011. Reduction of ER stress via a chemical chaperone prevents disease phenotypes in a mouse model of primary open angle glaucoma. J Clin Invest 121, 3542–3553. 10.1172/jci58183 [DOI] [PMC free article] [PubMed] [Google Scholar]
- Zode GS, Sharma AB, Lin X, Searby CC, Bugge K, Kim GH, Clark AF, Sheffield VC, 2014. Ocular-specific ER stress reduction rescues glaucoma in murine glucocorticoid-induced glaucoma. J Clin Invest 124, 1956–1965. 10.1172/jci69774 [DOI] [PMC free article] [PubMed] [Google Scholar]
Associated Data
This section collects any data citations, data availability statements, or supplementary materials included in this article.
Supplementary Materials
Supplemental Figure 1. Representative H&E stained histologic sections of the inner ear and retina. Inner ear images demonstrate otitis media caused by the Sh3pxd2bnee mutation on both the B10 and B6 genetic backgrounds. Note the presence of inflammatory cells and cellular debris within the middle ear (arrow), Scale bar = 100 μm. Retina images demonstrate at P15 the overall retina is largely normal, including inner and out layer thickness and RGC density in the mutant retina, Scale bar = 50 μm.
Supplemental Figure 2. Representative H&E stained histologic sections of multiple tissues showing no significant abnormalities caused by the Sh3pxd2bnee mutation on either the B10 or B6 genetic backgrounds. Scale bar = 50 μm.
Supplemental Figure 3. Representative H&E stained histologic sections of multiple tissues showing no significant abnormalities caused by the Sh3pxd2bnee mutation on either the B10 or B6 genetic backgrounds. Scale bar = 50 μm.
Supplemental Figure 4. Representative H&E stained histologic sections of multiple tissues showing no significant abnormalities caused by the Sh3pxd2bnee mutation on either the B10 or B6 genetic backgrounds. Scale bar = 50 μm.


