

Abstract
Multidrug resistance (MDR) remains a huge obstacle in cancer treatment. One of the most studied mechanisms of MDR is P-glycoprotein (P-gp) mediated drug efflux. Based on the three-dimensional structural characteristics of P-gp, gold nanoparticles (AuNPs) with an average size of 4.1 nm and 5.4 nm were designed to construct nano drug delivery systems (NanoDDSs) with anticancer molecules 2-(9-anthracenylmethylene)-hydrazinecarbothioamide (ANS) and 6-mercaptopurine (6-MP) modified on AuNPs surface through the thiol group. The in vitro cytotoxicity results suggested that the larger sized AuNPs can effectively decrease the drug resistance index of MCF-7/ADR cells to ~ 2. The verapamil and P-gp antibody competitive experiment, combined with cellular uptake of AuNPs, indicated that the larger NanoDDSs were more conducive to the intracellular drug accumulation and thus had improved anticancer activity, due to unmatched size between the nanoparticles and active site of P-gp and therefore reduced drug efflux. The measurement of ATPase activity and intracellular ATP level indicated that the larger nanoparticles do not bind well to P-gp, thus avoiding effective recognition by P-gp. This was further evidenced by the observation that 4.1 nm and 5.4 nm NanoDDSs treated MCF-7/ADR cells showed remarkable difference in energy-related metabolic pathways. Therefore, the critical size of AuNPs in overcoming MDR was identified to be between 4.1 nm and 5.4 nm. It provides a more accurate description of the composite dimensions of NanoDDSs designed for applications in overcoming MDR.
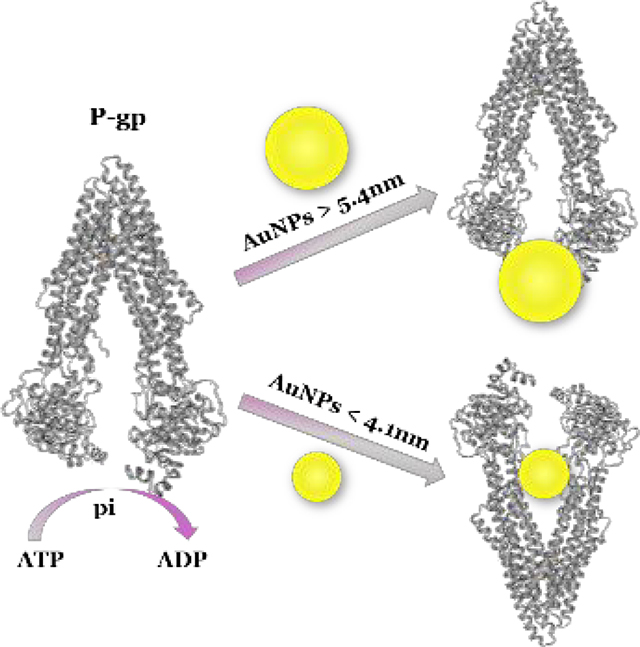
Graphical Abstract
The critical size of Au nanoparticles in overcoming multi-drug resistance was identified to be between 4.1 nm and 5.4 nm.
1. Introduction
Up to date, chemotherapy is still a primary care for cancer treatment, but with a severe problem associated with resistance developed in the cancer cells against the anticancer drugs. Multiple drug resistance (MDR) is a complicated phenomenon in human cancer treatment, and accounts for the major failure of cancer chemotherapy.1,2 With the advancement of nanomedicine, it is expected that nanoformulas could offer opportunities across all the directions of medicine. Significant advances in nanomaterials-based drug delivery systems (NanoDDSs) have been made in cancer diagnostics and treatment, and numerous nanoparticles with different size and surface have been designed to improve the chemotherapeutic efficacy and mitigate the adverse effect of anticancer drugs. Particularly, it is suggested that nanoparticles could escape from recognition and efflux by P-glycoprotein/MDR1 (P-gp), one of the main mediators of MDR.3–7 Some previous works have demonstrated a size-dependent effect in overcoming MDR, the larger nanoparticles showed the prominent effect in overcoming MDR while those with smaller sizes did not exhibit any significant inhibitory effect. Xu et al. synthesized ofloxacin (Oflx) conjugated silver nanoparticles (AgNPs) with three different sizes of 2.4 ± 0.7, 13.0 ± 3.1, and 92.6 ± 4.4 nm.8 The largest nanocarriers (92.6 ± 4.4 nm) showed the highest antibiotics effect. In contrast, the smallest nanocarriers (2.4 ± 0.7 nm) exhibited an even lower inhibitory effect than free Oflx. The work by Kiricsi suggested that the potency of AgNPs in sensing MDR cancers are determined by their size, as 75.3 ± 18.1 nm AgNPs were more effective than 5.1 ± 1.8 nm AgNPs.9 Huang reported that 8 nm AgNPs modified with cell-penetrating peptide TAT (AgNP–TAT) displayed indiscriminate anticancer activity in both MDR cells and non-resistant cells,10 due to the “too-big-to-be-pumped-out” effect in MDR cells. In our previous work, we fabricated two sets of gold nanoparticles (AuNPs, 22.1 ± 3.6 and 3.8 ± 0.7 nm) as carriers to deliver drug molecules in parental breast cancer cells MCF-7 and doxorubicin (DOX)-resistant cells MCF-7/ADR (ADR, adriamycin). 22.1 nm AuNPs showed more profound effect in overcoming MDR than 3.8 nm AuNPs.11 Although the reported data are limited, these works imply that there is likely a critical size for the nanoparticles as drug carriers to overcome P-gp mediated MDR.
Although the biochemical mechanisms are still not fully understood, a widely studied mechanism of MDR is from the altered membrane transport mediated by energy dependent transporter protein P-gp (Chart 1). P-gp is known to be a clinically important efflux pump in cancer chemotherapy. It is a protein encoded by ABCB1 gene12,13 and belongs to the ATP-binding cassette (ABC) family of membrane transporters.14 The transportation process is closely related to the size of substrates,15,16 because the binding site of P-gp presents as a funnel-shaped channel with an extracellular portion of at least 5 nm, a middle portion about 0.9 ~ 2.5 nm and an even smaller cytoplasmic portion.17
Chart 1.

Schematic representation of drug efflux process of the energy dependent transporter P-gp. The substrate binds to the binding site, and ATP binds to the sites in the nucleotide binding domains (NBDs), followed by the hydrolysis of ATP to provide the energy for conformational change, and then the subst rate is released from the protein. The second ATP is hydrolysed, allowing for a conformational reset and then substrate and ATP can bind again so that the process repeats.
Considering the sizes reported in the abovementioned literature, we supposed that the critical size should be confined in the range of 3.8 nm to 8 nm. Therefore, we started our work from 4.1 nm AuNPs to the bigger ones. Fortunately, we obtained the turning point with DRI decreased from 5 to 2 when we fabricated 5.4 nm AuNPs, and then we focused on these two different sized AuNPs (4.1 and 5.4 nm) to explore the size effect of AuNPs on overcoming MDR.18 Anticancer active molecule ANS and clinical drug 6-MP were conjugated with AuNPs to construct different sized NanoDDSs,19,20 which were further modified with the transmembrane peptide TAT (CYRGRKKRRQRRR) to improve the cellular uptake. Furthermore, the critical size of nanocarriers that could not be effectively pumped out by P-gp was identified by comparing anticancer activity, cellular uptake of nanoparticles, and ATP-dependent energy consumption during drug efflux process.
2. Experimental
All chemicals and reagents were analytical grade or the highest purity available and used without further purification. Ultrapure water was used throughout the experiments. HAuCl43H2O (≥ 49.0% Au basis), NaBH4 (98%), and sodium citrate were purchased from Sigma-Aldrich (USA). CYRGRKKRRQRRR (95%) was purchased from GL Biochem Ltd. (Shanghai, China). 6-MP (≥ 99%) was purchased from Aladdin (USA). ANS was synthesized according to our previous work.
2.1. Synthesis of AuNPs
AuNPs4.1 nm was fabricated with a method reported in previous literatures,11 with 10 mL (1%) of sodium citrate used. AuNPs5.4nm was synthesized as following: 2 mL of aqueous solutions of HAuCl4 (25 mM), sodium citrate solution (1%), and NaBH4 (0.075%) were added successively into 200 mL of deionized water which was heated to ~ 97°C.
2.2. Synthesis of ANS–TAT–AuNPs and 6-MP–TAT–AuNPs
The different sized ANS–TAT–AuNPs and 6-MP–TAT–AuNPs was fabricated with a modified typical process reported in our previous work,11 with 15mL ANS solution or 7.5 mL 6-MP solution (0.2 mg/mL, DMSO) dropwise, respectively. The final products were redisposed in DMSO and stored at −20°C.
2.3. ICP-OES quantitative detection
5 μL Au solution was transferred into glass tubes for acid digestion overnight or heated to 60 °C for 2 h until no bubbles were observed. The concentration of Au was determined with inductively coupled plasma optical emission spectroscopy (ICP-OES) (Varian, USA) at the characteristic absorption wavelength (242.794, 267.594 nm) with ICP-OES. The Au concentration was calculated with standard curve method.
2.4. Zeta potential detection
The zeta-potential of the samples with AuNPs 50 μM was measured in PBS with Nano ZS90 analyzer (Japan).
2.5. Cell culture
The parental breast cancer cells MCF-7 (KeyGEN BioTECH, Jiangsu, China) and DOX resistant cancer cells MCF-7/ADR (KeyGEN BioTECH, Jiangsu, China) were cultured as described in our previous work.11 The cells MCF-7/ADR cells were cultured in DOX-free medium for 2 weeks before the experiments.
2.6. Cell viability bioassay
Cytotoxicity was measured with standard methylthiazolyldiphenyl tetrazolium bromide (MTT) assay. MCF-7 and MCF-7/ADR cells were seeded in 96-well plates at a density of 5 × 10³ cells/well. After incubation with the NanoDDSs at different ANS or 6-MP concentrations, the medium was discarded and the cells were washed 3 times with PBS, and then 100 μL of fresh medium and 20 μL of 0.5 mg/mL MTT were added. After another 4 h incubation, the medium containing MTT was discarded, 100 μL of DMSO was added per well to dissolve the formazan. The optical intensity at 570 nm was recorded with EnSpire 2300 Multilabel Plate Reader. In the verapamil competitive experiment, the similar procedure was performed, except that the cells were pre-treated with 10 mM verapamil for 1 h.21
2.7. Cell apoptosis analysis
MCF-7 and MCF-7/ADR cells were seeded in 6-well plate to grow for 24 h, then treated cells with different NanoDDSs at 1/2 IC50 of ANS or 6-MP concentration. After treatment, harvested both floating and attached cells, centrifuged and washed cells with PBS. Added 500 μL of the binding solution into tubes and mixed with cell sedimentation, 5 μL of Annexin V-FITC and PI were added successively and kept it from light until instrument measurement (LSRFortessa, BD Biosciences, USA).
2.8. Cell uptake measurement
MCF-7 and MCF-7/ADR cells are seeded in 6-well plate and cultured with different NanoDDSs with AuNPs concentration fixed at 10 μM. The cells were washed 5 times with PBS before trypsin digestion to ensure the nanoparticles on the plate were completely removed, then centrifuged the cells. Using 1.5 mL media to dilute cells and calculated the number. Took 1 mL of cell suspension into glass tube, afterwards the cells were digest by acid digestion overnight. The solution was diluted to 10 mL and quantitatively detected with ICP-OES.
2.9. Confocal laser scanning microscopy
MCF-7 and MCF-7/ADR cells were cultured in 35 mm glass bottom dishes. The cells were pretreated with P-gp antibody (BD Pharmingen™) 20 μL/well for 1 h, and then cultured with fresh media containing ANS–TAT–AuNPs4.1nm and ANS–TAT–AuNPs5.4nm with concentration of ANS 20 μM. The cells were washed after 3 h incubation. The digital double stain images were acquired with Leica confocal microscope (TCSSP8, Leica Application Suite X Software). (For ANS λex = 405 nm, λem = 460 nm; for P-gp antibody, λex = 488 nm, λem = 561 nm).
2.10. Western blot
MCF-7 and MCF-7/ADR cells were plated in 6-well plate and incubated with different sizes of NanoDDSs at their 1/2 IC50 of ANS or 6-MP concentration for 24 h, with a non-treated cell as the control group. Cell collection, protein extraction, quantification, separation, membrane transfer and imaging were performed according to the Western Blot process. The cells were lysed with RIPA buffer containing PIC (protease inhibitor cocktail) and quantitative processes according to the instruction by BCA kits manufacture. Protein were separated by 6% SDS-PAGE gel and transferred onto PVDF membranes. Relevant primary antibodies for P-gp (sc-55510) and GAPDH (YM3029) were incubated at 4 °C overnight and then HRP-conjugated secondary antibody were incubated at 37 °C for 2 h. Finally, enzyme-linked chemiluminescence was used to image and target protein bands were imaged on FluorChem HD2 Chemilumilescent Imaging System (ProteinSimple, USA). The presented quantitative results were measured with Image J software.
2.11. P-gp ATPase activity assay
The P-gp ATPase activity was evaluated with the P-gp-Glo™ assay (Promega, Co., USA). According to the kit instructions, a series of working solution with P-gp membranes, MgATP and different NanoDDSs at the same Au concentration of 10 μM were prepared in advance and added into the 96-well plate in sequence. Verapamil and sodium orthovanadate were set as positive and negative group, respectively, and all the readings were normalized by the subtraction of negative group.22,23 After incubation at 37 °C for 40 min, the mixture was collected and centrifuged at 12000 rpm for 5 min then rejoined into the 96-well plate. 50 μL of ATP detection reagent was added in each detection well and incubated for an additional 20 min, followed by the luminescence measurement.
2.12. ATP level assay
The intracellular ATP concentration were analyzed with luminescent ATP detection assay kit (Abcam). The MCF-7/ADR cells were incubated with different NanoDDSs for 24 h at the same Au concentration of 10 μM. After treatments, the cells were washed and lysed. The mixture was centrifuged at 12000 rpm for 5 min, the supernatant was collected and used for the subsequent ATP quantification. The ATP was determined by use of a luciferin/luciferase assay which contains 50 μL cell lysate and 50 μL of ATP detection solution. The final ATP concentrations were calculated according to a standard curve established by the ATP standards.
2.13. UPLC-MS experiments
Metabolites extraction was performed by ultra performance liquid chromatography-mass spectrometer (UPLC-MS). For sample preparation, 4 mL of MCF-7/ADR cells were seeded in cell culture dishes. The cells were exposed to different sizes of 6-MP–TAT–AuNPs with a fixed 6-MP concentration of 1/2 IC50 for 2 h. After that, discarded the administration medium, meanwhile added 6 mL of methanol and placed the dishes at −80 °C for 20 min. Then the cells were scraped off on ice and centrifuged at 4 °C for 5 min. The supernatant was collected, and the precipitate was washed with another 2 mL methanol. Centrifuge again, all supernatant was combined and divided into four equal parts. Equal amount of cell extracts from different 6-MP–TAT–AuNPs sizes was vacuum dried and used as quality control (QC) for the following experiments. The samples were reconstituted in 100 μL of methanol/MS-grade water before UPLC-MS analysis. The UPLC/MS experiments, instrument parameter settings and detection conditions were carried out with the reference 32. UPLC-MS data were processed with Progenesis QI 2.0 software. The peaks of missing value were removed by the 80% rule. The final selected peak index with mass information were submitted to MetaboAnalyst and KEGG database for metabolites identification and analyze the metabolic pathway.24
3. Results and discussion
3.1. Characterization of AuNPs, ANS–TAT–AuNPs and 6-MP–TAT–AuNPs
The AuNPs with different sizes were fabricated with the method of reducing chloroauric acid by sodium borohydride. The average size of AuNPs was measured with Image J to be 4.1 ± 0.4 nm (denoted as AuNPs4.1nm) and 5.4 ± 0.4 nm (denoted as AuNPs5.4nm), respectively, through randomly counting of 1000 nanoparticles on the transmission electron micrographs (TEM) images (Fig. 1). Similarly, the average size of ANS–TAT–AuNPs was measured to be 4.4 ± 0.5 nm (denoted as ANS–TAT–AuNPs4.1nm) and 5.7 ± 0.5 nm (denoted as ANS–TAT–AuNPs5.4nm), respectively. The average size of 6-MP–TAT–AuNPs were 4.4 ± 0.5 nm (6-MP–TAT–AuNPs4.1nm) and 5.7 ± 0.6 nm (6-MP–TAT–AuNPs5.4nm), respectively. After TAT was attached, the mono-dispersity of the nanoDDSs was significantly improved, and their zeta potential changed from negative to positive (Table S1), implying an improved potential for cellular uptake. The drug loading was monitored with the UV-visible spectra (Fig. S1 and Fig. S2 in the ESI), and the loading rate of ANS was 22.7% and 22.4% for ANS–TAT–AuNPs4.1nm and ANS–TAT–AuNPs5.4nm, respectively. In the 6-MP loaded NanoDDS, the loading rate of 6-MP was 14.2% and 11.0%, respectively, for 6-MP–TAT–AuNPs4.1 nm and 6-MP–TAT–AuNPs5.4nm. Due to the chelating property of bidentate ANS with AuNPs via forming stronger Au–S and Au-N bonds, the drug loading rate of ANS is higher than that of 6-MP which binds to Au surface.
Fig. 1.

The images of transmission electron microscopy and distribution of the particle size of 4.1 and 5.4 nm AuNPs and corresponding NanoDDSs. (a) AuNPs4.1nm, (b) AuNPs5.4nm, (c) ANS–TAT–AuNPs4.1nm, (d) ANS–TAT–AuNPs5.4nm, (e) 6-MP–TAT–AuNPs4.1nm, (f) 6-MP–TAT–AuNPs5.4nm.
3.2. Cytotoxicity
The anti-proliferative activity of the above four NanoDDSs with different sizes and drugs were evaluated with standard MTT colorimetry, and the cellular inhibition rate against both parental breast cancer MCF-7 cells and DOX-resistant MCF-7/ADR cells were plotted versus log concentration, as shown in Fig. 2 and Fig. 3. The half inhibition concentration (IC50) values for MCF-7 and MCF-7/ADR and drug resistance index (DRI) were listed in Table 1. As shown, all the NanoDDSs showed a dose-dependent anticancer activity. The DRI of NanoDDSs based on AuNPs4.1nm was close to 5, while that of AuNPs5.4nm was about 2. The sensitivity of cancer cells to the chemotherapy can be classified into 3 levels according to DRI. DRI at 0 ~ 2 indicates sensitive cancer cells, 2 ~ 10 as moderately resistant cells, and more than 10 belongs to highly resistant cells.25,26 In the present work, 5.4 nm NanoDDSs (based on AuNPs5.4nm) showed an obvious advantage in overcoming MDR, which could treat MCF-7/ADR as sensitive cells. Therefore, the critical size of AuNPs in overcoming MDR was identified to be between 4.1 and 5.4 nm, as estimated preliminarily with cytotoxicity test. By taking into account the size of active site of P-gp for recognizing and binding drug in MDR cancer, 5.4 nm NanoDDSs did not match well with binding pocket of P-gp, so that it could avoid the drug efflux and increased intracellular drug concentration to perform anticancer function more effectively. Overall, the NanoDDSs with size larger than 5.4 nm showed more potency in MDR cancer chemotherapy, compared with that of smaller size nanoparticle as 4.1 nm NanoDDSs.
Fig. 2.

Cellular inhibition rate of different sized NanoDDSs after 24 h incubation of the ANS–TAT–AuNPs4.1nm with (a) MCF-7 cells and (b) MCF-7/ADR cells; ANS–TAT–AuNPs5.4nm with (c) MCF-7 cells and (d) MCF-7/ADR cells. Error bars indicate SD (n = 6/group, triplicated experiments). Log C means the logarithmic concentration of ANS.
Fig. 3.

Cellular inhibition rate of different sized NanoDDSs after 24 h incubation of the 6-MP–TAT–AuNPs4.1nm with (a) MCF-7 cells and (b) MCF-7/ADR cells; 6-MP–TAT–AuNPs5.4nm with (c) MCF-7 cells and (d) MCF-7/ADR cells. Error bars indicate SD (n = 6/group, triplicated experiments). Log C means the logarithmic concentration of 6-MP.
Table. 1.
IC50 of ANS–TAT–AuNPs and 6-MP–TAT–AuNPs after 24 h incubation and DRI of MCF-7/ADR cells.
| Samples | IC50/μM * |
DRI (W/O VRP)* | DRI (W VRP)* | ||
|---|---|---|---|---|---|
| MCF-7 | MCF-7/ADR | MCF-7/ADR (W VRP)* | |||
| ANS–TAT–AuNPs4.1nm | 9.0 ± 0.7 | 45.7 ± 3.5 | 19.5 ± 4.7 | 5.1 | 2.2 |
| 6-MP–TAT–AuNPs4.1nm | 7.4 ± 2.3 | 44.4 ± 6.5 | 20.2 ± 1.6 | 6.0 | 2.7 |
| ANS–TAT–AuNPs5.4nm | 10.3 ± 1.2 | 25.2 ± 3.2 | 25.9 ± 4.2 | 2.4 | 2.5 |
| 6-MP–TAT–AuNPs5.4nm | 11.2 ± 1.5 | 20.5 ± 0.2 | 20.1 ± 2.2 | 1.8 | 1.8 |
calculated based on the concentration of ANS or 6-MP. W VRP: pre-treated with verapamil at 10 μM for 1 h; W/O VRP: without verapamil pre-treatment.
3.3. Cell Apoptosis
Apoptosis is a distinctive pattern of programmed cell death, which promotes cell growth, evolution, and maintains cell homeostasis. It is well-known that many chemotherapeutic drugs can induce cell apoptosis to kill cells and treat cancer.27 To further assess the size effect of NanoDDSs on cancer treatment, Annexin V-FITC/PI double staining was used with flow cytometry to measure the cell apoptosis. Annexin V has a high affinity to phosphatidylserine, and is one of the sensitive indicators for early apoptosis. PI is a nuclear dye, and it passes through the broken membrane into the nucleus and bound with DNA. PI staining could distinguish the cells in the middle and advanced stages of apoptosis. The apoptotic rate of both MCF-7 and MCF-7/ADR cells were measured after incubation with equivalent concentration of ANS or 6-MP (Fig. 4). Both ANS and 6-MP loaded NanoDDSs induced high apoptosis in sensitive MCF-7 cells, with less difference between the 4.1 and 5.4 nm NanoDDSs treatment. For ANS loaded NanoDDSs, the sum apoptotic rate was 16.0 % and 21.9 % in 4.1 and 5.4 nm NanoDDSs groups, respectively. For 6-MP loaded NanoDDSs, the sum apoptotic ratio was 26.6 % and 30.4 % in 4.1 nm and 5.4 NanoDDSs groups, respectively. Overall, MCF-7/ADR cells showed a lower apoptotic rate than MCF-7 cells. However, it was noted that there was a remarkable different apoptotic rate between the 4.1 and 5.4 nm NanoDDSs. ANS–TAT–AuNPs5.4nm induced 15.4% apoptosis in 5.4 nm NanoDDSs groups, which was 1.8-fold higher compared to 8.6% apoptosis rate in 4.1 nm NanoDDS (highly significant difference, p < 0.01). 6-MP–TAT–AuNPs5.4nm induced 10.7% apoptosis, with 1.5-fold higher compared to 7.2% in 4.1 nm NanoDDSs (significant difference, p < 0.05). Thus, 5.4 nm NanoDDSs induced more obvious apoptosis than 4.1 nm NanoDDSs in MDR cells. The results suggested that the size of the NanoDDSs imposed less effect on the anticancer activity in MCF-7 cell, while it affected MCF-7/ADR cell greater. The difference of this phenomenon is due to overexpression of P-gp on the membrane of MCF-7/ADR cell. The larger size in 5.4 nm NanoDDSs resulted in relatively poor recognition and interaction between the P-gp and NanoDDSs, and thus it resulted in higher concentration of drug accumulated in the cells to induce higher apoptosis in the MDR cells, compared with 4.1 nm NanoDDSs which could bind stronger with P-gp and resulted in more drug pumped outside MDR cells.
Fig. 4.

The cellular apoptosis of MCF-7 and MCF-7/ADR cells after incubation with different sizes of (a) 6-MP–TAT–AuNPs and (b) ANS–TAT–AuNPs. *, p < 0.05; **, p < 0.01; #, p > 0.05 (n = 3), error bars indicate SD (n = 3/group). Different NanoDDSs at 1/2 IC50 of ANS or 6-MP concentration.
3.4. Competitive inhibition with verapamil (VRP)
As one of the first generation of P-gp inhibitor, verapamil is a substrate of P-gp.28,29 It can competitively occupy the binding site of P-gp and thus is able to reverse completely the drug-resistance in vitro at concentrations of approximately 5–10 μM.30 Combined with anticancer drugs, VRP can be used to reverse MDR of tumors to achieve effective treatment. Herein we utilized the competitive substrate VRP to explore the binding of different sized AuNPs with P-gp. The IC50 and DRI of the MCF-7/ADR cells pre-treated with VRP before incubation with NanoDDSs are also listed in Table 1. The IC 50 values of ANS–TAT–AuNPs4.1nm and 6-MP–TAT–AuNPs4.1nm were lowered from 45.7 ± 3.5 and 44.4 ± 6.5 μM to 19.5 ± 4.7 and 20.2 ± 1.6 μM, respectively, after pre-treatment with VRP. Consequently, the DRI was also remarkably decreased to 2.2 and 2.7 from 5.1 and 6.0, respectively. It suggests the prior binding of VRP with P-gp declined the recognition between P-gp and 4.1nm NanoDDSs and thus reduced the drug efflux in the 4.1 nm NanoDDSs treated cells. The intracellular drug accumulation increased and gave rise to the increased cytotoxicity. Therefore, the drug-resistance, i.e DRI of MCF-7/ADR cells was lowered because the efflux function of P-gp was inhibited by VRP.
In contrast, no change of the IC50 and DRI was observed in ANS–TAT–AuNPs5.4nm and 6-MP–TAT–AuNPs5.4nm groups after pre-treatment with VRP. This result suggested that the inhibition of P-gp function could not affect the response of MDR cells to the cytotoxic effect of 5.4 nm NanoDDSs. In other words, 5.4 nm NanoDDSs could not ideally bind with P-gp or may not match well the active pocket of P-gp, due to their larger size (> 5 nm). Thus the recognition and binding between P-gp and NanoDDSs, intracellular drug accumulation, and cytotoxicity of NanoDDSs were thus not disturbed by VRP.
Overall, the VRP competition results suggest that smaller NanoDDSs (AuNPs4.1nm) may interact well with P-gp and more drug was pumped out through P-gp, due to good size matching with the active pocket of P-gp if no VRP occupied the binding site of P-gp. In contrast, the binding of larger NanoDDSs (AuNPs5.4nm) was not influenced by VRP pre-treatment, suggesting that it can avoid more effectively efflux from P-gp. Thus, large size NanoDDSs can overcome MDR and kill MDR cancer cells, due to unmatched size with the active pocket of P-gp.
3.5. Cellular uptake
Overexpression of P-gp and active drug efflux results in reduced intracellular concentration of the anticancer drug and suboptimal therapeutic effectiveness in drug-resistant cancer cells. To further explore the difference of the NanoDDSs in overcoming MDR which may be caused by the nanoparticle size, the cellular uptake of the NanoDDSs was examined quantitatively with confocal laser scanning microscopy (CLSM) (Fig. 5a and Fig. 5b). The P-gp monoclonal antibody was used to partially block the binding site of P-gp, and then the CLSM images of fluorescent ANS–TAT–AuNPs4.1nm and ANS–TAT–AuNPs5.4nm was photographed after incubation with MCF-7/ADR cells (The expression level of P-gp was confirmed with Western blotting, Fig. S3 in the ESI). It is noted that the fluorescence of the ANS–TAT–AuNPs4.1nm was weak, compared to that of the group pre-treated with P-gp antibody. When P-gp was blocked by P-gp antibody, the drug efflux of ANS–TAT–AuNPs4.1nm by P-gp were reduced, the cellular ANS–TAT–AuNPs4.1nm increased, and therefore the fluorescence from ANS–TAT–AuNPs4.1nm enhanced. It indicated that the 4.1 nm NanoDDSs was more prone to efflux by the P-gp. For 5.4 nm NanoDDSs, the intracellular fluorescence intensity of the ANS–TAT–AuNPs5.4nm showed no remarkable difference between the ANS–TAT–AuNPs5.4nm along group and P-gp antibody pre-treated group. It is because the unmatched size between the active site of P-gp and ANS–TAT–AuNPs5.4nm, which imposed negligible effect on the drug efflux of ANS–TAT–AuNPs5.4nm by P-gp. The results suggest that the drug efflux in MDR cells was closely dependent on the size of the NanoDDSs.
Fig. 5.

The confocal laser scanning images and (b) quantitative results of cellular up of different size AuNPs of ANS–TAT–AuNPs4.1nm and ANS TAT AuNPs5.4nm with concentration of ANS 20 μM after 24 h incubation with the resistant MCF-7/ADR cells with or without P-gp antibody pretreatment. (c) The cellular uptake of ANS–TAT–AuNPs and 6-MP–TAT–AuNPs with AuNPs concentration fixed at 10 μM after incubation with MCF-7/ADR cells for 24 h, measured with ICP-OES. *, p < 0.05, **, p < 0.01, #, p > 0.05, error bars indicate SD (n = 3/group).
The cellular uptake of the NanoDDSs, specifically, intracellular content of Au, was further quantified by ICP-OES (Fig. 5c). For both 4.1 nm NanoDDSs, the intracellular AuNPs concentration is lower than that in the 5.4 nm NanoDDSs group. It indicates that the efflux process was related to the nanoparticle size. Due to the size match between the nanoparticle and active site of P-gp, the smaller NanoDDSs were prone to efflux by P-gp, compared with the larger nanoparticles. Therefore, the intracellular accumulation of AuNPs5.4nm was more than AuNPs4.1nm.
3.6. ATPase Activity
As one of ATP-binding cassette transporters, P-gp exports the substrates/drugs out of the cancer cells through an ATP-dependent conformational change.31 P-gp consists of nucleotide binding domains (NBDs) and transmembrane domains (TMDs).32–34 The NBDs are responsible for binding and hydrolysing ATP via an ATPase, and thus providing energy for substrate translocation or drug efflux from the cytoplasm to the extracellular space.
The binding of substrate to the TMDs stimulates the ATPase activity.35 Therefore, the ATPase activity of MCF-7/ADR cells after treatment with NanoDDSs was measured by P-gp Glo™ assay to compare the affinity of different sized NanoDDSs to the P-gp (Fig. 6). In P-gp Glo™ assay, an ATPase inhibitor Na3VO4 was set as a negative control, because the vanadate could competitively bind and inhibit the activity of ATPase. VRP was set as a positive control, because it could cause a significant increase in P-gp ATPase activity, which was attributed to the binding of VRP in the active site of P-gp. The comparison of decrease in relative light unit (ΔRLU) indicates the effect of tested samples on the activity of ATPase. The ΔRLUbasal reflects the basal P-gp ATPase activity that may be caused by transporting endogenous lipids or hydrophobic peptides.36 The larger ΔRLU of the test group than ΔRLUbasal suggests that the test sample is a stimulator of P-gp ATPase to activate the catalytic cycle for ATP hydrolysis. The smaller one suggests an inhibitor of P-gp ATPase activity. As shown in Fig. 6, the ΔRLUs of both ANS–TAT–AuNPs4.1nm and the 6-MP–TAT–AuNPs4.1nm were remarkably higher than ΔRLUbasal (p < 0.05). It indicated that the ATPase was activated, which was attributed to the strong interaction between 4.1 nm NanoDDSs and the active site of P-gp. This interaction created a demand for ATP from an elevated level of ATP hydrolysis via stimulating ATPase activity. However, the 5.4 nm NanoDDSs group showed a comparable ΔRLU to ΔRLUbasal, implying that the interaction between 5.4 nm NanoDDSs and the active site of P-gp was weak, which did not activate effectively the ATPase activity to catalyse ATP hydrolysis, due to unmatched size between the nanoparticle and binding site of P-gp.
Fig. 6.

The effects of ANS–TAT–AuNPs and 6-MP–TAT–AuNPs with different sizes on the P-gp ATPase activity, illustrated by the change in luminescence after incubation with P-gp Glo™ Assay. Error bars indicate SD (n = 3/group). Different NanoDDSs at the same Au concentration of 10 μM.
3.7. Intracellular ATP level
ATP depletion appears to be essential for the proper functioning of P-gp to transport a variety of substrates across intra- and extracellular membranes, during which ATP hydrolysis occurs at NBDs while substrate binding and efflux occurs at TMDs. Therefore, we measured intracellular ATP level to assess the P-gp efflux activity.37,38 The intracellular ATP concentration was detected after 12 h incubation of the P-gp overexpressed MCF-7/ADR cells with different NanoDDSs (Fig. 7). For both ANS and 6-MP loaded NanoDDSs, the intracellular ATP concentrations in the 5.4 nm NanoDDSs were 2.43 and 2.56 μM, respectively, while that for 4.1 nm NanoDDSs were 2.05 and 2.07 μM, respectively. Intracellular ATP concentration in the 5.4 nm NanoDDSs was higher than that in the 4.1 nm NanoDDSs, indicating the intracellular residual ATP after 5.4 nm NanoDDSs treatment was more than that after 4.1 nm NanoDDSs treatment. It is obvious that different sized NanoDDSs showed different capability on ATP consumption in the MCF-7/ADR cells. Drug binding stimulates ATPase activity to catalyse the ATP hydrolysis to supply energy for drug efflux, therefore, the amount of intracellular ATP is largely determined by the P-gp mediated drug efflux. Due to its matched size, the 4.1 nm NanoDDSs interacted well with active site of P-gp. It stimulated P-gp to alternate the conformation with energy supplied by ATP hydrolysis to sequentially bind and excrete drug out of cells, therefore, the intracellular ATP level was lower due to consumption by drug efflux. In contrast, the interaction between the 5.4 nm NanoDDSs and P-gp was not ideal due to unmatched size, it depleted less ATP and the drug efflux was less effective, compared to the 4.1 nm NanoDDSs.
Fig. 7.

The intracellular ATP concentration of MCF-7/ADR cells after incubation with ANS–TAT–AuNPs and 6-MP–TAT–AuNPs with different nanoparticles size. *, p < 0.05; **, p < 0.01; #, p > 0.05/ error bars indicate SD (n = 3/group). Different NanoDDSs at the same Au concentration of 10 μM.
Combination of measurement of ATPase activity and intracellular ATP level suggests that the interaction/recognition between the NanoDDSs and P-gp efflux process were closely related to the size of the NanoDDSs. Based on the size match, the smaller NanoDDSs interacted more tightly to P-gp, induced conformation changes in NBDs, and activated ATPase to catalyse the ATP hydrolysis,39 while the larger NanoDDSs bound more loosely to the P-gp without obvious ATPase activation and ATP depletion. Therefore, the critical size of NanoDDSs binding with P-gp in the present work was identified to be between 4.1 and 5.4 nm.
3.8. Cell Metabolism
P-gp is an energy-dependent efflux protein on cell membrane. The energy for conformational change and reset to bind and discharge the substrate/drug is provided with the hydrolysis of ATP. The intracellular production of ATP mainly relies on aerobic glycolysis.40,41 Accordingly, the cellular energy metabolism was explored to further validate the size effect of the NanoDDSs on drug efflux mediated by P-gp. Intracellular stable ATP supply is ensured with effectively and maximum utilization of the biological energy of substrates such as glucose, fatty acids, and amino acids. After a series of activation and metabolism, galactose is ultimately converted to glucose-6-phosphoric acid, and then glucose-6-phosphoric acid participates in the glycolysis process to generate and store energy in the form of glycogen.42 Glycerol is the main fermentation product of glucose and galactose. The redox in mitochondria and cytoplasm also involves glycerol-3-phosphate, which is further esterified into phosphatidate (PA), phosphatidylcholine (PC), phosphatidylethanolamine (PE), phosphatidylglycero-phosphate (PG), and phosphatidylserine (PS). These glycerophospholipids are the main structural lipids in cell membrane, regulating transportation, signal transduction, and modulating protein functions.
In the present work, the metabolites of MCF-7/ADR cells after being treated with 4.1 nm and 5.4 nm NanoDDSs were screened with UPLC-MS and analysed with KEGG database. The remarkable difference in galactose metabolism, lipid metabolism, and protein metabolism was observed between the 4.1 nm and 5.4 nm NanoDDSs treated groups (Fig. 8, Fig. S4, and Table S2 in the ESI). In the energy-related metabolic pathways such as starch and sucrose metabolism, galactose metabolism, and glycerophospholipid metabolism, the abundance of multiple metabolites including D-galactonate, PA, and PS decreased significantly in the 4.1 nm NanoDDSs as compared to 5.4 nm NanoDDSs. The reduction of D-galactonate suggested the elevated consumption of galactose resulted from intracellular oxidative phosphorylation, which produced ATP to support the recognition and interaction between P-gp and 4.1 nm NanoDDSs. During this process, ATP was demanded in cells, therefore, the metabolites involved in the energy-production, as well their upstream and downstream compounds, were affected in the metabolic pathway. It is noted that the metabolites PS, PA, PE, and PC not only were important parts of the bilayer phospholipids, but also participated in the cell energy metabolism. This indicated that the drug efflux mediated by P-gp after the 4.1 nm NanoDDSs treatment was an energy consumption process, associated with functional structure alteration of cell membranes, which was manifested by the glycerophospholipid metabolism pathway fluctuation.
Fig. 8.


(a) Metabolic pathway diagram showing altered metabolites in MCF-7/ADR cells. Downward arrows indicate significantly lower levels (p < 0.05) in 6-MP—TAT—AuNPs4.1nm treated MCF-7/ADR. (b) Heat map of UPLC*MS detected metabolites in MCF-7/ADR cells treated with 6-MP—TAT—AuNPs4.1nm and 6-MP—TAT—AuNPs5.4nm, respectively, with corrected p < 0.05. The color bar represents the UPLC/MS peak abundance. 6-MP–TAT–AuNPs with a fixed 6-MP concentration of 1/2 IC50. *: 2-(acetylamino)-1,5-anhydro-2-deoxy-3-O-b-D-galactopyranosyl-D-arabino-Hex-1-enitol.
4. Conclusions
We fabricated two sets of NanoDDSs based on AuNPs with different sizes of 4.1 and 5.4 nm, and their potency in overcoming P-gp mediated MDR was explored and compared to identify a critical size which is conducive to decreasing DRI. The smaller AuNPs with 4.1 nm showed less potency in overcoming MDR with DRI about 5 in the DOX-resistant MCF-7/ADR cells. The 5.4 nm NanoDDSs showed high capability to overcome MDR with DRI about 2. Our experiments demonstrated that the size effect of nanoparticles plays an important role in the drug efflux in MDR cells. The critical size in overcoming P-gp mediated MDR is between 4.1 and 5.4 nm. The smaller AuNPs (< 4.1 nm) could be recognized well by P-gp due to the size match with the active site of P-gp, while the larger ones (> 5.4 nm) could not bind tightly to P-gp due to unmatched size between the nanoparticle and the pocket of P-gp. This work provides a more accurate guidance on nanoparticle size selection and design in applying functional nanomaterials in overcoming drug resistance.
Supplementary Material
Acknowledgements
The authors thank the NSFC (21571133, 21171120), Beijing Natural Science Foundation Program and Scientific Research Key Program of Beijing Municipal Commission of Education (KZ201710025024), Natural Science Foundation of Beijing Municipality (7132020), and the Intramural Research Program, National Institute of Biomedical Imaging and Bioengineering, National Institutes of Health.
Footnotes
Conflicts of interest
There are no conflicts to declare.
Electronic Supplementary Information (ESI) available: Fig. S1–S4, See DOI: 10.1039/x0xx00000x
Notes and references
- 1.Wang SP, Qiu JG, Shi Z, Wang YT, and Chen MW, Biotechnol. Adv, 2015, 33, 224–241. [DOI] [PubMed] [Google Scholar]
- 2.Sun YT, Wang CY, Meng Q, Liu ZH, Huo XK, Sun PY, Sun HJ, Ma XD, Peng JY, and Liu KX, J. Cell. Physiol, 2018, 233, 3066–3070. [DOI] [PubMed] [Google Scholar]
- 3.Wang DF, Rong WT, Lu Y, Hou J, Qi SS, Xiao Q, Zhang J, You J, Yu SQ, and Xu Q, ACS Appl. Mater. Interfaces, 2015, 7, 3888–3901. [DOI] [PubMed] [Google Scholar]
- 4.Huang P, Wang GC, Su Y, Zhou YF, Huang W, Zhang R, and Yan DY, Theranostics, 2019, 9, 5755–5768. [DOI] [PMC free article] [PubMed] [Google Scholar]
- 5.Jing LJ, Qu HJ, Wu DQ, Zhu CJ, Yang YB, Jin X, Zheng J, Shi XS, Yan XF, and Wang Y, Theranostics, 2018, 8, 2683–2695. [DOI] [PMC free article] [PubMed] [Google Scholar]
- 6.Zhou L, Wang H, and Li YP, Theranostics, 2018, 8, 1059–1074. [DOI] [PMC free article] [PubMed] [Google Scholar]
- 7.Chen HC, Wang YR, Yao YR, Qiao SL, Wang H, and Tan NH, Theranostics, 2017, 23, 3781–3793. [DOI] [PMC free article] [PubMed] [Google Scholar]
- 8.Ding F, Songkiatisak P, Cherukuri PK, Huang T, and Xu XHN, ACS Omega, 2018, 3, 1231–1243. [DOI] [PMC free article] [PubMed] [Google Scholar]
- 9.Gopisetty MK, Kovacs D, Igaz N, Ronavari A, Belteky P, Razga Z, Venglovecz V, Csoboz B, Boros IM, Konya Z, and Kiricsi M, J. Nanobiotech, 2019, 17, 9. [DOI] [PMC free article] [PubMed] [Google Scholar]
- 10.Liu JH, Zhao YX, Guo QQ, Wang Z, Wang HY, Yang YX, and Huang YZ, Biomaterials, 2012, 33, 6155–6161. [DOI] [PubMed] [Google Scholar]
- 11.Wang RH, Bai J, Deng J, Fang CJ, and Chen XY, ACS. Appl. Mater. Interfaces, 2017, 9, 5828–5837. [DOI] [PubMed] [Google Scholar]
- 12.He CB, Lu KD, Liu DM, and Lin WB, J. Am. Chem. Soc, 2014, 136, 5181–5184. [DOI] [PMC free article] [PubMed] [Google Scholar]
- 13.Yhee JY, Song S, Lee SJ, Park SG, Kim KS, Kim MG, Son S, Koo H, Kwon IC, Jeong JH, Jeong SY, Kim SH, and Kim K, J. Control. Release, 2015, 198, 1–9. [DOI] [PubMed] [Google Scholar]
- 14.Murthy RSR, and Shah NM, J. Biomed. Nanotechnol, 2007, 3, 1–17. [Google Scholar]
- 15.Yue J, Feliciano TJ, Li WL, Lee A, and Odom TW, Bioconjugate Chem, 2017, 28, 1791–1800. [DOI] [PMC free article] [PubMed] [Google Scholar]
- 16.Li MJ, Nath A, and Atkins WM, Biochemistry, 2017, 56, 2506–2517. [DOI] [PMC free article] [PubMed] [Google Scholar]
- 17.Silva R, Vilas-Boas V, Carmo H, Dinis-Oliveira RJ, Carvalho F, Bastos ML, and Remiao F, Pharmacol. Ther, 2015, 149, 1–123. [DOI] [PubMed] [Google Scholar]
- 18.Vijayakumar S, and Ganesan S, Toxico. Enviro. Chem, 2013, 95, 277–287. [Google Scholar]
- 19.Bai J, Wang RH, Qiao Y, Wang AD, and Fang CJ, Drug Des. Devel. Ther, 2017, 11, 2227–2237. [DOI] [PMC free article] [PubMed] [Google Scholar]
- 20.Park JW, and Shumaker-Parry JS, ACS Nano, 2015, 9, 1665–1682. [DOI] [PubMed] [Google Scholar]
- 21.Zhu JY, Wang RM, Lou LL, Li W, Tang GH, Bu XZ, and Yin S, J. Med. Chem, 2016, 59, 6353–6369. [DOI] [PubMed] [Google Scholar]
- 22.Meyer MR, Wagmann L, Schneider-Daum N, Loretz B, Carvalho CDS, Lehr CM, and Maurer HH, Biochem. Pharmacol, 2015, 94, 220–226. [DOI] [PubMed] [Google Scholar]
- 23.Dai Z, Yao Q, and Zhu L, ACS Appl. Mater. Interfaces, 2016, 8, 12661–12673. [DOI] [PubMed] [Google Scholar]
- 24.Liu LY, Yin TL, Chen Y, Li YH, Yin L, Ding JL, Yang J, and Feng HL, J. Steroid Biochem, 2019, 185, 142–149. [DOI] [PubMed] [Google Scholar]
- 25.Grandi M, Geroni C, and Giuliani F, Br. J. Cancer, 1986, 54, 515–518. [DOI] [PMC free article] [PubMed] [Google Scholar]
- 26.Zhang XT, Yashiro M, Qiu H, Nishii T, Matsuzaki T, and Hirakawa K, Anticancer Res, 2010, 30, 915–921. [PubMed] [Google Scholar]
- 27.Duan YC, Zheng YC, Li XC, Wang MM, Ye XW, Guan YY, Liu GZ, Zheng JX, and Liu HM, Eur. J. Med. Chem, 2013, 64, 99–110. [DOI] [PubMed] [Google Scholar]
- 28.Karwatsky J, Lincoln MC, and Georges E, Biochemistry, 2003, 42, 12163–12173. [DOI] [PubMed] [Google Scholar]
- 29.Loo TW, and Clarke DM, J. Biol. Chem, 2001, 276, 14972–14979. [DOI] [PubMed] [Google Scholar]
- 30.Huang M, and Liu GT, Cancer Lett, 1999, 135, 97–105. [DOI] [PubMed] [Google Scholar]
- 31.Rosenberg MF, Callaghan R, Ford RC, and Higgins CF, J. Biol. Chem, 1997, 272, 10685–10694. [DOI] [PubMed] [Google Scholar]
- 32.Verhalen B, Dastvan R, Thangapandian S, Peskova Y, Koteiche HA, Nakamoto RK, Tajkhorshid E, and Mchaourab HS, Nature, 2017, 543, 738–741. [DOI] [PMC free article] [PubMed] [Google Scholar]
- 33.Higgins CF, and Linton KJ, Nat. Struct. Mol. Biol, 2004, 11, 918–926. [DOI] [PubMed] [Google Scholar]
- 34.Aller SG, Yu J, Ward A, Weng Y, Chittaboina S, Zhuo RP, Harrell PM, Trinh YT, Zhang QH, Urbatsch IL, and Chang G, Science, 2009, 323, 1718–1722. [DOI] [PMC free article] [PubMed] [Google Scholar]
- 35.Ambudkar SV, Dey S, Hrycyna CA, Ramachandra M, Pastan I, and Gottesman MM, Annu. Rev. Pharmacol. Toxicol, 1999, 39, 361–398. [DOI] [PubMed] [Google Scholar]
- 36.Sharom FJ, DiDiodato G, Yu X, and Ashbourne KJ, J. Biol. Chem, 1995, 270, 10334–10341. [DOI] [PubMed] [Google Scholar]
- 37.Pan L,R, and Aller SG, Sci. Rep, 2015, 5, 7880. [DOI] [PMC free article] [PubMed] [Google Scholar]
- 38.Shintre CA, Pike ACW, Li QH, Kim JI, Barr AJ, Goubin S, Shrestha L, Yang J, Berridge G, Ross J, Stansfeld PJ, Sansom MSP, Edwards AM, Bountra C, Marsden BD, von Delft F, Bullock AN, Gileadi O, BurgessBrown NA, and Carpenter EP, Proc. Natl. Acad. Sci. USA, 2013, 110, 9710–9715. [DOI] [PMC free article] [PubMed] [Google Scholar]
- 39.Loo TW, and Clarke DM, J. Biol. Chem, 2001, 276, 36877–36880. [DOI] [PubMed] [Google Scholar]
- 40.Ramsay EE, Hogg PJ, and Dilda PJ, Pharm. Res, 2011, 28, 2731–2744. [DOI] [PubMed] [Google Scholar]
- 41.Lagunas R, Biochimica. Et. Biophysica. Acta, 1976, 440, 661–674. [DOI] [PubMed] [Google Scholar]
- 42.Xu QW, Liu LP, Vu H, Kuhls M, Aslamkhan AG, Liaw A, Yu Y, Kaczor A, Ruth M, Wei C, Imredy J, Lebron J, Pearson K, Gonzalez R, Mitra K, and Sistare FD, Chem. Res. Toxicol, 2019, 32, 1528–1544. [DOI] [PubMed] [Google Scholar]
Associated Data
This section collects any data citations, data availability statements, or supplementary materials included in this article.