

Abstract
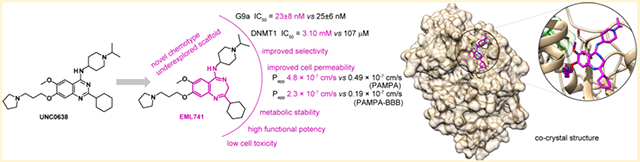
Since the discovery of compound BIX01294 over 10 years ago, only a very limited number of nonquinazoline inhibitors of H3K9-specific methyltransferases G9a and G9a-like protein (GLP) have been reported. Herein, we report the identification of a novel chemotype for G9a/GLP inhibitors, based on the underinvestigated 2-alkyl-5-amino- and 2-aryl-5-amino-substituted 3H-benzo[e][1,4]diazepine scaffold. Our research efforts resulted in the identification 12a (EML741), which not only maintained the high in vitro and cellular potency of its quinazoline counterpart, but also displayed improved inhibitory potency against DNA methyltransferase 1, improved selectivity against other methyltransferases, low cell toxicity, and improved apparent permeability values in both parallel artificial membrane permeability assay (PAMPA) and blood–brain barrier-specific PAMPA, and therefore might potentially be a better candidate for animal studies. Finally, the co-crystal structure of GLP in complex with 12a provides the basis for the further development of benzodiazepine-based G9a/GLP inhibitors.
Graphical Abstract
INTRODUCTION
Lysine methylation on histone tails plays a primary role in the regulation of chromatin structure and gene transcription, in both physiological and pathological conditions.1–5 Besides epigenetic regulation of gene expression, lysine methylation is also involved in the regulation of cellular signal transduction pathways. In fact, a number of nonhistone proteins are also methylated on Lys residues, leading to changes in their function or stability.6,7
Protein lysine methyltransferases (PKMTs or KMTs) catalyze the addition of a methyl group from S-adenosyl-l-methionine (SAM) to the ε-amino group of the targeted lysine residue in histone and nonhistone substrates, leading to mono-, di-, or trimethylation.8–11 This process does not modify the charge state of the residue. Instead, lysine methylation increases the bulkiness and hydrophobicity of the amino group and improves its hydrogen bond formation potential.10
As a result, lysine methylation has dramatic effects on the interactions of the modified protein with other proteins and thus on its physiological function.10 Depending on the methylation state and the position of the modified residue, histone lysine methylation can lead to either activation or repression of gene expression and transcription.2,11–14 In general, methylation of istone H3 lysine 9 and 27 (H3K9 and H3K27) is a typical hallmark of transcription repression, whereas methylation of histone H3 lysine 4, 36, and 79 (H3K4, H3K36, and H3K79) is associated with transcription activation.15–18
G9a (also known as lysine methyltransferase 1C or euchromatic histone lysine N-methyltransferase 2) and G9a-like protein (GLP, also known as lysine methyltransferase 1D or euchromatic histone methyltransferase 1) are two closely related PKMTs with approximately 80% sequence identity in their respective suppressor of variegation 3–9 enhancer-of-zeste trithorax (SET) domains.19,20 It has been shown that the heterodimeric complex of G9a and GLP is the main functional methyltransferase in mouse embryonic stem cells, depositing mono- and dimethylated H3K9 (H3K9me1 and H3K9me2).21,22 Besides H3K9, other histone substrates, such as histone H1,23,24 H3K27,25–27 and H3K56,28 have been reported. The two enzymes can also methylate a variety of nonhistone proteins,29 including the tumor suppressor p53,30 sirtuin 1,31 the adenosinetriphosphatase associated with various cellular activities helicase reptin,32 the estrogen receptor α,33 the chromodomain Y-like protein,34 the myogenic differentiation 1,35 the widely interspaced zinc finger motifs protein,34 as well as G9a itself.36 Furthermore, G9a and/or GLP have been reported to play roles37 in germ cell development and meiosis,38 embryo development,21,22 tumor cell growth and metastasis,30,39–42 cocaine-induced plasticity,43 cognition and adaptive behavior,12,44 immune response,45,46 and provirus silencing.47 Many human diseases such as cancer, inflammatory diseases, and neurodegenerative disorders are associated with dysregulation of G9a and/or GLP.12,13,40,44,48,49 In addition to the many common biological activities and regardless of the high sequence homology, G9a and GLP also possess distinct physiological and pathophysiological functions.50–53
With the aim of investigating the biological functions of G9a and GLP and testing the therapeutic hypotheses associated with them, a variety of small-molecule inhibitors of G9a/GLP have been developed in the past decade with a different degree of selectivity.19,20,54–71 Such inhibitors could be categorized into two different groups: group A, including compounds binding to the SAM cofactor pocket, and group B, including binders of the substrate pocket (Chart 1).67,71
Chart 1.
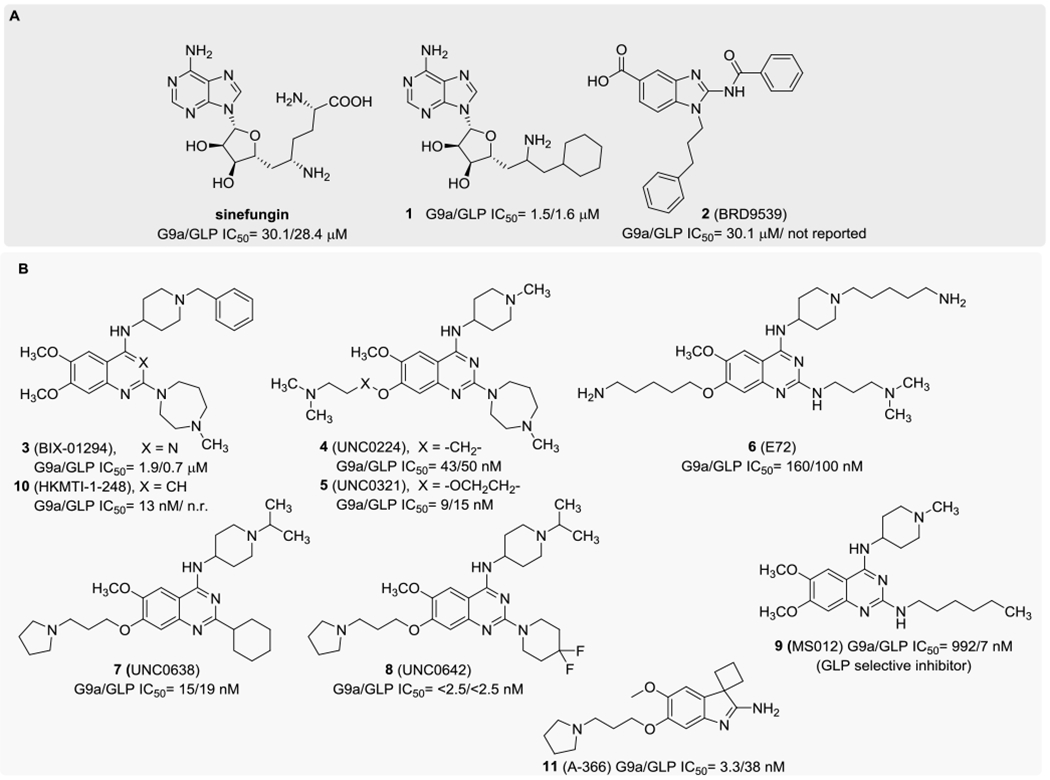
Structures of SAM-Competitive (A) and Substrate-Competitive (B) G9a/GLP Inhibitorsa
aIC50 values are highly dependent on the assay conditions used.
The sinefungin derivative 163 (and its analogues)72 and the 2-substituted benzimidazole 2 (BRD9539, Chart 1)62 belong to the first group73 and inhibit G9a with IC50 values of 1.6 and 6.3 μM, respectively. Despite their interesting activity, they showed a low selectivity profile, being active also toward other epigenetic enzymes. Moreover, extensive characterization of these inhibitors in additional assays has not been reported.
On the other hand, the second group includes the 2,4-diamino-6,7-dimethoxyquinazoline derivative 3 (BIX01294, Chart 1),20 identified in 2007 via high-throughput screening as the first G9a/GLP inhibitor. It inhibits GLP and G9a with IC50 values of 0.7 and 1.9 μM, respectively, being basically inactive against other two SAM-dependent enzymes, namely, lysine N-methyltransferase SUV39H1(H320R) and arginine methyltransferase protein arginine methyltransferase 1 (PRMT1), up to a 10 μM concentration.19,20 Furthermore, this compound is responsible for the reduction of H3K9me2 mark in bulk histones in several cell lines. Nevertheless, 3 shows a toxicity/function ratio of <6 and this feature strongly limited its use as a G9a chemical probe.59 With the aim of overcoming this cytotoxicity problem, different groups worked on the optimization of the 2,4-diamino-6,7-dimethoxyquinazoline scaffold that was decorated with several substituents, leading to structure–activity relationship (SAR) elucidations and to the identification of compounds 4 (UNC0224),54 5 (UNC0321),55 and 6 (E72).56
These molecules are characterized by a strongly improved G9a enzymatic inhibition profile, with IC50 values of 43, 9, and 160 nM, respectively, evaluated in enzyme-coupled S-adenosyl-l-homocysteine (SAH) detection (ECSD) assays. In particular, compound 5 is one of the most powerful G9a inhibitors reported to date, with a Morrison Ki of 63 pM. Despite the pronounced activity, all of these molecules suffer from a low cellular activity, mostly due to permeability problems.56,59 This hurdle was later overcome with the further optimization of this chemical series that led to the discovery of derivative 7 (UNC0638), which showed IC50 < 15 nM in ECSD assays and bound the enzyme in the substrate-binding groove, being competitive with the peptide substrate (Ki = 3.0 ± 0.05 nM) and noncompetitive with the cofactor SAM.59 In addition, compound 7 was reported to be inactive up to a 10 μM concentration against other lysine and arginine methyltransferases, as well as against nonepigenetic targets. Consequently, compound 7 was successfully employed as a chemical probe in several cell lines to identify the specific roles of G9a/GLP in biological mechanisms and disease-causing processes.42,74–76 Unfortunately, the poor pharmacokinetic properties of UNC0638 limited its employment in animal studies. Therefore, further optimization led to the development of the more promising compound 8 (UNC0642, Chart 1), which displayed IC50 < 2.5 nM and improved the in vivo pharmacokinetic properties.58 More recently, structure–activity relationship studies on a novel series of compounds based on the quinazoline scaffold have resulted in the discovery of compound 9 (MS012), which was reported as remarkably selective for GLP over G9a (> 140-fold) in biochemical assays.69
All of these notable efforts in improving the quinazoline derivatives have not been paralleled by the identification of new valuable chemical scaffolds. Indeed, there are only very few literature reports on potent G9a inhibitors based on nonquinazoline structures. Besides the classical isosteric replacement of the quinazoline ring of 3 with a quinoline one (which led, e.g., to compound 10, HKMTI-1-248; Chart 1),70,77 only the spiro(cyclobutane-1,3′-indol)-2′-amine derivative 11 (A-366) was reported as a potent G9a/GLP inhibitor, selective over 17 other methyltransferases. Despite its low structure similarity with compound 7, it showed a similar binding mode and was competitive with the peptide substrate and noncompetitive with SAM.61 However, no further development studies of this scaffold have been reported to date. Novel chemotypes for G9a/GLP inhibitors are, therefore, highly desirable.
In this respect, a common medicinal chemistry strategy for discovering structurally novel chemotypes is the modification of the central core structure of a known active compound, also referred to as “scaffold hopping approach”.78,79 Indeed, a change of the central chemical template is often advantageous to overcome detrimental and adverse properties associated with the parent molecule (e.g., potency plateau, selectivity, pharmacokinetics, etc.).
Given the inherent advantages of scaffold replacement, while pursuing our efforts toward the identification of potent and selective histone lysine methyltransferases inhibitors,80–84 we resolved to replace the quinazoline moiety of 7 with a benzodiazepine framework, often considered as a “privileged” structural motif.85 Herein, we report the results of our efforts in the design, synthesis, biochemical evaluation, and structural characterization of the binding mode for a small series of compounds bearing the benzodiazepine nucleus. In addition, we report the results of competition assays for the most potent enzyme inhibitor as well as the effects on selected cell lines.
RESULTS AND DISCUSSION
Design and Molecular Modeling Studies.
Our scaffold replacement strategy applied to the structure of compound 7 (UNC0638) is depicted in Figure 1.
Figure 1.
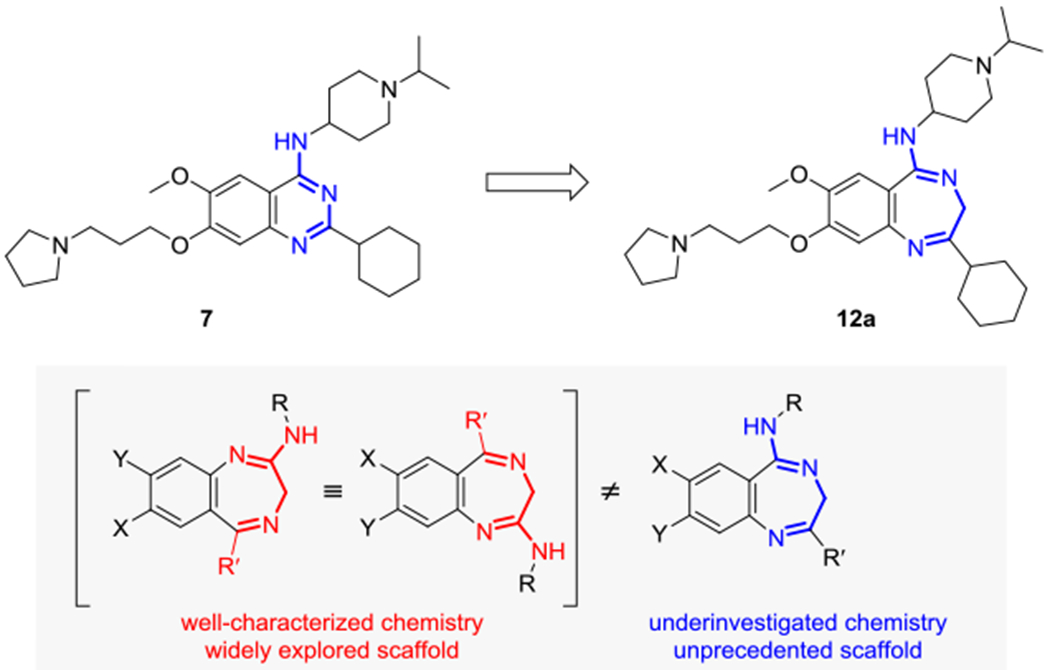
Ring expansion of UNC0368.
Insertion of a methylene unit into the quinazoline ring resulted in the ring-expanded 1,4-benzodiazepine derivative 12a. It is worth noting that despite the impressive diversity of 2-amino-5-alkyl- and 2-amino-5-aryl-substituted 3H-benzo[e]-[1,4] diazepines prepared to date, the chemistry of the isomeric 2-alkyl-5-amino- and 2-aryl-5-amino-substituted 3H-benzo[e]-[1,4] diazepine scaffold has been only rarely investigated86 and, to the best of our knowledge, it has never been exploited in medicinal chemistry (Figure 1).
Before synthesis and screening, we performed an in silico preevaluation of our scaffold replacement hypothesis taking advantage of the presence of several X-ray studies in which inhibitors, featuring a quinazoline scaffold, were co-crystallized in complex with either G9a or GLP. Thus, compound 12a was virtually docked, through the AutoDock4 (AD4) software,88 into the structures of G9a and GLP to see whether this compound is able to recapitulate the binding pose adopted by the corresponding quinazoline co-crystal ligands into the protein binding cavity. In these simulations, we selected the highest-resolution X-ray structures available for GLP (PDB code 5VSF; 1.7 Å)70 and G9a (PDB code 5VSC; 1.4 Å)70 in complex with a quinazoline ligand, (co-crystal ligands N2-cyclopentyl-6,7-dimethoxy-N2-methyl-N4-(1-methylpiperidin-4-yl) quinazoline-2,4-diamine and 6,7-dimethoxy-N2-methyl-N4-(1-methylpiperidin-4-yl)-N2-propylquinazoline-2,4-diamine for 5VSF and 5VSC, respectively). As predicted by docking studies, 12a should be able to recapitulate the binding pose of the co-crystal quinazoline compounds (Figure 2) and engage the same interaction pattern, thereby supporting our design hypothesis.
Figure 2.

(a) Binding mode of 12a (yellow sticks) as predicted by docking studies within the G9a structure having PDB code 5VSC (orange ribbons). For comparison, the co-crystal ligand is also depicted (6,7-dimethoxy-N2-methyl-N4-(1methylpiperidin-4-yl)-N2-propylquinazoline-2,4-diamine; magenta sticks). (b) Binding mode of 12a (yellow sticks) as predicted by docking studies within the GLP structure having PDB code 5VSF (green ribbons). For comparison, the co-crystal ligand is also depicted (N2-cyclopentyl-6,7-dimethoxy-N2-methyl-N4-(1-methylpiperidin-4-yl)quinazoline-2,4-diamine; cyan sticks). The images were generated using PyMOL.87
Encouraged by the molecular modeling results, we then synthesized compound 12a along with a small set of ring-expanded 1,4-benzodiazepine derivatives (compounds 12b, 13a, and 13b; Figure 3) to obtain early SARs. For comparison and to further validate the predicted binding mode of 12a, we designed and synthesized the corresponding 3H-benzo[f][1,5]-diazepine isomer (compound 14; Figure 3).
Figure 3.

1,4-Benzodiazepine derivatives 12–14.
Chemistry.
The synthetic protocol for the preparation of compounds 12a, 12b, 13a, and 13b is reported in Scheme 1. The key scaffolds for the preparation of the target compounds were the 3,4-dihydro-5H-benzo[1,4]diazepin-5-ones 16a and 16b, which were obtained in high yields starting from 4-(benzyloxy)-5-methoxy-2-nitrobenzoic acid 15 using a continuous flow protocol previously developed by us.86 The removal of the benzyl group from 16a and 16b was accomplished under strong acidic conditions and yielded the unprotected derivatives 17a and 17b. Alkylation with 3-chloro-iodopropane at the 8-hydroxy position furnished the 3-chloropropoxy derivatives 18a and 18b, which were straightforwardly converted into the corresponding 5-ethoxy analogues 19a and 19b by alkylation with triethyloxonium tetrafluoroborate. The introduction of the pyrrolidine ring was achieved by microwave (MW)-assisted nucleophilic substitution reaction in tetrahydrofuran (THF) and in the presence of NaI and K2CO3. The resulting derivatives 20a and 20b were reacted with 1-isopropylpiperidin-4-amine in acetic acid to yield the 2-substituted-N-(1-isopropylpiperidin-4-yl)-7-methoxy-8-(3-(pyrrolidin-1-yl)propoxy)-3H-benzo[e][1,4]-diazepin-5-amines, target compounds 12a and 12b.
Scheme 1.

Synthesis of Derivatives 12a, 12b, 13a, and 13ba
aReagents and conditions: (a) 2-amino-1-cyclohexylethan-1-one or 2-amino-1-phenylethan-1-one, 1-hydroxybenzotriazole, N,N,N′,N′-tetramethyl-O-(1H-benzotriazol-1-yl)uronium hexafluorophosphate, N,N-diisopropylethylamine, dry THF/dimethylformamide (DMF) 4:1, 0 °C to room temperature (r.t.), 18 h (70–85%);86 (b) H-Cube Pro, full-H2 mode, 30 mm × 4 mm i.d. catalyst (5% Ru/C) cartridge, THF, 80 °C, 50 bar, 0.3 mL/min;86 (c) CH2Cl2/trifluoroacetyl (TFA), 1:4, 50 °C, 4h (68–75%); (d) 1-chloro-3-iodopropane, K2CO3, dry DMF, r.t., 18 h (67–77%); (e) triethyloxonium tetrafluoroborate, Na2CO3, dry CH2Cl2, r.t., 15 min (67–70%); (f) pyrrolidine, NaI, K2CO3, dry THF, MW (80 °C, 90 min) (65–74%); (g) 1-isopropylpiperidin-4-amine, AcOH, MW (120 °C, 1 h), (30–31%); (h) NaBH4, THF/MeOH, 0 °C to r.t., 2 h (84–90%); (i) Lawesson’s reagent, dry toluene, 85 °C, 2 h, then K2CO3, iodoethane, 85 °C, 2 h (72–77%).
The dihydro-analogues 13a and 13b were obtained according to a slight modification of the above-described procedure. Treatment with sodium borohydride of compounds 17a and 17b furnished the reduced derivatives 21a and 21b, which were converted into the 3-chloropropoxy derivatives 22a and 22b as described above. Any attempt to transform the benzodiazepin-5-ones 22a and 22b into the corresponding 5-ethoxy derivatives with triethyloxonium tetrafluoroborate was unsuccessful, yielding the N-alkylated compounds as main products.
Therefore, we treated compounds 22a and 22b with Lawesson’s reagent and the obtained thiolated derivatives were alkylated in situ with iodoethane. The resulting 5-ethylthio derivatives 23a and 23b were then reacted with pyrrolidine to obtain compounds 24a and 24b. Finally, the addition of 1-isopropylpiperidin-4-amine furnished the target compounds 13a and 13b.
The synthetic protocol for the preparation of compound 14 is depicted in Scheme 2. 4-(Benzyloxy)-5-methoxy-2-nitroaniline 25, obtained by Curtius rearrangement from the corresponding benzoic acid 15, was treated with 5-(cyclohexanecarbonyl)-2,2-dimethyl-1,3-dioxane-4,6-dione to give the β-keto amide 26. Iron sulfate-mediated reduction and concomitant cyclization furnished the 3H-benzo[f][1,5]diazepine-2-one derivative 27. Following the above-described procedures, the removal of the benzyl group and subsequent alkylation of 7-hydroxy position of derivative 28 with 3-chloro-iodopropane furnished the chloropropoxy derivative 29. Microwave-assisted nucleophilic substitution reaction in THF and in the presence of NaI and K2CO3 introduced the pyrrolidine ring (30). Lawesson’s reagent transformed the benzo[f][1,5]diazepine-2-one nucleus of 30 in the corresponding benzodiazepine-2-thione 31. Finally, target compound 14 was obtained by reaction with 1-isopropylpiperidin-4-amine in THF and in the presence of triethylamine and mercury(II) chloride.
Scheme 2.
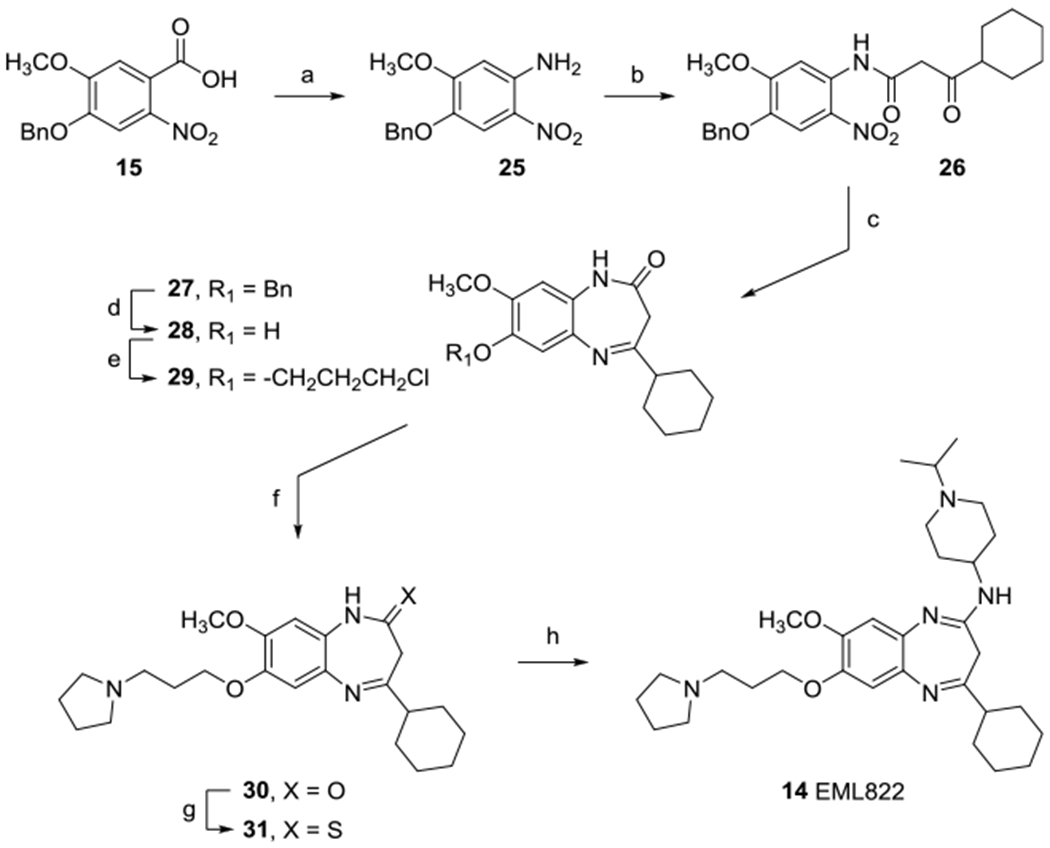
Synthesis of Derivative 14a
aReagents and conditions: (a) diphenylphosphoryl azide (DPPA), K2CO3, dry DMF, 80 °C, 1 h (83%); (b) 5-(cyclohexanecarbonyl)-2,2-dimethyl-1,3-dioxane-4,6-dione, toluene, MW (100 °C, 1 h) (86%); (c) FeSO4·7H2O, NH4OH, EtOH, reflux, 2 h (79%); (d) CH2Cl2/TFA 1:4, 50 °C, 3 h (95%); (e) 1-chloro-3-iodopropane, K2CO3, dry DMF, r.t., 18 h (81%); (f) pyrrolidine, NaI, K2CO3, dry THF, MW (80 °C, 3 h) (97%); (g) Lawesson’s reagent, dry toluene, 85 °C, 3 h (65%); (h) 1-isopropylpiperidin-4-amine, tetraethylammonium, HgCl2, dry THF, reflux, 3 h (33%).
G9a Inhibition Assays.
The capability of the synthesized compounds 12a, 12b, 13a, 13b, and 14 to inhibit G9a activity was evaluated using a peptide-based AlphaLISA assay, measuring the levels of H3K9 dimethylation,89 and the results are summarized in Table 1.
Table 1.
G9a Inhibition Evaluation of Compounds 7, 12a, 12b, 13a, 13b, and 14
 | ||
|---|---|---|
| compd | –R | G9a IC50 (μM)a |
| 12a | cyclohexyl | 0.023 ± 0.008 |
| 12b | phenyl | 1.090 ± 0.092 |
| 13a | cyclohexyl | 0.955 ± 0.087 |
| 13b | phenyl | 2.091 ± 0.094 |
| 14 | 2.984 ± 0.053 | |
| 7 | 0.025 ± 0.006 | |
AlphaLISA was used for all IC50 determinations against human recombinant G9a (0.1 nM, final concentration). Compounds were tested in 10-concentration IC50 mode, each performed in triplicate, with twofold serial dilutions. IC50 values are mean ± standard deviation (SD) of three determinations. Histone H3 (1–21) peptide, biotinylated (100 nM, final concentration) and SAM (15 μM, final concentration), were used as substrate and cofactor, respectively.
We were pleased to find that the ring-expanded 1,4-benzodiazepine derivative 12a exhibited substantially the same activity (IC50 = 23 ± 8 nM) compared to the quinazoline analogue 7 (IC50 = 25 ± 6 nM; Table 1 and Figure 4), thus validating our design strategy and corroborating the results of the computational analysis.
Figure 4.

Concentration–response inhibition of G9a by compounds 12a (left) and 7 (right). The compounds were tested in 10-concentration IC50 mode with twofold serial dilutions. Data were analyzed using GraphPad Prism software (version 6.0) for curve fitting, using a log(inhibitor) vs response-variable slope (four parameters) equation, and the SD were calculated from three independent experiments.
The substitution of the cyclohexyl moiety with a phenyl ring (compound 12b) or the replacement of the 3H-benzo[1,4]-diazepine core with the corresponding 2,3-dihydro-analogue (compound 13a) resulted in approximately 50-fold reduced activity. These negative effects seemed to be additive, as the activity of compound 13b, featuring both replacements, was 100-fold lower than that of 12a (Table 1). Finally, the 3H-benzo[e][1,4]diazepine scaffold of 12a appeared to be crucial, as the corresponding 3H-benzo[f][1,5]diazepine isomer 14 exhibited 130-fold weaker inhibition of G9a (Table 1).
To rationalize these data, molecular docking studies were also conducted on derivatives 12b, 13a, 13b, and 14. Results of this inspection indicated that, differently from 12a, compounds 12b and 13b place the electron-rich phenyl ring in a negatively charged protein region lined by D1074, D1078, and D1088, thereby causing unfavorable electrostatic interactions (Figure S1, Supporting Information). These SAR data are in line with what already achieved for the quinazoline congeners, where substitution of the alkyl chain in the corresponding position with a phenyl ring is detrimental for the inhibitory activity.56,70
Of note, the loss of the insaturation in the 3H-benzo[1,4]-diazepine core (13a and 13b) results in the formation of a chiral compound which is also more flexible than the corresponding saturated analogue (12a and 12b). Interestingly, for each enantiomer of 13a and 13b, a certain difficulty was found in converging toward a well-defined binding pose and this could be ascribed to the increased ring flexibility, which, at least in this case, should be the reason for the loss of potency. As for compound 14, the hydrogen-bonding interaction with D1083 is lost due to the secondary amine switch from position 4 to position 5, thereby explaining why this ligand is the less potent G9a inhibitor among the newly discovered compounds.
We noted that the concentration–response inhibition curve of compound 12a (Hill slope, −2.7; Figure 4) is even steeper than the one obtained with compound 7 (Hill slope, −1.3). Knowing that a steep dose–response curve, often indicated by a high (in absolute value) Hill coefficient, could be an indication of artifacts,90 we resolved to further investigate the inhibition by 12a, in particular to rule out the possibility of aggregation-base inhibition, although in our enzyme inhibition assays, 0.01% Tween-20 was added to the running buffer in all experiments to reduce false positives from detergent-sensitive, nonspecific aggregation-based binding. To this aim, we first analyzed all compounds 12–14 for known classes of assay interference compounds.91 All derivatives were not recognized as pan assay interference compounds (PAINS) according to the SwissADME web tool (http://www.swissadme.ch),92 the Free ADME-Tox Filtering Tool (FAF-Drugs4) program (http://fafdrugs4.mti.univ-paris-diderot.fr/),93 and the “False Positive Remover” software (http://www.cbligand.org/PAINS/),94 neither as aggregators according to the software “Aggregator Advisor” (http://advisor.bkslab.org/).95 Then, we used the Alphascreen TruHits kit to check if compound 12a behaved as a false positive in ALPHA assays. This kit is able to identify compounds that belong to one of these classes: singlet oxygen quenchers, color quenchers, aggregators, and other light scatters. Compound 12a (as well as compound 7) did not reduce the ALPHA signal with respect to the control (Figure S2, Supporting Information).
We also resolved to assess direct binding of 12a to G9a enzyme using two different biophysical methods, microscale thermophoresis (MST, Figure 5a,b) and surface plasmon resonance (SPR, Figure 5c,d). Both the direct binding measurements demonstrated specific binding between 12a and G9a (Figure 5b,d, respectively). Again, to reduce false positives from detergent-sensitive, nonspecific aggregation-based binding, detergents (0.05 and 0.005% Tween-20, respectively) were added to the running buffer in all experiments. The equilibrium dissociation constant (KD) of the 12a/G9a complex was 1.13 ± 0.20 μM ( Figure 5b) in the MST assay and 63.8 ± 0.95 μM (Figure 5d) in the SPR assay. This is not uncommon since KD values are strongly dependent on the analysis method and the setup used. Kinetic dissociation (koff) and association (kon) constants were also measured (Figure 5d).
Figure 5.

Direct binding measurements of the interaction between G9a and compounds 7 (left) and 12a (right). (a, b) MST binding affinity assays were performed as described in Experimental Section. Representative dose–response curves of 7 (a) and 12a (b) binding to G9a are shown; Fnorm, normalized fluorescence. Experiments were repeated independently three times. Reported KD is the mean ± SD of three independent experiments. (c, d) Sensorgrams obtained from the SPR interaction analysis of compounds 7 (c) and 12a (d) binding to immobilized G9a. Each compound was injected at eight different concentrations (1.56, 3.12, 6.25, 12.5, 25, 50, 100, and 200 μM). The equilibrium dissociation constants (KD) were derived from the ratio between kinetic dissociation (koff) and association (kon) constants.
We next determined the selectivity of derivative 12a versus a panel of epigenetic enzymes, i.e., the lysine methyltransferases GLP and lysine methyltransferase 5A (KMT5A)/SETD8, the lysine demethylase 4A (KDM4A)/JMJD2A, the arginine methyltransferases PRMT1 and PRMT3, and the lysine acetyltransferase 3B (KAT3B)/p300. The inhibition of 12a toward these selected enzymes was assessed at two different concentrations (10 and 25 μM), and 7 was used as reference compound (Figure 6). Similarly to what was previously reported for compounds 7 and 8,58,59 we expected compound 12a to be a highly potent inhibitor of GLP activity on the basis of the high sequence identity between G9a and GLP.96 Indeed, 12a displayed a similar high inhibition potency against G9a (97% inhibition at 10 μM and 98% at 25 μM) and GLP (95% inhibition at 10 μM and 98% at 25 μM; Figure 6 and Table S1, Supporting Information).
Figure 6.

Inhibitory activity profiles of compound 12a and reference 7 toward G9a, GLP, SETD8, JMJD2A, PRMT1, PRMT3, and p300 at two different fixed concentrations (10 and 25 μM).
Importantly, all of the other selected enzymes were only poorly (or not at all) inhibited (Figure 6), thus confirming that the replacement of the quinazoline moiety of 7 with the benzodiazepine scaffold of 12a not only preserved but also improved the selectivity profile. In fact, compound 12a showed no appreciable inhibition of the H4K20 monomethyltransferase SETD8 (2.5% inhibition at 10 μM and 21% at 25 μM), whereas compound 7 showed a ~50% inhibition even at the lowest tested concentration (49% inhibition at 10 μM and 71% at 25 μM; Figure 6 and Table S1, Supporting Information).
DNA Methyltransferase 1 (DNMT1) Inhibition Assays.
A direct binding between DNA methyltransferase 1 (DNMT1), a protein-catalyzing methylation of C5-cytosine of DNA, and G9a has been reported.97 The two enzymes actively cooperate in cell division, promoting transcriptional silencing of target genes97,98 and reactivating tumor suppressor genes.99 It has been reported that the transcription factor Snail recruits both G9a and DNMT1 to the E-cadherin promoter for DNA methylation, leading to transcriptional silencing of E-cadherin, which is associated with the aberrant activation of epithelial–mesenchymal transition (EMT) and cellular migration and invasion in triple-negative breast cancer (TNBC) cells.100 Moreover, DNMT1 inhibition synergizes with G9a inhibition (either pharmacologic or small interference RNA-mediated) in reducing cell proliferation.101,102 Interestingly, compound 7 was found to inhibit DNMT1 at high micromolar concentration (IC50 = 107 μM, using a radioactive methyl transfer assay).59 Therefore, we resolved to explore also the capability of compound 12a to inhibit DNMT1 and, to this aim, we used a similar assay format to that used for compound 7, using S-adenosyl-l-homocysteine (SAH—the reaction product of SAM) as a reference compound. For comparison, we also tested the compound against DNA methyltransferase 3a (DNMT3a) and DNA methyltransferase 3b (DNMT3b), which are de novo methyltransferases adding methyl groups in unmethylated genomic sequences at CpG dinucleotides, whereas DNMT1 is responsible for the maintenance of methylation patterns during cell division, with a preference for hemimethylated CpG dinucleotides.103–105
We were pleased to find that 12a inhibits DNMT1 with a potency nearly 2 orders of magnitude higher (IC50 = 3.10 ± 0.08 μM; see Figure 7) than the quinazoline counterpart 7,59 while being inactive against both DNMT3a and DNMT3b. This confirmed that the replacement of the quinazoline moiety of 7 with the benzodiazepine scaffold of 12a also improved the inhibitory potency against DNMT1.
Figure 7.

Concentration–response inhibition of DNMT1 by compound 12a. The compound was tested in 10-concentration IC50 mode with threefold serial dilutions. Data were analyzed using GraphPad Prism software (version 6.0) for curve fitting, using a log(inhibitor) vs response-variable slope (four parameters) equation, and the SD were calculated from three independent experiments.
Kinetics Measurements and Mechanism of Inhibition Studies.
Molecular modeling studies and enzymatic assay results suggest that 1,4-benzodiazepine- and quinazoline-based G9a inhibitors may share the same inhibition mechanism. To substantiate this hypothesis, we studied the mechanism of action (MOA) of inhibitor 12a by determining Michaelis–Menten kinetic parameters associated with both the peptide substrate and cofactor SAM. These experiments were performed using various SAM or histone H3 peptide concentrations while the concentration of the other substrate was kept constant.
Although nonlinear regression is often recommended for accurate determination of the Vmax and Km values,106 aiming at studying the MOA of 12a, we used linearized double-reciprocal Lineweaver–Burk plots, which are still extremely useful for diagnosing the mechanistic details of multisubstrate enzymes and for determining the mode of interaction between an enzyme and an inhibitor.107 Figure 8 shows the double-reciprocal Lineweaver–Burk plots at three different concentrations of inhibitor 12a (0, 7.25, and 14.5 nM). At fixed H3 peptide concentration and varying concentration of SAM (Figure 8A), the lines corresponding to the different inhibitor concentrations intersect the y axis at three different points, with the Vmax value decreasing with increase of inhibitor concentration. This is a diagnostic signature of noncompetitive inhibition pattern against the cofactor SAM (Ki = 3.6 ± 0.6 nM; see secondary plots reported in Figure S3, Supporting Information).108 On the other hand, at fixed SAM concentration and varying concentration of H3 peptide (Figure 8B), the y-intercept value (i.e., 1/Vmax) is constant but the slope (KM/Vmax) and x-intercept (−1/KM) values of the line change with inhibitor concentration. This is diagnostic of competitive inhibition with respect to histone H3 peptide substrate (Ki = 13.8 ± 1.7 nM; see secondary plots presented in Figure S3, Supporting Information).108
Figure 8.

(A) Plot of 1/V vs 1/[SAM] at a fixed H3 concentration (100 nM), and three different concentrations of 12a showing noncompetitive inhibition; 12a Ki = 3.6 ± 0.6 nM, α Ki = 1.1 ± 0.2 nM, SAM apparent KM = 164 ± 21 μM. (B) Plot of 1/V vs 1/[H3] at a fixed SAM concentration (15 μM), and three different concentrations of 12a showing competitive inhibition; 12a Ki = 13.8 ± 1.7 nM, H3 apparent KM = 1.6 ± 0.3 μM.
Chemical and Metabolic Stability and Cell Permeability.
Before further biological characterization, we first evaluated the chemical stability of compound 12a. High-performance liquid chromatography (HPLC) analysis revealed that the compound did not decompose after exposure to phosphate-buffered saline (PBS) over a period of 72 h (Figure S4, Supporting Information). Compound 12a was also tested for in vitro metabolic stability. The results summarized in Table 2 illustrate that the compound was generally stable showing a percentage of the parent compound turnover of 2.25 ± 0.44% in human microsomes, even lower than that of compound 7 (2.93 ± 0.18%).
Table 2.
Microsomal Stabilities of 12a and 7
| compound | R2 | human microsomesa |
|---|---|---|
| 12a (EML741) | 0.9997 | 2.25 ± 0.44 |
| 7 (UNC0638) | 0.9997 | 2.93 ± 0.18 |
Expressed as a percentage of the parent compound turnover.
Then, we evaluated the cell permeability of 12a and 7 with the well-validated parallel artificial membrane permeability assay (PAMPA) technique,109–111 using the highly permeable drug propranolol and the poorly permeable drug furosemide as positive and negative controls, respectively. Compound 12a showed good apparent permeability value (Papp) of 4.8 × 10⁻⁷ cm/s, higher than that of 7 (Papp = 0.49 × 10⁻⁷ cm/s; Table 3). In addition, compound 12a was also tested in the blood–brain barrier-specific PAMPA (PAMPA–BBB), a widely validated robust, high-throughput and cost-effective method for predicting the passive transport-controlled blood–brain barrier permeability of compounds by measuring their apparent permeability through a porcine brain lipid extract impregnated on a solid filter support, used as an artificial lipid membrane.112,113 Again, 12a showed a good Papp value of 2.3 × 10⁻⁷ cm/s.
Table 3.
Permeability Values of 12a and 7
| # | PAMPA Papp (cm/s) | PAMPA–BBB Papp (cm/s) |
|---|---|---|
| 12a (EML741) | 4.8 × 10⁻⁷ | 2.3 × 10⁻⁷ |
| 7 (UNC0638) | 0.49 × 10⁻⁷ | 0.19 × 10⁻⁷ |
| propranolol | 54 × 10−7 | 52 × 10−7 |
| furosemide | u.d.l.a | u.d.l.a |
Under detection limit.
Assessment of Functional Potency and Cell Toxicity in Various Cell Lines.
After assessing the chemical stability and cell permeability of compound 12a, we turned our attention to investigating its cellular effects. We resolved to assess cell toxicity and functional potency of the inhibitor in two human breast adenocarcinoma cell lines, MCF-7 and the triple-negative MDA-MB-231, which possess robust H3K9me2 levels, as well as in the human glioblastoma U-343 cell line. To this aim, we incubated the three cell lines with different concentrations of compounds 7 and 12a (from 0.05 to 50 μM) for 24, 48, and 72 h and assessed cell viability using the 3-(4,5-dimethylthiazol-2-yl)-2,5-diphenyltetrazolium bromide (MTT) assay (Figure 9). We observed that up to 5 μM, the tested concentrations of compound 12a did not significantly reduce the number of metabolically active MDA-MB-231 or U-343 cells in comparison to vehicle, even after 72 h. A similar effect was observed in MCF-7 cells after 24 h of incubation, with a slight progressive increase of toxicity after 48 and 72 h. Also, we were pleased to find that the toxicity of 12a was comparable to or lower than that of 7, particularly at the highest tested concentrations. (Figure 9).
Figure 9.

Cell toxicity of compound 12a in various cell lines. MCF-7, MDA-MB-231, and U-343 cells were treated for 24, 48, and 72 h with compounds 7 and 12a at concentrations of 0.05, 0.5, 5, and 50 μM. The cell viability was assessed by measuring the mitochondrial-dependent reduction of MTT to formazan. Data are reported as mean ± SD of at least three independent experiments.
We next investigated the functional potency of compound 12a in reducing cellular levels of H3K9me2. Cells were incubated for the indicated times (48 or 72 h) with 12a (0.5 and 5 μM) or the reference compound 7 (0.5 μM), and the histone extracts were then immunoblotted with a H3K9me2-specific antibody. As represented in Figure 10, we observed that, overall, compound 12a induced a marked and both concentration- and time-dependent reduction in the dimethylation of lysine H3K9 in the three cell lines, with a good separation of functional potency and cell toxicity.
Figure 10.
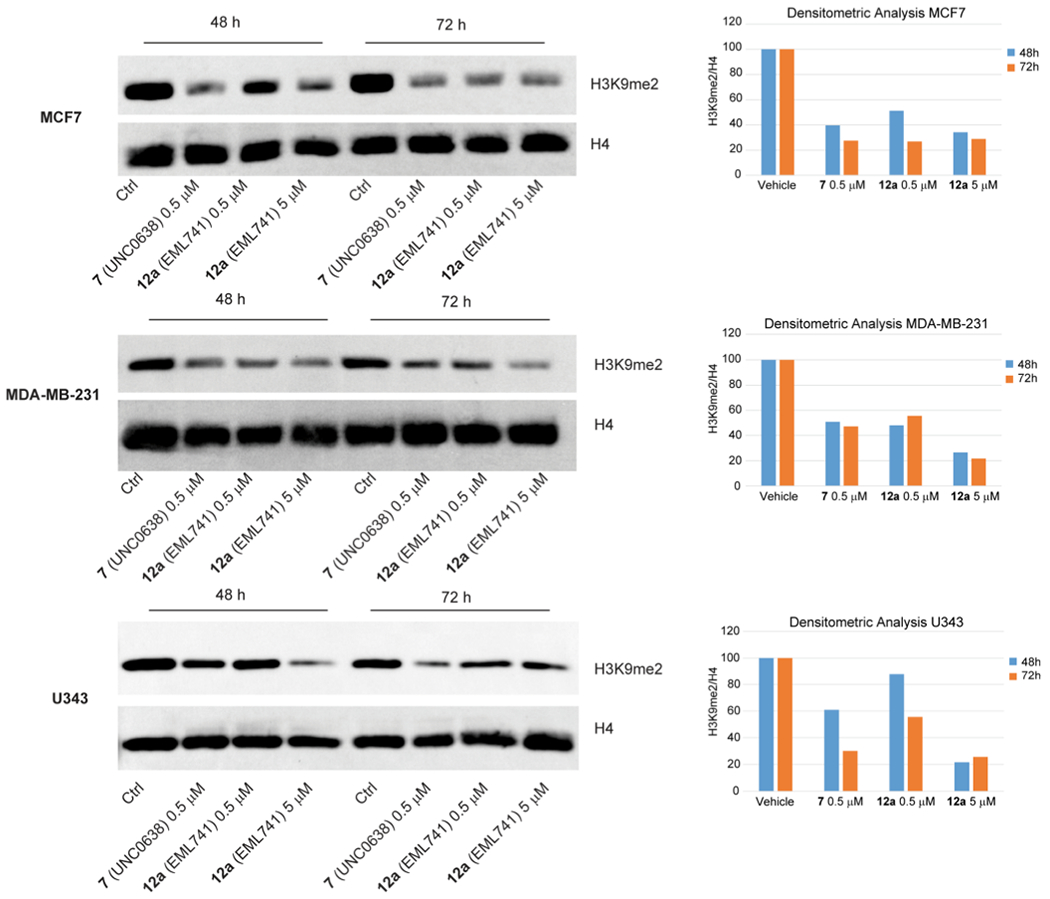
Western blot analyses performed with compound 12a at 0.5 and 5 μM for 48 and 72 h on the levels of H3K9me2 in histone extracts from MCF-7 and MDA-MB-231 human breast adenocarcinoma cells (top and middle, respectively), and U-343 human glioblastoma cells (bottom). Methylation was detected by immunoblotting with H3K9me2-specific antibody. Total histone H4 was used to check for equal loading. Compound 7 (0.5 μM) was used as a reference compound. Signals were detected using the ImageQuant LAS 4000 (GE Healthcare, Waukesha, WI) digital imaging system and quantified by ImageQuantTL software; total histone H4 levels were used for normalization.
Co-crystal Structure of 12a in Complex with GLP.
Finally, we co-crystallized compound 12a in complex with GLP catalytic SET domain in the presence of SAH. The ternary complexes were crystallized in two space groups, P212121 and P3121, and we determined the structures to the resolution of 1.59 and 1.95 Å, respectively (Table 4). There are two complexes in the crystallographic asymmetric unit of both space groups. Pairwise comparison indicated that the four complexes were highly similar with root-mean-square (rms) deviation (rmsd) of less than 0.4 Å across 258 pairs of aligned Cα atoms. Here, we will describe the interaction between 12a and GLP in one of the complexes in the higher-resolution structure (P212121 space group).
Table 4.
Summary of X-ray Data Collection from SERCAT Beamline 22-ID at Wavelength = 1Å and Refinement Statisticsa
| GLP/12a/SAH | crystal #1 | crystal #2 |
|---|---|---|
| PDB ID | 6MBO | 6MBP |
| space group | P212121 | P3121 |
| cell dimensions (Å) | 87.73, 88.31, 95.12 | 95.51, 95.51, 147.20 |
| α, β, γ (deg) | 90, 90, 90 | 90, 90, 120 |
| resolution (Å) | 40.05–1.59 (1.65–1.59) | 45.42–1.95 (2.02–1.95) |
| Rmergeb | 0.149 (0.992) | 0.115 (1.049) |
| Rpim | 0.056 (0.507) | 0.038 (0.396) |
| CC1/2, CC | (0.581, 0.857) | (0.836, 0.954) |
| ⟨I/σI⟩c | 12.7 (2.0) | 20.8 (2.8) |
| completeness (%) | 94.6 (80.7) | 99.9 (99.9) |
| redundancy | 6.9 (3.4) | 9.7 (7.8) |
| observed reflections | 651 718 | 554 092 |
| unique reflections | 94 094 (7940) | 57 332 (5656) |
| Bijvoet pairs (I+, I−) | 80 882 | 52 291 |
| refinement | ||
| resolution (Å) | 1.59 | 1.95 |
| no. of reflections | 93 834 | 57 287 |
| Rworkd/Rfreee | 0.184/0.193 | 0.178/0.193 |
| no. of atoms (two complexes per asymmetric unit) | ||
| protein | 4206 | 4292 |
| AdoHcy (or SAH) | 52 | 52 |
| EML741 (active site) | 76 | 76 |
| EML741 (nonspecific) | 76 | |
| Zn(II) | 8 | 8 |
| solvent | 651 | 464 |
| B factors (Å2) | ||
| protein | 22.5 | 38.6 |
| AdoHcy (or SAH) | 19.5 | 40.2 |
| EML741 (active site) | 26.0 | 45.5 |
| EML741 (nonspecific) | 65.7 | |
| Zn(II) | 18.4 | 29.1 |
| solvent | 36.1 | 44.8 |
| rms deviations | ||
| bond lengths (Å) | 0.011 | 0.009 |
| bond angles (deg) | 1.3 | 1.0 |
Values in parenthesis correspond to the highest-resolution shell.
Rmerge = Σ|I − ⟨I⟩|/ΣI, where I is the observed intensity and ⟨I⟩ is the averaged intensity from multiple observations.
⟨I/σI⟩ = averaged ratio of the intensity (I) to the error of the intensity (σI).
Rwork = Σ|Fobs − Fcal|/Σ|Fobs|, where Fobs and Fcal are the observed and calculated structure factors, respectively.
Rfree was calculated using a randomly chosen subset (5%) of the reflections not used in refinement.
As expected, compound 12a is bound to the acidic surface of the histone peptide-binding groove (Figure 11a). The pyrrolidine moiety is inserted into the target lysine-binding channel and the SAH sulfur atom, where the transferable methyl group would be attached on SAM, which can be seen at the bottom of the channel (Figure 11b). The cofactor and the inhibitor bind in two opposite binding sites (Figure 11c). The benzodiazepine scaffold is sandwiched via van der Waals interactions with Arg1214, Ile1218, and Leu1143 (Figure 11d). In addition, two negatively charged aspartates, Asp1140 and Asp1145, are involved, respectively, in direct hydrogen bonding with the secondary amino group at the 4-position and the protonated nitrogen of the N-isopropylpiperidine group (Figure 11e).
Figure 11.

Structure of GLP in complex with 12a (PDB IDs: 6MBO and 6MBP). (a) The inhibitor (in yellow stick model) binds in the acidic substrate histone peptide-binding groove of GLP surface (blue and red: positively and negatively charged surfaces, respectively). The arrows indicate the opposite directions of observation from (b) and (c). (b) The pyrrolidine moiety occupies the target lysine-binding channel. The SAH molecule can be seen at the bottom of the channel. (c) SAH (in green stick model) and 12a bind in two distinct pockets. (d) 12a involved in van der Waals interactions. (e) 12a involved in hydrogen-bonding interactions. (f) 12a is near Cys1155.
The negative charges of Asp1140 and Asp1145 are balanced by electrostatic interactions with positively charged Lys1219 and Arg1214, respectively (Figure 11d,e). The positively charged nitrogen of pyrrolidine moiety H-bonds with the backbone carbonyl oxygen of Leu1243 (Figure 11e). Interestingly, the cyclohexyl group is positioned near Val1153 and Cys1155 (Figure 11f), which could be explored for interaction with the cysteine-reactive electrophile acrylamide.
CONCLUSIONS
Over the last 10 years, a variety of efforts have been devoted to the improvement of quinazoline derivatives as G9a/GLP inhibitors, leading to the discovery of potent inhibitors like 7–9 (Chart 1). However, only a very limited number of literature reports have described the identification of inhibitors based on nonquinazoline structures.
Herein, we report the identification of a novel chemotype for G9a/GLP inhibitors, based on the underinvestigated 2-alkyl-5-amino- and 2-aryl-5-amino-substituted 3H-benzo[e][1,4]-diazepine scaffold. To the best of our knowledge, both this scaffold and the corresponding 3,4-dihydro-5H-benzo[e][1,4]-diazepin-5-one have been previously exploited in medicinal chemistry. Our efforts in the design, synthesis, biochemical evaluation, and structural characterization of the binding mode for a small series of benzodiazepine compounds resulted in the identification of compound 12a, which maintained the activity of its quinazoline counterpart 7 against G9a (IC50 = 23 ± 8 and 25 ± 6 nM, respectively) and inhibited DNMT1 with a potency nearly 2 orders of magnitude higher (IC50 = 3.10 and 107 μM, respectively). As compound 7 has been reported to suppress the G9a-induced EMT process that is dependent on restoring E-cadherin100 and since G9a and DNMT1 synergistically cooperate to the induction of EMT-mediated cellular migration and invasion in TNBC cells, it is possible that the phenotype of this cell line could be more significantly affected by compound 12a. Further studies in this regard are ongoing and will be described elsewhere.
In comparison to 7, compound 12a also exhibited an improved selectivity profile versus a panel of other epigenetic enzymes (KMT5A/SETD8, KDM4A/JMJD2A, PRMT1, PRMT3, KAT3B/p300). In fact, compound 12a showed no appreciable inhibition of the H4K20 monomethyltransferase SETD8 (2.5% inhibition at 10 μM and 21% at 25 μM), whereas compound 7 showed a ~50% inhibition even at the lowest tested concentration (49% inhibition at 10 μM and 71% at 25 μM; Figure 4). Compound 12a was found to be noncompetitive with the cofactor SAM (Ki = 3.6 ± 0.6 nM) and competitive with the H3 peptide substrate (Ki = 13.8 ± 1.7 nM) and exhibited high potency (both concentration- and time-dependent) at reducing the H3K9me2 mark, low cell toxicity, and good separation of functional potency and cell toxicity in three cell lines (human breast adenocarcinoma MCF-7 and MDA-MB-231 and human glioblastoma U-343). In addition, in comparison to compound 7, derivative 12a showed improved apparent permeability values in both PAMPA and PAMPA–BBB assays (Papp = 4.8 × 10⁻⁷ and 2.3 × 10⁻⁷ cm/s vs 0.49 × 10⁻⁷ and 0.19 × 10⁻⁷ cm/s) and good metabolic stability (percentage of the parent compound turnover of 2.25 ± 0.44% in human microsomes) and, therefore, might be suitable for central nervous system studies. Finally, co-crystal studies of 12a in complex with GLP confirmed the binding mode predicted by virtual docking studies and also provided useful suggestions for the further development of benzodiazepine-based G9a/GLP inhibitors. Since G9a and DNMT1 synergistically cooperate, it has been reported that the transcription factor Snail recruits both G9a and DNMT1 to the E-cadherin promoter for DNA methylation, leading to transcriptional silencing of E-cadherin, which is associated with the aberrant activation of epithelial–mesenchymal transition (EMT) and cellular migration and invasion in triple-negative breast cancer (TNBC) cells.
EXPERIMENTAL SECTION
Chemistry.
General Directions.
All chemicals were purchased from Sigma-Aldrich Srl (Milan, Italy) and were of the highest purity. All solvents were of reagent grade and, when necessary, were purified and dried by standard methods. All reactions requiring anhydrous conditions were conducted under a positive atmosphere of nitrogen in oven-dried glassware. Standard syringe techniques were used for anhydrous addition of liquids. Reactions were routinely monitored by thin-layer chromatography (TLC) performed on aluminum-backed silica gel plates (Merck DC, Alufolien Kieselgel 60 F254) with spots visualized by UV light (λ = 254, 365 nm) or using a KMnO4 alkaline solution. Solvents were removed using a rotary evaporator operating at a reduced pressure of ~10 Torr. Organic solutions were dried over anhydrous Na2SO4. Chromatographic purification was done on an automated flash chromatography system (Isolera Dalton 2000, Biotage) using cartridges packed with KP-SIL, 60 Å (40–63 μm particle size). All microwave-assisted reactions were conducted in a CEM Discover SP microwave synthesizer equipped with vertically focused IR temperature sensor.
Analytical high-performance liquid chromatography (HPLC) was performed on a Shimadzu SPD 20A UV/vis detector (λ = 220 and 254 nm) using C-18 column Phenomenex Synergi Fusion-RP 80A (75 × 4.60 mm2; 4 μm) at 25 °C using mobile phases A (water + 0.1% TFA) and B (acetonitrile (ACN) +0.1% TFA) at a flow rate of 1 mL/min. Preparative HPLC was performed using a Shimadzu Prominence LC-20AP with the UV detector set to 220 and 254 nm. Samples were injected onto a Phenomenex Synergi Fusion-RP 80A (150 × 21 mm2; 4 μm) C-18 column at room temperature. Mobile phases of A (water + 0.1% TFA) and B (ACN + 0.1% TFA) were used with a flowrate of20 mL/min.
1H spectra were recorded at 400 MHz on a Bruker Ascend 400 spectrometer, while 13C NMR spectra were obtained by distortionless enhancement by polarization transfer quaternary spectroscopy on the same spectrometer. Chemical shifts are reported in δ (ppm) relative to the internal reference tetramethylsilane. Low-resolution mass spectra were recorded on a Finnigan LCQ DECA TermoQuest mass spectrometer in electrospray positive and negative ionization modes (ESI-MS). High-resolution mass spectra were recorded on a Thermo Fisher Scientific Orbitrap XL mass spectrometer in electrospray positive ionization mode (ESI-MS). All tested compounds possessed a purity of at least 95% established by HPLC unless otherwise noted.
2-Cyclohexyl-N-(1-isopropylpiperidin-4-yl)-7-methoxy-8-(3-(pyrrolidin-1-yl)propoxy)-3H-benzo[e][1,4]diazepin-5-amine (12a).
A 10 mL CEM pressure vessel equipped with a stirrer bar was charged with compound 20a (60 mg, 0.14 mmol), 1-isopropylpiperidin-4-amine (398 mg, 2.8 mmol), and acetic acid (0.16 mL, 2.8 mmol). The microwave vial was sealed and heated to 120 °C for 1 h. The crude material was diluted with a mixture of ACN/H2O in 2:8 ratio and purified by reversed-phase high-performance liquid chromatography (RP-HPLC) to afford the TFA salt of 12a (37 mg, 30%). 1H NMR (400 MHz, D2O) δ 7.44 (s, 2H), 4.37 (t, J = 5.7 Hz, 2H), 4.20–4.11 (m, 1H), 4.05 (s, 3H), 3.85–3.74 (m, 2H), 3.64–3.54 (m, 3H), 3.50 (t, J = 7.5 Hz, 2H), 3.28–3.09 (m, 5H), 2.43–2.30 (m, 4H), 2.27–2.17 (m, 2H), 2.13–1.93 (m, 8H), 1.89–1.65 (m, 4H), 1.61–1.38 (m, 4H), 1.39–1.32 (m, 6H). 13C NMR (100 MHz, D2O) δ 151.80, 149.34, 147.90, 145.65, 132.11, 115.57, 101.58, 100.23, 66.70, 58.40, 56.18, 54.35, 52.71, 50.59, 47.77, 38.52, 30.54, 29.85, 25.75, 25.04, 24.95, 22.64, 16.08. HRMS (ESI): m/z [M + H]+ calcd for C31H49N5O2 + H+: 524.3959. Found: 524.3972.
N-(1-Isopropylpiperidin-4-yl)-7-methoxy-2-phenyl-8-(3-(pyrrolidin-1-yl)propoxy)-3H-benzo[e][1,4]diazepin-5-amine (12b).
The TFA salt of compound 12b was obtained as a yellow solid (43 mg, 31%) from derivative 20b (67 mg, 0.16 mmol) according to the procedure described for 12a. 1H NMR (400 MHz, D2O) δ 7.75–7.69 (m, 5H), 7.51 (s, 1H), 7.26 (s, 1H), 4.43–4.27 (m, 3H), 4.09 (s, 3H), 3.86–3.74 (m, 2H), 3.67–3.54 (m, 3H), 3.49 (t, J = 7.5 Hz, 2H), 3.29–3.09 (m, 4H), 2.48–2.32 (m, 4H), 2.31–2.13 (m, 4H), 2.12–1.98 (m, 4H), 1.37 (d, J = 6.7 Hz, 6H). 13C NMR (100 MHz, D2O) δ 152.24, 149.67, 145.60, 140.71, 132.33, 131.31, 130.17, 129.60, 129.08, 115.89, 101.53, 100.13, 66.77, 58.42, 56.25, 54.35, 52.71, 50.26, 47.78, 30.59, 24.96, 22.64, 16.10. HRMS (ESI): m/z [M + H]+ calcd for C31H43N5O2 + H+: 518.3490. Found: 518.3518.
2-Cydohexyl-N-(1-isopropylpiperidin-4-yl)-7-methoxy-8-(3-(pyrrolidin-1-yl)propoxy)-2,3-dihydro-1H-benzo[e][1,4]-diazepin-5-amine (13a).
The TFA salt of compound 13a was obtained as a yellow solid (47 mg, 30%) from derivative 24a (80 mg, 0.18 mmol) according to the procedure described for 12a. 1H NMR (400 MHz, D2O) δ 7.21 (s, 1H), 7.00 (s, 1H), 4.26 (t, J = 5.2 Hz, 2H), 4.06–3.95 (m, 1H), 3.91 (s, 3H), 3.85–3.70 (m, 3H), 3.69–3.50 (m, 5H), 3.44 (t, J = 7.6 Hz, 2h), 3.28–3.06 (m, 4H), 2.48–2.42 (m, 2H), 2.32–2.29 (m, 2H), 2.20–2.17 (m, 2H), 2.09–1.92 (m, 4H), 1.91 – 1.61 (m, 6H), 1.37 (d, J = 6.7 Hz, 6H), 1.31 – 1.01 (m, 5H). 13C NMR (100 MHz, D2O) δ 162.53, 152.90, 146.47, 134.88, 112.72, 111.43, 107.29, 70.38, 66.67, 58.65, 56.39, 54.32, 52.62, 47.81, 47.27, 47.22, 41.92, 39.38, 28.87, 28.49, 28.10, 28.04, 25.53, 25.37, 25.01, 22.62, 16.06. HRMS (ESI): m/z calculated for C31H51N5O2 + H+ [M + H]+: 526.4116. Found: 526.41115.
N-(1-Isopropylpiperidin-4-yl)-7-methoxy-2-phenyl-8-(3-(pyrrolidin-1-yl)propoxy)-2,3-dihydro-1H-benzo[e][1,4]-diazepin-5-amine (13b).
The TFA salt of compound 13b was obtained as a yellow solid (37 mg, 31%) from derivative 24b (62 mg, 0.14 mmol) according to the procedure described for 12a. 1H NMR (400 MHz, D2O) δ 7.50–7.33 (m, 5H), 7.10 (s, 1H), 6.64 (s, 1H), 5.14–5.06 (m, 1H), 4.23 (t, J = 5.0 Hz, 2H), 3.89 (s, 3H), 3.83–3.73 (m, 5H), 3.67–3.51 (m, 3H), 3.46 (t, J = 7.6 Hz, 2H), 3.22–2.99 (m, 4H), 2.47–2.38 (m, 1H), 2.34–2.27 (m, 2H), 2.26–2.12 (m, 2H), 2.13–1.96 (m, 4H), 1.93–1.76 (m, 1H), 1.35 (d, J = 6.7 Hz, 6H). 13C NMR (100 MHz, D2O) δ 163.44, 153.50, 143.35, 142.78, 141.32, 128.96, 128.26, 126.52, 112.82, 105.89, 104.74, 66.29, 66.11, 58.59, 56.42, 54.34, 52.68, 47.40, 47.36, 47.12, 46.69, 28.11, 28.01, 25.04, 22.63, 16.07. HRMS (ESI): m/z calculated for C31H45N5O2 + H+[M + H]+: 520.3646. Found: 520.3647.
4-Cyclohexyl-N-(1-isopropylpiperidin-4-yl)-8-methoxy-7-(3-(pyrrolidin-1-yl)propoxy)-3H-benzo[b][1,4]diazepin-2-amine (14).
To a solution of compound 31 (50 mg, 0.12 mmol), 1-isopropylpiperidin-4-amine (22 mg, 0.156 mmol), and triethylamine (67 μL, 0.48 mmol) in anhydrous THF (1 mL) was added mercury(II) chloride (36 mg, 0.13 mmol), and the resulting mixture was heated at reflux for 3 h. Then, the reaction mixture was filtered and the filtrate was evaporated under reduced pressure. The crude material was diluted with a mixture of ACN/H2O in 2:8 ratio and purified by reversed-phase high-performance liquid chromatography (RP-HPLC) to afford the TFA salt of 14 (34 mg, 33%). 1H NMR (400 MHz, D2O) δ 7.03 (s, 1H), 6.98 (s, 1H), 4.25 (t, J = 5.7 Hz,2H), 4.17–4.07 (m, 1H), 3.94 (s, 3H), 3.81–3.73 (m, 2H), 3.69–3.55 (m, 3H), 3.46 (t, J = 7.5 Hz, 2H), 3.28–3.12 (m, 4H), 2.69–2.56 (m, 1H), 2.48–2.36 (m, 2H), 2.33–2.15 (m, 4H), 2.10–1.72 (m, 10H), 1.51–1.41 (m, 4H), 1.38 (d, J = 6.6 Hz, 6H), 1.32–1.21 (m, 2H). 13C NMR (100 MHz, D2O) δ 170.55, 156.84, 147.19, 146.24, 133.62, 121.79, 110.33, 106.17, 66.56, 58.68, 56.16, 54.33, 52.80, 48.87, 47.99, 47.11, 29.12, 29.02, 27.85, 25.30, 25.09, 22.63, 16.06. HRMS (ESI): m/z [M + H]+ calcd for C31H49N5O2 + H+: 524.3959. Found: 524.3938.
2-Cyclohexyl-8-hydroxy-7-methoxy-3,4-dihydro-5H-benzo-[e][1,4]diazepin-5-one (17a).
3,4-Dihydro-5H-benzo[1,4]diazepin-5-one 16a86 (250 mg, 0.66 mmol) was dissolved in CH2Cl2/TFA (25 mL, 1:4 ratio). After stirring at 50 °C for 4 h, the reaction mixture was concentrated under reduced pressure and the residue was dissolved in EtOAc (20 mL), washed with NaHCO3 saturated solution (3 × 10 mL) and brine (20 mL), dried, filtered, and evaporated under reduced pressure to give the title compound (129 mg, 68%) asapale yellowsolid that was used for the next step without further purification. 1H NMR (400 MHz, dimethyl sulfoxide (DMSO)-d6) δ 9.76 (br s, 1H exchangeable with D2O), 8.14 (t, J = 5.5 Hz, 1H exchangeable with D2O), 7.24 (s, 1H), 6.58 (s, 1H), 3.79 (s, 3H), 3.37 (d, J = 5.6 Hz, 2H), 2.46–2.35 (m, 1H), 1.95–1.61 (m, 5H), 1.43–1.10 (m, 5H). ESI-MS: m/z 289 [M + H]+.
8-Hydroxy-7-methoxy-2-phenyl-3,4-dihydro-5H-benzo[e]-[1,4]diazepin-5-one (17b).
Compound 17b was obtained as a white solid (142 mg, 75%) starting from 3,4-dihydro-5H-benzo[1,4]diazepin-5-one 16b86 (250 mg, 0.67 mmol), following the procedure described for 17a. 1H NMR (400 MHz, DMSO-d6) δ 9.89 (br s, 1H exchangeable with D2O), 8.31 (t, J = 5.9 Hz, 1H exchangeable with D2O), 8.05–7.99 (m, 2H), 7.55–7.51 (m, 3H), 7.32 (s, 1H),6.76 (s, 1H), 3.92 (d, J = 5.9 Hz, 2H), 3.84 (s, 3H). ESI-MS: m/z 283 [M + H]+.
8-(3-Chloropropoxy)-2-cyclohexyl-7-methoxy-3,4-dihydro-5H-benzo[e][1,4]diazepin-5-one (18a).
Toa stirring suspension of compound 17a (50 mg, 0.17 mmol) and potassium carbonate (108 mg, 0.78 mmol) in anhydrous DMF (1 mL), 1-chloro-3-iodopropane (83 μL, 0.78 mmol) was added. The reaction mixture was stirred at room temperature under nitrogen atmosphere for 18 h. The mixture was then diluted with EtOAc (60 mL) and washed with NaHCO3 saturated solution (3 × 20 mL) and brine (30 mL), dried, filtered, and concentrated under reduced pressure. The crude was purified by silica gel chromatography (CH2Cl2/EtOAc), to give the desired product (44 mg, 71%) as a white solid. 1H NMR (400 MHz, DMSO-d6) δ 8.25 (t, J = 5.7 Hz, 1H exchangeable with D2O), 7.27 (s, 1H), 6.73 (s, 1H), 4.14 (t, J = 6.1 Hz, 2H), 3.82–3.75 (m, 5H), 3.40 (d, J = 5.7 Hz, 2H), 2.47–2.41 (m, 1H), 2.25–2.14 (m, 2H), 1.96–1.61 (m, 5H), 1.45–1.14 (m, 5H). ESI-MS: m/z (%) 365 (100) [M + H]+; 367 (32) [M + H + 2]+.
8-(3-Chloropropoxy)-7-methoxy-2-phenyl-3,4-dihydro-5H-benzo[e][1,4]diazepin-5-one (18b).
Compound 18b was obtained as a white solid (97 mg, 77%) starting from compound 17b (100 mg, 0.35 mmol), following the procedure described for 18a. 1H NMR (400 MHz, DMSO-d6) δ 8.40 (t, J = 5.8 Hz, 1H exchangeable with D2O), 8.08–8.01 (m, 2H), 7.57–7.51 (m, 3H), 7.35 (s, 1H), 6.94 (s, 1H), 4.20 (t, J = 6.1 Hz, 2H), 3.95 (d, J = 5.9 Hz, 2H), 3.85 (s, 3H), 3.80 (t, J = 6.5 Hz, 2H), 2.28–2.16 (m, 2H). ESI-MS: m/z (%) 359 (100) [M + H]+; 361 (32) [M + H + 2]+.
8-(3-Chloropropoxy)-2-cyclohexyl-5-ethoxy-7-methoxy-3H-benzo[e][1,4]diazepine (19a).
To an ice-cooled suspension of 18a (200 mg, 0.55 mmol) and sodium carbonate (58 mg, 0.55 mmol) in anhydrous CH2CH2 (4.2 mL), triethyloxonium tetrafluoroborate (209 mg, 1.10 mmol) was added. The reaction mixture was allowed to warm to room temperature and stirred for 15 min. The mixture was diluted with CH2CH2 (10 mL), and the organic phase was washed with brine (2 × 5 mL), dried, filtered, and concentrated in vacuo. The residue was purified by silica gel chromatography (n-Hex/EtOAc) to give the title compound as a pale yellow oil (151 mg, 70%). 1H NMR (400 MHz, DMSO-d6) δ 7.16 (s, 1H), 6.80 (s, 1H), 4.21–4.06 (m, 4H), 3.85–3.75 (m, 5H), 3.51 (br s, 2H), 2.47–2.40 (m, 1H), 2.28–2.11 (m, 2H), 2.01–1.58 (m, 5H), 1.45–1.14 (m, 8H). ESI-MS: m/z (%) 393 (100) [M + H]+; 395 (32) [M + H + 2]+.
8-(3-Chloropropoxy)-5-ethoxy-7-methoxy-2-phenyl-3H-benzo[e][1,4]diazepine (19b).
Compound 19b was obtained as a pale yellow oil (144 mg, 67%) starting from compound 18b (200 mg, 0.55 mmol), following the procedure described for 19a. 1H NMR (400 MHz, DMSO-d6) δ 8.12–8.02 (m, 2H), 7.56–7.48 (m, 3H), 7.24 (s, 1H), 7.00 (s, 1H), 4.26–4.10 (m, 4H), 4.04 (br s, 2H), 3.85 (s, 3H), 3.81 (t, J = 6.5 Hz, 2H), 2.29–2.16 (m, 2H), 1.27 (t, J = 7.0 Hz, 3H). ESI-MS: m/z (%) 387 (100) [M + H]+; 389 (32) [M + H + 2]+.
2-Cyclohexyl-5-ethoxy-7-methoxy-8-(3-(pyrrolidin-1-yl)-propoxy)-3H-benzo[e][1,4]diazepine (20a).
A 10 mL CEM pressure vessel equipped with a stirrer bar was charged with compound 19a (87 mg, 0.22 mmol), sodium iodide (34 mg, 0.22 mmol), potassium carbonate (47 mg, 0.34 mmol), pyrrolidine (0.18 mL, 2.20 mmol), and anhydrous THF (2.3 mL). The microwave vial was sealed and heated to 80 °C for 90 min. After cooling to room temperature, the reaction mixture was diluted with water (5 mL) and extracted with EtOAc (3 × 5 mL). The combined organic layers were washed with brine, dried, filtered, and concentrated in vacuo. The crude was purified by silica gel chromatography (CH2Cl2/MeOH/NH3) to afford the title compound as a brownish oil (69 mg, 74%). 1H NMR (400 MHz, DMSO-d6) δ 7.13 (s, 1H), 6.76 (s, 1H), 4.13 (q, J = 7.0 Hz, 2H), 4.07 (t, J = 6.5 Hz, 2H), 3.80 (s, 3H), 3.47 (br s, 2H), 2.46–2.31 (m, 5H), 1.98–1.61 (m, 11H), 1.44–1.15 (m, 8H). ESI-MS: m/z 428 [M + H]+.
5-Ethoxy-7-methoxy-2-phenyl-8-(3-(pyrrolidin-1-yl)-propoxy)-3H-benzo[e][1,4]diazepine (20b).
Compound 20b was obtained as a brownish oil (79 mg, 76%) starting from compound 19b (95 mg, 0.25 mmol), following the procedure described for 20a. 1H NMR (400 MHz, DMSO-d6) δ 8.13–8.05 (m, 2H), 7.58–7.48 (m, 3H), 7.24 (s, 1H), 6.98 (s, 1H), 4.21–4.10 (m, 4H), 4.03 (br s, 1H), 3.86 (s, 3H), 2.80–2.57 (m, 6H), 2.05–1.92 (m, 2H), 1.83–1.67 (m, 4H), 1.28 (t, J = 7.0 Hz, 4H). ESI-MS: m/z 422 [M + H]+.
2-Cyclohexyl-8-hydroxy-7-methoxy-1,2,3,4-tetrahydro-5H-benzo[e][1,4]diazepin-5-one (21a).
To a solution of 17a (600 mg, 2.8 mmol) in THF/MeOH (60 mL; 1:1 ratio) cooled at 0 °C, sodium borohydride was added portionwise until disappearance of the starting material (TLC analysis). The reaction mixture was concentrated under reduced pressure, taken up with water (40 mL), and extracted with CHCl3 (3 × 30 mL). The organic phase was dried, and the solvent was evaporated to give 21a as a white solid (543 mg, 90%). 1H NMR (400 MHz, DMSO-d6) δ 9.23 (br s, 1H exchangeable with D2O), 7.68 (t, J = 5.8 Hz, 1H exchangeable with D2O), 7.16 (s, 1H), 6.21 (s, 1H), 5.86 (d, J = 4.5 Hz, 1H exchangeable with D2O), 3.64 (s, 3H), 3.21–3.10 (m, 2H), 3.03–3.00 (m, 1H), 1.77–1.62 (m, 5h), 1.45–1.36 (m, 1H), 1.23–0.87 (m, 5H). ESI-MS: m/z 291 [M + H]+.
8-Hydroxy-7-methoxy-2-phenyl-1,2,3,4-tetrahydro-5H-benzo[e][1,4]diazepin-5-one (21b).
Compound 21b was obtained as a white solid (338 mg, 84%) starting from compound 17b (400 mg, 1.31 mmol), following the procedure described for 21a. 1H NMR (400 MHz, DMSO-d6) δ 9.37 (br s, 1H exchangeable with D2O), 7.66 (t, J = 5.7 Hz, 1H exchangeable with D2O), 7.37–7.26 (m, 5H), 7.15 (s, 1H), 6.35 (s, 1H), 5.75 (s, 1H exchangeable with D2O), 4.66 (t, J = 5.7 Hz, 1H), 3.69 (s, 3H), 3.37–3.33 (m, 2H). ESI-MS: m/z 285 [M + H]+.
8-(3-Chloropropoxy)-2-cyclohexyl-7-methoxy-1,2,3,4-tetrahydro-5H-benzo[e][1,4]diazepin-5-one (22a).
Compound 22a was obtained as a white solid (81 mg, 67%) from derivative 21a (100 mg, 0.34 mmol) according to the procedure described for 18a. 1H NMR (400 MHz, DMSO-d6) δ 7.76 (t, J = 5.3 Hz, 1H exchangeable with D2O), 7.19 (s, 1H), 6.44 (s, 1H), 6.00 (d, J = 4.5 Hz, 1H exchangeable with D2O), 4.01 (t, J = 6.2 Hz, 2H), 3.78 (t, J = 6.4 Hz, 2H), 3.64 (s, 3H), 3.27–3.11 (m, 2H), 3.10–3.02 (m, 1h), 2.25–2.13 (m, 2H), 1.89–1.55 (m, 5H), 1.50–1.36 (m, 1H), 1.27–0.83 (m, 5H). ESI-MS: m/z (%) 367 (100) [M + H]+; 369 (32) [M + H + 2]+.
8-(3-Chloropropoxy)-7-methoxy-2-phenyl-1,2,3,4-tetrahydro-5H-benzo[e][1,4]diazepin-5-one (22b).
Compound 22b was obtained as a pale yellow solid (117 mg, 77%) from derivative 21b (120 mg, 0.42 mmol) according to the procedure described for 18a. 1H NMR (400 MHz, DMSO-d6) δ 7.71 (t, J = 5.8 Hz, 1H exchangeable with D2O), 7.39–7.23 (m, 5H), 7.19 (s, 1H), 6.53 (s, 1H), 6.23 (d, J = 3.8 Hz, 1H, exchangeable with D2O), 4.73–4.60 (m, 1H), 4.09–3.99 (m, 2H), 3.79 (t, J = 6.4 Hz, 2H), 3.68 (s, 3H), 3.43–3.34 (m, 2H), 2.24–2.13 (m, 2H). ESI-MS: m/z (%) 361 (100) [M + H]+; 363 (32) [M + H + 2]+.
8-(3-Chloropropoxy)-2-cyclohexyl-5-(ethylthio)-7-methoxy-2.3-dihydro-1H-benzo[e][1,4]diazepine (23a).
To a suspension of compound 22a (100 mg, 0.27 mmol) in anhydrous toluene (5 mL), Lawesson’s reagent (168 mg, 0.42 mmol) was added. The reaction mixture was heated at 85 °C for 2 h. After cooling at room temperature, potassium carbonate (69 mg, 0.50 mmol) and iodoethane (0.43 mL, 5.40 mmol) were added and the reaction mixture was heated again to 85 °C for 2 h. The solvent was evaporated and the residue was partitioned between water (5 mL) and EtOAc (10 mL). The organic layer was washed with water (2 × 5 mL), 10% Na2S2O3 solution (3 × 5 mL), and brine (10 mL); dried; filtered; and concentrated under reduced pressure. The residue was purified by silica gel chromatography (CH2Cl2/MeOH) to give the desired product as a yellow solid (85 mg, 77%). 1H NMR (400 MHz, DMSO-d6) δ 6.97 (s, 1H), 6.55 (s, 1H), 5.84 (br s, 1H exchangeable with D2O), 4.02 (t, J = 6.1 Hz, 2H), 3.78 (t, J = 6.3 Hz, 2H), 3.69–3.55 (m, 5H), 3.05–2.79 (m, 2H), 2.30–2.11 (m, 2H), 1.98–1.52 (m, 6H), 1.44–0.91 (m, 9H). ESI-MS: m/z (%) 411 (100) [M + H]+; 413 (32) [M + H + 2]+.
8-(3-Chloropropoxy)-5-(ethylthio)-7-methoxy-2-phenyl-2.3-dihydro-1H-benzo[e][1,4]diazepine (23b).
Compound 23b was obtained as a yellow solid (81 mg, 72%) from derivative 22b (100 mg, 0.28 mmol) according to the procedure described for 23a. 1H NMR (400 MHz, DMSO-d6) δ 7.43–7.18 (m, 5H), 7.00 (s, 1H), 6.64 (s, 1H), 6.02 (br s, 1H exchangeable with D2O), 5.01–4.88 (m, 1H), 4.13–3.99 (m, 2H), 3.92–3.59 (m, 7H), 2.99–2.79 (m, 2H), 2.30–2.11 (m, 2H), 1.15 (t, J = 7.3 Hz, 3H). ESI-MS: m/z (%) 405 (100) [M + H]+; 407 (32) [M + H + 2]+.
2-Cyclohexyl-5-(ethylthio)-7-methoxy-8-(3-(pyrrolidin-1-yl)propoxy)-2,3-dihydro-1H-benzo[e][1,4]diazepine (24a).
Compound 24a was obtained as a yellow oil (58 mg, 67%) starting from compound 23a (80 mg, 0.20 mmol), following the procedure described for 20a. 1H NMR (400 MHz, DMSO-d6) δ 6.94 (s, 1H), 6.51 (s, 1H), 5.67 (d, J = 3.3 Hz, 1H exchangeable with D2O), 3.93 (t, J = 6.7 Hz, 2H), 3.78–3.53 (m, 5H), 3.42–3.35 (m, 2H), 3.27–3.19 (m, 1H), 3.02–2.77 (m, 2H), 2.45–2.34 (m, 4H), 2.05–1.56 (m, 11H), 1.400.81 (m, 9H). ESI-MS: m/z 446 [M + H]+.
5-(Ethylthio)-7-methoxy-2-phenyl-8-(3-(pyrrolidin-1-yl)-propoxy)-2,3-dihydro-1H-benzo[e][1,4]diazepine (24b).
Compound 24b was obtained as a yellow oil (63 mg, 65%) starting from compound 23b (90 mg, 0.22 mmol), following the procedure described for 20a. Yellow oil. 1H NMR (400 MHz, DMSO-d6) δ 7.43–7.18 (m, 5H), 6.98 (s, 1H), 6.60 (s, 1H), 5.87 (d, J = 2.6 Hz, 1H exchangeable with D2O), 4.93–4.85 (m, 1H), 4.08–3.89 (m, 2H), 3.86–3.72 (m, 4H), 3.69 (s, 3H), 2.97–2.78 (m, 2H), 2.46–2.38 (m, 4H), 1.98–1.83 (m, 2H), 1.71–1.64 (m,4H), 1.14 (t, J = 7.3 Hz, 3H). ESI-MS: m/z 440 [M + H]+.
4-(Benzyloxy)-5-methoxy-2-nitroaniline (25).
To a stirring suspension of 4-(benzyloxy)-5-methoxy-2-nitrobenzoic acid (15; 300 mg, 0.99 mmol) and potassium carbonate (273 mg, 1.98 mmol) in 4 mL of anhydrous DMF, DPPA (0.26 mL, 1.19 mmol) was added and the resulting mixture was heated at 80 °C. After 1 h, the reaction was cooled to room temperature, NaHCO3 saturated solution was added (20 mL), and the resulting mixture was extracted with EtOAc (3 × 10 mL). The combined organic layers were washed with NaHCO3 saturated solution (2 × 10 mL) and brine (10 mL), dried, filtered, and concentrated under reduced pressure. The residue was purified by silica gel chromatography (Hex/EtOAc) to give the desired product as an orange solid (225 mg, 83%). 1H NMR (400 MHz, DMSO-d6) δ 7.49–7.32 (m, 8H, 2H exchangeable with D2O), 6.54 (s, 1H), 5.03 (s, 2H), 3.83 (s, 3H). ESI-MS: m/z 275 [M + H]+.
N-(4-(Benzyloxy)-5-methoxy-2-nitrophenyl)-3-cyclohexyl-3-oxopropanamide (26).
A35 mL CEM pressure vessel equipped with a stirrer bar was charged with compound 25 (700 mg, 2.55 mmol) and a suspension of 5-(cyclohexanecarbonyl)-2,2-dimethyl-1,3-dioxane-4,6-dione (973 mg, 3.83 mmol) in toluene (10 mL). The reaction was heated at 100 °C for 1 h and then the solvent was evaporated under reduced pressure. The resulting mixture was recrystallized from ethanol yielding 26 as a yellow solid (935 mg, 86%). 1H NMR (400 MHz, DMSO-d6) δ 10.55 (s, 1H, exchangeable with D2O), 7.72 (s, 1H), 7.66 (s, 1H), 7.49–7.35 (m, 5H), 5.19 (s, 2H), 3.88 (s, 3H), 3.74 (s, 2H), 2.57–2.53 (m, 1H), 1.92–1.60 (m, 6H), 1.34–1.14 (m, 4H). ESI-MS: m/z 427 [M + H]+.
7-(Benzyloxy)-4-cyclohexyl-8-methoxy-1,3-dihydro-2H-benzo[b][1,4]diazepin-2-one (27).
A solution of 26 (853 mg, 2.00 mmol) in ethanol (8 mL) was added to a suspension of iron (II) sulfate heptahydrate (5.56 g, 20.00 mmol) in water (8 mL) and 32% ammonium hydroxide (0.80 mL). The reaction mixture was heated under reflux until the disappearance of the starting material (TLC analysis) while 32% ammonium hydroxide was dropped (8 mL). The hot mixture was then filtered, concentrated, and CHCl3 (100 mL) was added. The organic layer was washed with water (3 × 40 mL) and brine (100 mL), dried, and concentrated under reduced pressure. The residue was purified by silica gel chromatography (CH2Cl2/EtOAc), yielding 27 as a white solid (598 mg, 79%). 1H NMR (400 MHz, DMSO-d6) δ 10.09 (s, 1H, exchangeable with D2O), 7.46–7.30 (m, 5H), 6.83 (s, 1H), 6.69 (s, 1H), 5.08 (s, 2H), 3.75 (s, 3H), 2.99 (s, 2H), 2.45–2.38 (m, 1H), 1.93–1.61 (m, 5H), 1.39–1.14 (m, 5H). ESI-MS: m/z 379 [M + H]+.
4-Cyclohexyl-7-hydroxy-8-methoxy-1,3-dihydro-2H-benzo-[b][1,4]diazepin-2-one (28).
Compound 28 was obtained as a white solid (290 mg, 95%) starting from compound 27 (400 mg, 1.06 mmol), following the procedure described for 17a. 1H NMR (400 MHz, DMSO-d6) δ 10.01 (s, 1H, exchangeable with D2O), 9.11 (br s, 1H exchangeable with D2O), 6.62–6.61 (m, 2H), 3.74 (s, 3H), 2.99 (s, 2H), 2.46–2.38 (m, 1H), 1.90–1.62 (m,5H), 1.37–1.16 (m, 5H). ESI-MS: m/z 289 [M + H]+.
7-(3-Chloropropoxy)-4-cyclohexyl-8-methoxy-1,3-dihydro-2H-benzo[b][1,4]diazepin-2-one (29).
Compound 29 was obtained as a white solid (256 mg, 81%) starting from compound 28 (250 mg, 0.87 mmol), following the procedure described for 18a. 1H NMR (400 MHz, DMSO-d6) δ 10.09 (s, 1H, exchangeable with D2O), 6.77 (s, 1H), 6.68 (s, 1H), 4.08 (t, J = 6.0 Hz, 2H), 3.79 (t, J = 6.5 Hz, 2H), 3.75 (s, 3H), 3.00 (s, 2H), 2.48–2.38 (m, 1H), 2.24–2.10 (m, 2H), 1.951.62 (m, 5H), 1.42–1.08 (m, 5H). ESI-MS: m/z (%) 365 (100) [M + H]+; 367 (32) [M + H + 2]+.
4-Cyclohexyl-8-methoxy-7-(3-(pyrrolidin-1-yl)propoxy)-1,3-dihydro-2H-benzo[b][1,4]diazepin-2-one (30).
Compound 30 was obtained as a white solid (212 mg, 97%) starting from compound 29 (200 mg, 0.55 mmol), following the procedure described for 20a. 1H NMR (400 MHz, DMSO-d6) δ 10.07 (s, 1H, exchangeable with D2O), 6.73 (s, 1H), 6.66 (s, 1H), 3.99 (t, J = 6.5 Hz, 2H), 3.74 (s, 3H), 2.99 (s, 2H), 2.48–2.40 (m, 7H), 1.93–1.83 (m, 6H), 1.79–1.64 (m, 5H), 1.38–1.16 (m, 5H). ESI-MS: m/z (%) 400 (100) [M + H]+.
4-Cyclohexyl-8-methoxy-7-(3-(pyrrolidin-1-yl)propoxy)-1,3-dihydro-2H-benzo[b][1,4]diazepine-2-thione (31).
To a suspension of compound 30 (100 mg, 0.25 mmol) in anhydrous toluene (5 mL), Lawesson’s reagent (101 mg, 0.25 mmol) was added. The reaction mixture was heated at 85 °C for 3 h. After cooling at room temperature, EtOAc (10 mL) and HCl 1 N (10 mL) were added and the resulting mixture was stirred at room temperature for 10 min. The organic layer was extracted with HCl 1 N (2 × 10 mL) and the combined aqueous phases were made alkaline to pH 8 with solid NaHCO3 and then extracted with EtOAc (3 × 10 mL). The organic layer was washed with brine (10 mL), dried, and concentrated under reduced pressure. The residue was purified by silica gel chromatography (CH2Cl2/MeOH/NH3), yielding 31 as a pale yellow oil (68 mg, 65%). 1H NMR (400 MHz, DMSO-d6) δ 12.13 (s, 1H, exchangeable with D2O), 6.85 (s, 1H), 6.76 (s, 1H), 4.02 (t, J = 6.5 Hz, 2H), 3.76 (s, 3H), 3.46 (s, 2H), 2.49–2.39 (m, 7H), 1.99–1.84 (m, 6H), 1.78–1.67 (m, 5H), 1.4–41.17 (m, 5H). ESI-MS: m/z (%) 416 (100) [M + H]+.
Molecular Modeling Methods.
Due to its proven accuracy in correctly predicting binding poses,114,115 docking studies were performed employing AutoDock4.2 (AD4)88 and its graphical interface AutoDockTools (ADT). The available highest-resolution X-ray crystal structures in complex with a quinazoline inhibitor were selected for the calculations on both G9a (PDB code 5VSC, 1.4 Å)70 and GLP (PDB code 5VSF, 1.7 Å).70 The structures were prepared using the Protein Preparation Wizard in the Maestro suite,116 which assigns bond orders, adds hydrogen atoms, deletes water molecules, and generates appropriate protonation states. The cognate co-crystal ligands and the receptors were then separated for each PDB. Compounds 12–14 were then built using the two-dimensional-builder in the Maestro Suite. For each ligand, the correct protonation and tautomeric state were assigned through the other Maestro tool LigPrep. In the case of 13a and 13b, all of the different enantiomers were generated. The ligands and the receptor crystal structures were converted to the AD4-specific file format (PDBQT) using the python scripts prepare_receptor4.py and prepare_ligand4.py, part of ADT, applying the standard settings. The docking area was centered on the putative binding site. A set of grids of 60 Å × 60 Å × 60 Å with 0.375 Å spacing was calculated around the docking area for the ligand atom types using AutoGrid4. For each ligand, 200 separate docking calculations were performed. Each docking calculation consisted of 20 million energy evaluations using the Lamarckian genetic algorithm local search (GALS) method. The GALS method evaluates a population of possible docking solutions and propagates the most successful individuals from each generation into the subsequent generation of possible solutions. A low-frequency local search according to the method of Solis and Wets is applied to docking trials to ensure that the final solution represents a local minimum. All dockings were performed with a population size of 250, and 300 rounds of Solis and Wets local search were applied with a probability of 0.06. A mutation rate of 0.02 and a crossover rate of 0.8 were used to generate new docking trials for subsequent generations, and the best individual from each generation was propagated over the next generation. The docking results from each of the 200 calculations were clustered on the basis of root-mean-square deviation (rmsd) (solutions differing by less than 2.0 Å) between the Cartesian coordinates of the atoms and were ranked on the basis of free energy of binding (ΔGAD4). Finally, the poses with the lowest ΔGAD4 were selected.
Enzyme Activity Assays.
Methyltransferase activity assays were performed by taking advantage of AlphaLisa homogeneous proximity immunoassays developed by us by adapting the general conditions described on the PerkinElmer website (http://www.perkinelmer.com). The assays were performed in white opaque OptiPlate-384 (PerkinElmer, # 6007299) at room temperature (22 °C) in a final volume of 25 μL, using the proper assay buffer (see below). The compounds were dissolved in DMSO and diluted in assay buffer, keeping constant the concentration of DMSO (1%) in each well. In each assay, the 100% activity (positive control) was reached using vehicle (DMSO) while the 0% activity (negative control) was obtained without the protein. For each incubation step, the OptiPlate was sealed with protective foil to prevent evaporation and contamination.
G9a.
The assays were performed using the following buffer: 50 mM Tris–HCl pH 8.8, 50 mM NaCl, 1 mM dithiothreitol (DTT), 0.01% Tween-20. Briefly, 2.5 μL of human recombinant G9a (Active Motif, # 31327) (final concentration, 1 nM) was first incubated with 5 μL of each compound for 30 min; then, 2.5 μL of a mixture of histone H3 (121) peptide biotinylated (AnaSpec, # 61702) (final concentration, 100 nM) and SAM (Sigma, # A7007) (final concentration, 15 μM) was added. The reaction was incubated for 30 min, and then it was stopped by the addition in subdued light of 5 μL of anti-methyl-histone H3 lysine 9 (H3K9me2) AlphaLISA acceptor beads (PerkinElmer, # AL117) (final concentration, 20 μg/mL) diluted in epigenetic buffer (PerkinElmer, # AL008). After incubation for 60 min, 10 μL of streptavidin donor beads (PerkinElmer, # 6760002) diluted in epigenetic buffer was added in each well (final concentration, 20 μg/mL) in subdued light. After incubation in the dark for 30 min at room temperature, signals were read in ALPHA mode with a PerkinElmer EnSight II multimode plate reader (excitation at 680 nm and emission at 615 nm). The compounds were tested in 10-dose IC50 mode with twofold serial dilutions. Data were analyzed using Excel and GraphPad Prism software (version 6.0, GraphPad) for IC50 curve fits using log(inhibitor) versus response-variable slope (four parameters) equation. Values obtained for each compound are mean ± SD determined for three separate experiments.
GLP.
The assays were performed using the following buffer: 50 mM Tris–HCl pH 8.8, 50 mM NaCl, 1 mM DTT, 0.01% Tween-20. Briefly, 2.5 μL of human recombinant GLP (Active Motif, # 31520) (final concentration, 1 nM) was first incubated with 5 μL of each compound for 30 min; then, 2.5 μL of a mixture of histone H3 (1–21) peptide biotinylated (AnaSpec, # 61702) (final concentration 100 nM) and SAM (Sigma, # A7007) (final concentration, 15 μM) was added. The reaction was incubated for 30 min, and then it was stopped by the addition in subdued light of 5 μL of anti-methyl-histone H3 lysine 9 (H3K9me2) AlphaLISA acceptor beads (PerkinElmer, # AL117) (final concentration, 20 μg/mL) diluted in epigenetic buffer (PerkinElmer, # AL008). After incubation for 60 min, 10 μL of streptavidin donor beads (PerkinElmer, # 6760002) diluted in epigenetic buffer was added in each well (final concentration, 20 μg/mL) in subdued light. After incubation in the dark for 30 min at room temperature, signals were read in ALPHA mode with a PerkinElmer EnSight II multimode plate reader (excitation at 680 nm and emission at 615 nm). The compounds were tested at two different concentrations (10 and 25 μM). Data were analyzed using Excel software. Values obtained for each compound are mean ± SD determined for three separate experiments.
KMT5A/SETD8.
The assays were performed using the following buffer: Tris–HCl 50 mM pH 8.8, NaCl 50 mM, MgCl2 5 mM, DTT 1 mM, bovine serum albumin (BSA) 0.01%. Briefly, 2.5 μL of human recombinant SETD8 (expressed in house) (final concentration, 1 μM) was first incubated with 5 μL of each compound for 30 min; then, 2.5 μL of a mixture of histone H4 (Active Motif, # 31223) (final concentration, 150 nM) and SAM (Sigma, # A7007) (final concentration, 200 μM) was added. The reaction was incubated for 60 min, and then it was stopped by the addition of 5 μL of high salt buffer (50 mM Tris-HCl pH 7.4, 0.1% Tween-20, 1 M NaCl, 0.3% poly-l-lysine). After incubation for 15 min, 5 μL of a mixture of anti-methyl-histone H4 lysine 20 (H4K20me1) AlphaLISA acceptor beads (PerkinElmer, # AL145) (final concentration, 20 μg/mL) diluted in epigenetic buffer (PerkinElmer, # AL008) and the biotinylated anti-H4 antibody (PerkinElmer, # AL146) (final concentration, 1 nM) was added in each well in subdued light. After incubation for 60 min, 5 μL of streptavidin donor beads (PerkinElmer, # 6760002) diluted in epigenetic buffer was added in each well (final concentration, 20 μg/mL) in subdued light. After incubation in the dark for 30 min at room temperature, signals were read in ALPHA mode with a PerkinElmer EnSight II multimode plate reader (excitation at 680 nm and emission at 615 nm). The compounds were tested at two different concentrations (10 and 25 μM). Data were analyzed using Excel software. Values obtained for each compound are mean ± SD determined for three separate experiments.
KDM4A/JMJD2A.
The assays were performed using the following buffer: 50 mM N-(2-hydroxyethyl)piperazine-N′-ethanesulfonic acid (HEPES) pH 7.5, 0.01% Tween-20, 0.1% BSA. Briefly, 5 μL of human recombinant KDM4A (BPS BioScience, # 50123) (final concentration, 100 nM) was first incubated with 2.5 μL of a mix composed of ammonium iron(II) sulfate hexahydrate (Sigma, # 215406) (final concentration, 5 μM), sodium ascorbate (Sigma, # 11140) (final concentration, 100 μM), and the proper compound for 10 min; then, 2.5 μL of a mixture of H3 (1–21) lysine 9 trimethylated peptide biotinylated (H3K9me3) (AnaSpec, # 64360) (final concentration, 200 nM) and α-ketoglutaric acid potassium salt (2-oxoglutarate monopotassium salt; 2OG; Sigma, # K2000) (final concentration, 5 μM) was added. The reaction was incubated for 60 min, and then it was stopped by the addition in subdued light of 5 μL of anti-methyl-histone H3 lysine 9 (H3K9me2) AlphaLISA acceptor beads (PerkinElmer, # AL117) (final concentration, 20 μg/mL) diluted in epigenetic buffer (PerkinElmer, # AL008). After incubation for 60 min, 10 μL of streptavidin donor beads (PerkinElmer, # 6760002) diluted in epigenetic buffer was added in each well (final concentration, 20 μg/mL) in subdued light. After incubation in the dark for 30 min at room temperature, signals were read in ALPHA mode with a PerkinElmer EnSight II multimode plate reader (excitation at 680 nm and emission at 615 nm). The compounds were tested at two different concentrations (10 and 25 μM). Data were analyzed using Excel software. Values obtained for each compound are mean ± SD determined for three separate experiments.
PRMT1.
The assays were performed using the following buffer: 30 mM Tris–HCl pH 8.0, 1 mM DTT, 0.01% BSA, 0.01% Tween-20. Briefly, 3 μL of human recombinant PRMT1 (BPS BioScience, # 51041) (final concentration, 0.9 nM) was first incubated with 2.5 μL of each compound for 30 min; then, 4.5 μL of a mixture of histone H4 (1–21) peptide biotinylated (AnaSpec, # 62555) (final concentration, 100 nM) and SAM (Sigma, # A7007) (final concentration, 2 μM) was added. The reaction was incubated for 60 min, and then it was stopped by the addition in subdued light of 5 μL of anti-methyl-histone H4 arginine 3 (H4R3me) AlphaLISA acceptor beads (PerkinElmer, # AL150) (final concentration, 20 μg/mL) diluted in epigenetic buffer (PerkinElmer, # AL008). After incubation for 60 min, 10 μL of streptavidin donor beads (PerkinElmer, # 6760002) diluted in epigenetic buffer was added in each well (final concentration, 20 μg/mL) in subdued light. After incubation in the dark for 30 min at room temperature, signals were read in ALPHA mode with a PerkinElmer EnSight II multimode plate reader (excitation at 680 nm and emission at 615 nm). The compounds were tested at two different concentrations (10 and 25 μM). Data were analyzed using Excel software. Values obtained for each compound are mean ± SD determined for three separate experiments.
PRMT3.
The assays were performed using the following buffer: 30 mM Tris–HCl, pH 8.0 1 mM DTT, 0.01% BSA, 0.01% Tween-20. Briefly, 3 μL of human recombinant PRMT3 (BPS BioScience, # 51043) (final concentration, 23 nM) was first incubated with 2.5 μL of each compound for30 min; then, 4.5 μL of a mixture of histone H4 (1–21) peptide biotinylated (AnaSpec, # 62555) (final concentration, 50 nM) and SAM (Sigma, # A7007) (final concentration, 10 μM) was added. The reaction was incubated for 60 min, and then it was stopped by the addition in subdued light of 5 μL of anti-methyl-histone H4 arginine 3 (H4R3me) AlphaLISA acceptor beads (PerkinElmer, # AL150) (final concentration, 20 μg/mL) diluted in epigenetic buffer (PerkinElmer, # AL008). After incubation for 60 min, 10 μL of streptavidin donor beads (PerkinElmer, # 6760002) diluted in epigenetic buffer was added in each well (final concentration, 20 μg/mL) in subdued light. After incubation in the dark for 30 min at room temperature, signals were read in ALPHA mode with a PerkinElmer EnSight II multimode plate reader (excitation at 680 nm and emission at 615 nm). The compounds were tested at two different concentrations (10 and 25 μM). Data were analyzed using Excel software. Values obtained for each compound are mean ± SD determined for three separate experiments.
KAT3B/p300.
The assays were performed as previously described by us,111,117 using the following buffer: 50 mM Tris–HCl pH 8.0, 0.1 mM ethylenediaminetetraacetic acid (EDTA), 1 mM DTT, 0.01% Tween-20, 0.01% BSA, 330 nM trichostatin A. Briefly, 2.5 μL of human recombinant p300 (Merck, #03-188) (final concentration, 2.5 nM) was first incubated with 5 μL of each compound for 30 min; then, 2.5 μL of a mixture of histone H3 (1–21) peptide biotinylated (AnaSpec, # 61702) (final concentration, 50 nM) and acetyl CoA (Sigma, # A2056) (final concentration, 3 μM) was added. The reaction was incubated for 30 min, and then it was stopped by the addition in subdued light of 5 μL of a mix composed of 62 μM Garcinol (Sigma, # G5173) and anti-acetyl histone H3 lysine 9 (H3K9Ac) AlphaLISA acceptor beads (PerkinElmer, # AL114) (final concentration, 20 μg/mL) diluted in epigenetic buffer (PerkinElmer, # AL008). After incubation for 60 min, 10 μL of streptavidin donor beads (PerkinElmer, # 6760002) diluted in epigenetic buffer was added in each well (final concentration, 20 μg/mL) in subdued light. After incubation in the dark for 30 min at room temperature, signals were read in α mode with a PerkinElmer EnSight II multimode plate reader (excitation at 680 nm and emission at 615 nm). The compounds were tested at two different concentrations (10 and 25 μM). Data were analyzed using Excel software. Values obtained for each compound are mean ± SD determined for three separate experiments.
DNA Methyltransferase IC50 Profiling.
The effects of compound 12a on the catalytic activity of DNMT1, DNMT3a, and DNMT3b were determined with a HotSpot DNMT activity assay by Reaction Biology Corporation (Malvern, PA) according to the company’s standard operating procedure. Briefly, the full-length human recombinant DNMT1 (residues 2–1632, C-terminus; with an N-terminal GST-tag; molecular weight (MW) = 209 kDa; GenBank Accession # NM_001130823), human DNMT3a (residues 2–913, with N-terminal GST tag, MW = 128 kDa; GenBank Accession No. NM_175629), or full-length human recombinant DNMT3b (residues 2–853, C-terminus; N-terminal GST-tag; MW = 121.9 kDa; GenBank Accession # NM_006892) was added to a solution of the proper substrate (polydeoxy inosine-polydeoxy cytosine (poly(dI-dC)):poly(dI-dC) for DNMT1; lambda DNA, isolated from bacteriophage lambda, 48,502 base, for DNMT3a/b) in freshly prepared reaction buffer (for DNMT1: 50 mM Tris–HCl (pH 7.5), 50 mM NaCl, 5 mM EDTA, 5 mM DTT, 2.5% glycerol, 0.01% Brij35, 1% DMSO; for DNMT3: 50 mM Tris–HCl (pH 7.5), 50 mM NaCl, 5 mM EDTA, 5 mM DTT, 2.5% glycerol, 1% DMSO) and gently mixed. The proper solution of compound 12a in DMSO was delivered into the DNMT reaction mixture by using Acoustic Technology (Echo 550, LabCyte Inc., Sunnyvale, CA) and incubated for 20 min. Then, 3H-SAM was delivered into the reaction mixture to initiate the reaction. After incubation for 60 min at 30 °C, the reaction mixture was delivered to filter paper for detection (as assessed by scintillation). Data were analyzed using Excel and GraphPad Prism 6.0 software (GraphPad Software Inc., San Diego, CA) for IC50 curve fits using sigmoidal dose versus response-variable slope (four parameters) equations.
Direct Binding Measurement Assays.
G9a Protein Expression.
G9a plasmid was a gift from Cheryl Arrowsmith (Addgene plasmid # 25503)
G9a protein was expressed in Rosetta(DE3)pLysS in lysogeny broth in the presence of 50 μg/mL kanamycin. Cells were grown at 37 °C to OD600 of 0.8 and induced by isopropyl-1-thio-d-galactopyranoside (final concentration, 100 μM) and incubated overnight at 15 °C.
Cells harboring the expressed protein were pelleted at 5000g for 15 min at 4 °C, washed twice with PBS, and frozen at −80°C.
For protein purification, the pellet was thawed on ice, suspended in 40 mL of lysis buffer (phosphate buffer pH 7.4 20 mM, NaCl 200 mM, imidazole 30 mM), and supplemented with protease inhibitors cocktail. Cells were lysed using a sonicator (Vibra-Cells, Sonics) (amplitude 30%) for 20 min on ice, and cell debris were pelleted at 10 000g for 30 min at 4 °C.
The clarified lysate was filtered using a 0.45 μm syringe filter and loaded onto a 1 mL HisTrap HP column (GE Healthcare, # 17-5247-01) at the flow rate of 1 mL/min, previously conditioned with the binding buffer (phosphate buffer pH 7.4 20 mM, NaCl 200 mM, imidazole 30 mM).
The protein was eluted with linear gradient using the elution buffer (phosphate buffer pH 7.4 20 mM, NaCl 200 mM, imidazole 500 mM) in 20 column volumes.
Fractions containing the protein were confirmed by sodium dodecyl sulfate-polyacrilamide gel electrophoresis (SDS-PAGE), pooled, and dialyzed overnight at 4 °C to remove imidazole. Purification yield was 2.5 mg of the protein per 1 L of culture.
Microscale Thermophoresis (MST).
Fluorescence labeling of G9a was performed following the protocol for N-hydroxysuccinimide (NHS) coupling of the dye NT647 (NanoTemper Technologies, Munich, Germany) to lysine residues. Briefly, 100 μL of a 10 μM solution of G9a protein in labeling buffer (130 mM NaHCO3, 50 mM NaCl, pH 8.2) was mixed with 100 μL of 40 μM NT647-NHS fluorophore (NanoTemper Technologies) in labeling buffer and incubated for 30 min at room temperature (r.t.). Unbound fluorophores were removed by size-exclusion chromatography with PBS as running buffer. The concentration of the protein after labeling was determined using extinction coefficient ε280 = 41 130 M−1 cm−1 for G9a with a correction factor (Ccorr) of 0.027 at 280 nm.
For storage, NT647-G9a was frozen in 10 μL aliquots at −80 °C hironomus prior to MST experiments; the aliquots of NT647-G9a were thawed on ice and centrifuged for 15 min at 4 °C at 12 000g to remove protein aggregates.
Pretests using standard-treated and premium-coated MST capillaries (NanoTemper Technologies) were performed to test for adsorption of NT647-G9a to capillary walls by analyzing capillary scans recorded by the Monolith NT.115pico prior to MST experiments. G9a adsorbed to standard-treated capillary walls in assay buffer (Tris–HCl 50 mM pH 8.8, NaCl 50 mM, DTT 1 mM, 0.05% Tween-20), while it did not adsorb to premium-coated capillary walls in the same buffer. For this reason, the following experiments were performed using premium-coated capillaries.
The interactions of compounds 7 and 12a with NT647-G9a were performed on a Monolith NT.115pico instrument (NanoTemper Technologies). Compounds stock (10 mM) in DMSO were serially diluted in assay buffer, keeping constant the concentration of DMSO (1%). Each dilution was mixed 1:1 with a solution of 200 nM NT647-G9a to yield a final volume of 20 μL. The reaction mixtures were loaded into premium-coated capillaries and subsequently analyzed by MST at 40% and a light-emitting diode intensity of 20%.
KD values were calculated from compound concentration-dependent changes in normalized fluorescence (Fnorm) of G9a after 20 s of thermophoresis. Each compound was tested in duplicate samples, and data were analyzed using MO Affinity Analysis software (NanoTemper Technologies).
Surface Plasmon Resonance.
SPR analyses were performed on a Biacore 3000 optical biosensor equipped with research-grade CM5 sensor chips (BiacoreAB). Recombinant G9awas immobilized (30 μg/mL in 100 mM sodium acetate, pH 4.5) at a flow rate of 10 μL/min by using standard amine-coupling protocols to obtain densities of 16 kRU. One flow cell was left empty for background subtractions.
The compounds 7 and 12a were diluted in PBS supplemented with 0.005% Tween-20, keeping a final 0.5% DMSO concentration. Binding experiments were performed at 25 °C by using a flow rate of 30 μL/min, with 60 s monitoring of association and 100 s monitoring of dissociation. Regeneration of the surfaces was performed, when necessary, by a 10 s injection of 5 mM NaOH.
The simple 1:1 Langmuir binding fit model of the BIAevaluation software was used for determining equilibrium dissociation constants (KD) and kinetic dissociation (koff) and association (kon) constants by using eqs 1 and 2
| (1) |
where R represents the response unit, C is the concentration of the analyte, and
| (2) |
PAINS Analysis.
Compounds 12–14 were analyzed for known classes of assay interference compounds.91 All derivatives were not recognized as PAINS according to the SwissADME web tool (http://www.swissadme.ch),92 the Free ADME-Tox Filtering Tool (FAF-Drugs4) program (http://fafdrugs4.mti.univ-paris-diderot.fr/),93 and the “False Positive Remover” software (http://www.cbligand.org/PAINS/),94 neither as aggregators according to the software “Aggregator Advisor” (http://advisor.bkslab.org/).95
TruHits Assay.
The assay was performed in a volume of 25 μL in white 384-well OptiPlate. Streptavidin donor beads and biotinylated acceptor beads were diluted in assay buffer (50 mM Tris–HCl pH 8.8, 50 mM NaCl, 1 mM DTT, 0.01% Tween-20) to reach the final concentrations of 12.5 and 6.25 μg/mL, respectively. Equal volumes of donor and acceptor beads were premixed in a microcentrifuge tube and incubated for 30 min at room temperature in subdued light. The compounds (5 μL of 50 μM solution) were pipetted in the wells, and 20 of the premix was dispensed in each well. Buffer with the same amount of DMSO (1%) was used as control. The plate was covered with a TopSeal-A sealing film to prevent contamination and evaporation of the samples, and it was incubated at room temperature for 10 min in subdued light. Finally, the ALPHA signal was read using the EnSight multimode plate reader (excitation at 680 nm and emission at 615 nm).
Each compound was tested in triplicate and data were analyzed using Excel software. A signal lower than the average of control wells by more than two standard deviations indicates an interfering compound (color quencher, light scatter, or singlet oxygen quencher).
Mechanism of Action (MOA) Studies.
To explore the mechanism of G9a inhibition by 12a, we took advantage of the AlphaLISA G9a assay described above. To determine the pattern of inhibition of 12a, two different sets of kinetic experiments were performed, keeping one substrate constant and varying the other in the presence of three different concentrations of the compound 12a (0, 7.25, and 14.5 nM). In the first set of experiments, H3 peptide was tested at different concentrations (25, 37.5, 50, 100 nM) while keeping SAM constant at 15 μM; in the second set, SAM was tested at different concentrations (3.75, 7.5, 15, 30 μM) while keeping H3 peptide constant at 100 nM. Reactions were performed in duplicate, and Lineweaver–Burk plots of enzyme kinetics were performed to display the kind of inhibition.
In Vitro Drug Metabolism Using Liver Microsomes.
Ultra-high-performance liquid chromatography (UHPLC) analyses were performed on a Nexera UHPLC system (Shimadzu, Kyoto, Japan) consisting of a CBM-20A controller, two LC-30AD pumps, a DGU-20 A5R degasser, an SPD-M20A photo diode array detector, a CTO-20AC column oven, and an SIL-30AC autosampler.
The separation was carried out on a Kinetex C18 150 mm × 2.1 mm × 2.6 μm (100 Å) column (Phenomenex, Bologna, Italy). The optimal mobile phase consisted of 0.1% TFA/H2O v/v (A) and 0.1% TFA/ACN v/v (B). Analysis was performed in gradient elution as follows: 0–13.00 min, 5–65% B; 13–14.00 min, 65–95% B; 14–15.00 min, isocratic to 95% B; 15–15.01 min, 95–5% B; and 3 min for column reequilibration. The flow rate was 0.5 mL/min. The column oven temperature was set to 45 °C. The injection volume was 7 μL of sample. The following PDA parameters were applied: sampling rate, 12.5 Hz; detector time constant, 0.160 s; and cell temperature, 40 °C. Data acquisition was set in the range of 190–800 nm, and chromatograms were monitored at 254 nm.
The calibration curves were obtained in the concentration range of 10–0.6 μM with five concentration levels, and triplicate injections of each level were run. Peak areas were plotted against corresponding concentrations, and the linear regression was used to generate calibration curve with R2 values ≥0.999.
Briefly, 2 μL of each sample (1 mM) was incubated with 183 μL of 100 mM phosphate buffer (pH 7.4) and 5 μL of 20 mg/mL human microsomes (Thermo Fisher Scientific, Bremen, Germany). After preincubation in water bath for 5 min, the mixture was incubated with 10 μL of 20 mM reduced nicotinamide adenine dinucleotide phosphate (NADPH) at 37 °C for 60 min in a Thermomixer comfort (Eppendorf, Hamburg, Germany). The reaction was stopped by the addition of 200 μL of ice-cold methanol, and then samples were centrifuged at 10 000 rpm at 25 °C for 5 min (Eppendorf Microcentrifuge 5424, Hamburg, Germany). The supernatants were collected and injected in UHPLC.
The control at 0 min was obtained by addition of the organic solvent immediately after incubation with microsomes. Testosterone was used as the positive control, while the negative control was prepared by incubation up to 60 min without NADPH. The negative control is essential to detect problems such as nonspecific protein binding or heat instability.
The extent of metabolism is expressed as a percentage of the parent compound turnover using the following equation
| (3) |
Parallel Artificial Membrane Permeability Assay (PAMPA).
Donor solution (0.2 mM) was prepared by diluting 20 mM dimethyl sulfoxide (DMSO) compound stock solution using phosphate buffer (pH 7.4,0.01 M). Filters were coated with 5 μL of a 1% (w/v) dodecane solution of l-α-phosphatidylcholine for PAMPA or 2% (w/v) of BBB-specific lipid solution (Avanti Polar Lipids, 141101P) for PAMPA–BBB.
Donor solution (150 μL) was added to each well of the filter plate. To each well of the acceptor plate, 300 μL of solution (5% DMSO in phosphate buffer) was added. Compounds 12a, 7, propranolol, and furosemide were tested in triplicate. The sandwich was incubated for 24 h at room temperature under gentle shaking. After the incubation time, the sandwich plates were separated and 250 μL of the acceptor plate was transferred to a UV quartz microtiter plate and measured by UV spectroscopy, using a Multiskan GO microplate spectrophotometer (Thermo Fisher Scientific) at 250–500 nm at a step of 5 nm. Reference solutions (250 μL) were prepared diluting the sample stock solutions to the same concentration as that with no membrane barrier. The apparent permeability value Papp is determined from the ratio r of the absorbance of compound found in the acceptor chamber divided by the theoretical equilibrium absorbance (determined independently), the Faller118 modification of Sugano119 equation
| (4) |
In this equation, VR is the volume of the acceptor compartment (0.3 cm3), VD is the donor volume (0.15 cm3), A is the accessible filter area (0.24 cm2), and t is the incubation time in seconds.
Cell Viability Assay.
The MCF-7 and MDA-MB-231 cell lines were cultured in DMEM (Euroclone) supplemented with 10% (v/v) fetal bovine serum (Euroclone), 100 U/mL penicillin, and 100 U/mL streptomycin (Euroclone) at 37 °C in a 5% CO2 atmosphere. The U-343 cell line was cultured in MEM (Euroclone) supplemented with 10% (v/v) fetal bovine serum (Euroclone), 100 U/mL penicillin, 100 μ/mL streptomycin (Euroclone), 2 mM l-glutamine (Euroclone), 1 mM sodium pyruvate (Euroclone), and nonessential amino acids (Euroclone) at 37 °C in a 5% CO2 atmosphere.
Cell viabilities of MCF-7, MDA-MB-231, and U-343 cell lines were measured via a 3-(4,5-dimethylthiazol-2-yl)-2,5-diphenyltetrazolium bromide (MTT) assay. A total of 200 μL of cells seeded in 96-well microtiter plates (4 × 10⁴ cells/mL) were exposed for 24, 48, and 72 h to different concentrations of compounds 7 and 12a, ranging from 50 nM to 50 μM, in media containing 0.5% DMSO. The mitochondrial-dependent reduction of MTT to formazan was used to assess cell viability. Live cells reduce yellow MTT to purple formazan. The resulting formazan was solubilized in DMSO, and absorbance was measured at 550 nm and corrected for 620 nm background. Experiments were performed in quadruplicate and all values are expressed as the percentage of the control containing 0.5% DMSO.
Western Blot Analysis.
MCF-7, MDA-MB_231, and U-343 cells (10 mL, 4 × 10⁴ cells/mL) were seeded and incubated with 0.5 μM 7, 0.5 μM, and 5 μM 12a for 24, 48, and 72 h. After treatment, the cells were harvested, washed three times with PBS 1× (Euroclone), and then suspended in lysis buffer (10 mM Tris pH 8,1 mM KCl, 1.5 mM MgCR, and 1 mM DTT) supplemented with protease inhibitor cocktail (Sigma). All subsequent manipulations were performed at 4 °C. After incubation for 60 min on a rotator, nuclei were collected by centrifugation for 10 min at 10 000g. The nuclear pellets were suspended in 0.4 N H2SO4 and, after incubation for 2 h, were centrifuged for 15 min at 12 000g. Histones contained in the supernatant were precipitated adding trichloroacetate at a final concentration of 33% and incubating overnight at 4 °C. After centrifugation at 10 000g, for 30 min, histone pellets were washed twice with acetone, air-dried, and finally dissolved in 100 μL of water. Protein concentration was determined using the Bradford assay, and 2 μg of histones from each sample was loaded on 15% SDS-PAGE and transferred onto a nitrocellulose membrane. Primary antibodies used were: anti-histone H3 (dimethyl K9) (Abcam, # ab1220) and anti-histone H4 (Abcam, # ab31830).
Crystallography.
GLP SET domain protein was expressed and purified in the same manner as reported previously.19 SAH was added to purified GLP at an approximate 2:1 molar ratio before concentrated to ~40 mg/mLin 20 mMTris, pH 8.0, 400 mMNaCl, and 1% glycerol. Crystallization conditions were rescreened around our previous reported conditions19 at protein concentrations of 40, 20, and 10 mg/mL (at 2:1 molar ratio of compound vs GLP) using the sitting drop technique. Crystals appeared in conditions between pH 5.5 and 7.5 (100 mM citrate or HEPES buffer), 10–25% isopropanol, and 15–25% poly(ethylene glycol) (PEG) 4000. The crystals used for diffraction appeared with 15% PEG 4000, 20% isopropanol, and 100 mM citrate (pH 5.5) in drops where both crystal forms (P212121 and P3121) appeared with 20 mg/mL GLP. Crystals were mounted into nylon cryoloops (Hampton Research, Inc.) and frozen in liquid nitrogen after the addition of ~25% ethylene glycol to the mother liquor (supplemented with 0.25 mM compound 12a) as a cryoprotectant.
Diffraction data were collected at the SERCAT beamline APS-22ID at the Advanced Photon Source at Argonne National Laboratory and processed and merged with HKL2000120 (Table 2). The structures were determined by molecular replacement using the coordinates in PDB 3FPD. Repeated rounds of manual refitting and crystallographic refinement were performed using COOT121,122 and PHENIX.123,124
Supplementary Material
ACKNOWLEDGMENTS
G.S. was supported by grants from the Italian Ministero dell’Istruzione, delTUniversita e della Ricerca (MIUR), Progetti di Ricerca di Interesse Nazionale (PRIN 20152TE5PK), from the Universita di Salerno (Italy), and by European Cooperation in Science and Technology (COST Action CM1406). D.R was supported by an STSM Grant from the COST Action CM1406. X.C. and J.R.H. were supported by NIH grant GM114306 and Cancer Prevention Research Institute of Texas grant RR160029, which supported the use of the Southeast Regional Collaborative Access Team (SERCAT) synchrotron beamlines at the Advanced Photon Source of Argonne National Laboratory.
ABBREVIATIONS
- ACN
acetonitrile
- ALPHA
amplified luminescent proximity homogeneous assay
- DNMT
DNA methyltransferase
- DNMT1
DNA methyltransferase 1
- DNMT3a
DNA methyltransferase 3a
- DNMT3b
DNA methyltransferase 3b
- DPPA
diphenylphosphoryl azide
- ECSD
enzyme-coupled SAH detection
- GALS
Lamarckian genetic algorithm local search
- GLP
G9a-like protein 1
- H3K9me1
monomethylation of lysine 9 on histone H3
- H3K9me2
dimethylation of lysine 9 on histone H3
- HEPES
4-(2-hydroxyethyl)-1-piperazineethane-sulfonic acid
- KAT3B
lysine acetyltransferase 3B
- KDM4A
lysine demethylase 4A
- KMT1D
lysine methyltransferase 1D
- KMT5A
lysine methyltransferase 5A
- MST
microscale thermophoresis
- MTT
3-(4,5-dimethylthiazol-2-yl)-2,5-diphenyltetrazolium bromide
- MW
microwaves
- p300
E1A-associated protein of 300 kDa
- PAMPA–BBB
blood–brain barrier-specific parallel artificial membrane permeability assay
- Papp
apparent permeability
- PKMTs
protein lysine methyltransferases
- poly(dI-dC)
polydeoxy inosine–polydeoxy cytosine
- PRMT
protein arginine methyltransferase
- PRMT1
protein arginine methyltransferase 1
- PRMT3
protein arginine methyltransferase 3
- SAH
S-5′-adenosyl-l-homocysteine
- SAM
S-adenosyl-l-methionine
- SD
standard deviation
- SET
suppressor of variegation 3–9 enhancer-of-zeste trithorax
- SUV39H1
suppressor of variegation 3–9 homolog 1
Footnotes
Supporting Information
The Supporting Information is available free of charge on the ACS Publications website at DOI: 10.1021/acs.jmedchem.8b02008.
Additional kinetic assays, chemical stability of 12a, and copies of 1H NMR and 13C NMR spectra of all final compounds (PDF)
Molecular formula strings (CSV)
Accession Codes
The atomic coordinates and structure factors of GLP in complex with 12a in space group P212121 (PDB ID: 6MBO) and P3121 (PDB ID: 6MBP) have been deposited in the Protein Data Bank.
The authors declare no competing financial interest.
DEDICATION
This paper is dedicated with gratitude and regard to the memory of Prof. Marino Artico, who sadly passed away on Feb 09, 2018.
REFERENCES
- (1).Greer EL; Shi Y Histone methylation: a dynamic mark in health, disease and inheritance. Nat. Rev. Genet 2012, 13, 343–357. [DOI] [PMC free article] [PubMed] [Google Scholar]
- (2).Black JC; Van Rechem C; Whetstine JR Histone lysine methylation dynamics: establishment, regulation, and biological impact. Mol. Cell 2012, 48, 491–507. [DOI] [PMC free article] [PubMed] [Google Scholar]
- (3).Campos EI; Reinberg D Histones: annotating chromatin. Annu. Rev. Genet 2009, 43, 559–599. [DOI] [PubMed] [Google Scholar]
- (4).Esteller M Cancer epigenomics: DNA methylomes and histone-modification maps. Nat. Rev. Genet 2007, 8, 286–298. [DOI] [PubMed] [Google Scholar]
- (5).Jenuwein T; Allis CD Translating the histone code. Science 2001, 293, 1074–1080. [DOI] [PubMed] [Google Scholar]
- (6).Hamamoto R; Saloura V; Nakamura Y Critical roles of nonhistone protein lysine methylation in human tumorigenesis. Nat. Rev. Cancer 2015, 15, 110–124. [DOI] [PubMed] [Google Scholar]
- (7).Ko S; Ahn J; Song CS; Kim S; Knapczyk-Stwora K; Chatterjee B Lysine methylation and functional modulation of androgen receptor by Set9 methyltransferase. Mol. Endocrinol 2011, 25, 433–444. [DOI] [PMC free article] [PubMed] [Google Scholar]
- (8).Smith BC; Denu JM Chemical mechanisms of histone lysine and arginine modifications. Biochim. Biophys. Acta, Gene Regul. Mech 2009, 1789,45–57. [DOI] [PMC free article] [PubMed] [Google Scholar]
- (9).Martin C; Zhang Y The diverse functions of histone lysine methylation. Nat. Rev. Mol. Cell Biol 2005, 6, 838–849. [DOI] [PubMed] [Google Scholar]
- (10).Kaniskan HÜ; Jin J Chemical probes of histone lysine methyltransferases. ACS Chem. Biol 2015, 10, 40–50. [DOI] [PMC free article] [PubMed] [Google Scholar]
- (11).Kaniskan HÜ; Konze KD.; Jin J. Selective inhibitors of protein methyltransferases. J. Med. Chem 2015, 58, 1596–1629. [DOI] [PMC free article] [PubMed] [Google Scholar]
- (12).Benevento M; van de Molengraft M; van Westen R; van Bokhoven H; Kasri NN The role of chromatin repressive marks in cognition and disease: a focus on the repressive complex GLP/G9a. Neurobiol. Learn. Mem 2015, 124, 88–96. [DOI] [PubMed] [Google Scholar]
- (13).Mozzetta C; Pontis J; Ait-Si-Ali S Functional crosstalk between lysine methyltransferases on histone substrates: the case of G9a/GLP and Polycomb Repressive Complex 2. Antioxid. Redox Signaling 2015, 22, 1365–1381. [DOI] [PMC free article] [PubMed] [Google Scholar]
- (14).Mozzetta C; Boyarchuk E; Pontis J; Ait-Si-Ali S Sound of silence: the properties and functions of repressive Lys methyltransferases. Nat. Rev. Mol. Cell Biol 2015, 16, 499–513. [DOI] [PubMed] [Google Scholar]
- (15).Kouzarides T Chromatin Modifications and Their Function. Cell 2007, 128, 693–705. [DOI] [PubMed] [Google Scholar]
- (16).Bannister AJ; Kouzarides T Regulation of chromatin by histone modifications. Cell Res 2011, 21, 381–395. [DOI] [PMC free article] [PubMed] [Google Scholar]
- (17).Barski A; Cuddapah S; Cui K; Roh T-Y; Schones DE; Wang Z; Wei G; Chepelev I; Zhao K High-resolution profiling of histone methylations in the human genome. Cell 2007, 129, 823–837. [DOI] [PubMed] [Google Scholar]
- (18).Zhang Z; Pugh BF High-resolution genome-wide mapping of the primary structure of chromatin. Cell 2011, 144, 175–186. [DOI] [PMC free article] [PubMed] [Google Scholar]
- (19).Chang Y; Zhang X; Horton JR; Upadhyay AK; Spannhoff A ; Liu J; Snyder JP; Bedford MT; Cheng X Structural basis for G9a-like protein lysine methyltransferase inhibition by BIX-01294. Nat. Struct. Mol. Biol 2009, 16, 312–317. [DOI] [PMC free article] [PubMed] [Google Scholar]
- (20).Kubicek S; O’Sullivan RJ; August EM; Hickey ER; Zhang Q; Teodoro ML; Rea S; Mechtler K; Kowalski JA; Homon CA ; Kelly TA; Jenuwein T Reversal of H3K9me2 by a small-molecule inhibitor for the G9a histone methyltransferase. Mol. Cell 2007, 25, 473–481. [DOI] [PubMed] [Google Scholar]
- (21).Tachibana M; Sugimoto K; Nozaki M; Ueda J; Ohta T; Ohki M; Fukuda M; Takeda N; Niida H; Kato H; Shinkai Y G9a histone methyltransferase plays a dominant role in euchromatic histone H3 lysine 9 methylation and is essential for early embryogenesis. Genes Dev 2002, 16, 1779–1791. [DOI] [PMC free article] [PubMed] [Google Scholar]
- (22).Tachibana M; Ueda J; Fukuda M; Takeda N; Ohta T; Iwanari H; Sakihama T; Kodama T; Hamakubo T; Shinkai Y Histone methyltransferases G9a and GLP form heteromeric complexes and are both crucial for methylation of euchromatin at H3-K9. Genes Dev 2005, 19, 815–826. [DOI] [PMC free article] [PubMed] [Google Scholar]
- (23).Trojer P; Zhang J; Yonezawa M; Schmidt A; Zheng H; Jenuwein T; Reinberg D Dynamic histone H1 isotype 4 methylation and demethylation by histone lysine Methyltransferase G9a/KMT1C and the Jumonji Domain-containing JMJD2/KDM4 Proteins. J. Biol. Chem 2009, 284, 8395–8405. [DOI] [PMC free article] [PubMed] [Google Scholar]
- (24).Weiss T; Hergeth S; Zeissler U; Izzo A; Tropberger P; Zee BM; Dundr M; Garcia BA; Daujat S; Schneider R Histone H1 variant-specific lysine methylation by G9a/KMT1C and Glp1/KMT1D. Epigenet. Chromatin 2010, 3, 7. [DOI] [PMC free article] [PubMed] [Google Scholar]
- (25).Patnaik D; Chin HG; Estève P-O; Benner J;Jacobsen SE; Pradhan S Substrate specificity and kinetic mechanism of mammalian G9a histone H3 methyltransferase. J. Biol. Chem 2004, 279, 53248–53258. [DOI] [PubMed] [Google Scholar]
- (26).Tachibana M; Sugimoto K; Fukushima T; Shinkai Y SET domain-containing protein, G9a, is a novel lysine-preferring mammalian histone methyltransferase with hyperactivity and specific selectivity to lysines 9 and 27 of histone H3. J. Biol. Chem 2001, 276, 25309–25317. [DOI] [PubMed] [Google Scholar]
- (27).Wu H; Chen X; Xiong J; Li Y; Li H; Ding X; Liu S; Chen S; Gao S; Zhu B Histone methyltransferase G9a contributes to H3K27 methylation in vivo. Cell Res 2011, 21, 365–367. [DOI] [PMC free article] [PubMed] [Google Scholar]
- (28).Yu Y; Song C; Zhang Q; DiMaggio PA; Garcia BA; York A; Carey MF; Grunstein M Histone H3 lysine 56 methylation regulates DNA replication through its interaction with PCNA. Mol. Cell 2012, 46, 7–17. [DOI] [PMC free article] [PubMed] [Google Scholar]
- (29).Biggar KK; Li SSC Non-histone protein methylation as a regulator of cellular signalling and function. Nat. Rev. Mol. Cell Biol 2015, 16, 5–17. [DOI] [PubMed] [Google Scholar]
- (30).Huang J; Dorsey J; Chuikov S; Pérez-Burgos L; Zhang X; Jenuwein T; Reinberg D; Berger SL G9a and GLP methylate lysine 373 in the tumor suppressor p53. J. Biol. Chem 2010, 285, 18122. [DOI] [PMC free article] [PubMed] [Google Scholar]
- (31).Moore KE; Carlson SM; Camp ND; Cheung P;James RG ; Chua KF.; Wolf-Yadlin A; Gozani O. A General molecular affinity strategy for global detection and proteomic analysis of lysine methylation. Mol. Cell 2013, 50, 444–456. [DOI] [PMC free article] [PubMed] [Google Scholar]
- (32).Lee JS; Kim Y; Kim IS; Kim B; Choi HJ; Lee JM; Shin H-JR; Kim JH; Kim J-Y.; Seo S-B; Lee H; Binda O; Gozani O; Semenza GL; Kim M; Kim KI.; Hwang D; Baek SH. Negative Regulation of Hypoxic Responses via Induced Reptin Methylation. Mol. Cell 2010, 39, 71–85. [DOI] [PMC free article] [PubMed] [Google Scholar]
- (33).Zhang X; Peng D; Xi Y; Yuan C; Sagum CA; Klein BJ; Tanaka K; Wen H; Kutateladze TG; Li W; Bedford MT; Shi X G9a-mediated methylation of ERa links the PHF20/MOF histone acetyltransferase complex to hormonal gene expression. Nat. Commun 2016, 7, No. 10810. [DOI] [PMC free article] [PubMed] [Google Scholar]
- (34).Rathert P; Dhayalan A; Murakami M; Zhang X; Tamas R; Jurkowska R; Komatsu Y; Shinkai Y; Cheng X; Jeltsch A Protein lysine methyltransferase G9a acts on non-histone targets. Nat. Chem. Biol 2008, 4, 344–346. [DOI] [PMC free article] [PubMed] [Google Scholar]
- (35).Ling BMT; Bharathy N; Chung T-K; Kok WK; Li S; Tan YH; Rao VK; Gopinadhan S; Sartorelli V; Walsh MJ; Taneja R Lysine methyltransferase G9a methylates the transcription factor MyoD and regulates skeletal muscle differentiation. Proc. Natl. Acad. Sci. U.S.A 2012, 109, 841–846. [DOI] [PMC free article] [PubMed] [Google Scholar]
- (36).Sampath SC; Marazzi I; Yap KL; Sampath SC; Krutchinsky AN; Mecklenbrauker I; Viale A; Rudensky E; Zhou M-M; Chait BT; Tarakhovsky A Methylation of a histone mimic within the histone methyltransferase G9a regulates protein complex assembly. Mol. Cell 2007, 27, 596–608. [DOI] [PubMed] [Google Scholar]
- (37).Shinkai Y; Tachibana M H3K9 methyltransferase G9a and the related molecule GLP. Genes Dev 2011, 25, 781–788. [DOI] [PMC free article] [PubMed] [Google Scholar]
- (38).Tachibana M; Nozaki M; Takeda N; Shinkai Y Functional dynamics of H3K9 methylation during meiotic prophase progression. EMBO J 2007, 26, 3346–3359. [DOI] [PMC free article] [PubMed] [Google Scholar]
- (39).Kondo Y; Shen L; Suzuki S; Kurokawa T; Masuko K; Tanaka Y; Kato H; Mizuno Y; Yokoe M; Sugauchi F; Hirashima N ; Orito E; Osada H; Ueda R; Guo Y; Chen X; Issa J-PJ; Sekido Y Alterations of DNA methylation and histone modifications contribute to gene silencing in hepatocellular carcinomas. Hepatol. Res 2007, 37, 974–983. [DOI] [PubMed] [Google Scholar]
- (40).Watanabe H; Soejima K; Yasuda H; Kawada I; Nakachi I; Yoda S; Naoki K; Ishizaka A Deregulation of histone lysine methyltransferases contributes to oncogenic transformation of human bronchoepithelial cells. Cancer Cell Int 2008, 8, 15. [DOI] [PMC free article] [PubMed] [Google Scholar]
- (41).Kondo Y; Shen L; Ahmed S; Boumber Y; Sekido Y; Haddad BR; Issa J-PJ Downregulation of Histone H3 lysine 9 methyltransferase G9a induces centrosome disruption and chromosome instability in cancer cells. PLoS One 2008, 3, No. e2037. [DOI] [PMC free article] [PubMed] [Google Scholar]
- (42).Dobson THW; Hatcher RJ; Swaminathan J; Das CM; Shaik S; Tao R-H; Milite C; Castellano S; Taylor PH; Sbardella G; Gopalakrishnan V Regulation of USP37 expression by rest-associated G9a-dependent histone methylation. Mol. Cancer Res 2017, 15, 1073–1084. [DOI] [PMC free article] [PubMed] [Google Scholar]
- (43).Maze I; Covington HE; Dietz DM; LaPlant Q; Renthal W; Russo SJ; Mechanic M; Mouzon E; Neve RL; Haggarty SJ; Ren Y; Sampath SC; Hurd YL; Greengard P; Tarakhovsky A; Schaefer A; Nestler EJ Essential role of the histone methyltransferase G9a in cocaine-induced plasticity. Science 2010, 327, 213–216. [DOI] [PMC free article] [PubMed] [Google Scholar]
- (44).Schaefer A; Sampath SC; Intrator A; Min A; Gertler TS; Surmeier DJ; Tarakhovsky A; Greengard P Control of cognition and adaptive behavior by the GLP/G9a epigenetic suppressor complex. Neuron 2009, 64, 678–691. [DOI] [PMC free article] [PubMed] [Google Scholar]
- (45).Thomas LR; Miyashita H; Cobb RM; Pierce S; Tachibana M; Hobeika E; Reth M; Shinkai Y; Oltz EM Functional analysis of histone methyltransferase G9a in B and T lymphocytes. J. Immunol 2008, 181, 485–493. [DOI] [PMC free article] [PubMed] [Google Scholar]
- (46).Lehnertz B; Northrop JP; Antignano F; Burrows K; Hadidi S; Mullaly SC; Rossi FMV; Zaph C Activating and inhibitory functions for the histone lysine methyltransferase G9a in T helper cell differentiation and function. J. Exp. Med 2010, 207, 915–922. [DOI] [PMC free article] [PubMed] [Google Scholar]
- (47).Leung DC; Dong KB; Maksakova IA; Goyal P; Appanah R; Lee S; Tachibana M; Shinkai Y; Lehnertz B; Mager DL; Rossi F; Lorincz MC Lysine methyltransferase G9a is required for de novo DNA methylation and the establishment, but not the maintenance, of proviral silencing. Proc. Natl. Acad. Sci U.S.A 2011, 108, 5718–5723. [DOI] [PMC free article] [PubMed] [Google Scholar]
- (48).Kleefstra T; Smidt M; Banning MJG; Oudakker AR; Van Esch H; de Brouwer APM; Nillesen W; Sistermans EA; Hamel BCJ; de Bruijn D; Fryns J-P; Yntema HG; Brunner HG; de Vries BBA; van Bokhoven H Disruption of the gene Euchromatin Histone Methyl Transferase1 (Eu-HMTase1) is associated with the 9q34 subtelomeric deletion syndrome. J. Med. Genet 2005, 42, 299–306. [DOI] [PMC free article] [PubMed] [Google Scholar]
- (49).Antignano F; Zaph C Regulation of CD4 T-cell differentiation and inflammation byrepressive histone methylation. Immunol. Cell Biol 2015, 93, 245–252. [DOI] [PubMed] [Google Scholar]
- (50).Kramer JM Regulation of cell differentiation and function by the euchromatin histone methyltranserfases G9a and GLP. Biochem. Cell Biol 2016, 94,26–32. [DOI] [PubMed] [Google Scholar]
- (51).Liu N; Zhang Z; Wu H; Jiang Y; Meng L; Xiong J; Zhao Z; Zhou X; Li J; Li H; Zheng Y; Chen S; Cai T; Gao S; Zhu B Recognition of H3K9 methylation by GLP is required for efficient establishment of H3K9 methylation, rapid target gene repression, and mouse viability. Genes Dev 2015, 29, 379–393. [DOI] [PMC free article] [PubMed] [Google Scholar]
- (52).Battisti V; Pontis J; Boyarchuk E; Fritsch L; Robin P; Ait-Si-Ali S; Joliot V Unexpected distinct roles of the related histone H3 lysine 9 methyltransferases G9a and G9a-Like Protein in myoblasts. J. Mol. Biol 2016, 428, 2329–2343. [DOI] [PubMed] [Google Scholar]
- (53).Ohno H; Shinoda K; Ohyama K; Sharp LZ; Kajimura S EHMT1 controls brown adipose cell fate and thermogenesis through the PRDM16 complex. Nature 2013, 504, 163–167. [DOI] [PMC free article] [PubMed] [Google Scholar]
- (54).Liu F; Chen X; Allali-Hassani A; Quinn AM; Wasney GA; Dong A; Barsyte D; Kozieradzki I; Senisterra G; Chau I; Siarheyeva A; Kireev DB; Jadhav A; Herold JM; Frye SV; Arrowsmith CH; Brown PJ; Simeonov A; Vedadi M; Jin J Discovery of a 2,4-diamino-7-aminoalkoxyquinazoline as a potent and selective inhibitor of histone lysine methyltransferase G9a. J. Med. Chem 2009, 52, 7950–7953. [DOI] [PMC free article] [PubMed] [Google Scholar]
- (55).Liu F; Chen X; Allali-Hassani A; Quinn AM; Wigle TJ; Wasney GA; Dong A; Senisterra G; Chau I; Siarheyeva A; Norris JL; Kireev DB; Jadhav A; Herold JM; Janzen WP; Arrowsmith CH; Frye SV; Brown PJ; Simeonov A; Vedadi M; Jin J Protein lysine methyltransferase G9a inhibitors: design, synthesis, and structure activity relationships of 2,4-diamino-7-aminoalkoxy-quinazolines. J. Med. Chem 2010, 53, 5844–5857. [DOI] [PMC free article] [PubMed] [Google Scholar]
- (56).Chang Y; Ganesh T; Horton JR; Spannhoff A; Liu J; Sun A; Zhang X; Bedford MT; Shinkai Y; Snyder JP; Cheng X Adding a lysine mimic in the design of potent inhibitors of histone lysine methyltransferases. J. Mol. Biol 2010, 400, 1–7. [DOI] [PMC free article] [PubMed] [Google Scholar]
- (57).Liu F; Barsyte-Lovejoy D; Allali-Hassani A; He Y; Herold JM; Chen X; Yates CM; Frye SV; Brown PJ; Huang J; Vedadi M; Arrowsmith CH; Jin J Optimization of cellular activity of G9a inhibitors 7-aminoalkoxy-quinazolines. J. Med. Chem 2011, 54, 6139–6150. [DOI] [PMC free article] [PubMed] [Google Scholar]
- (58).Liu F; Barsyte-Lovejoy D; Li F; Xiong Y; Korboukh V; Huang X-P; Allali-Hassani A; Janzen WP; Roth BL; Frye SV; Arrowsmith CH; Brown PJ; Vedadi M; Jin J Discovery of an in vivo chemical probe of the lysine methyltransferases G9a and GLP. J. Med. Chem 2013, 56, 8931–8942. [DOI] [PMC free article] [PubMed] [Google Scholar]
- (59).Vedadi M; Barsyte-Lovejoy D; Liu F; Rival-Gervier S; Allali-Hassani A; Labrie V; Wigle TJ; DiMaggio PA; Wasney GA; Siarheyeva A; Dong A; Tempel W; Wang S-C; Chen X; Chau I; Mangano TJ; Huang X.-p.; Simpson CD.; Pattenden SG; Norris JL; Kireev DB; Tripathy A; Edwards A; Roth BL; Janzen WP.; Garcia BA.; Petronis A; Ellis J; Brown PJ; Frye SV; Arrowsmith CH.; Jin J A chemical probe selectively inhibits G9a and GLP methyltransferase activity in cells. Nat. Chem. Biol 2011, 7, 566–574. [DOI] [PMC free article] [PubMed] [Google Scholar]
- (60).Konze KD; Pattenden SG; Liu F; Barsyte-Lovejoy D; Li F; Simon JM; Davis IJ; Vedadi M; Jin J A chemical tool for in vitro and in vivo precipitation of lysine methyltransferase G9a. ChemMedChem 2014, 9, 549–553. [DOI] [PMC free article] [PubMed] [Google Scholar]
- (61).Sweis RF; Pliushchev M; Brown PJ; Guo J; Li F; Maag D ; Petros AM; Soni NB; Tse C; Vedadi M; Michaelides MR; Chiang GG; Pappano WN Discovery and development of potent and selective inhibitors of histone methyltransferase G9a. ACS Med. Chem. Lett 2014, 5, 205–209. [DOI] [PMC free article] [PubMed] [Google Scholar]
- (62).Yuan Y; Wang Q; Paulk J; Kubicek S; Kemp MM; Adams DJ; Shamji AF; Wagner BK; Schreiber SL A Small-molecule probe of the histone methyltransferase G9a induces cellular senescence in pancreatic adenocarcinoma. ACS Chem. Biol 2012, 7, 1152–1157. [DOI] [PMC free article] [PubMed] [Google Scholar]
- (63).Devkota K; Lohse B; Liu Q; Wang M-W; Stærk D; Berthelsen J; Clausen RP. Analogues of the natural product sinefungin as inhibitors of EHMT1 and EHMT2. ACS Med. Chem. Lett 2014, 5, 293–297. [DOI] [PMC free article] [PubMed] [Google Scholar]
- (64).Kondengaden SM; Luo L.-f.; Huang K; Zhu M; Zang L; Bataba E; Wang R; Luo C; Wang B; Li KK; Wang PG Discovery of novel small molecule inhibitors of lysine methyltransferase G9a and their mechanism in leukemia cell lines. Eur. J. Med. Chem 2016, 122, 382–393. [DOI] [PubMed] [Google Scholar]
- (65).Chen W-L; Wang Z-H; Feng T-T; Li D-D; Wang C-H; Xu X-L; Zhang X-J; You Q-D; Guo X-K. Discovery, design and synthesis of 6H-anthra[1,9-cd]isoxazol-6-one scaffold as G9a inhibitor through a combination of shape-based virtual screening and structure-based molecular modification. Bioorg. Med. Chem 2016, 24, 6102–6108. [DOI] [PubMed] [Google Scholar]
- (66).Lenstra DC; Al Temimi AHK; Mecinović J Inhibition of histone lysine methyltransferases G9a and GLP by ejection of structural Zn(ll). Bioorg. Med. Chem. Lett 2018, 28, 1234–1238. [DOI] [PubMed] [Google Scholar]
- (67).Soumyanarayanan U; Dymock BW Recently discovered EZH2 and EHMT2 (G9a) inhibitors. Future Med. Chem 2016, 8, 1635–1654. [DOI] [PubMed] [Google Scholar]
- (68).Sundriyal S; Chen PB; Lubin AS; Lueg GA; Li F; White AJP; Malmquist NA; Vedadi M; Scherf A; Fuchter MJ Histone lysine methyltransferase structure activity relationships that allow for segregation of G9a inhibition and anti-Plasmodium activity. MedChemComm 2017, 8, 1069–1092. [DOI] [PMC free article] [PubMed] [Google Scholar]
- (69).Xiong Y; Li F; Babault N; Dong A; Zeng H; Wu H; Chen X ; Arrowsmith CH; Brown PJ; Liu J; Vedadi M; Jin J Discovery of potent and selective inhibitors for G9a-Like Protein (GLP) lysine methyltransferase. J. Med. Chem 2017, 60, 1876–1891. [DOI] [PMC free article] [PubMed] [Google Scholar]
- (70).Xiong Y; Li F; Babault N; Wu H; Dong A; Zeng H; Chen X; Arrowsmith CH; Brown PJ; Liu J; Vedadi M; Jin J Structure-activity relationship studies of G9a-like protein (GLP) inhibitors. Bioorg. Med. Chem 2017, 25, 4414–4423. [DOI] [PMC free article] [PubMed] [Google Scholar]
- (71).Kaniskan HÜ; Martini ML; Jin J. Inhibitors of protein methyltransferases and demethylases. Chem. Rev 2018, 118, 9891068. [DOI] [PMC free article] [PubMed] [Google Scholar]
- (72).Liu Q; Cai X; Yang D; Chen Y; Wang Y; Shao L; Wang M-W Cycloalkane analogues of sinefungin as EHMT1/2 inhibitors. Bioorg. Med. Chem 2017, 25, 4579–4594. [DOI] [PubMed] [Google Scholar]
- (73).Regardless its similarity to sinefungine and SAM, derivative 1 was reported to be noncompetitive toward SAM. However, no further studies have been reported.
- (74).Kim Y; Lee H-M; Xiong Y; Sciaky N; Hulbert SW; Cao X; Everitt JI; Jin J; Roth BL; Jiang Y.-h. Targeting the histone methyltransferase G9a activates imprinted genes and improves survival of a mouse model of Prader–Willi syndrome. Nat. Med 2017, 23, 213222. [DOI] [PMC free article] [PubMed] [Google Scholar]
- (75).Pan MR; Hsu MC; Luo CW; Chen LT; Shan YS; Hung WC The histone methyltransferase G9a as a therapeutic target to override gemcitabine resistance in pancreatic cancer. Oncotarget 2016, 7, 61136–61151. [DOI] [PMC free article] [PubMed] [Google Scholar]
- (76).Chen RJ; Shun CT; Yen ML; Chou CH; Lin MC Methyltransferase G9a promotes cervical cancer angiogenesis and decreases patient survival. Oncotarget 2017, 8, 62081–62098. [DOI] [PMC free article] [PubMed] [Google Scholar]
- (77).Srimongkolpithak N; Sundriyal S; Li F; Vedadi M; Fuchter MJ Identification of 2,4-diamino-6,7-dimethoxyquinoline derivatives as G9a inhibitors. MedChemComm 2014, 5, 1821–1828. [DOI] [PMC free article] [PubMed] [Google Scholar]
- (78).Sun H; Tawa G; Wallqvist A Classification of scaffold-hopping approaches. Drug Discovery Today 2012, 17, 310–324. [DOI] [PMC free article] [PubMed] [Google Scholar]
- (79).Hu Y; Stumpfe D; Bajorath J Recent advances in scaffold hopping. J. Med. Chem 2017, 60, 1238–1246. [DOI] [PubMed] [Google Scholar]
- (80).Mai A; Cheng D; Bedford MT; Valente S; Nebbioso A; Perrone A; Brosch G; Sbardella G; De Bellis F; Miceli M; Altucci L Epigenetic multiple ligands: mixed histone/protein methyltransferase, acetyltransferase, and class III deacetylase (Sirtuin) inhibitors. J. Med. Chem 2008, 51, 2279–2290. [DOI] [PubMed] [Google Scholar]
- (81).Mai A; Valente S; Cheng DH; Perrone A; Ragno R; Simeoni S; Sbardella G; Brosch G; Nebbioso A; Conte M; Altucci L; Bedford MT Synthesis and biological validation of novel synthetic histone/protein methyltransferase inhibitors. ChemMedChem 2007, 2, 987–991. [DOI] [PubMed] [Google Scholar]
- (82).Milite C; Feoli A; Viviano M; Rescigno D; Cianciulli A; Balzano AL; Mai A; Castellano S; Sbardella G The emerging role of lysine methyltransferase SETD8 in human diseases. Clin. Epigenet 2016, 8, 106. [DOI] [PMC free article] [PubMed] [Google Scholar]
- (83).Milite C; Feoli A; Viviano M; Rescigno D; Mai A; Castellano S; Sbardella G Progress in the Development of Lysine Methyltransferase SETD8 Inhibitors. ChemMedChem 2016, 11, 1680–1685. [DOI] [PubMed] [Google Scholar]
- (84).Valente S; Lepore I; Dell’Aversana C; Tardugno M; Castellano S; Sbardella G; Tomassi S; Di Maro S; Novellino E; Di Santo R; Costi R; Altucci L; Mai A Identification of PR-SET7 and EZH2 selective inhibitors inducing cell death in human leukemia U937 cells. Biochimie 2012, 94, 2308–2313. [DOI] [PubMed] [Google Scholar]
- (85).Horton DA; Bourne GT; Smythe ML The Combinatorial Synthesis of Bicyclic Privileged Structures or Privileged Substructures. Chem. Rev 2003, 103, 893–930. [DOI] [PubMed] [Google Scholar]
- (86).Viviano M; Milite C; Rescigno D; Castellano S; Sbardella G A continuous-flow synthesis of 1,4-benzodiazepin-5-ones, privileged scaffolds for drug discovery. RSC Adv 2015, 5, 1268–1273. [Google Scholar]
- (87).The PyMOL Molecular Graphics System, version 2.2; Schrödinger LLC, 2015. [Google Scholar]
- (88).Morris GM; Huey R; Lindstrom W; Sanner MF; Belew RK; Goodsell DS; Olson AJ AutoDock4 and AutoDockTools4: Automated docking with selective receptor flexibility. J. Comput. Chem 2009, 30, 2785–2791. [DOI] [PMC free article] [PubMed] [Google Scholar]
- (89).Quinn AM; Allali-Hassani A; Vedadi M; Simeonov A A chemiluminescence-based method for identification of histone lysine methyltransferase inhibitors. Mol. BioSyst 2010, 6, 782–788. [DOI] [PMC free article] [PubMed] [Google Scholar]
- (90).Shoichet BK Interpreting Steep Dose-Response Curves in Early Inhibitor Discovery. J. Med. Chem 2006, 49, 7274–7277. [DOI] [PubMed] [Google Scholar]
- (91).Aldrich C; Bertozzi C; Georg GI; Kiessling L; Lindsley C; Liotta D; Merz KM; Schepartz A; Wang S The ecstasy and agony of assay interference compounds. J. Med. Chem 2017, 60, 2165–2168. [DOI] [PubMed] [Google Scholar]
- (92).Daina A; Michielin O; Zoete V SwissADME: a free web tool to evaluate pharmacokinetics, drug-likeness and medicinal chemistry friendliness of small molecules. Sci. Rep 2017, 7, No. 42717. [DOI] [PMC free article] [PubMed] [Google Scholar]
- (93).Lagorce D; Sperandio O; Baell JB; Miteva MA; Villoutreix BO FAF-Drugs3: a web server for compound property calculation and chemical library design. Nucleic Acids Res 2015, 43, W200–W207. [DOI] [PMC free article] [PubMed] [Google Scholar]
- (94).Baell JB; Holloway GA New substructure filters for removal of pan assayinterference compounds (PAINS) from screening libraries and for their exclusion in bioassays. J. Med. Chem 2010, 53, 27192740. [DOI] [PubMed] [Google Scholar]
- (95).Irwin JJ; Duan D; Torosyan H; Doak AK; Ziebart KT; Sterling T; Tumanian G; Shoichet BK An aggregation advisor for ligand discovery. J. Med. Chem 2015, 58, 7076–7087. [DOI] [PMC free article] [PubMed] [Google Scholar]
- (96).Wu H; Min J; Lunin VV; Antoshenko T; Dombrovski L; Zeng H; Allali-Hassani A; Campagna-Slater V; Vedadi M; Arrowsmith CH; Plotnikov AN; Schapira M Structural biology of human H3K9 methyltransferases. PLoS One 2010, 5, No. e8570. [DOI] [PMC free article] [PubMed] [Google Scholar]
- (97).Estève P-O; Chin HG; Smallwood A; Feehery GR; Gangisetty O; Karpf AR; Carey MF; Pradhan S Direct interaction between DNMT1 and G9a coordinates DNA and histone methylation during replication. Genes Dev 2006, 20, 3089–3103. [DOI] [PMC free article] [PubMed] [Google Scholar]
- (98).Tachibana M; Matsumura Y; Fukuda M; Kimura H; Shinkai Y G9a/GLP complexes independently mediate H3K9 and DNA methylation to silence transcription. EMBO J 2008, 27, 2681–2690. [DOI] [PMC free article] [PubMed] [Google Scholar]
- (99).Wozniak RJ; Klimecki WT; Lau SS; Feinstein Y; Futscher BW 5-Aza-2′-deoxycytidine-mediated reductions in G9A histone methyltransferase and histone H3 K9 di-methylation levels are linked to tumor suppressor gene reactivation. Oncogene 2007, 26, 77–90. [DOI] [PubMed] [Google Scholar]
- (100).Liu X-R; Zhou L-H; Hu J-X; Liu L-M; Wan H-P; Zhang X-Q UNC0638, a G9a inhibitor, suppresses epithelial-mesenchymal transition-mediated cellular migration and invasion in triple negative breast cancer. Mol. Med. Rep 2018, 17, 2239–2244. [DOI] [PMC free article] [PubMed] [Google Scholar]
- (101).José-Enériz ES; Agirre X; Rabal O; Vilas-Zornoza A; Sanchez-Arias JA; Miranda E; Ugarte A; Roa S; Paiva B; Estella-Hermoso de Mendoza A; Alvarez RM; Casares N; Segura V; Martín-Subero JI; Ogi F-X; Soule P; Santiveri CM; Campos-Olivas R; Castellano G; de Barrena MGF.; Rodriguez-Madoz JR.; García-Barchino MJ.; Lasarte JJ; Avila MA.; Martinez-Climent JA.; Oyarzabal J; Prosper F. Discovery of first-in-class reversible dual small molecule inhibitors against G9a and DNMTs in hematological malignancies. Nat. Commun 2017, 8, No. 15424. [DOI] [PMC free article] [PubMed] [Google Scholar]
- (102).Sharma S; Gerke DS; Han HF; Jeong S; Stallcup MR; Jones PA; Liang G Lysine methyltransferase G9a is not required for DNMT3A/3B anchoring to methylated nucleosomes and maintenance of DNA methylation in somatic cells. Epigenet. Chromatin 2012, 5, 3. [DOI] [PMC free article] [PubMed] [Google Scholar]
- (103).Erdmann A; Halby L; Fahy J; Arimondo PB Targeting DNA methylation with small molecules: what’s next? J. Med. Chem 2015, 58, 2569–2583. [DOI] [PubMed] [Google Scholar]
- (104).Gros C; Fahy J; Halby L; Dufau I; Erdmann A; Gregoire J-M; Ausseil F; Vispé S; Arimondo PB DNA methylation inhibitors in cancer: Recent and future approaches. Biochimie 2012, 94, 2280–2296. [DOI] [PubMed] [Google Scholar]
- (105).You JS; Jones PA Cancer genetics and epigenetics: two sides of the same coin? Cancer Cell 2012, 22, 9–20. [DOI] [PMC free article] [PubMed] [Google Scholar]
- (106).Brooks HB; Geeganage S; Kahl SD et al. Basics of Enzymatic Assays for HTS 2012 May 1 [Updated 2012 Oct 1] In Assay Guidance Manual [Internet]; Sittampalam GS, Coussens NP, Brimacombe K et al. , Eds.; Eli Lilly & Company and the National Center for Advancing Translational Sciences: Bethesda, MD, 2004. Available from https://www.ncbi.nlm.nih.gov/books/NBK92007/. [PubMed] [Google Scholar]
- (107).Copeland RA Enzymes: A Practical Introduction to Structure, Mechanism, and Data Analysis, 2nd ed.; Wiley-VCH, 2000. [Google Scholar]
- (108).Copeland RA Reversible Modes of Inhibitor Interactions with Enzymes In Evaluation of Enzyme Inhibitors in Drug Discovery: A Guide for Medicinal Chemists and Pharmacologists, 2nd ed.; Copeland RA., Ed.; John Wiley & Sons, Inc., 2013; pp 57–121. [Google Scholar]
- (109).Dreassi E; Zizzari AT; Falchi F; Schenone S; Santucci A; Maga G; Botta M Determination of permeability and lipophilicity of pyrazolo-pyrimidine tyrosine kinase inhibitors and correlation with biological data. Eur. J. Med. Chem 2009, 44, 3712–3717. [DOI] [PubMed] [Google Scholar]
- (110).Kansy M; Senner F; Gubernator K Physicochemical high throughput screening: parallel artificial membrane permeation assay in the description of passive absorption processes. J. Med. Chem 1998, 41, 1007–1010. [DOI] [PubMed] [Google Scholar]
- (111).Milite C; Feoli A; Sasaki K; La Pietra V; Balzano AL; Marinelli L; Mai A; Novellino E; Castellano S; Tosco A; Sbardella G A novel cell-permeable, selective, and noncompetitive inhibitor of KAT3 histone acetyltransferases from a combined molecular pruning/classical isosterism approach. J. Med. Chem 2015, 58, 2779–2798. [DOI] [PubMed] [Google Scholar]
- (112).Könczöl Á; Müller J; Földes E; Béni Z; Végh K; Kéry Á; Balogh GT Applicability of a blood–brain barrier specific artificial membrane permeability assay at the early stage of natural product-based CNS drug discovery. J. Nat. Prod 2013, 76, 655–663. [DOI] [PubMed] [Google Scholar]
- (113).Miele E; Valente S; Alfano V; Silvano M; Mellini P; Borovika D; Marrocco B; Po A; Besharat ZM; Catanzaro G; Battaglia G; Abballe L; Zwergel C; Stazi G; Milite C; Castellano S; Tafani M; Trapencieris P; Mai A; Ferretti E The histone methyltransferase EZH2 as a draggable target in SHH medulloblastoma cancer stem cells. Oncotarget 2017, 8, 68557–68570. [DOI] [PMC free article] [PubMed] [Google Scholar]
- (114).Cosconati S; Forli S; Perryman AL; Harris R; Goodsell DS ; Olson AJ Virtual screening with AutoDock: theory and practice. Expert Opin. Drug Discovery 2010, 5, 597–607. [DOI] [PMC free article] [PubMed] [Google Scholar]
- (115).Cosconati S; Hong JA; Novellino E; Carroll KS; Goodsell DS; Olson AJ Structure-based virtual screening and biological evaluation of mycobacterium tuberculosis adenosine 5′-phosphosulfate reductase inhibitors. J. Med. Chem 2008, 51, 6627–6630. [DOI] [PMC free article] [PubMed] [Google Scholar]
- (116).Schrödinger Release 2017–2: Maestro; Schrödinger, 2017. [Google Scholar]
- (117).Castellano S; Milite C; Feoli A; Viviano M; Mai A; Novellino E; Tosco A; Sbardella G Identification of structural features of 2-alkylidene-1,3-dicarbonyl derivatives that induce inhibition and/or activation of histone acetyltransferases KAT3B/p300 and KAT2B/PCAF. ChemMedChem 2015, 10, 144–157. [DOI] [PubMed] [Google Scholar]
- (118).Wohnsland F; Faller B High-throughput permeability pH profile and high-throughput alkane/water log P with artificial membranes. J. Med. Chem 2001, 44, 923–930. [DOI] [PubMed] [Google Scholar]
- (119).Sugano K; Hamada H; Machida M; Ushio H High throughput prediction of oral absorption: improvement of the composition of the lipid solution used in parallel artificial membrane permeation assay. J. Biomol. Screening 2001, 6, 189–196. [DOI] [PubMed] [Google Scholar]
- (120).Otwinowski Z; Borek D; Majewski W; Minor W Multiparametric scaling of diffraction intensities. Acta Crystallogr., Sect. A: Found. Crystallogr 2003, 59, 228–234. [DOI] [PubMed] [Google Scholar]
- (121).Emsley P; Lohkamp B; Scott WG; Cowtan K Features and development of Coot. Acta Crystallogr., Sect. D: Biol. Crystallogr 2010, 66,486–501. [DOI] [PMC free article] [PubMed] [Google Scholar]
- (122).Emsley P; Cowtan K Coot: model-building tools for molecular graphics. Acta Crystallogr., Sect. D: Biol. Crystallogr 2004, 60, 2126–2132. [DOI] [PubMed] [Google Scholar]
- (123).Adams PD; Grosse-Kunstleve RW; Hung L-W; Ioerger TR; McCoy AJ; Moriarty NW; Read RJ; Sacchettini JC; Sauter NK; Terwilliger TC PHENIX: building new software for automated crystallographic structure determination. Acta Crystallogr., Sect. D: Biol. Crystallogr 2002, 58, 1948–1954. [DOI] [PubMed] [Google Scholar]
- (124).Adams PD; Afonine PV; Bunkóczi G; Chen VB; Davis IW; Echols N; Headd JJ; Hung L-W; Kapral GJ; Grosse-Kunstleve RW; McCoy AJ; Moriarty NW; Oeffner R; Read RJ; Richardson DC; Richardson JS; Terwilliger TC; Zwart PH PHENIX: a comprehensive Python-based system for macromolecular structure solution. Acta Crystallogr., Sect. D: Biol. Crystallogr 2010, 66, 213–221. [DOI] [PMC free article] [PubMed] [Google Scholar]
Associated Data
This section collects any data citations, data availability statements, or supplementary materials included in this article.